Removal of Mn, Fe, Ni and Cu Ions from Wastewater Using Cow Bone Charcoal


Abstract
:
1. Introduction
2. Experimental Section
2.1. Absorbent: Bone charcoal

| Property | Value |
|---|---|
| Carbon content | 11% |
| Hydrogen content | 1.6% |
| Nitrogen content | 4.3% |
| Chlorine content | 2.1% |
| Ca3(PO4)2 content | 77% |
| CaCO3 content | 3.9% |
| Others (Mg, Fe, SiO2) | less than 1.0% |
| BET area | 283 m2·g−1 |
| Pore Volume, Vp | 0.287 cm3·g−1 |
| Moisture | maximum 3% |
2.2. Adsorbates: Metal ions
2.3. Adsorption equilibrium isotherm
2.4. Immersion enthalpy
3. Results and Discussion
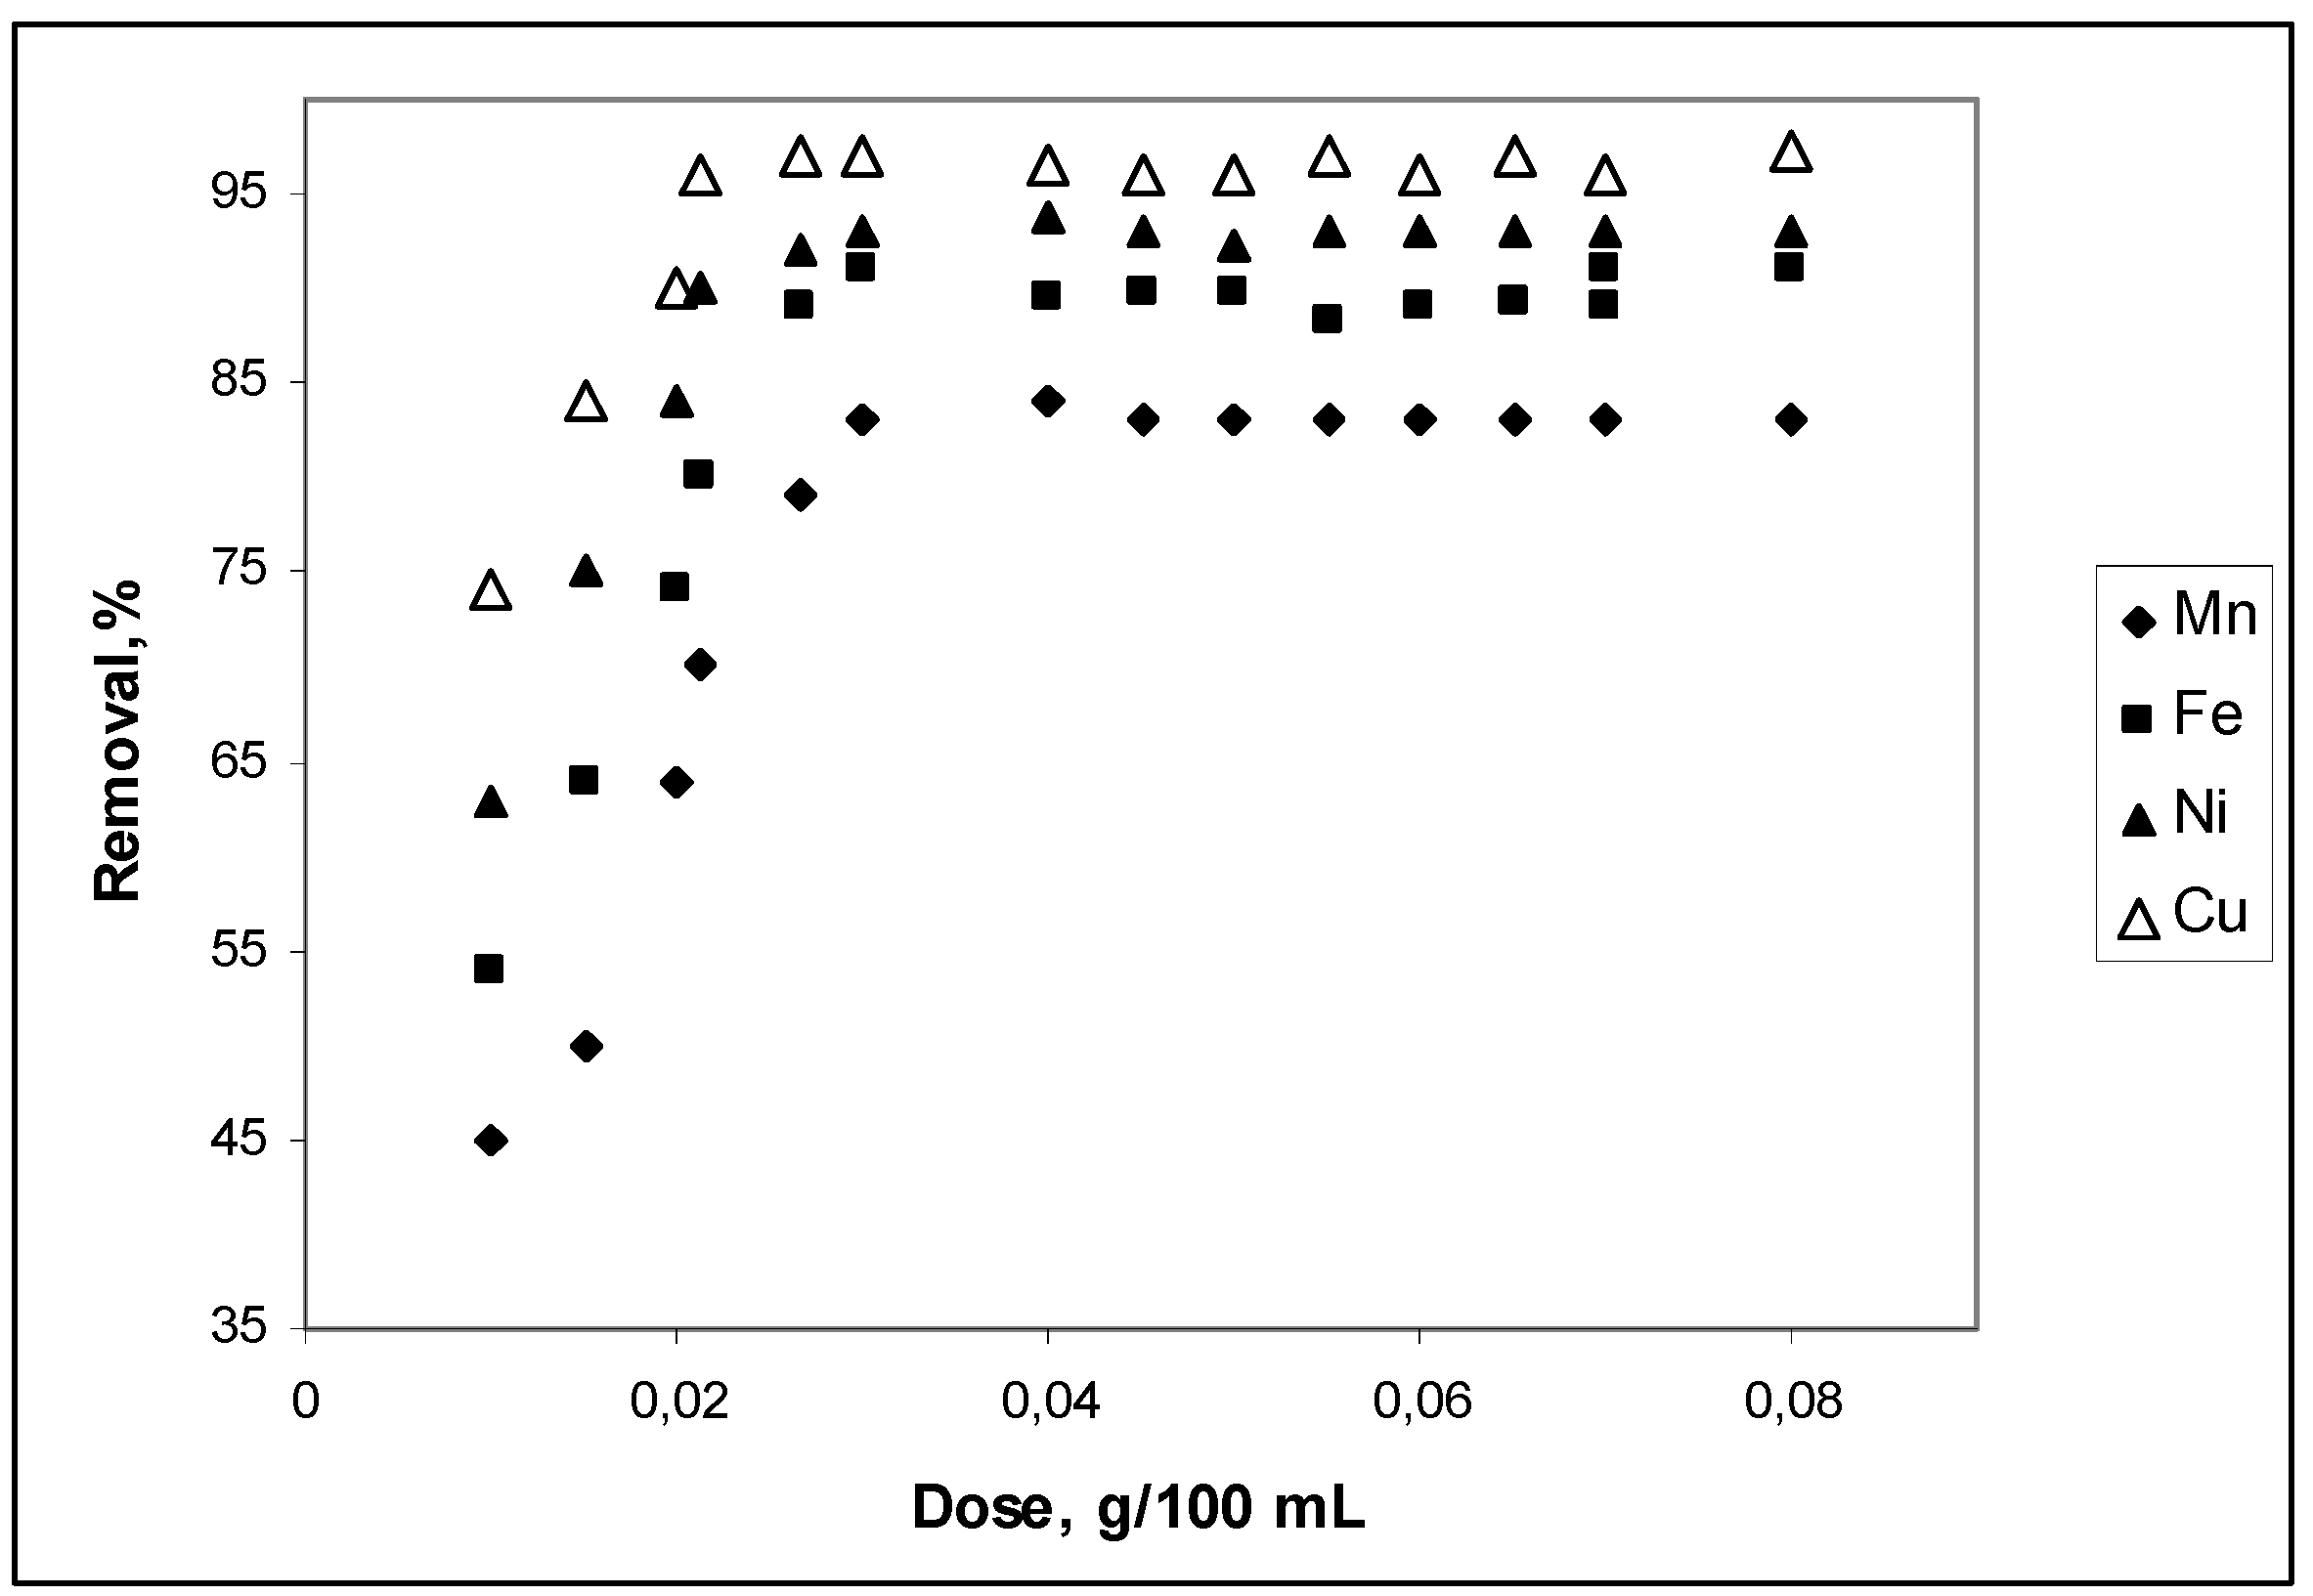
3.1. Effect of cow bone charcoal dosage on adsorption
3.2. Effect of contact time
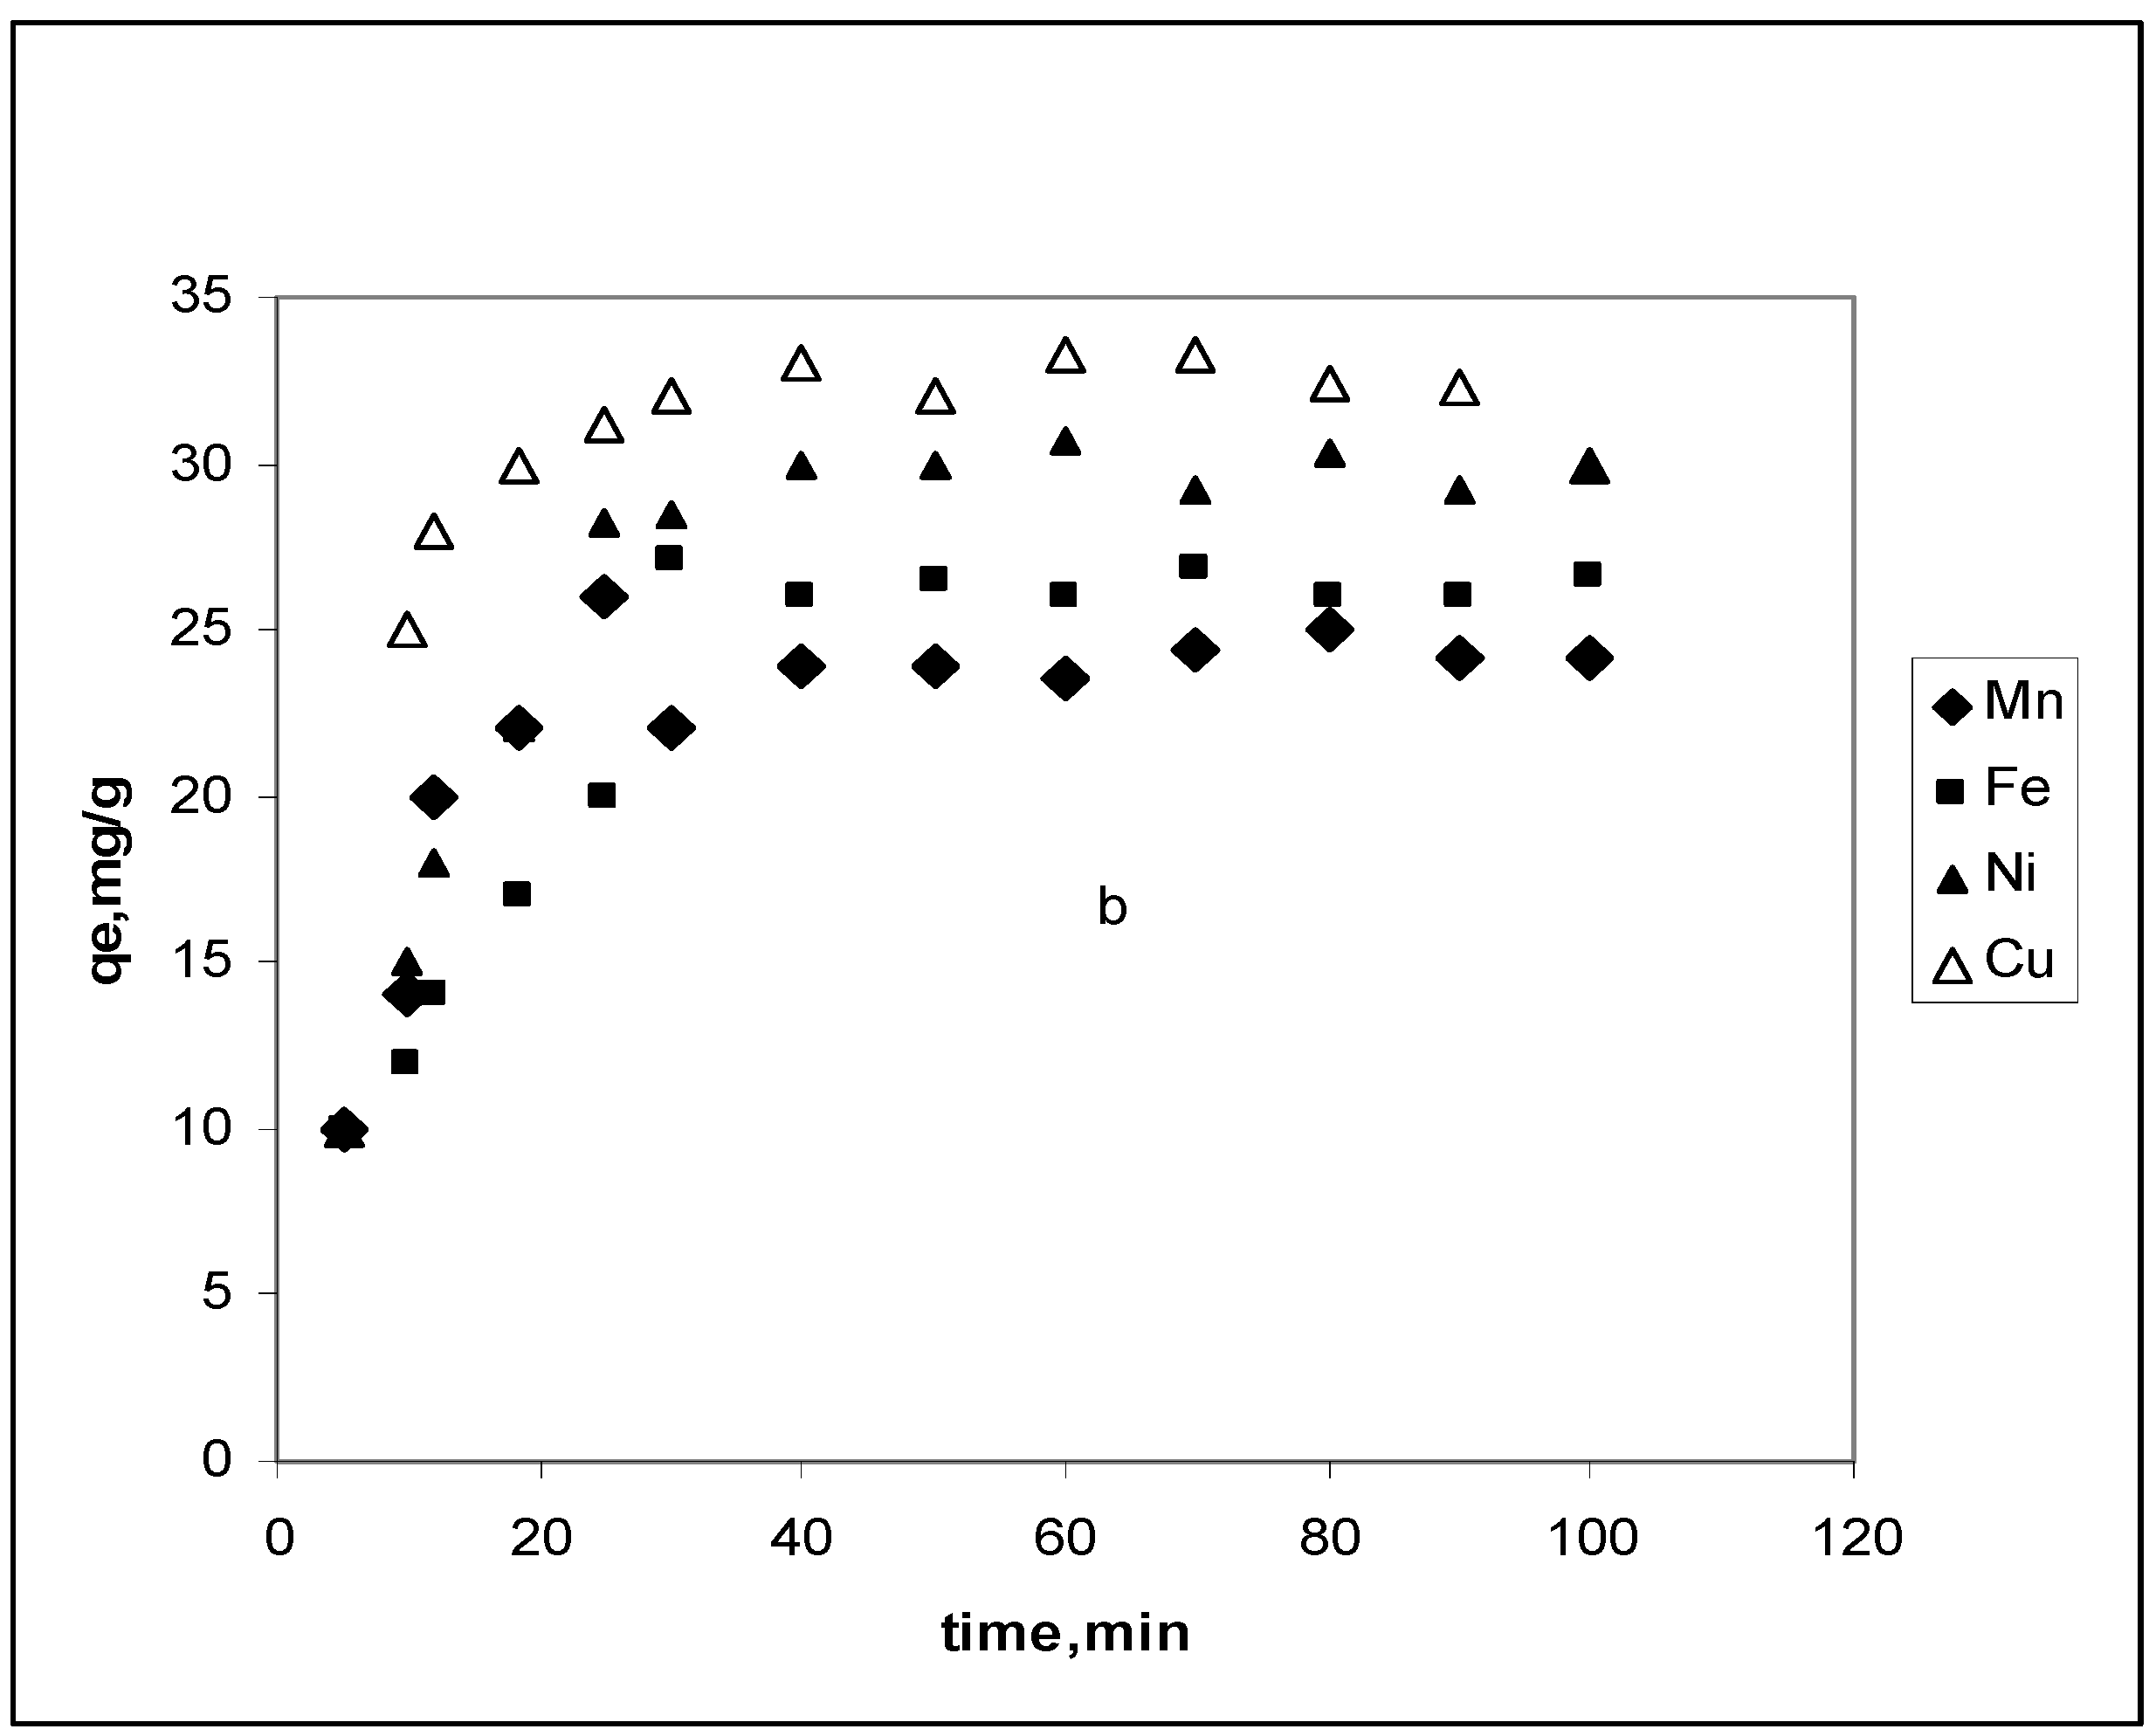
3.2.1. Pseudo-first-order model
| Lagergren rate equations constants | |||
| Metal ions | kad × min. | qe × (g·mg–1) | R2 |
| Mn2+ | 0.023 | 8.5 | 0.9443 |
| Fe2+ | 0.028 | 9.3 | 0.9765 |
| Ni2+ | 0.022 | 12.4 | 0.9865 |
| Cu2+ | 0.018 | 15.8 | 0.9245 |
| Pseudo second-order rate equation constants | |||
| Metal ions | ho × ( min·g·mg–1) | qe × (g·mg–1) | R2 |
| Mn2+ | 734.6 | 22.4 | 0.9991 |
| Fe2+ | 1546.6 | 26.7 | 0.9993 |
| Ni2+ | 1546.5 | 29.7 | 0.9999 |
| Cu2+ | 1656.6 | 33.2 | 0.9999 |
3.2.2. Pseudo-second-order model
| Heavy Metals Ions | Mn2+ | Fe2+ | Ni2+ | Cu2+ |
|---|---|---|---|---|
| pKh | 10.7 | 10.1 | 9.40 | 7.53 |
| Hydrated volume (cm3·mol–1) | 189.6 | 174.5 | 147.8 | 147.8 |
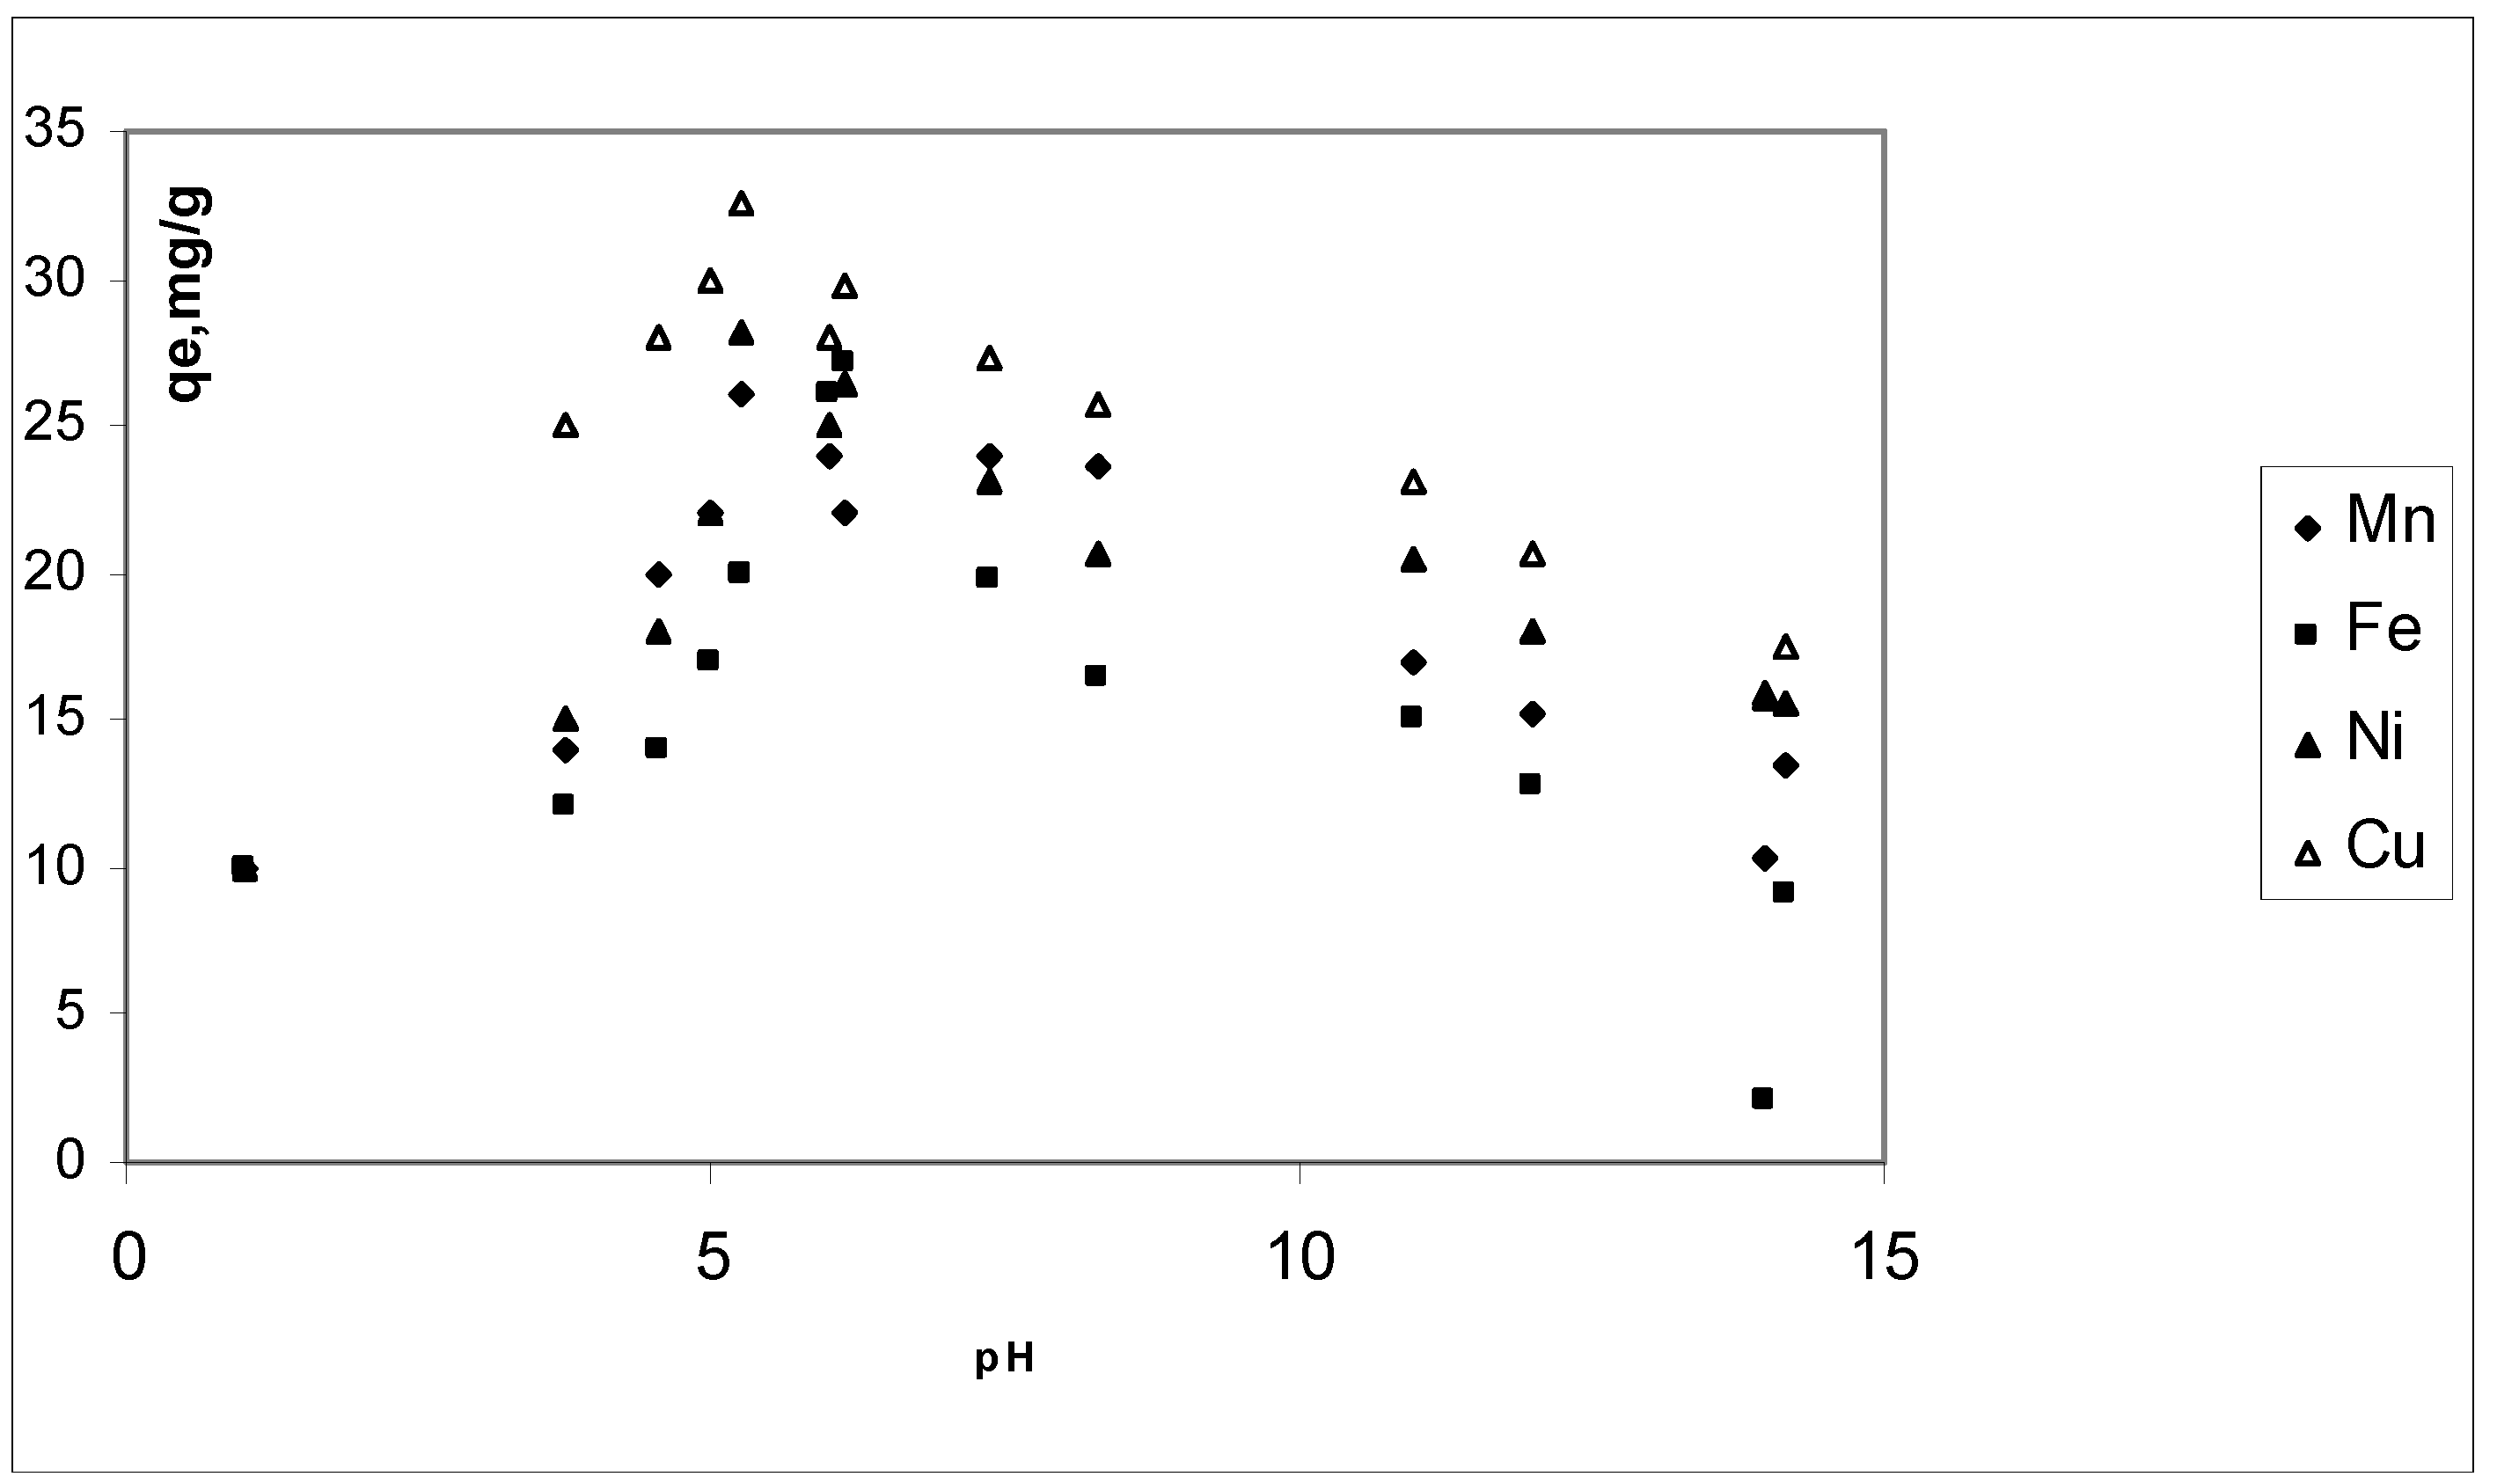
3.3. Effect of pH
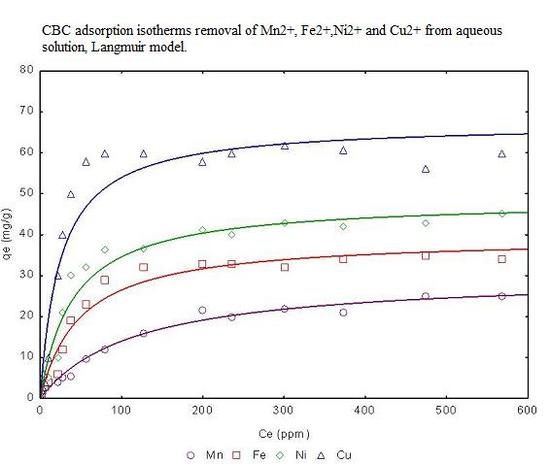
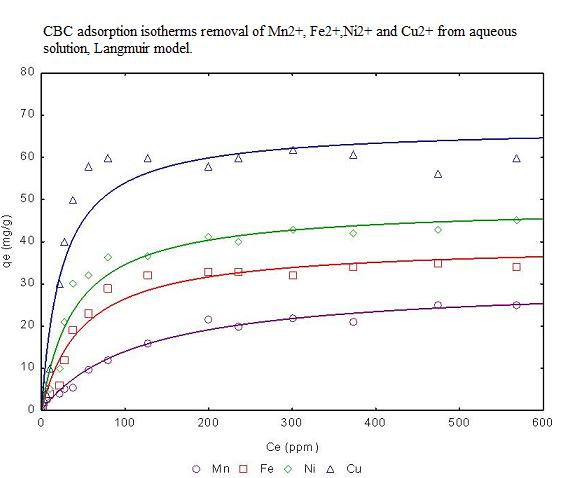
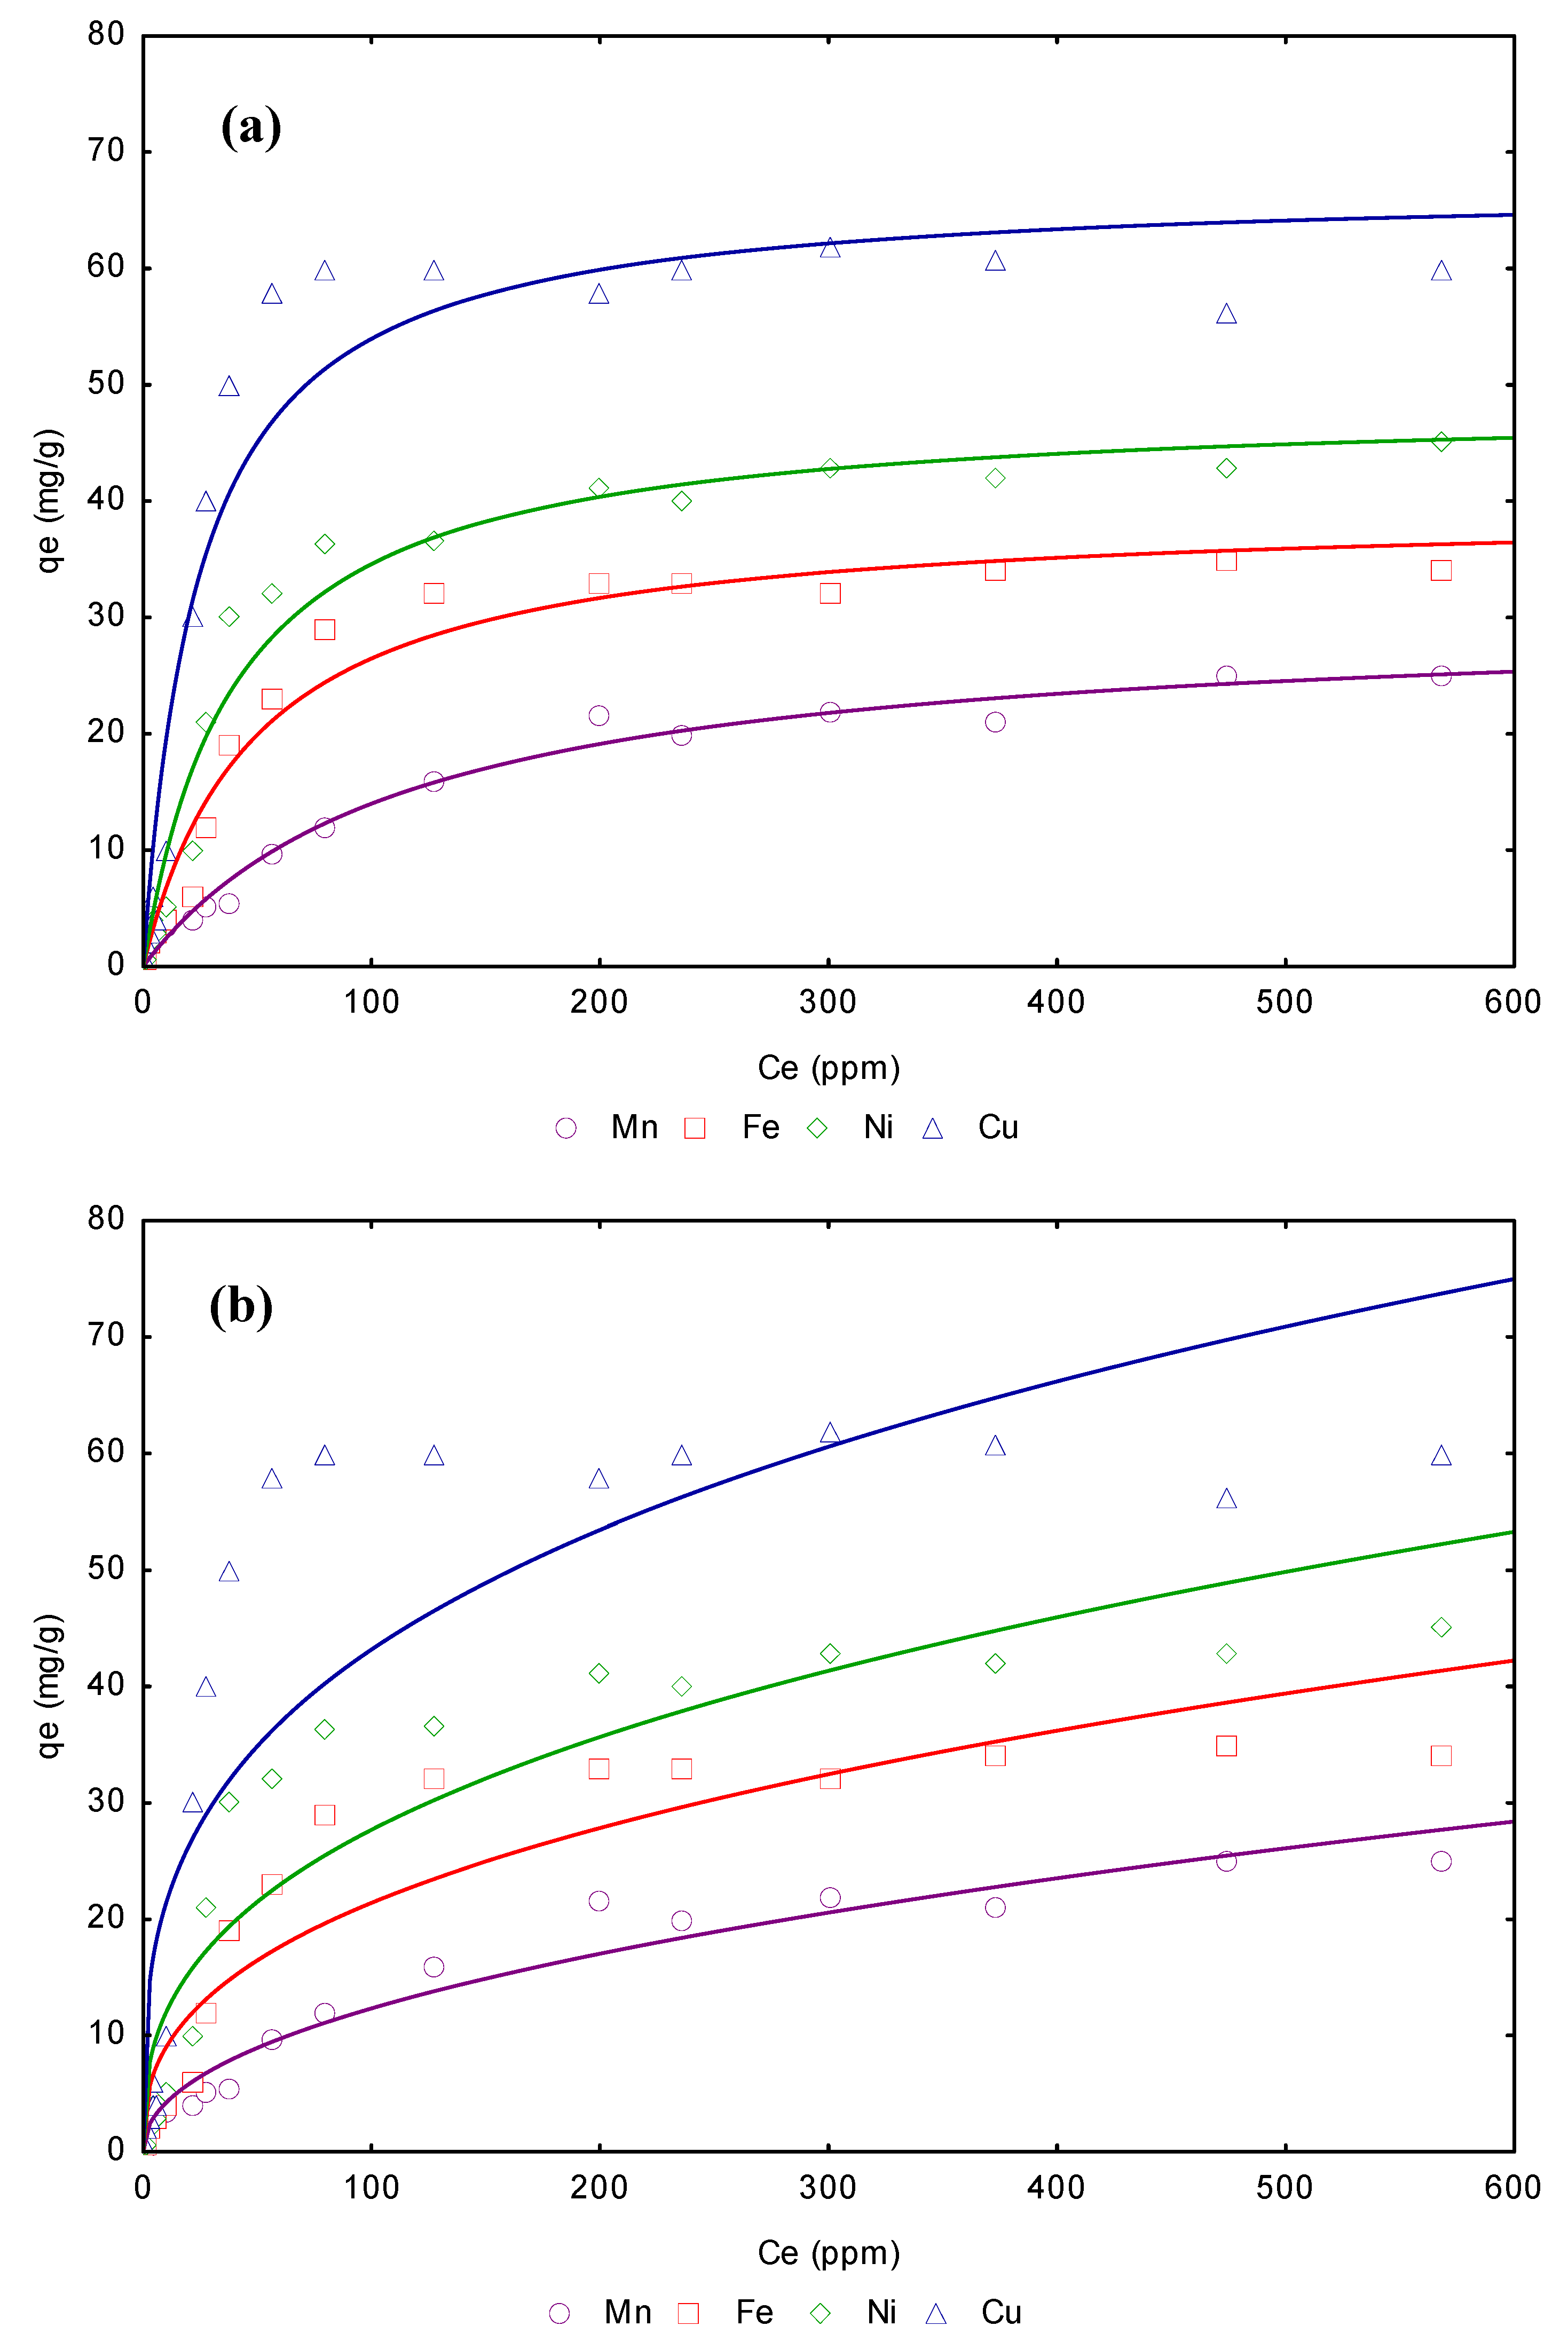
3.4. Adsorption isotherms from aqueous solution
| Freundlich model | Langmuir model | |||||||
|---|---|---|---|---|---|---|---|---|
| Metal | Linear KD (L/g) | KF | 1/n | R2 | qmax (mg/g) | b (L/g) | RL | R2 |
| Mn2+ | 6.76 | 14.457 | 0.315 | 0.9587 | 29.56 | 1.12 | 0.006 | 0.9987 |
| Fe2+ | 6.99 | 23.545 | 0.425 | 0.9643 | 31.43 | 1.18 | 0.005 | 0.9988 |
| Ni2+ | 7.89 | 26.876 | 0.643 | 0.9745 | 32.54 | 1.25 | 0.005 | 0.9988 |
| Cu2+ | 8.88 | 34.865 | 0.759 | 0.9876 | 35.44 | 1.34 | 0.005 | 0.9999 |
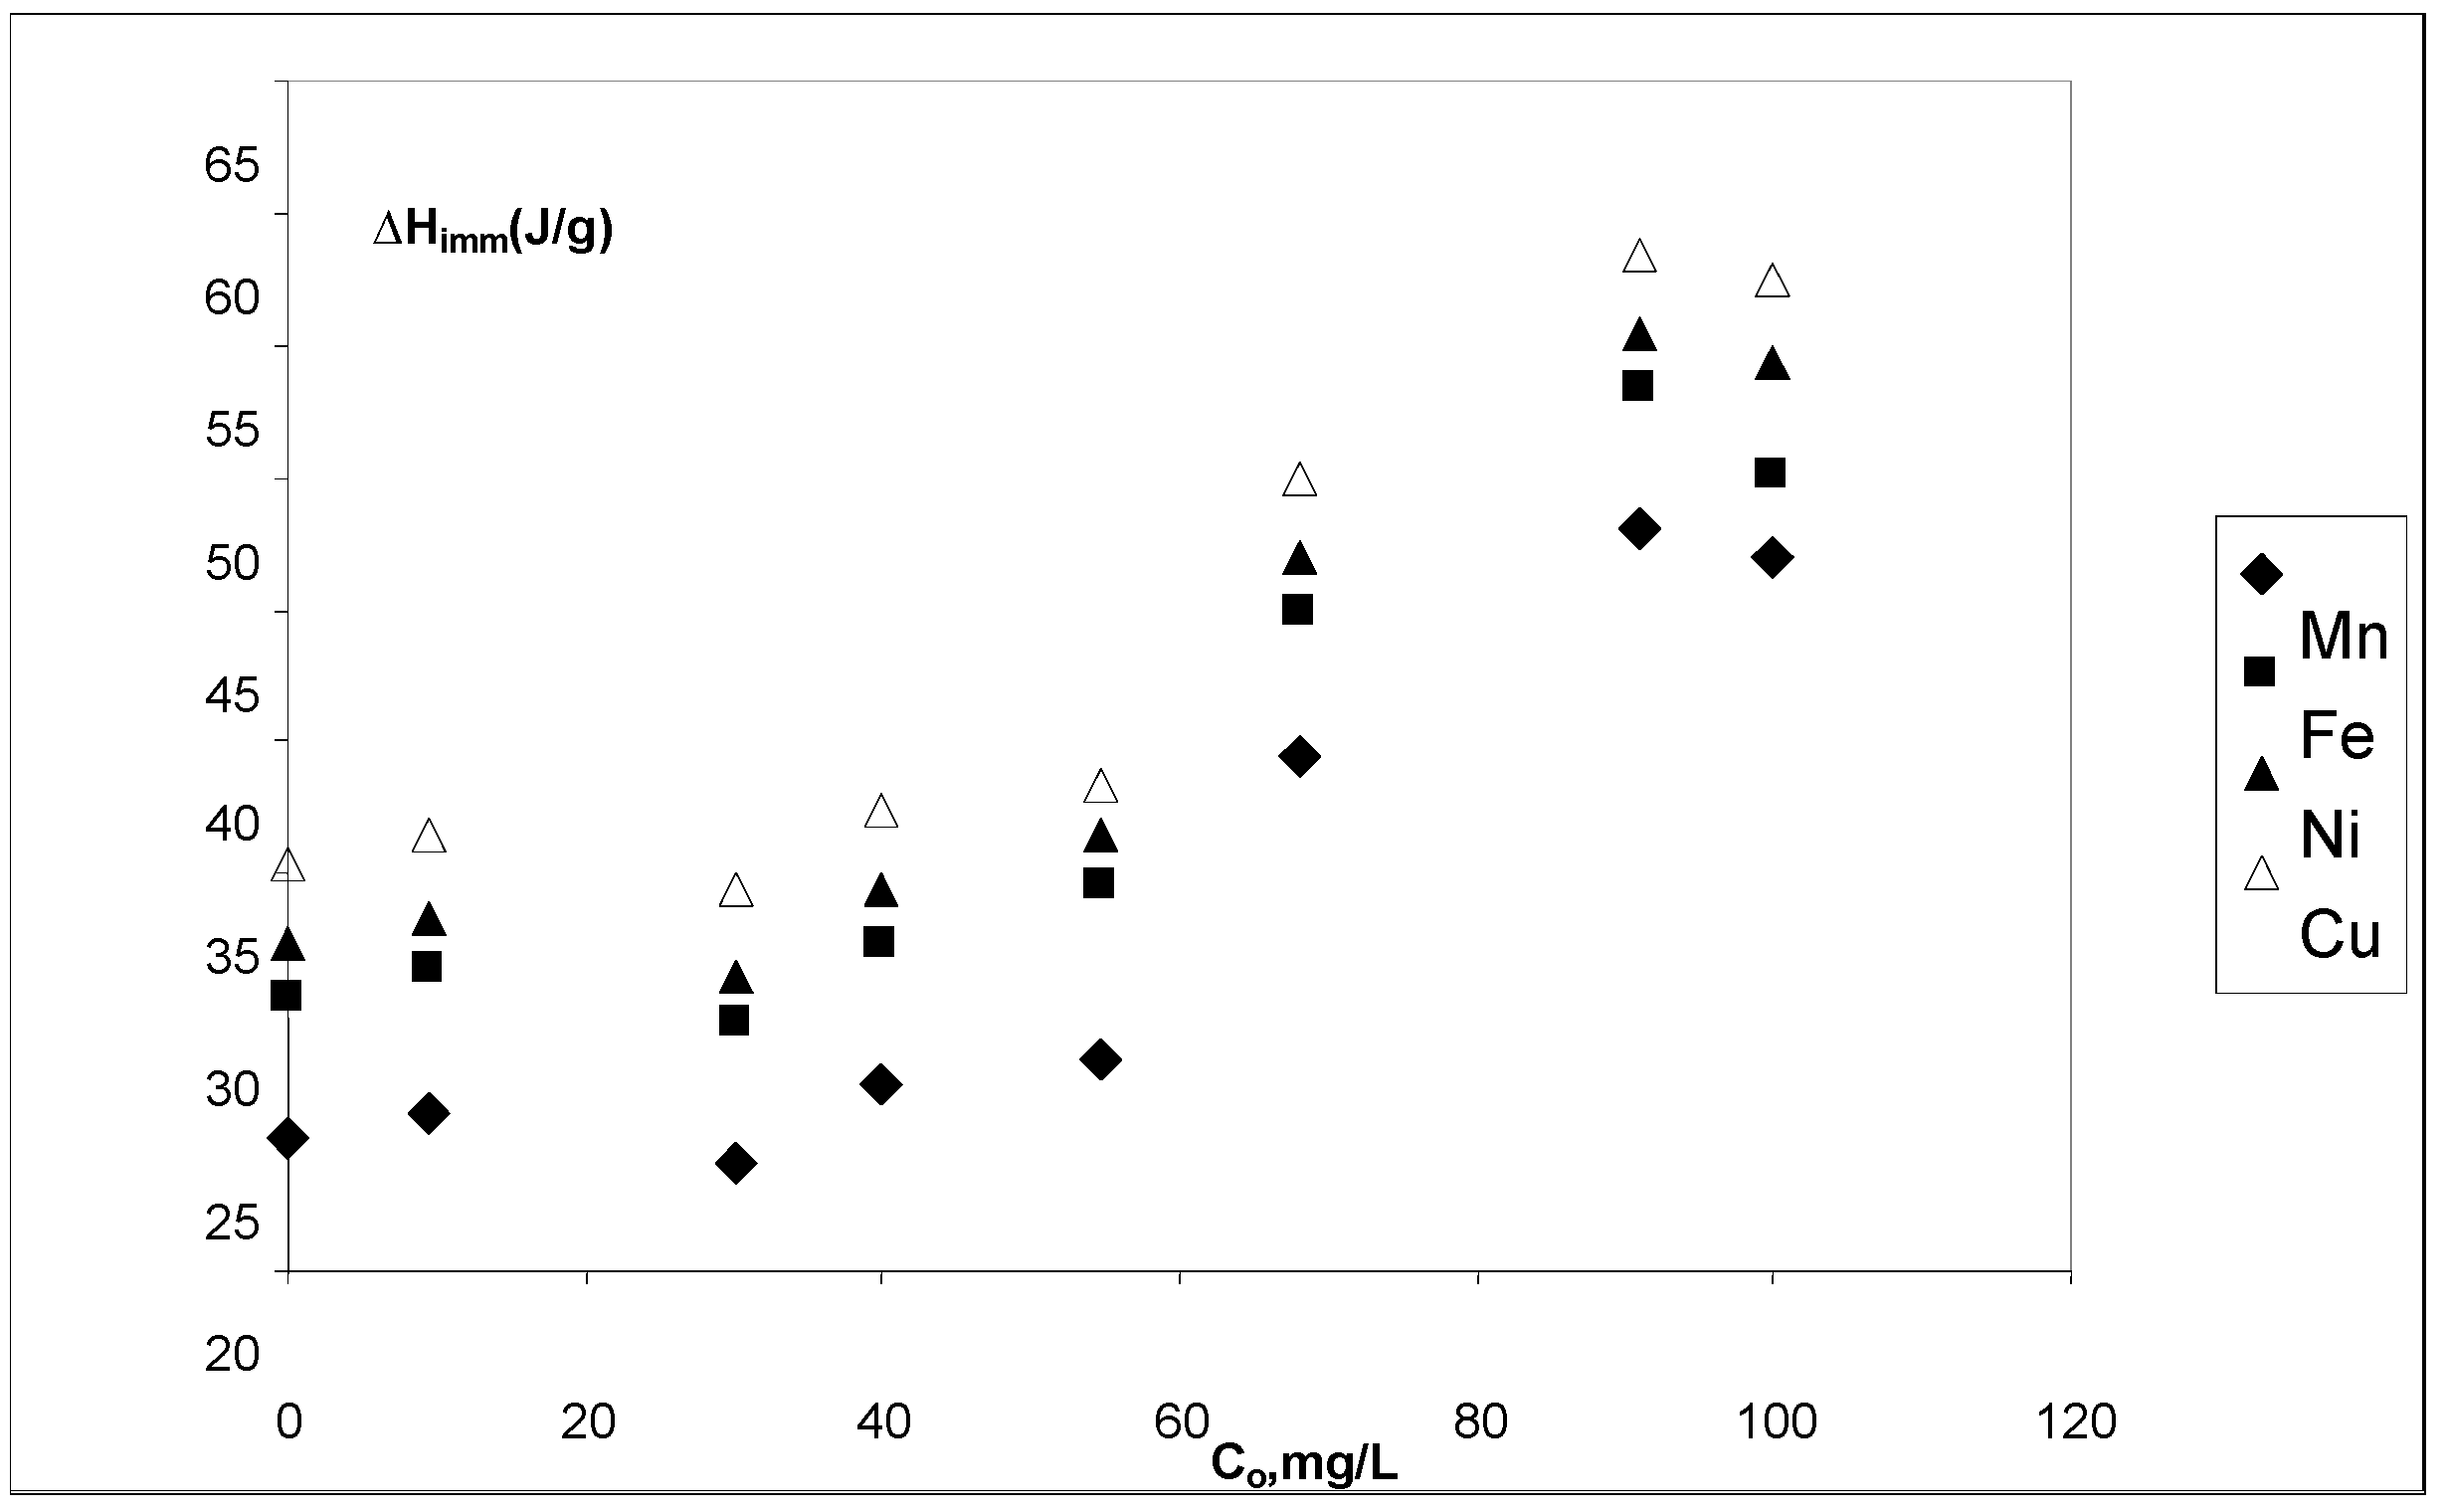
3.5. Immersion enthalpies
3.6. Removal of Mn2+, Fe2+, Ni2+ and Cu2+ from wastewater
3.7. Mechanism of adsorption
4. Conclusions
Acknowledgements
References and Notes
- Netzer, A.; Hughes, D.E. Adsorption of copper, lead and cobalt by activated carbon. Water Res. 1984, 18, 927–933. [Google Scholar] [CrossRef]
- Ngah, W.S.W.; Endud, C.S.; Mayanar, R. Removal of copper(II) ions from aqueous solution onto chitosan and cross-linked chitosan beads. React. Funct. Polym. 2002, 50, 181–190. [Google Scholar] [CrossRef]
- Wang, K.; Xing, B. Adsorption and desorption of cadmium by goethite pretreated with phosphate. Chemosphere 2002, 48, 665–670. [Google Scholar] [CrossRef] [PubMed]
- Keith, K.H.C.; Gordon, M. Sorption of cadmium, copper, and zinc ions onto bone char using Crank diffusion model. Chemosphere 2005, 60, 1141–1150. [Google Scholar] [CrossRef] [PubMed]
- Cheung, K.C.; Venkitachalam, T.H. Improving phosphate removal of sand infiltration system using alkaline fly ash. Chemosphere 2000, 41, 243–249. [Google Scholar] [CrossRef] [PubMed]
- Rao, M.; Parwate, A.V.; Bhole, A.G. Removal of Cr6+ and Ni2+ from aqueous solution using bagasse and fly ash. Waste Manag. 2002, 22, 821–830. [Google Scholar] [CrossRef] [PubMed]
- Yildiz, E. Phosphate removal from water by fly ash using crossflow micro-filtration. Sep. Purif. Technol. 2004, 35, 241–252. [Google Scholar] [CrossRef]
- Gray, C.A.; Schwab, A.P. Phosphorus-fixing ability of high pH, high calcium coal-combustion waste materials. Water Air Soil Pollut. 1993, 69, 309–320. [Google Scholar] [CrossRef]
- Keith, K.H.; McKay, G. Study of arsenic(V) adsorption on bone char from aqueous solution. J Hazard Mater. 2008, 160, 845–854. [Google Scholar]
- Purevsuren, B.; Avid, B.; Narangerel, J.; Gerelmaa, T.; Davaajav, Y. Investigation on the pyrolysis products from animal bone. J. Mater. Sci. 2004, 9, 737–740. [Google Scholar] [CrossRef]
- Wilson, J.A.; Pulford, I.D.; Thomas, S. Sorption of Cu and Zn by bone charcoal. Environ. Geochem. Health. 2003, 21, 51–56. [Google Scholar] [CrossRef]
- Jiang, J.Q. Removing arsenic from groundwater for the developing world—a review. Water Sci. Technol. 2001, 44, 89–98. [Google Scholar] [PubMed]
- Wu, F.C.; Tseng, R.L.; Juang, R.S. Comparisons of porous and adsorption properties of carbons activated by steam and KOH. Colloid Interf. Sci. 2005, 283, 49–56. [Google Scholar] [CrossRef]
- Nasiruddin, M.; Farooq, M.; Wahab, M. Characterization of chemically modified corncobs and its application in the removal of metal ions from aqueous solution. Hazard. Mater. 2007, 141, 237–244. [Google Scholar] [CrossRef]
- Liu, S.X.; Chen, X.; Chen, X.Y.; Liu, Z.F.; Wang, H.L. Activated carbon with excellent chromium(VI) adsorption performance prepared by acid–base surface modification. Hazard. Mater. 2007, 141, 315–319. [Google Scholar] [CrossRef]
- Pattanayak, J.; Mondal, K.; Mathew, S.; Lalvani, S.B. A parametric evaluation of the removal of As(V) and As(III) by carbon-based adsorbents. Carbon 2000, 38, 589–596. [Google Scholar] [CrossRef]
- Li, Q.; Zhai, J.; Zhang, W.; Wang, M.; Zhou, J. Kinetic studies of adsorption of Pb(II), Cr(III) and Cu(II) from aqueous solution by sawdust and modified peanut husk. Hazard. Mater. 2007, 141, 163–167. [Google Scholar] [CrossRef]
- Garg, U.K.; Kaur, M.P.; Garg, V.K.; Sud, D. Removal of hexavalent chromium from aqueous solution by agricultural waste biomass. J. Hazard. Mater. 2007, 40, 60–68. [Google Scholar] [CrossRef]
- Kavitha, D.; Namasivayam, D. Recycling coir pith, an agricultural solid waste, for the removal of portion orange from wastewater. Dyes Pigments 2007, 4, 237–248. [Google Scholar] [CrossRef]
- Ofomaja, A.E.; Ho, Y.S. Effect of pH on cadmium biosorption by coconut copra meal. Hazard. Mater. 2007, 139, 356–362. [Google Scholar] [CrossRef]
- Chojnacka, K.; Górecka, H.; Górecki, H. The influence of living habits and family relationships on element concentrations in human hair. Sci. Total Environ. 2006, 366, 612–620. [Google Scholar] [CrossRef] [PubMed]
- Chen, S.-B.; Zhu, Y.-G.; Ma, Y.-B.; McKay, G. Effect of bone char application on Pb bioavailability in a Pb-contaminated soil. Environ. Pollut. 2006, 39, 433–439. [Google Scholar] [CrossRef]
- Giraldo, L.; Cubillos, G.I.; Moreno, J.C. Evaluación de las pérdidas térmicas en calorimetría isoperibólica. Importancia de los alrededores en la obtención de constantes instrumentales. Rev. Colomb. Quim. 2005, 34, 147–154. [Google Scholar]
- Findon, A.; Mckay, O.; Blair, H.S. Transport studies for the sorption of copper ions by chitosan. J. Environ.Sci. Heal. A 1993, 28, 173–185. [Google Scholar]
- Weber, W.J.; Digiano, F.A. Process dynamics in Environmental systems. In Environmental Science and Technology Service; Wiley and Sons: New York, NY, USA, 1996; pp. 89–94. [Google Scholar]
- Lagergren, S. About the theory of so-called adsorption of soluble substances. K. Sven. Vetenskapsakademiens Handlingar 1898, 24, 1–39. [Google Scholar]
- Ho, Y.S.; McKay, G. Sorption of dye from aqueous solution by peat. Chem. Eng. J. 1998, 70, 115–124. [Google Scholar] [CrossRef]
- Horsfall, M.; Spiff, A.I. Studies on the effect of pH on the sorption of Pb2+ and Cd2+ ions from aqueous solutions by caladium bicolor (wild cocoyam) biomass. Electron. J. Biotech. 2004, 7, 1–7. [Google Scholar]
- Pearson, R.G. Chemical Hardness; Wiley-VCH: Weinheim, Germany, 1997. [Google Scholar]
- Chong, K.H.; Volesky, B. Description of two-metal biosorption equilibria by Langmuir-type models. Biotechnol. Bioeng. 1995, 47, 451–460. [Google Scholar] [CrossRef] [PubMed]
- Langmuir, I. The adsorption of gases on plane surfaces of glass, mica and platinum. J. Am. Chem. Soc. 1918, 40, 1361–1403. [Google Scholar] [CrossRef]
- Ahalya, N.; Kanamadi, R.D.; Ramachandra, T.V. Biosorption of chromium (VI) from aqueous solutions by the husk of Bengal gram (Cicer arientinum). Electronic. J. Biotechnol. 2005, 8, 258–264. [Google Scholar] [CrossRef]
- Mckay, G.; Blair, H.S.; Gardener, J.R. Adsorption of dyes on chitin I. Equilibrium Studies. J. Appl. Polym. Sci. 1982, 27, 3043–3057. [Google Scholar] [CrossRef]
- Freundlich, H. Ueber die Adsorption in Loesungen. Z. Phys. Chem. 1907, 57, 385–470. [Google Scholar]
- Kardivalu, K.; Namasivayan, C. Agricutural by-product as metal adsorbent: Sorption of lead(II) from aqueous solution onto coirpith carbon. Environ. Technol. 2000, 21, 1091–1097. [Google Scholar] [CrossRef]
- Juang, R.S.; Wu, F.C.; Tseng, R.L. Adsorption removal of copper(II) using chitosan from simulated rinse solutions containing chelating agent. Water Res. 1999, 33, 2403–2409. [Google Scholar] [CrossRef]
- Hsisheng, C.-T.H. influence of surface characteristics on liquid-phase adsorption of phenol by activated carbons prepared from bituminous coal. Ind. Eng. Chem. Res. 1998, 39, 3618–3624. [Google Scholar]
© 2010 by the authors; licensee Molecular Diversity Preservation International, Basel, Switzerland. This article is an open-access article distributed under the terms and conditions of the Creative Commons Attribution license (http://creativecommons.org/licenses/by/3.0/).
Share and Cite
Moreno, J.C.; Gómez, R.; Giraldo, L. Removal of Mn, Fe, Ni and Cu Ions from Wastewater Using Cow Bone Charcoal. Materials 2010, 3, 452-466. https://doi.org/10.3390/ma3010452
Moreno JC, Gómez R, Giraldo L. Removal of Mn, Fe, Ni and Cu Ions from Wastewater Using Cow Bone Charcoal. Materials. 2010; 3(1):452-466. https://doi.org/10.3390/ma3010452
Chicago/Turabian StyleMoreno, Juan Carlos, Rigoberto Gómez, and Liliana Giraldo. 2010. "Removal of Mn, Fe, Ni and Cu Ions from Wastewater Using Cow Bone Charcoal" Materials 3, no. 1: 452-466. https://doi.org/10.3390/ma3010452
APA StyleMoreno, J. C., Gómez, R., & Giraldo, L. (2010). Removal of Mn, Fe, Ni and Cu Ions from Wastewater Using Cow Bone Charcoal. Materials, 3(1), 452-466. https://doi.org/10.3390/ma3010452