1. Introduction
Due to the flammability of traditional liquid lithium-ion batteries, liquid leakage, and other safety issues, the use of solid-state electrolytes (SSEs) instead of liquid electrolytes and separators in the all-solid-state lithium-ion batteries (ASSLIBs) has become the most promising development in next-generation energy storage devices [
1,
2]. Solid-state electrolytes combine the lithium-ion transport capability of traditional liquid electrolytes with the separator function to isolate electrodes, effectively suppressing lithium dendrite penetration and short-circuit-induced fire hazards [
3].
Solid-state electrolytes are categorized into organic polymer solid-state electrolytes and inorganic solid-state electrolytes. The latter further includes oxide solid-state electrolytes, sulfide solid-state electrolytes, and halide solid-state electrolytes [
3]. Polymer solid-state electrolytes exhibit favorable mechanical processing properties, but their ionic conductivity is generally low (room-temperature ionic conductivity: 10
−8–10
−5 S/cm) [
4]. Oxide solid-state electrolytes demonstrate excellent air stability and electrochemical stability; however, they suffer from poor mechanical processability and require high-temperature sintering above 1000 °C for preparation [
5]. Sulfide solid-state electrolytes possess high ionic conductivity and relatively good mechanical processing performance, but they generate toxic H
2S gas when exposed to air [
6]. Halide solid-state electrolytes, in contrast, not only achieve high ionic conductivity at room temperature but also avoid releasing toxic gases into the air, positioning them as promising competitors for next-generation solid-state electrolytes [
7].
In 2019, Li et al. reported a halide solid-state electrolyte, Li
3InCl
6 (LIC), which exhibits an ionic conductivity of 1.49 × 10
−3 S/cm and can be synthesized at scale in water, paving the way for the industrialization of halide solid-state electrolytes [
8]. However, during the dehydration process in the water-mediated synthesis of Li
3InCl
6, the material is prone to oxidation, leading to a rapid decline in ionic conductivity [
9]. Acidic environments can suppress hydrolysis and the oxidation of the sample [
10], and mixed crystals of Li
3PO
4 and Li
4P
2O
7 have also been identified as promising solid-state electrolytes [
11]. Macarie et al. have demonstrated that phosphonic groups exhibit favorable properties in water-mediated synthesis methods by effectively suppressing the formation of scale-forming salts [
12] and investigated the synthesis methods of phosphate compounds [
13]. Iliescu et al. demonstrates that phosphorus can enhance the ionic conductivity of polymer solid-state electrolytes [
14]. Phosphoric acid was selected as an additive due to its ability to suppress hydrolysis via pH modulation and generation of phosphate derivatives (e.g., P
2O
74−) that enhance ionic conductivity.
This study employs water-mediated synthesis to prepare LIC, during which phosphoric acid (H3PO4) solutions of varying concentrations are introduced to suppress hydrolysis and oxidation of the sample while simultaneously generating a small amount of LiIn(P2O7) to form a composite with LIC, thereby enhancing the ionic conductivity of the material. Furthermore, a full solid-state battery LiCoO2-LIC/LIC-1%H3PO4/Li6PS5Cl/In/Li was assembled to evaluate its cycling performance.
3. Results and Discussion
Figure 3 presents the SEM images of dried LIC samples prepared with varying H
3PO
4 concentrations. As observed, LIC synthesized in pure water exhibits bulk-like stacking due to the difficulty in removing crystalline water during drying. The LIC-H
2O sample exhibits bulk-like aggregates with irregular shapes, ranging in size from 10 to 50 μm. When 0.5% H
3PO
4 is introduced, the samples form porous bulk structures, which facilitate crystalline water elimination. The porous structure in LIC-0.5% H
3PO
4 contains interconnected voids with diameters of 2–10 μm. With increasing H
3PO
4 concentration, the microstructure progressively transitions to a flake-like morphology. At 1% H
3PO
4, the samples partially display flake-like structures alongside residual porous bulk regions. Finally, at 2% H
3PO
4, the microstructure becomes entirely flake-shaped, indicating complete morphological transformation. The microstructure transitions to flake-like particles with lateral dimensions of 5–20 μm and thicknesses of 0.5–2 μm.
Figure 4 displays the XRD patterns of LIC powders synthesized with varying H
3PO
4 concentrations. During testing, the powders were sealed onto glass slides using Kapton polyimide tape to prevent air exposure. As shown, the XRD patterns of all four samples align well with most characteristic peaks of the LIC reference PDF card (ICSD No. 04-009-9027). The LIC-H
2O sample (prepared in pure water) exhibits weaker peak intensities compared to others, suggesting lower crystallinity or reduced LIC content. Upon H
3PO
4 addition, the XRD patterns reveal coexisting characteristic peaks of LIC and LiIn(P
2O
7), confirming the formation of a LIC/LiIn(P
2O
7) composite. Notably, the intensity of LiIn(P
2O
7) peaks increases progressively with higher H
3PO
4 concentrations, indicating enhanced formation of this phase. This is attributed to the thermal decomposition of PO
43− (from H
3PO
4) into P
2O
74− at 200 °C, which reacts with In
3+ and Li
+ in the sample to yield LiIn(P
2O
7). The P
2O
74− anion, owing to its favorable structural properties, has been reported to enhance ionic conductivity when composited with solid-state electrolytes [
11].
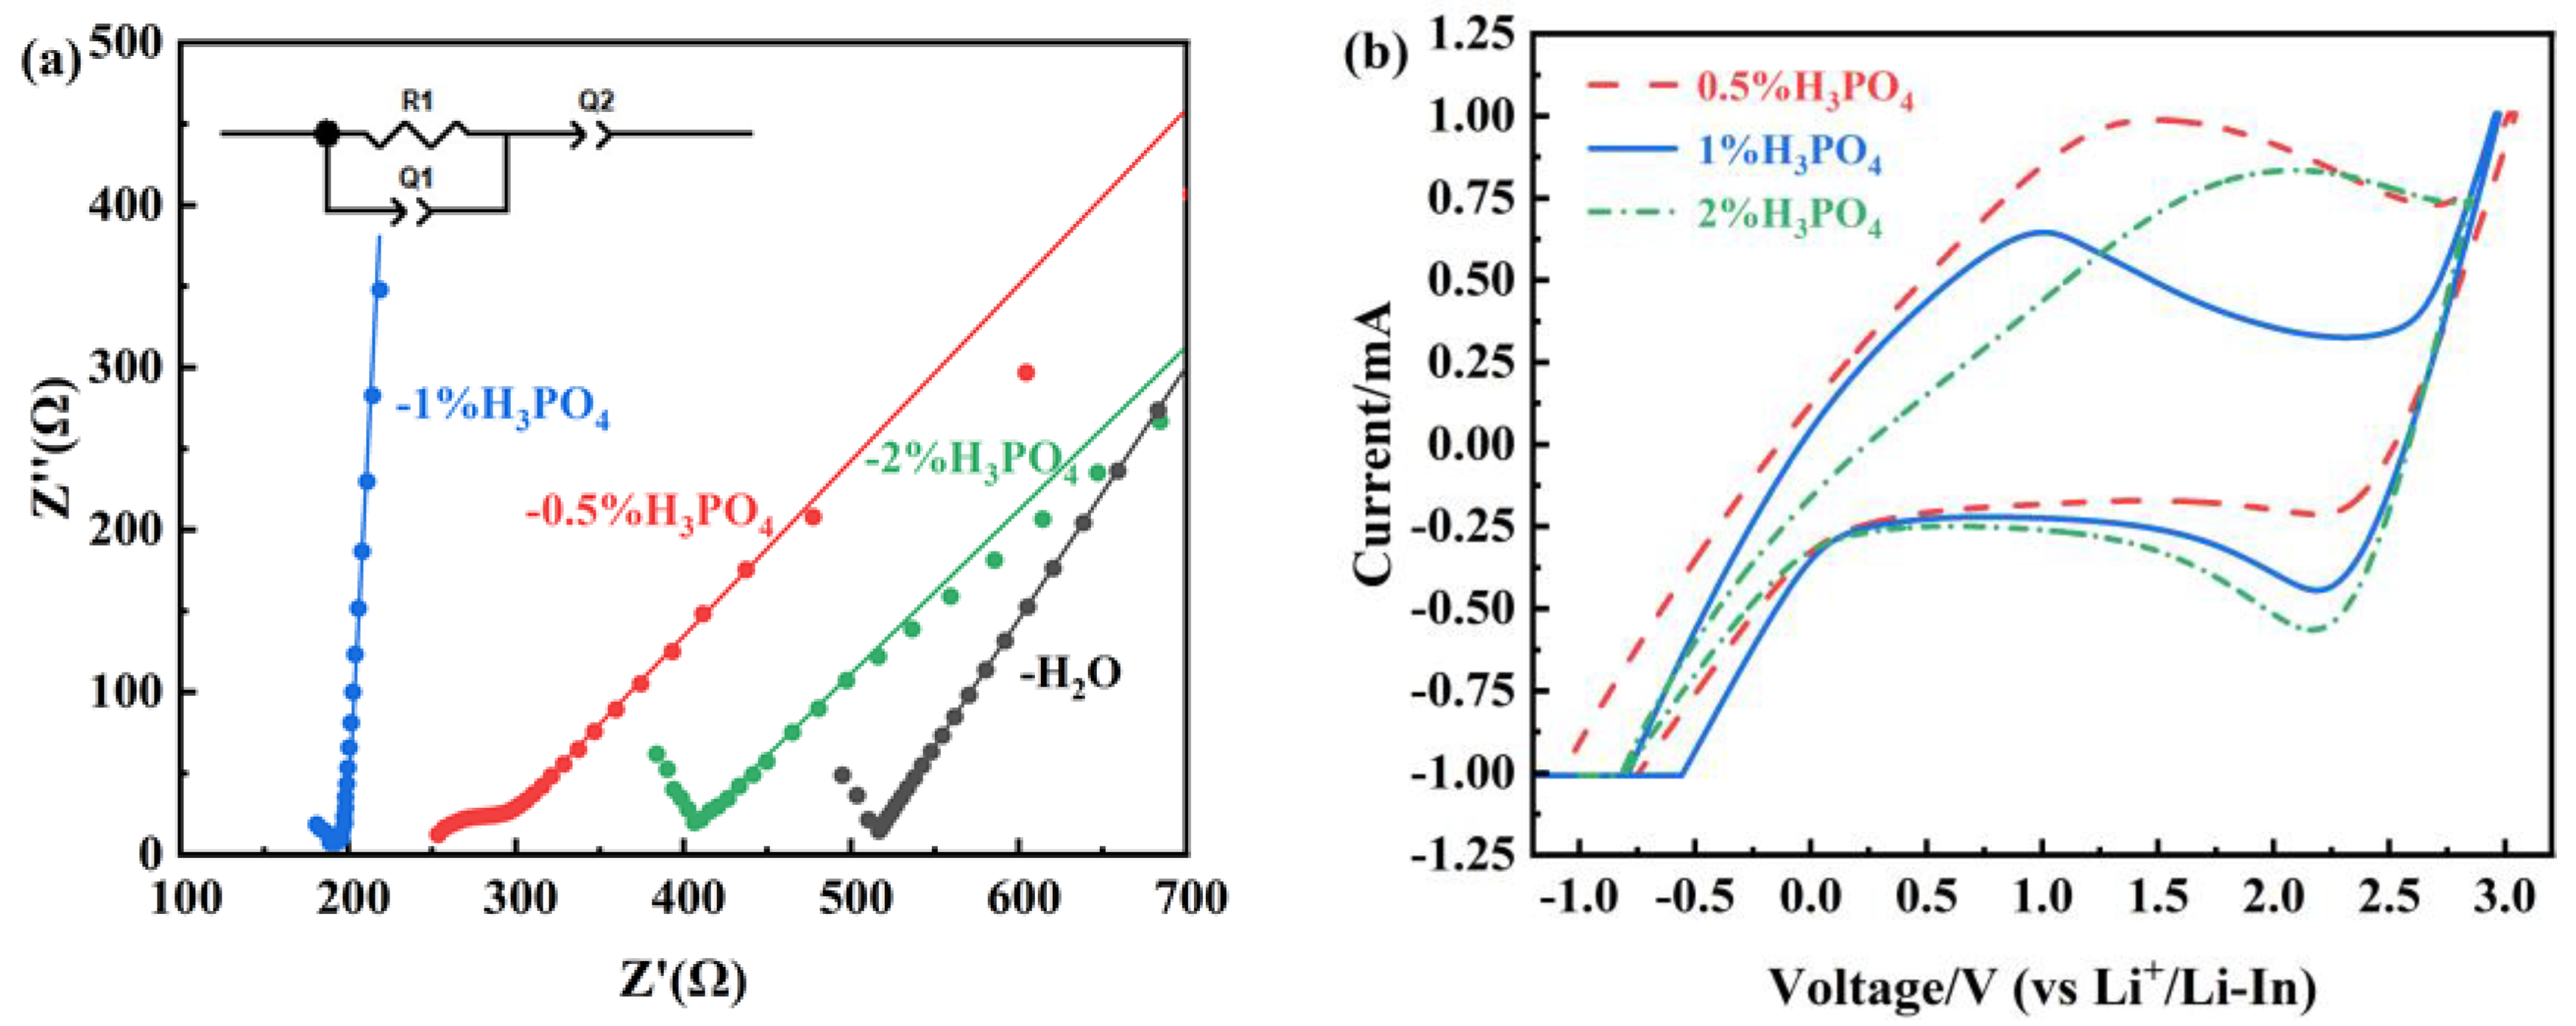
The electrochemical impedance spectroscopy (EIS) of the samples, measured under 300 MPa pressure in an Ar atmosphere, is shown in
Figure 5a. The inset in the upper-left corner depicts the equivalent circuit based on a simple R(RQ)Q model. By fitting the equivalent circuit and measuring the diameter and thickness of the pressed LIC electrolyte pellets, the ionic conductivity (σ) of the powders was calculated using the following formula:
where σ is the ionic conductivity, d is the pellet thickness, R is the measured AC impedance value, and S is the pellet area. The calculated ionic conductivities are summarized in
Table 1.
As shown in
Table 1, the ionic conductivity follows the order of LIC-1% H
3PO
4 > LIC-0.5% H
3PO
4 > LIC-2% H
3PO
4 > LIC-H
2O. The LIC-H
2O sample demonstrates the lowest ionic transport efficiency among the tested materials, with a recorded conductivity of 0.38 × 10
−3 S/cm. Upon H
3PO
4 addition, the ionic conductivity significantly increases, reaching a maximum value of 1.15 × 10
−3 S/cm for the LIC-1% H
3PO
4 sample. The non-linear relationship between H
3PO
4 concentration and ionic conductivity (LIC-2% H
3PO
4 < LIC-1% H
3PO
4) is tied to excessive LiIn(P
2O
7) formation, which disrupts the LIC matrix. The ionic conductivity of the sample decreases when the H
3PO
4 concentration exceeds 2%, as the inherently low conductivity of LiIn(P
2O
7) (~10
−5 S/cm) cannot compensate for the loss of the highly conductive LIC matrix. Thus, LiIn(P
2O
7) functions as a secondary phase rather than a primary conductor, a conclusion consistent with prior studies [
11].
Figure 5b displays the cyclic voltammetry (CV) profiles acquired at 0.025 V/s over a potential window of −1.0–3.0 V (vs. Li
+/Li-In). The LIC-1% H
3PO
4 composite demonstrates enhanced peak symmetry relative to counterparts, signifying superior electrochemical reversibility. During anodic polarization, a distinct oxidation peak is observed at 1.0 V, followed by a reduction peak at 2.2 V under cathodic conditions, collectively spanning a broad electrochemical stability window. These results confirm that the electrolyte synthesized with 1% H
3PO
4 delivers the best overall performance.
In summary, the LIC-1% H
3PO
4 electrolyte demonstrates superior electrochemical performance. To evaluate its practical applicability, the all-solid-state lithium-ion batteries (ASSLIBs) LiCoO
2-LIC/LIC-1%H
3PO
4/LPSC/In/Li were assembled as illustrated in
Figure 6c. The cathode comprised a composite of LIC-1% H
3PO
4 and LiCoO
2 blended at a 3:7 weight ratio, while the anode consisted of stacked In and Li foils. LIC-1% H
3PO
4 served as the solid electrolyte, with a Li
6PS
5Cl interfacial layer inserted between the electrolyte and In foil to mitigate parasitic reactions at the halide–metal interface. The cell fabrication protocol adhered to the methodology outlined in the experimental section. The ASSLIBs underwent three initial activation cycles at 0.05 C within a voltage range of 1.9–3.8 V, followed by charge/discharge cycling at 0.1 C under the same voltage window.
Figure 6a displays the charge–discharge profiles of the ASSLBs at 30 °C under a 0.05 C rate. The first-cycle charge capacity reaches 128 mAh/g with an initial Coulombic efficiency of 72.95%. As shown in
Figure 6b, the Coulombic efficiency stabilizes at 98.8% after 14 cycles, after which battery failure occurs due to electrolyte deliquescence in ambient air.
Figure 6d presents the cycling performance of a Li-In/LPSC/LIC-1% H
3PO
4/LPSC/Li-In symmetric cell under varying current densities. The LPSC interlayers in the symmetric cell configuration are essential for isolating the halide electrolyte from Li metal, ensuring long-term cycling stability [
16]. The symmetric cell demonstrates stable cycling over 1000 cycles at 0.05, 0.1, and 0.3 mA/cm
2, confirming that LIC-1% H
3PO
4 maintains stable contact with Li-In metal without detectable side reactions. The LIC-H
2O sample was excluded from symmetric cell testing due to its inherent instability and low ionic conductivity, which preclude meaningful cycling performance. The superior ionic conductivity of LIC-1% H
3PO
4 (1.15 × 10
−3 S/cm,
Table 1) and stable cycling of ASSLIBs (
Figure 6a,b) are direct outcomes of phosphorus-enabled composite formation.
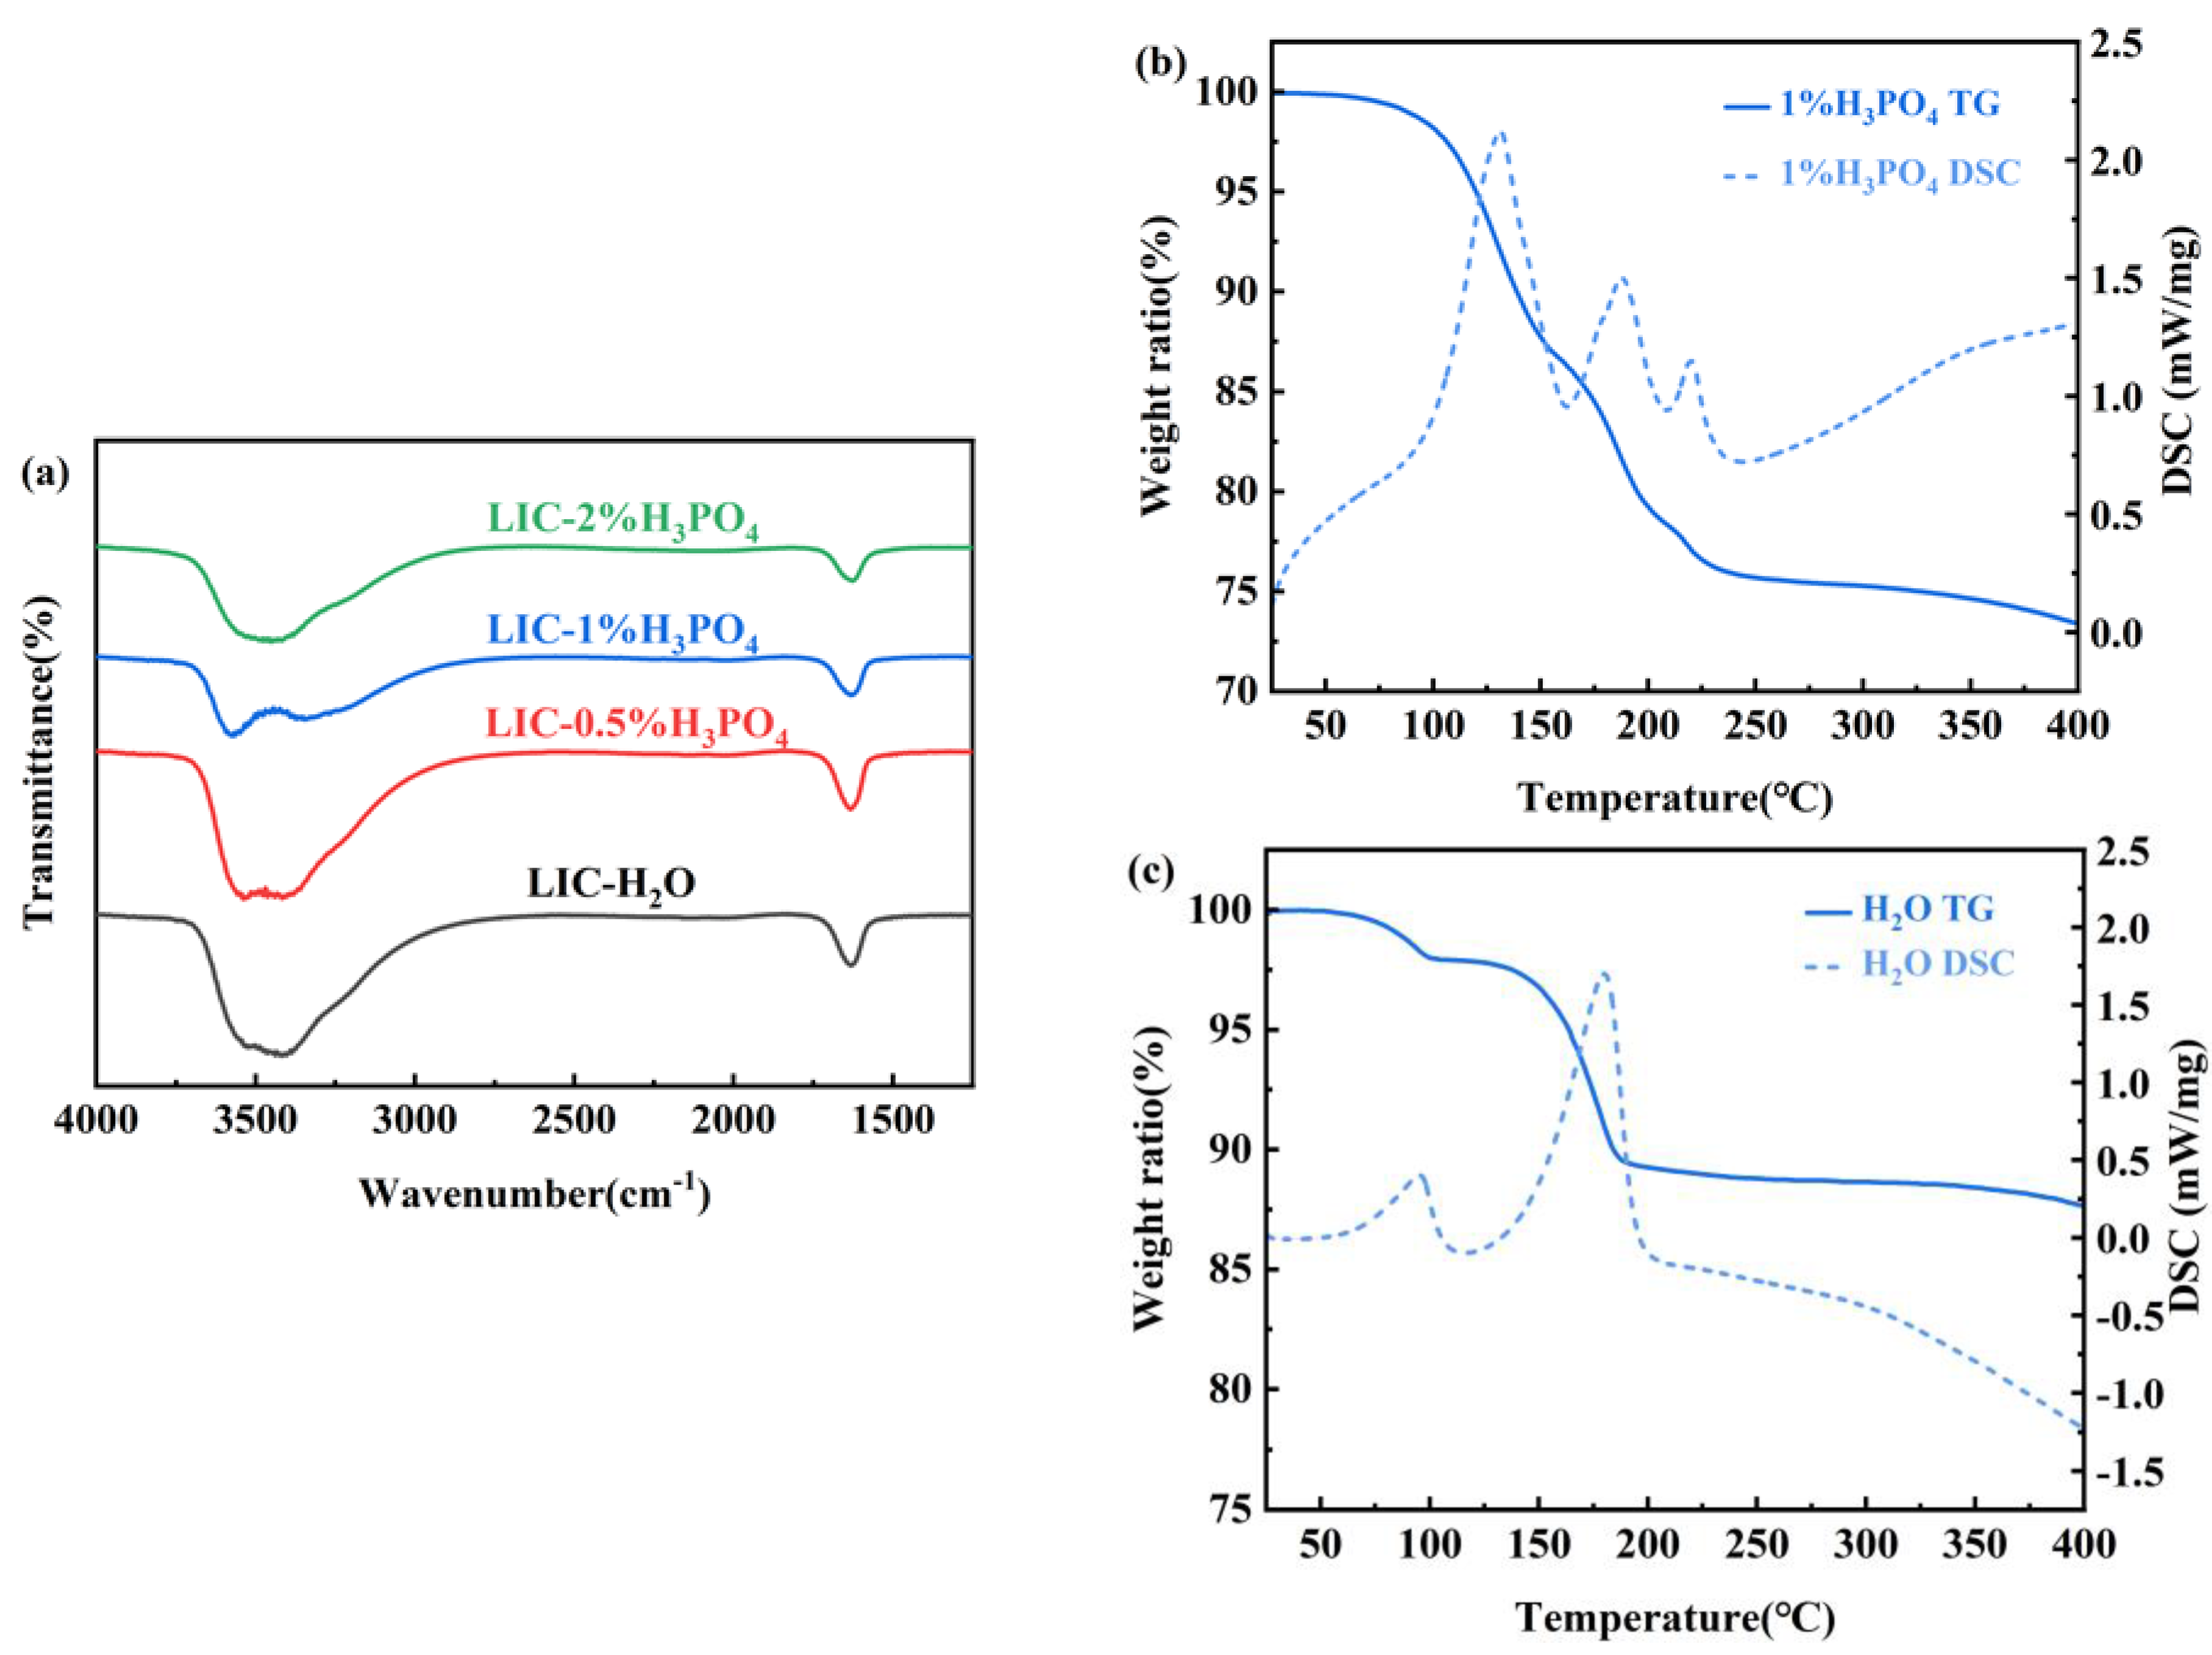
Figure 7a shows the Fourier transform infrared (FTIR) spectra of LIC powders synthesized with varying H
3PO
4 concentrations. The peak at 3500 cm
−1 corresponds to hydroxyl group vibrations. The LIC-H
2O sample exhibits the highest peak intensity at 3500 cm
−1, indicating the highest crystalline water content in the pure water-synthesized sample. Upon H
3PO
4 addition, the hydroxyl peak intensity gradually decreases, reaching its minimum at 1% H
3PO
4, which corresponds to the lowest crystalline water content. The progressive reduction of hydroxyl peaks (3500 cm
−1) with increasing H
3PO
4 concentration directly correlates with phosphorus-mediated suppression of crystalline water. However, further increasing the H
3PO
4 concentration to 2% results in no significant reduction in hydroxyl peak intensity, suggesting that H
3PO
4 concentrations above 1% have limited efficacy in reducing crystalline water. According to Sacci et al. [
9], crystalline water in the sample undergoes hydrolysis during thermal dehydration, generating oxide impurities such as InOCl and In
2O
3 via the following reactions:
Therefore, the reduction of the water of crystallization content in the precursor is conducive to obtaining purer LIC samples.
Figure 7b presents the thermogravimetric (TG) curve of the LIC precursor powder synthesized in 1% H
3PO
4. The dehydration process concludes at 250 °C, justifying the selection of this temperature for precursor dehydration. The TG curve exhibits three endothermic peaks across the temperature ranges of 100–150 °C, 150–200 °C, and 200–250 °C. The weight loss in the interval of 100–150 °C mainly originates from the free water and H
3PO
4 solution not removed from the sample surface, while 150–200 °C is the process of dehydration of the water of crystallization in the precursor samples, in which the precursor Li
3InCl
6·nH
2O removes the water of crystallization to form Li
3InCl
6. Since the sample is susceptible to oxidation by the water of crystallization to form In
2O
3 impurities during the dehydration process, resulting in a drastic decrease in the ionic conductivity of the sample, a high degree of vacuum must be ensured during the dehydration process. The heat absorption peaks in the range of 200–250 °C correspond to the reaction of PO
43− in the sample with the In
3+ and Li
+ in the sample to form LiIn(P
2O
7). The lack of a 200–250 °C DSC peak in LIC-H
2O (
Figure 7c) confirms that the observed thermal event in H
3PO
4-containing samples arises from phosphate-specific reactivity. The dehydration mechanism involving PO
43− → P
2O
7⁴
− transformation is attributed to H
3PO
4-derived phosphorus species [
17,
18]. This process generates LiIn(P
2O
7), a key contributor to ionic conductivity enhancement [
19].
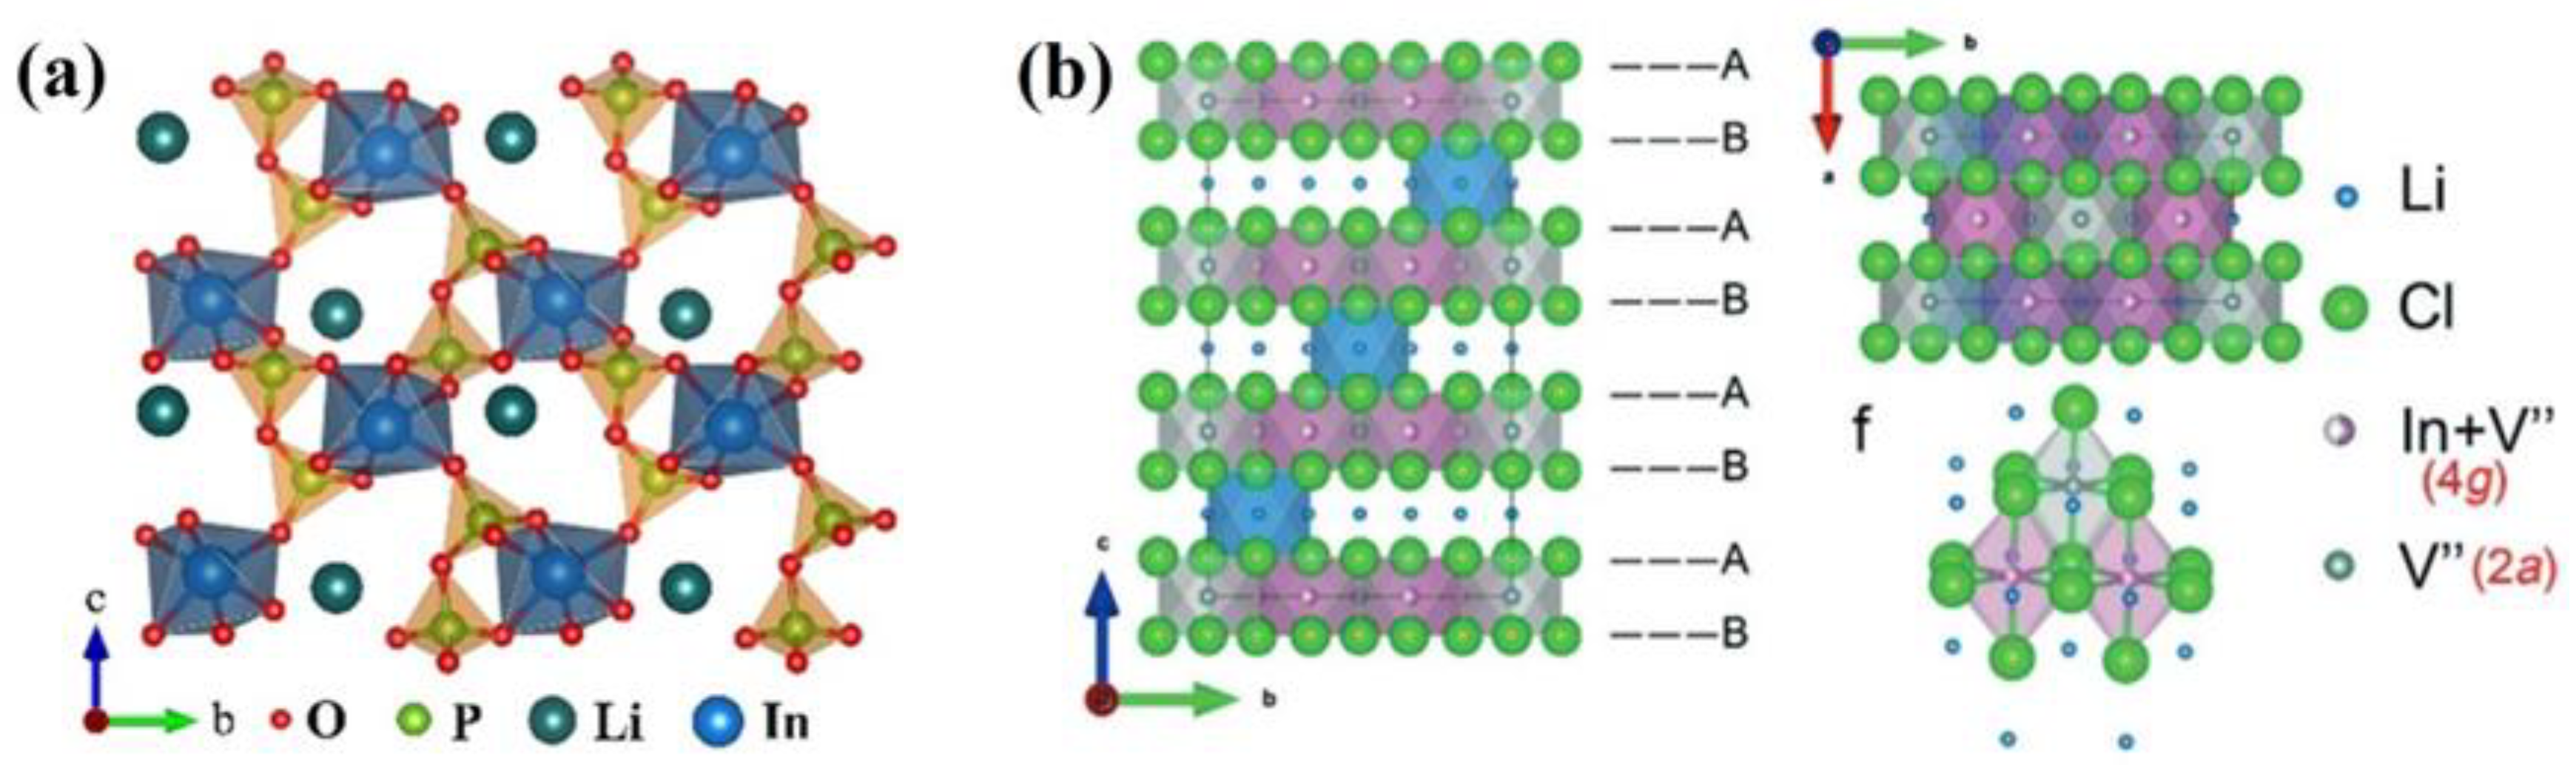
Kartini et al. demonstrated that compositing P
2O
74− with solid-state electrolytes can significantly enhance ionic conductivity due to the exceptional crystal structure of P
2O
74− [
11]. LiIn(P
2O
7) crystallizes in the triclinic system with the space group P-1, and its crystal structure is illustrated in
Figure 8a [
19]. In contrast, Li
3InCl
6 adopts a monoclinic structure with the space group C2/m, as shown in
Figure 8b [
8]. The composite of LiIn(P
2O
7) and LIC introduces a mixed-anion effect, where In
3+ ions coordinate with P
2O
74− groups to form a continuous framework rich in vacancies. This framework facilitates efficient Li
+ ion transport, thereby improving the overall ionic conductivity of the electrolyte. While PO
43− reacts with a fraction of In
3+/Li
+ to form LiIn(P
2O
7), the composite’s synergistic Li
+ transport mechanisms ensure net conductivity enhancement, as evidenced by the 1.15 × 10
−3 S/cm value for LIC-1% H
3PO
4 (
Table 1). In summary, H
3PO
4 addition achieves dual objectives; on the one hand, H
3PO
4 can minimize hydrolysis-derived impurities (InOCl/In
2O
3), and on the other hand, addition of H
3PO
4 generates LiIn(P
2O
7) with P
2O
74− enabled Li
+ pathways. The optimal 1% H
3PO
4 concentration balances these effects, yielding the highest conductivity.


