
Controlled Synthesis and Absorption Mechanism Study of FCI@UFC Absorbents

Abstract
1. Introduction
2. Experimental Section
2.1. Raw Materials
2.2. Synthesis of FCI@UFC
2.3. Coating Preparation
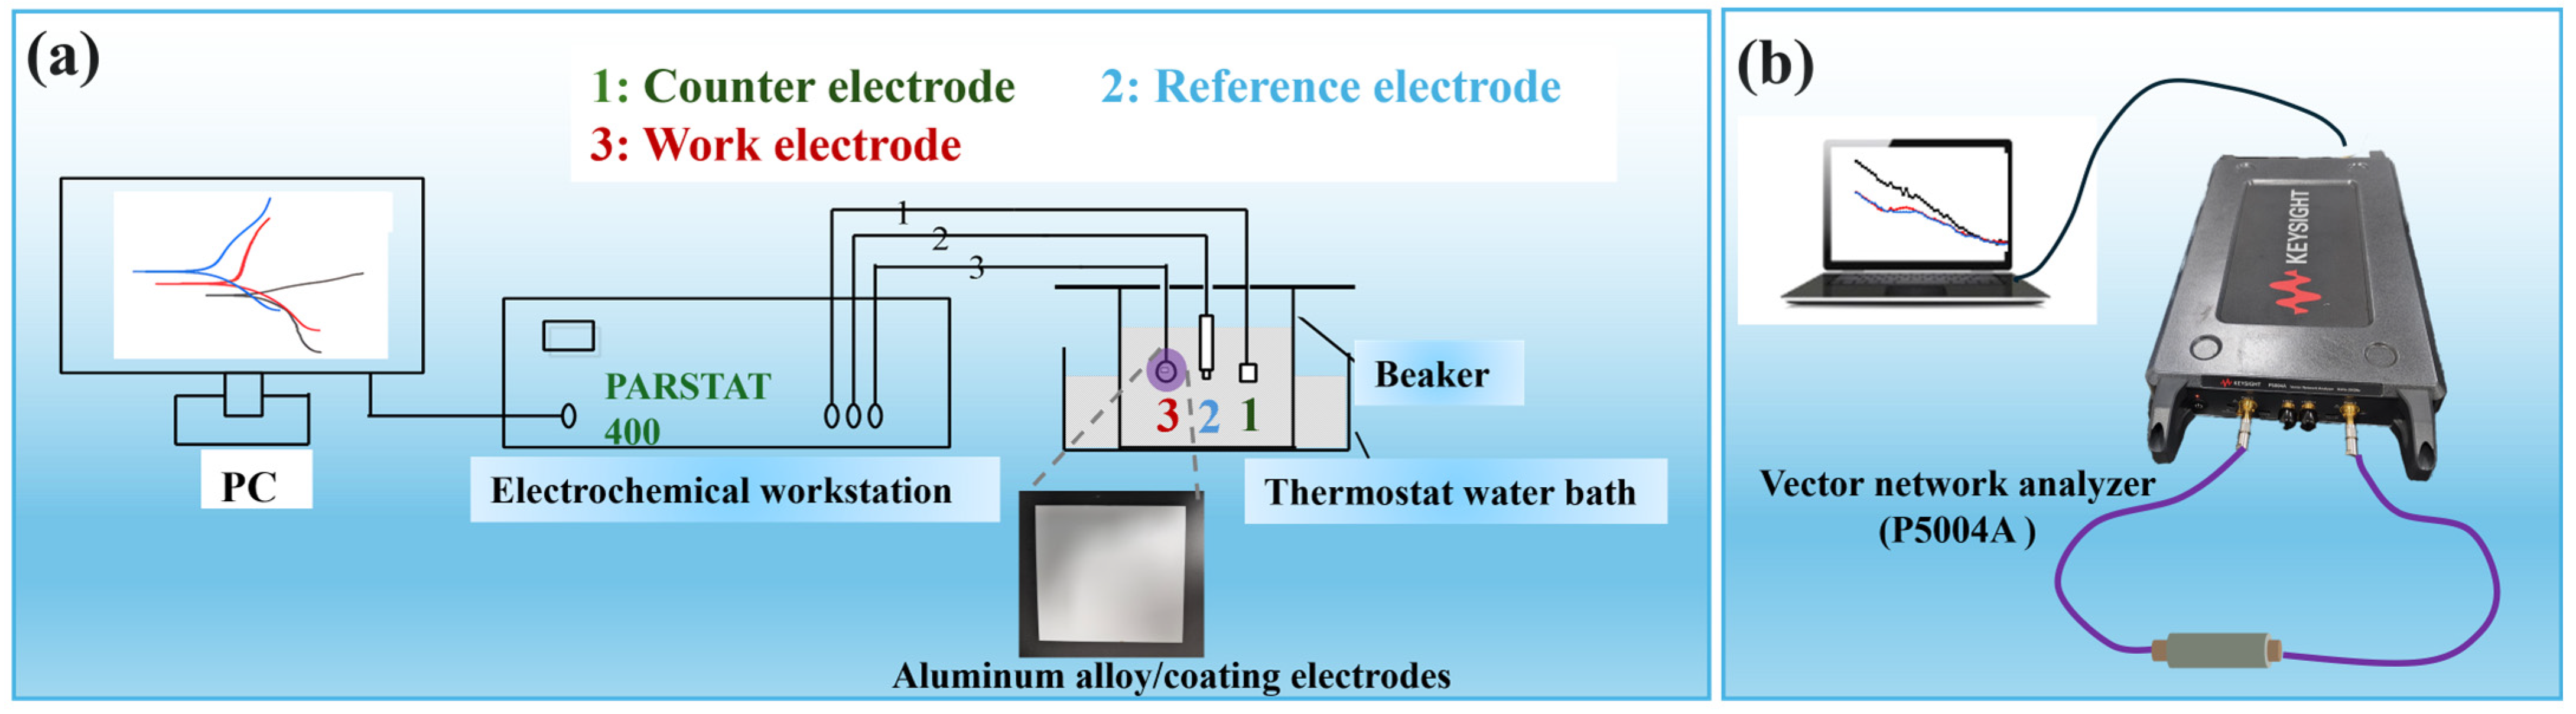
2.4. Characterization Methods
3. Results and Discussion
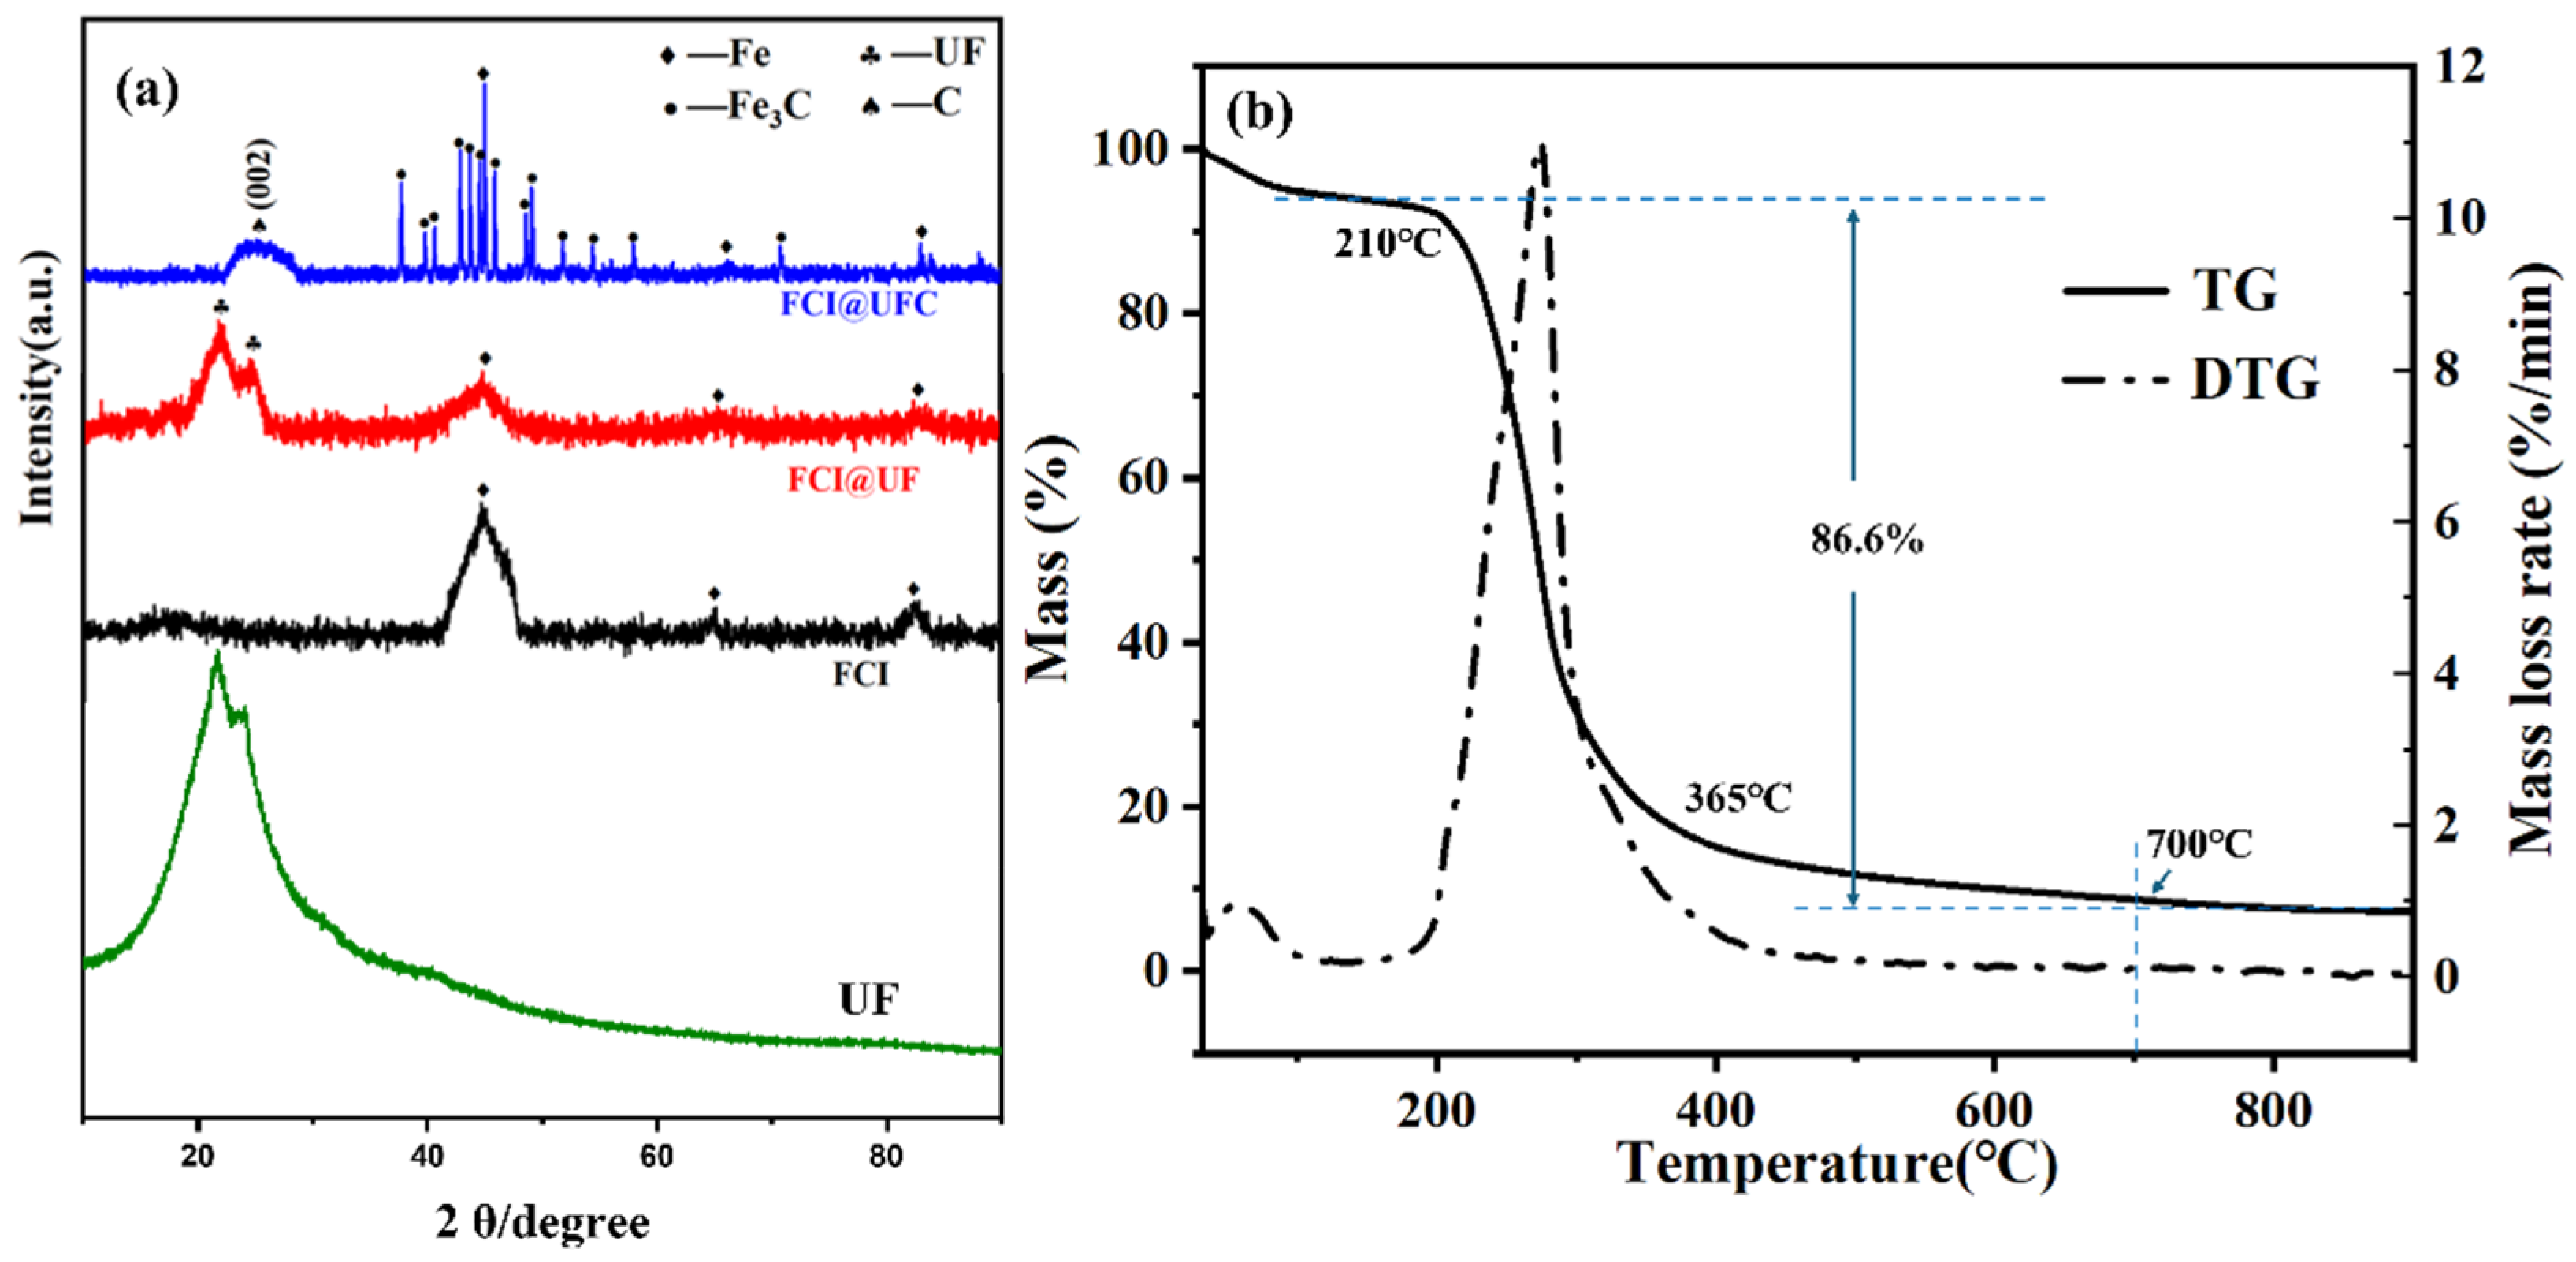
3.1. Phase Analysis
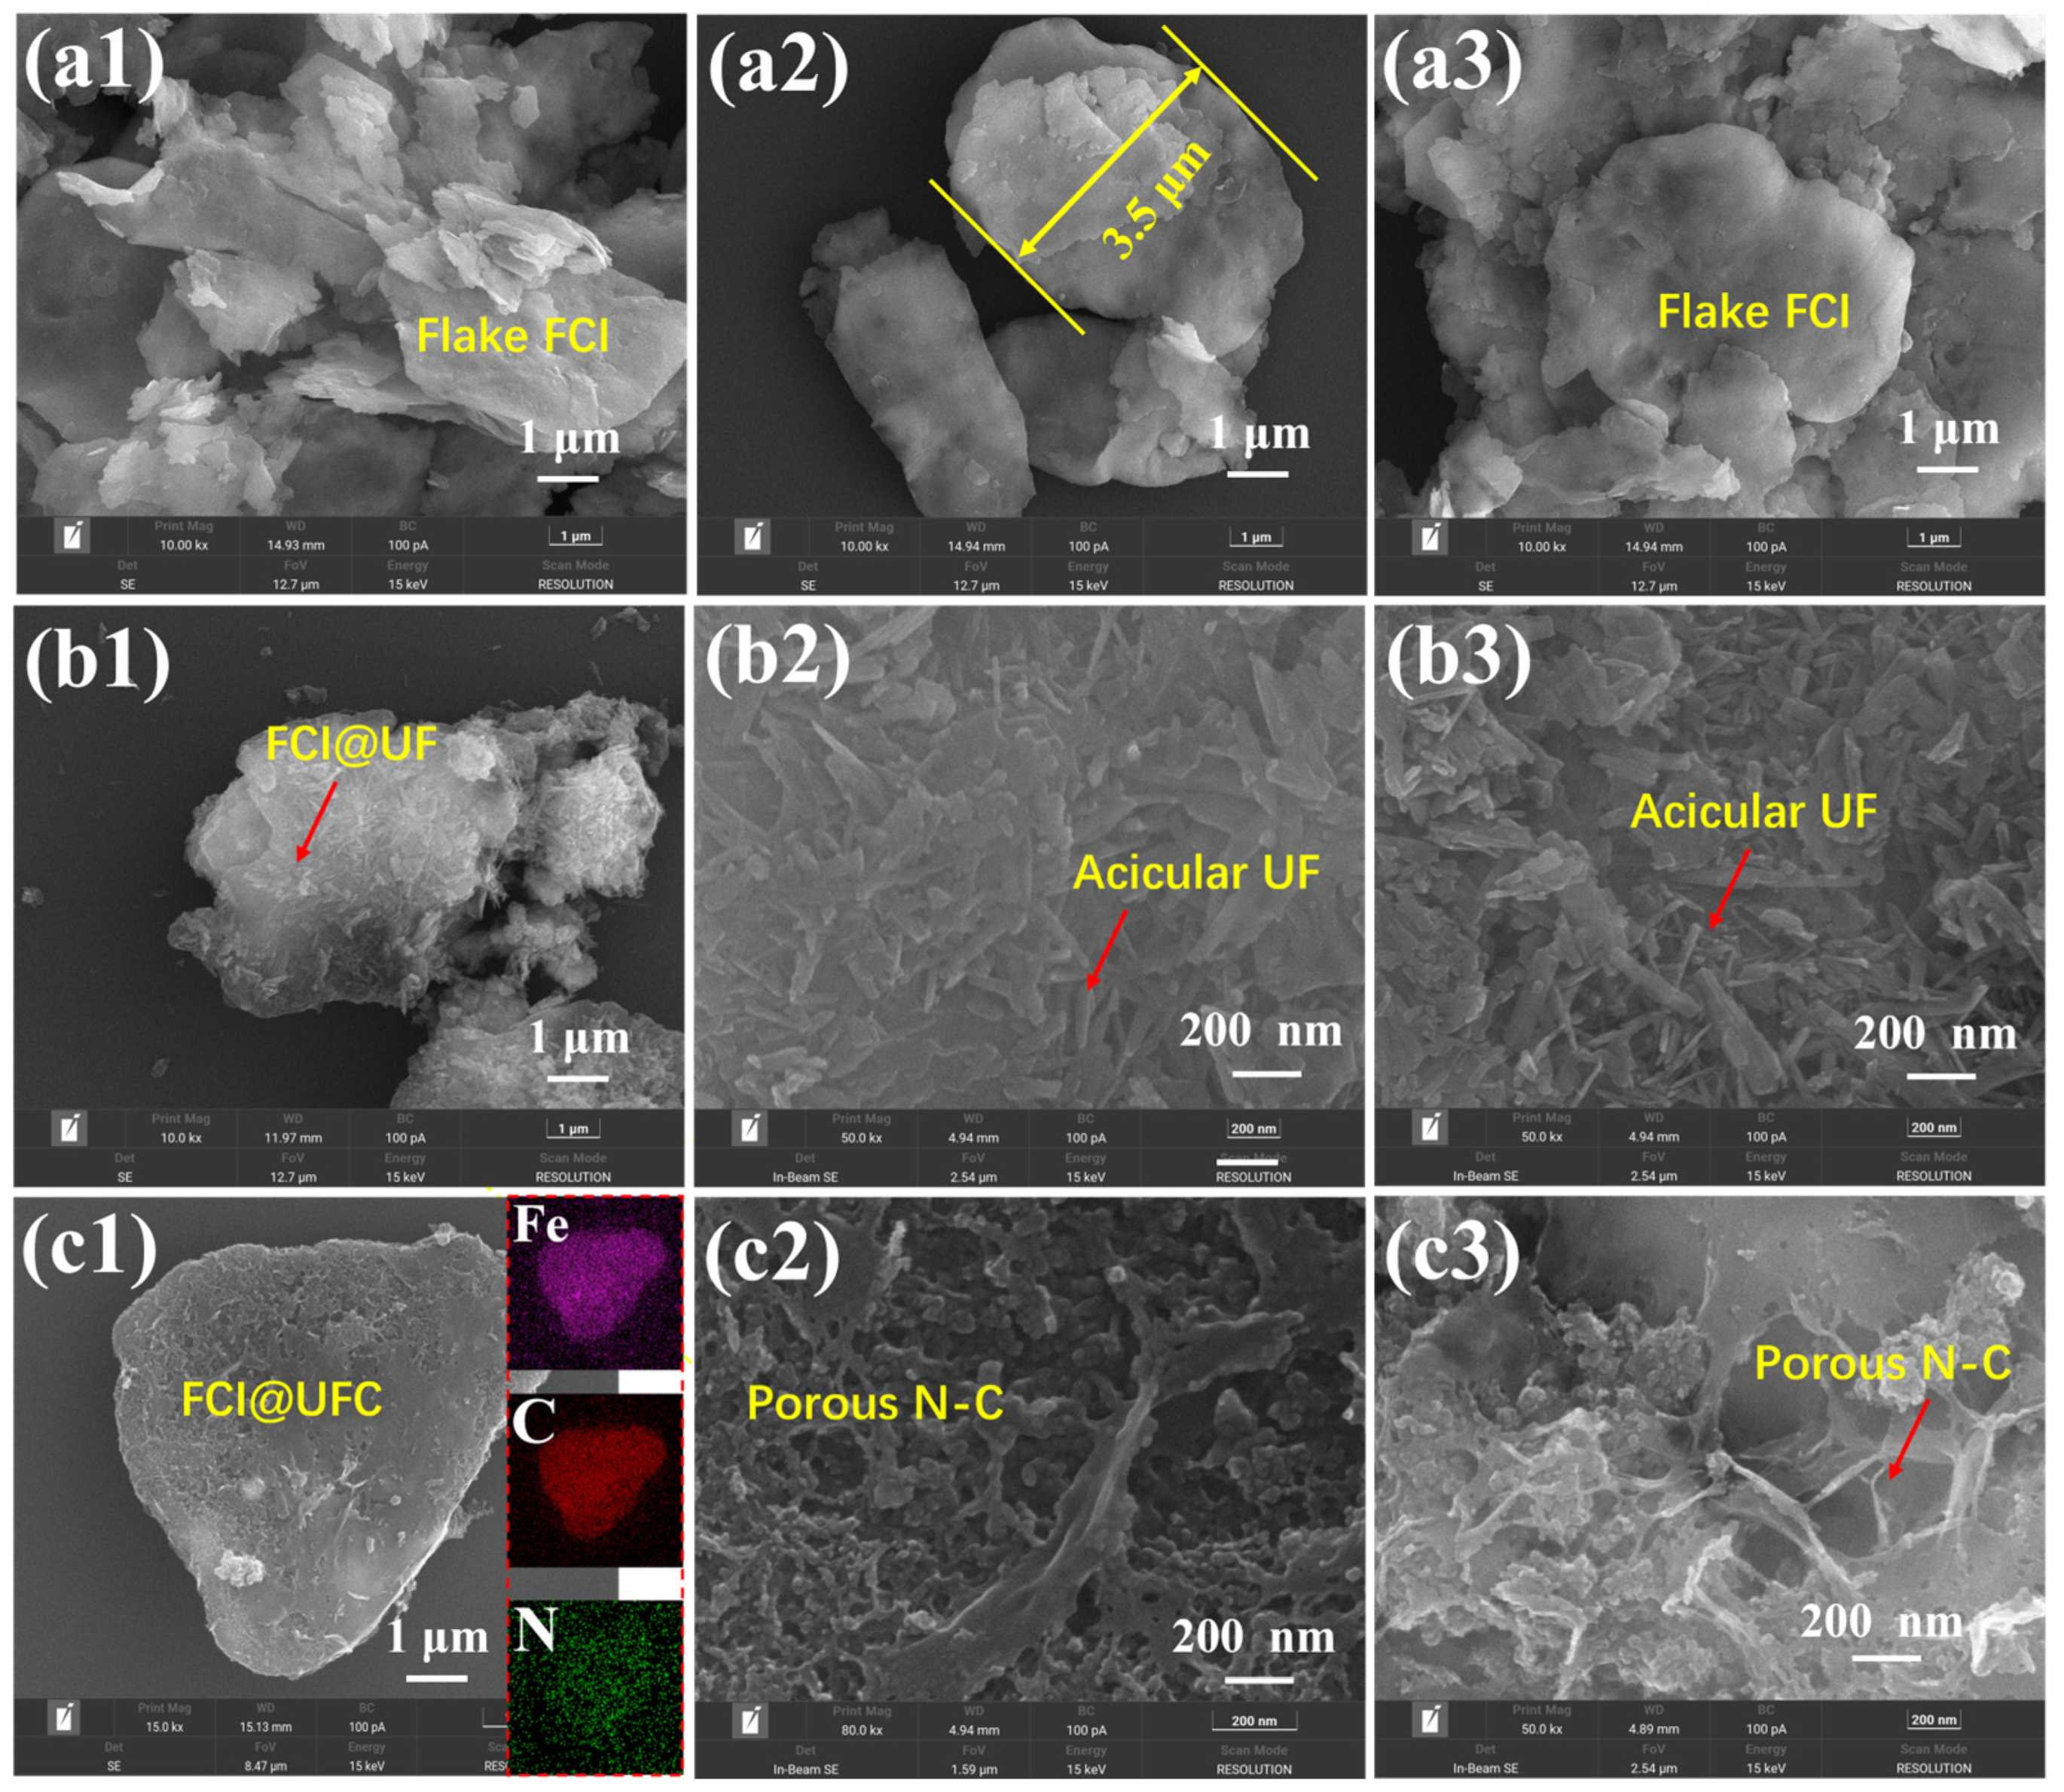
3.2. Powder Morphology and Microstructure
3.3. Microwave Absorption Performance
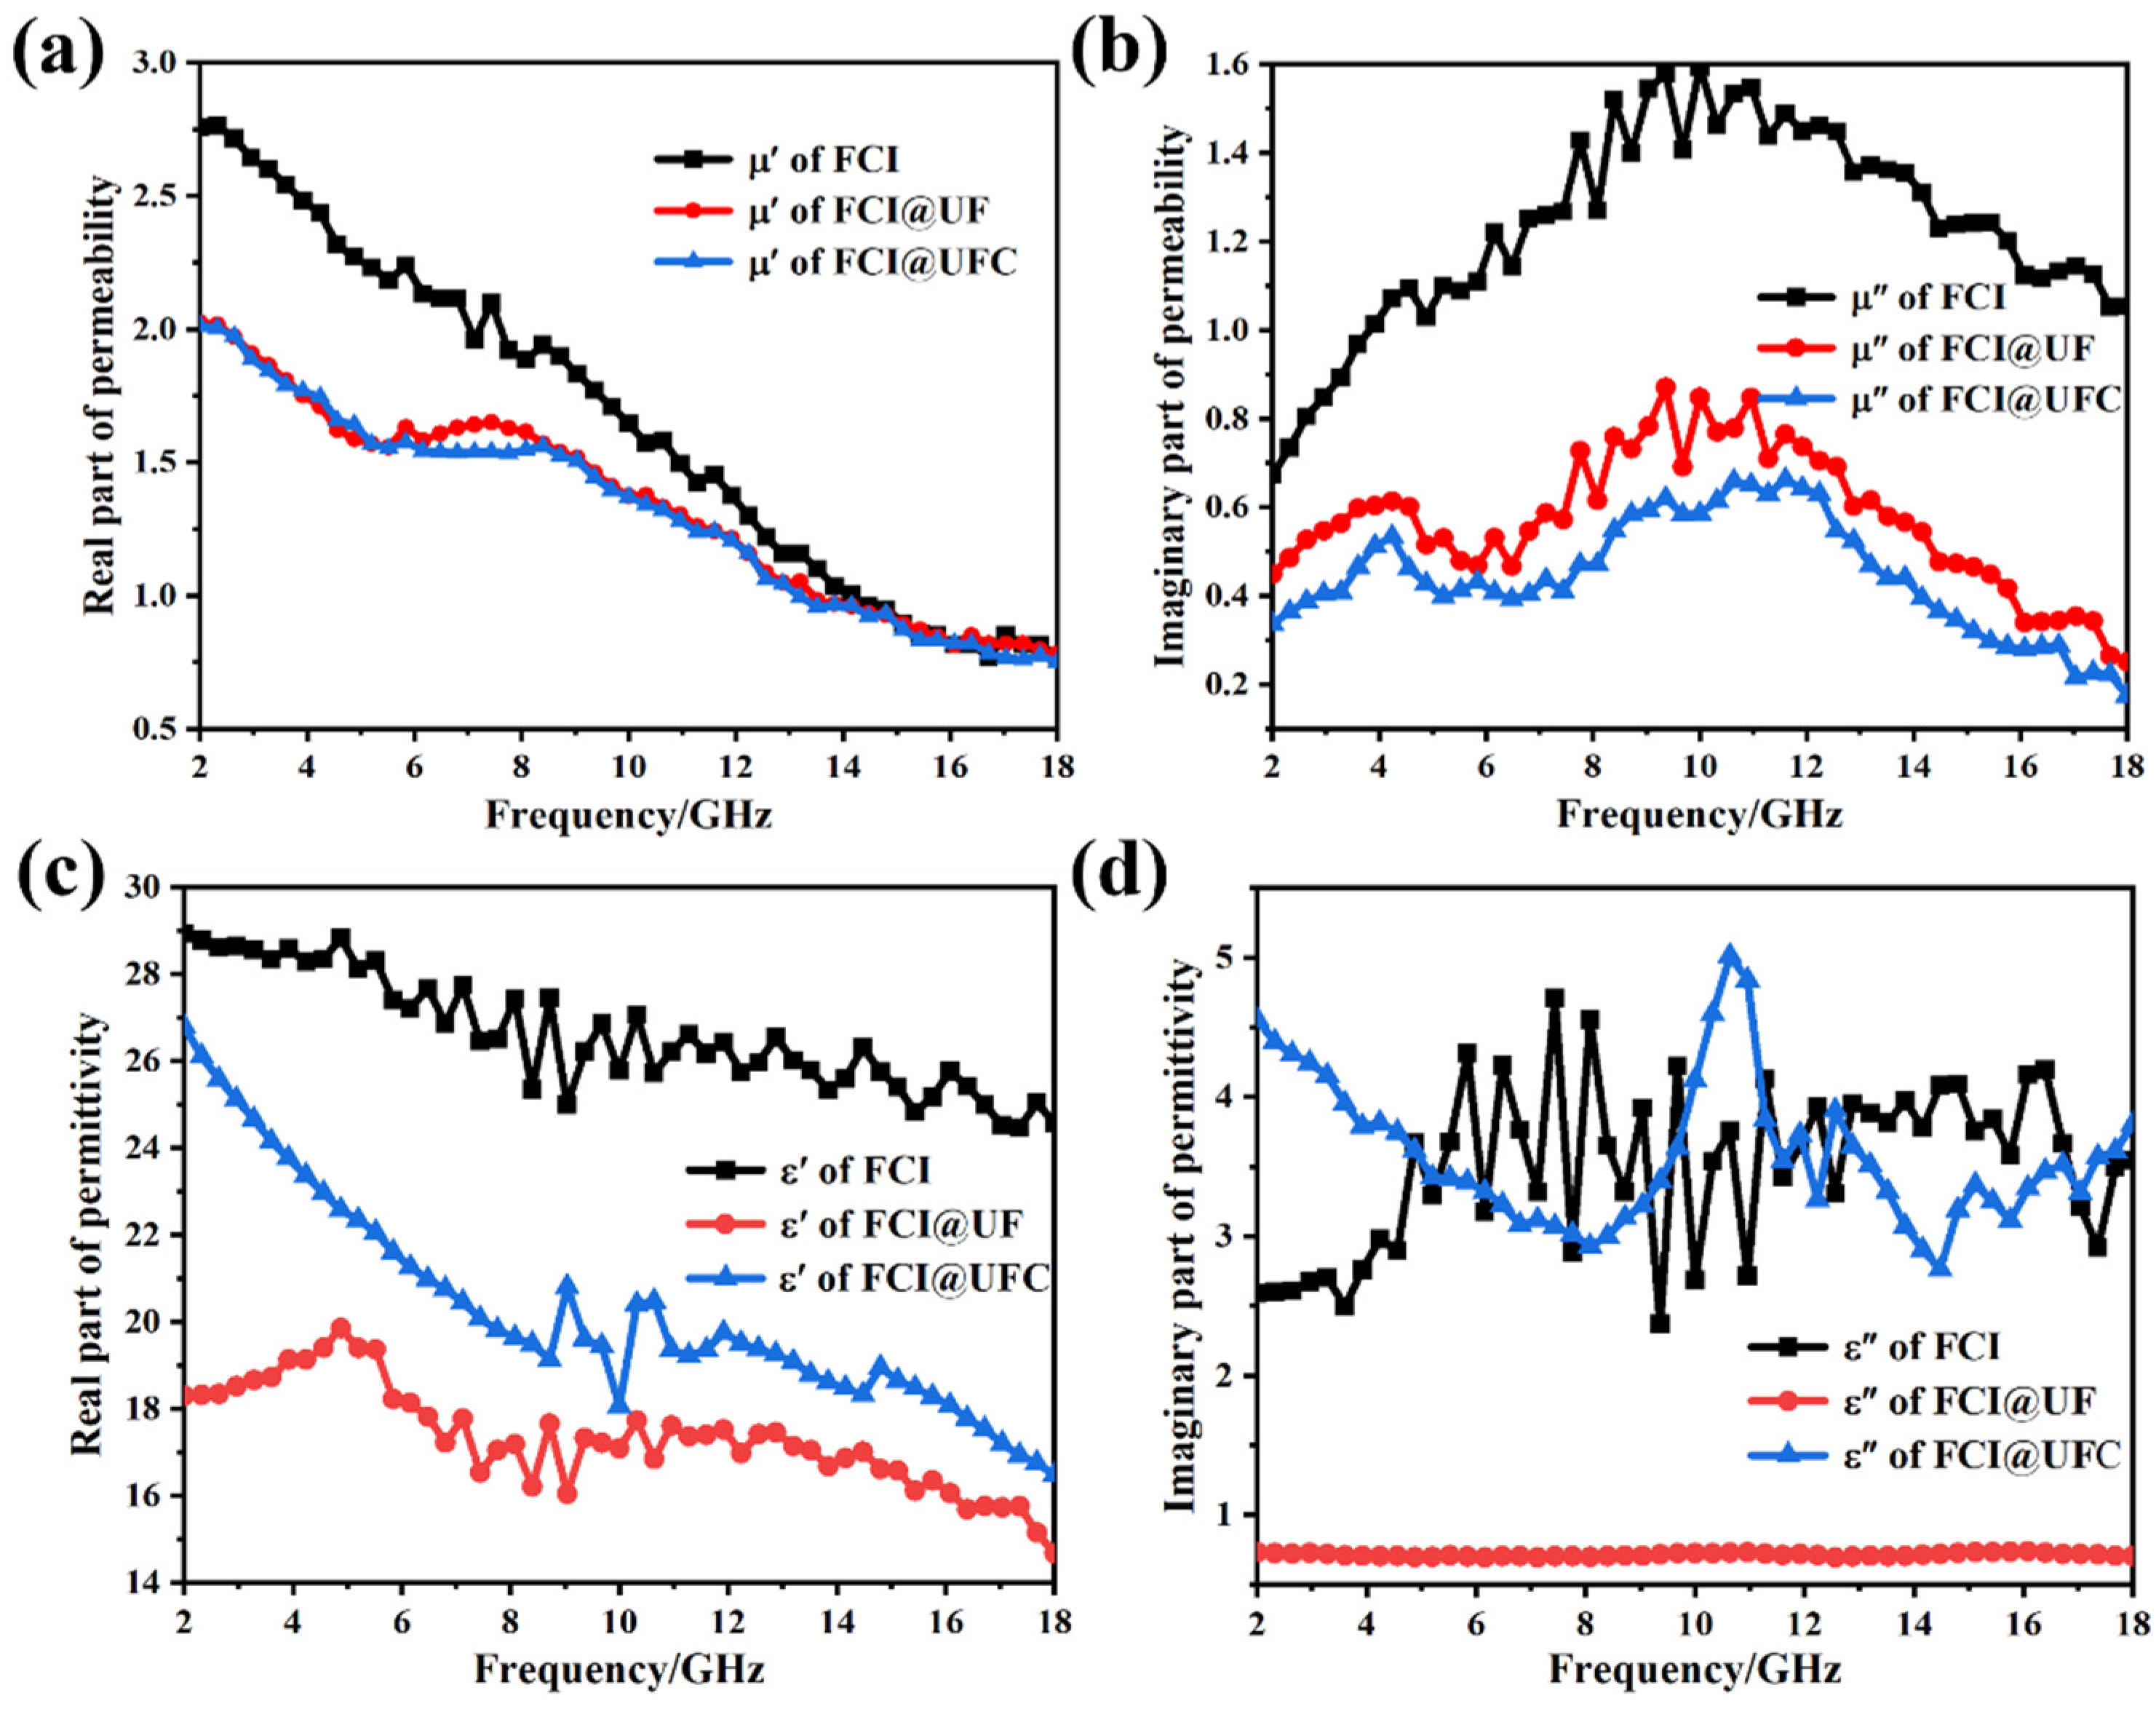
3.3.1. Electromagnetic Response Characteristics
3.3.2. Electromagnetic Wave Absorption Characteristics
3.4. Corrosion Resistance
4. Conclusions
Author Contributions
Funding
Institutional Review Board Statement
Informed Consent Statement
Data Availability Statement
Conflicts of Interest
References
- Ahmad, H.; Tariq, A.; Shehzad, A.; Faheem, M.S.; Shafiq, M.; Rashid, I.A.; Afzal, A.; Munir, A.; Riaz, M.T.; Haider, H.T. Stealth technology: Methods and composite materials—A review. Polym. Compos. 2019, 40, 4457–4472. [Google Scholar] [CrossRef]
- Vinoy, K.J.; Jha, R.M. Radar Absorbing Materials; Springer: New York, NY, USA, 1996. [Google Scholar]
- Kostishin, V.G.; Isaev, I.M.; Salogub, D.V. Radio-Absorbing Magnetic Polymer Composites Based on Spinel Ferrites: A Review. Polymers 2024, 16, 1003. [Google Scholar] [CrossRef] [PubMed]
- Delfini, A.; Albano, M.; Vricella, A.; Santoni, F.; Marchetti, M. Advanced Radar Absorbing Ceramic-Based Materials for Multifunctional Applications in Space Environment. Materials 2018, 11, 1730. [Google Scholar] [CrossRef] [PubMed]
- Jang, W.; Mallesh, S.; Lee, S.B.; Kim, K. Microwave absorption properties of core-shell structured FeCoNi@PMMA filled in composites. Curr. Appl. Phys. 2020, 20, 525. [Google Scholar] [CrossRef]
- Qiao, L.; Han, R.; Wang, T.; Tang, L.; Li, F. Greatly enhanced microwave absorbing properties of planar anisotropy carbonyl-iron particle composites. J. Magn. Magn. Mater. 2015, 375, 100–105. [Google Scholar] [CrossRef]
- Jang, W.; Mallesh, S.; Gu, M.; Kim, K.H. Edge selectively oxidized graphene on carbonyl iron composites for microwave absorption and radar cross-section performance at X- and Ku-band. J. Alloys Compd. 2021, 886, 161230. [Google Scholar] [CrossRef]
- Lv, Z.; Zeng, Z.; Ji, X.; Lu, M. Influence of Lamellar Graphite Additions on the Electro-Magnetic Properties of Carbonyl Iron. Adv. Mater. Res. 2014, 915–916, 690–693. [Google Scholar] [CrossRef]
- Sista, K.S.; Srinivas, K.; Deepak, S.; Gourav, R.; Abhijeet, P. Carbonyl iron powders as absorption material for microwave interference shielding: A review. J. Alloys Compd. 2021, 853, 157251. [Google Scholar] [CrossRef]
- Wang, H.; Wang, M.; Zhang, X.; Lu, Z.; Wen, G. A new type of catalyst allows carbonyl iron powder to be coated with SiO2 for tuned microwave absorption. Surf. Interfaces 2020, 21, 100755. [Google Scholar] [CrossRef]
- Feng, Y.; Qiu, T.; Shen, C. Absorbing properties and structural design of microwave absorbers based on carbonyl iron and barium ferrite. J. Magn. Magn. Mater. 2007, 318, 8–13. [Google Scholar] [CrossRef]
- Wu, X.; Luo, H.; Wan, Y. Preparation of SnO2-coated carbonyl iron flaky composites with enhanced microwave absorption properties. Mater. Lett. 2012, 92, 139–142. [Google Scholar] [CrossRef]
- Jeon, S.; Kim, J.; Kim, K.H. Microwave absorption properties of graphene oxide capsulated carbonyl iron particles. Appl. Surf. Sci. 2019, 475, 1065–1069. [Google Scholar] [CrossRef]
- Zhou, Y.; Xie, H.; Zhou, W.; Ren, Z. Enhanced antioxidation and microwave absorbing properties of SiO2 -coated flaky carbonyl iron particles. J. Magn. Magn. Mater. 2018, 446, 143–149. [Google Scholar] [CrossRef]
- Abshinova, M.A.; Kazantseva, N.E.; Sáha, P.; Sapurina, I.; Kovářová, J.; Stejskal, J. The enhancement of the oxidation resistance of carbonyl iron by polyaniline coating and consequent changes in electromagnetic properties. Polym. Degrad. Stab. 2008, 93, 1826–1831. [Google Scholar] [CrossRef]
- Liu, L.; Duan, Y.; Ma, L.; Liu, S.; Yu, Z. Microwave absorption properties of a wave-absorbing coating employing carbonyl-iron powder and carbon black. Appl. Surf. Sci. 2010, 257, 842–846. [Google Scholar] [CrossRef]
- Dong, C.; Sun, D.; Li, W. A Quantitative Method for the Composition of 7B05 Cast-Rolled Aluminum Alloys Based on Micro-Beam X-ray Fluorescence Spectroscopy and Its Application in Element Segregation of Recrystallization. Materials 2023, 16, 1605. [Google Scholar] [CrossRef]
- Shen, L.; Chen, H.; Che, X.; Wang, Y. Stress corrosion cracking behavior of laser-MIG hybrid welded 7B05-T5 aluminum alloy. Corros. Sci. 2019, 165, 108417. [Google Scholar] [CrossRef]
- Maiti, S.; Shrivastava, N.K.; Suin, S.; Khatua, B. Polystyrene/MWCNT/graphite nanoplate nanocomposites: Efficient electromagnetic interference shielding material through graphite nanoplate-MWCNT-graphite nanoplate networking. Appl. Mater. Interfaces 2013, 5, 4712–4724. [Google Scholar] [CrossRef]
- Chen, Y.J.; Gao, P.; Wang, R.X.; Zhu, C.L.; Jin, H.B. Porous Fe3O4/SnO2 Core/Shell Nanorods: Synthesis and Electromagnetic Properties. Phys. Chem. C 2011, 115, 13603–13608. [Google Scholar] [CrossRef]
- Miles, P.A.; Westphal, W.B.; Von Hippel, A. Dielectric Spectroscopy of Ferromagnetic Semiconductors. Rev. Mod. Phys. 1957, 29, 279–307. [Google Scholar] [CrossRef]
- Li, S.-G.; Liu, R.-T.; Xiong, X. Preparation and characterization of carbonyl iron soft magnetic composites with magnesioferrite insulating coating layer. Trans. Nonferrous Met. Soc. China 2020, 30, 3067–3077. [Google Scholar] [CrossRef]
- Park, B.-D.; Jeong, H.-W. Hydrolytic stability and crystallinity of cured urea–formaldehyde resin adhesives with different formaldehyde/urea mole ratios. Int. J. Adhes. Adhes. 2011, 31, 524–529. [Google Scholar] [CrossRef]
- Du, H.; Jiang, J.; Ren, L.; He, Q.; Wang, Y. Fe3C/Fe@N-doped porous carbon composites with excellent microwave absorption properties. Colloids Surfaces A Physicochem. Eng. Asp. 2023, 670, 131564. [Google Scholar] [CrossRef]
- Ahangari, M.G.; Fereidoon, A.; Jahanshahi, M.; Sharifi, N. Effect of nanoparticles on the micromechanical and surface properties of poly(urea–formaldehyde) composite microcapsules. Compos. Part B Eng. 2014, 56, 450–455. [Google Scholar] [CrossRef]
- Tiwari, D.; Bhunia, H.; Bajpai, P.K. Synthesis of nitrogen enriched porous carbons from urea formaldehyde resin and their carbon dioxide adsorption capacity. J. CO2 Util. 2017, 21, 302–313. [Google Scholar] [CrossRef]
- Yan, T.; Wang, J.; Wu, Q.; Huo, S.; Duan, H. MOF-derived graphitized porous carbon/Fe–Fe3C nanocomposites with broadband and enhanced microwave absorption performance. J. Mater. Sci. Mater. Electron. 2019, 30, 12012–12022. [Google Scholar] [CrossRef]
- Dai, W.; Chen, F.; Luo, H.; Xiong, Y.; Wang, X.; Cheng, Y.; Gong, R. Synthesis of yolk-shell structured carbonyl iron@void@nitrogen doped carbon for enhanced microwave absorption performance. J. Alloys Compd. 2019, 812, 152083. [Google Scholar] [CrossRef]
- Xing, H.; Chen, Z.; Fan, P.; Liu, Z.; Yang, P.; Ji, X. Polyindole-Derived Nitrogen-Doped Carbon Nanosphere/Al2O3 Composites with High-Performance Microwave Absorption. ACS Appl. Electron. Mater. 2023, 5, 559–570. [Google Scholar] [CrossRef]
- Wang, Q.; Niu, B.; Han, Y. Nature-inspired 3D hierarchical structured “vine” for efficient microwave attenuation and electromagnetic energy conversion device. Chem. Eng. J. 2022, 452, 139042. [Google Scholar] [CrossRef]
- Weng, X.; Li, B.; Zhang, Y.; Lv, X.; Gu, X. Synthesis of flake shaped carbonyl iron/reduced graphene oxide/polyvinyl pyrrolidone ternary nanocomposites and their microwave absorbing properties. J. Alloys Compd. 2017, 695, 508–519. [Google Scholar] [CrossRef]
- Zhang, X.; Guo, Y.; Ali, R.; Tian, W.; Jian, X. Bifunctional carbon-encapsulated FeSiAl hybrid flakes for enhanced microwave absorption properties and analysis of corrosion resistance. J. Alloys Compd. 2020, 828, 154079. [Google Scholar] [CrossRef]
- Liu, Q.; Zhang, D.; Fan, T. Electromagnetic wave absorption properties of porous carbon/Co nanocomposites. Appl. Phys. Lett. 2008, 93, 013110. [Google Scholar] [CrossRef]
- Maosheng, C.; Jincheng, S. Graphene-based Electromagnetic Functional Materials. Surf. Technol. 2020, 49, 29–40. [Google Scholar] [CrossRef]
- Ye, X.; Gao, Q.; He, E.; Yang, C.; Yang, P.; Yan, T.; Ye, Y.; Wu, H. Graphene/carbonyl iron powder composite microspheres enhance electromagnetic absorption of 3D printing composites. J. Alloys Compd. 2022, 937, 168443. [Google Scholar] [CrossRef]
- Qin, M.; Zhang, L.; Wu, H. Dielectric Loss Mechanism in Electromagnetic Wave Absorbing Materials. Adv. Sci. 2022, 9, e2105553. [Google Scholar] [CrossRef]
- Zeng, X.; Cheng, X.; Yu, R.; Stucky, G.D. Electromagnetic microwave absorption theory and recent achievements in microwave absorbers. Carbon 2020, 168, 606–623. [Google Scholar] [CrossRef]
- Wang, X.; Pan, F.; Xiang, Z.; Zeng, Q.; Pei, K.; Che, R.; Lu, W. Magnetic vortex core-shell Fe3O4@C nanorings with enhanced microwave absorption performance. Carbon 2019, 157, 130–139. [Google Scholar] [CrossRef]
- Sun, J.; He, Z.; Dong, Z.; Wu, W.; Tong, W.; Guo, X. Broadband and strong microwave absorption of Fe/Fe3C/C core–shell spherical chains enhanced by dual dielectric relaxation and dual magnetic resonances. J. Alloys Compd. 2018, 782, 193–202. [Google Scholar] [CrossRef]
- Li, X.; Yan, H.; He, C.; Wei, W.; Fan, F.; Shi, Z.; Dan, J.; Wen, X.; Lv, Y. Synthesis of double-shell carbonyl iron powder@ SiO2@ C for enhanced electromagnetic wave absorption. J. Alloys Compd. 2023, 976, 173233. [Google Scholar] [CrossRef]
- Qiu, X.; Wang, L.; Zhu, H.; Guan, Y.; Zhang, Q. Lightweight and efficient microwave absorbing materials based on walnut shell-derived nano-porous carbon. Nanoscale 2017, 9, 7408–7418. [Google Scholar] [CrossRef]
- Jiang, X.; Wan, W.; Wang, B.; Wang, B.; Zhang, L.; Yin, L.; Bui, H.; Xie, J.; Zhang, L.; Lu, H. Enhanced anti-corrosion and microwave absorption performance with carbonyl iron modified by organic fluorinated chemicals. Appl. Surf. Sci. 2022, 572, 151320. [Google Scholar] [CrossRef]
- Li, Y.; Li, X.; Jin, K.; Wang, C.; Guo, W.; Tian, K.; Wang, H. Enduring effect mechanism of Co(Ni) layers on excellent microwave absorption performance of carbonyl iron in seawater. Magn. Magn. Mater. 2022, 564, 170202. [Google Scholar] [CrossRef]
- Forouzandeh, F.; Li, X.; Banham, D.W.; Feng, F.; Ye, S.; Birss, V. Understanding the Corrosion Resistance of Meso- and Micro-Porous Carbons for Application in PEM Fuel Cells. J. Electrochem. Soc. 2018, 165, F3230–F3240. [Google Scholar] [CrossRef]
- Shen, Y.; Li, K.; Chen, H.; Wu, Z.; Wang, Z. Superhydrophobic F-SiO2@ PDMS composite coatings prepared by a two-step spraying method for the interface erosion mechanism and anti-corrosive applications. Chem. Eng. J. 2020, 413, 127455. [Google Scholar] [CrossRef]
- Yadav, A.; Kumar, R.; Choudhary, H.K.; Sahoo, B. Graphene-oxide coating for corrosion protection of iron particles in saline water. Carbon 2018, 140, 477–487. [Google Scholar] [CrossRef]
- McCafferty, E. Validation of corrosion rates measured by the Tafel extrapolation method. Corros. Sci. 2005, 47, 3202–3215. [Google Scholar] [CrossRef]
- Zhang, Y.; Zhang, J.; Wang, X.; Liu, Z.; Bi, S.; Hou, Z. Metal-organic frameworks derived carbon nanotube and carbonyl iron composite materials for broadband microwave absorbers with a wide filling range. J. Magn. Magn. Mater. 2022, 555, 169391. [Google Scholar] [CrossRef]
- Min, D.; Zhou, W.; Qing, Y.; Luo, F.; Zhu, D. Highly oriented flake carbonyl iron/carbon fiber composite as thin-thickness and wide-bandwidth microwave absorber. J. Alloys Compd. 2018, 744, 629–636. [Google Scholar] [CrossRef]
- Chen, J.; Lei, W.; Huang, C.; Wang, J.; Zhang, Y.; Liu, Z.; Xu, Z.; Wang, K.; Guo, S. Magneto-electric adjustable Co/C porous layer coated flaky carbonyl iron composites with bifunctions of anti-corrosion and microwave absorption. J. Alloys Compd. 2022, 927, 167104. [Google Scholar] [CrossRef]


| Composites | RLmin (dB) | Thickness (mm) | EAB (−10 dB) (GHz) | Percentage (wt %) | Ref. |
|---|---|---|---|---|---|
| FCI@SiO2 | −7 | 1.2 | 0 | 70 | [14] |
| CI/CNT-50 | −23 | 1.5 | 5.2 | 50–55 | [42] |
| FCI/CFB(Fiber) | −13.5 | 1.2 | 4.5 | 65 | [43] |
| FCI@Co/C | −72.6 | 1.5 | 6.2 | 60 | [44] |
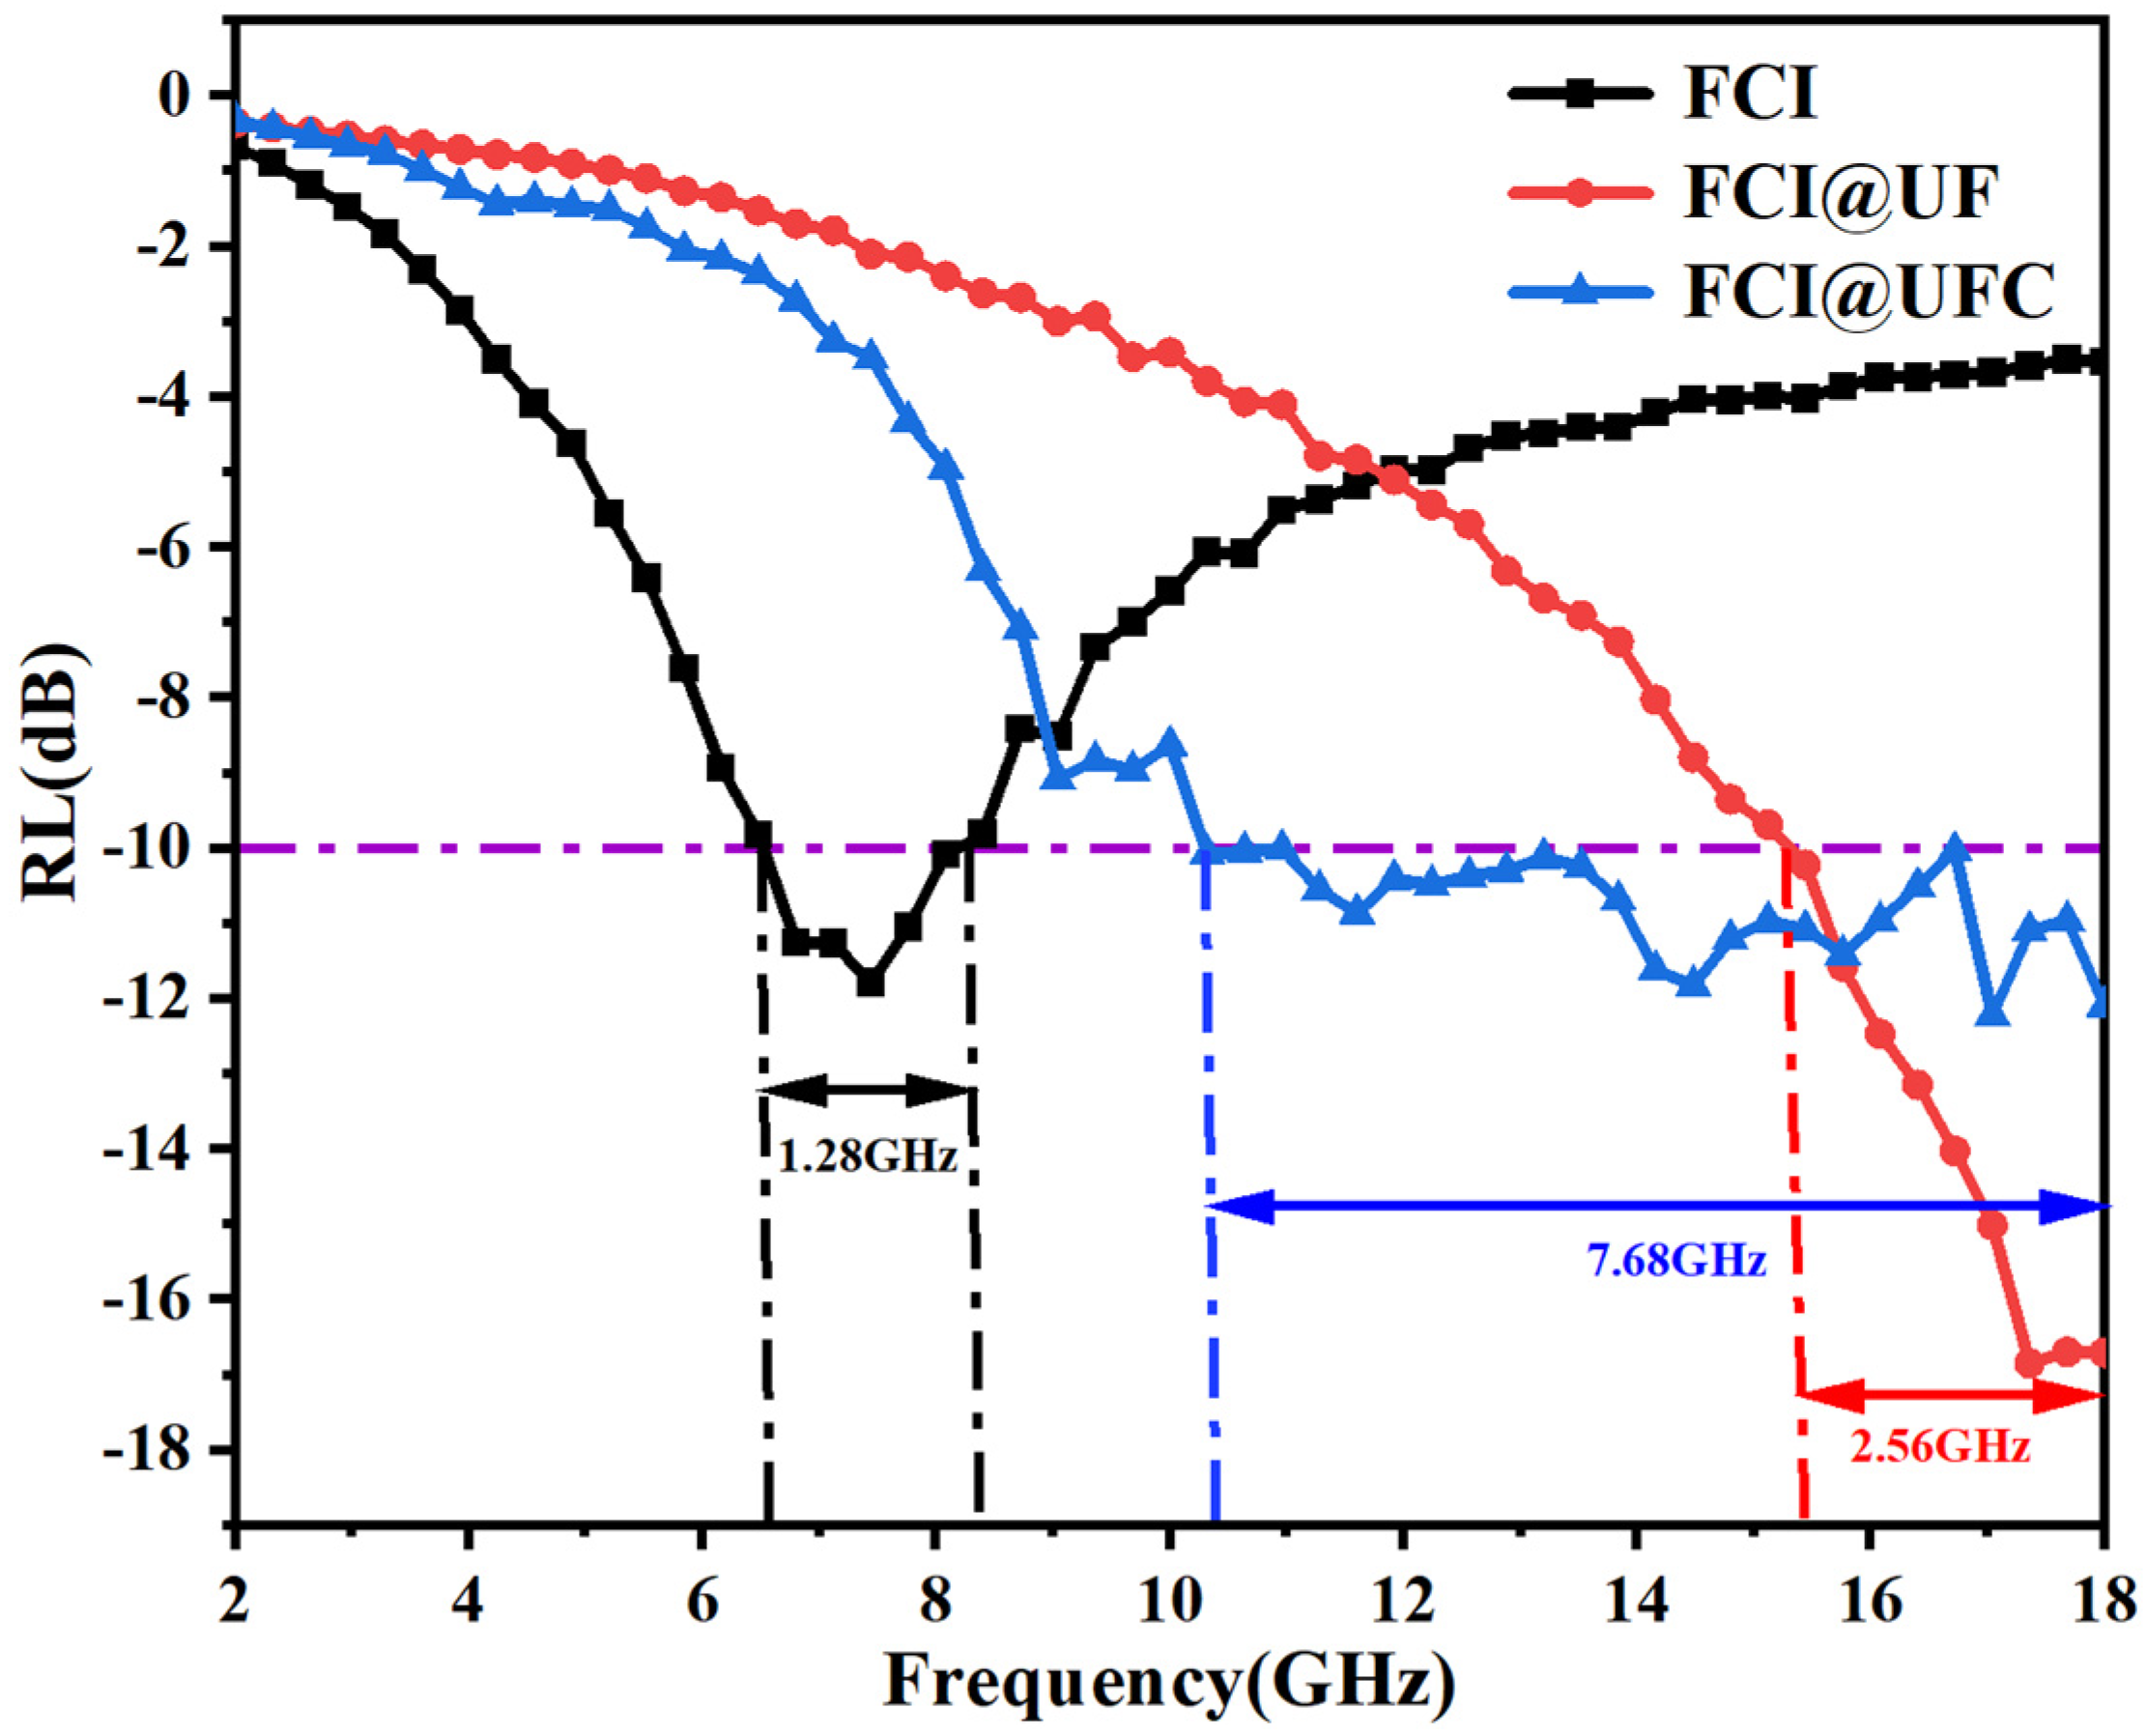
| FCI@UFC | −12 | 1.2 | 7.68 | 60 | This work |
| Sample | βa (V/dec) | βc (V/dec) | Icorr (A/cm2) | Ecorr (V) | CR (mm/a) | Rp (Ω) |
|---|---|---|---|---|---|---|
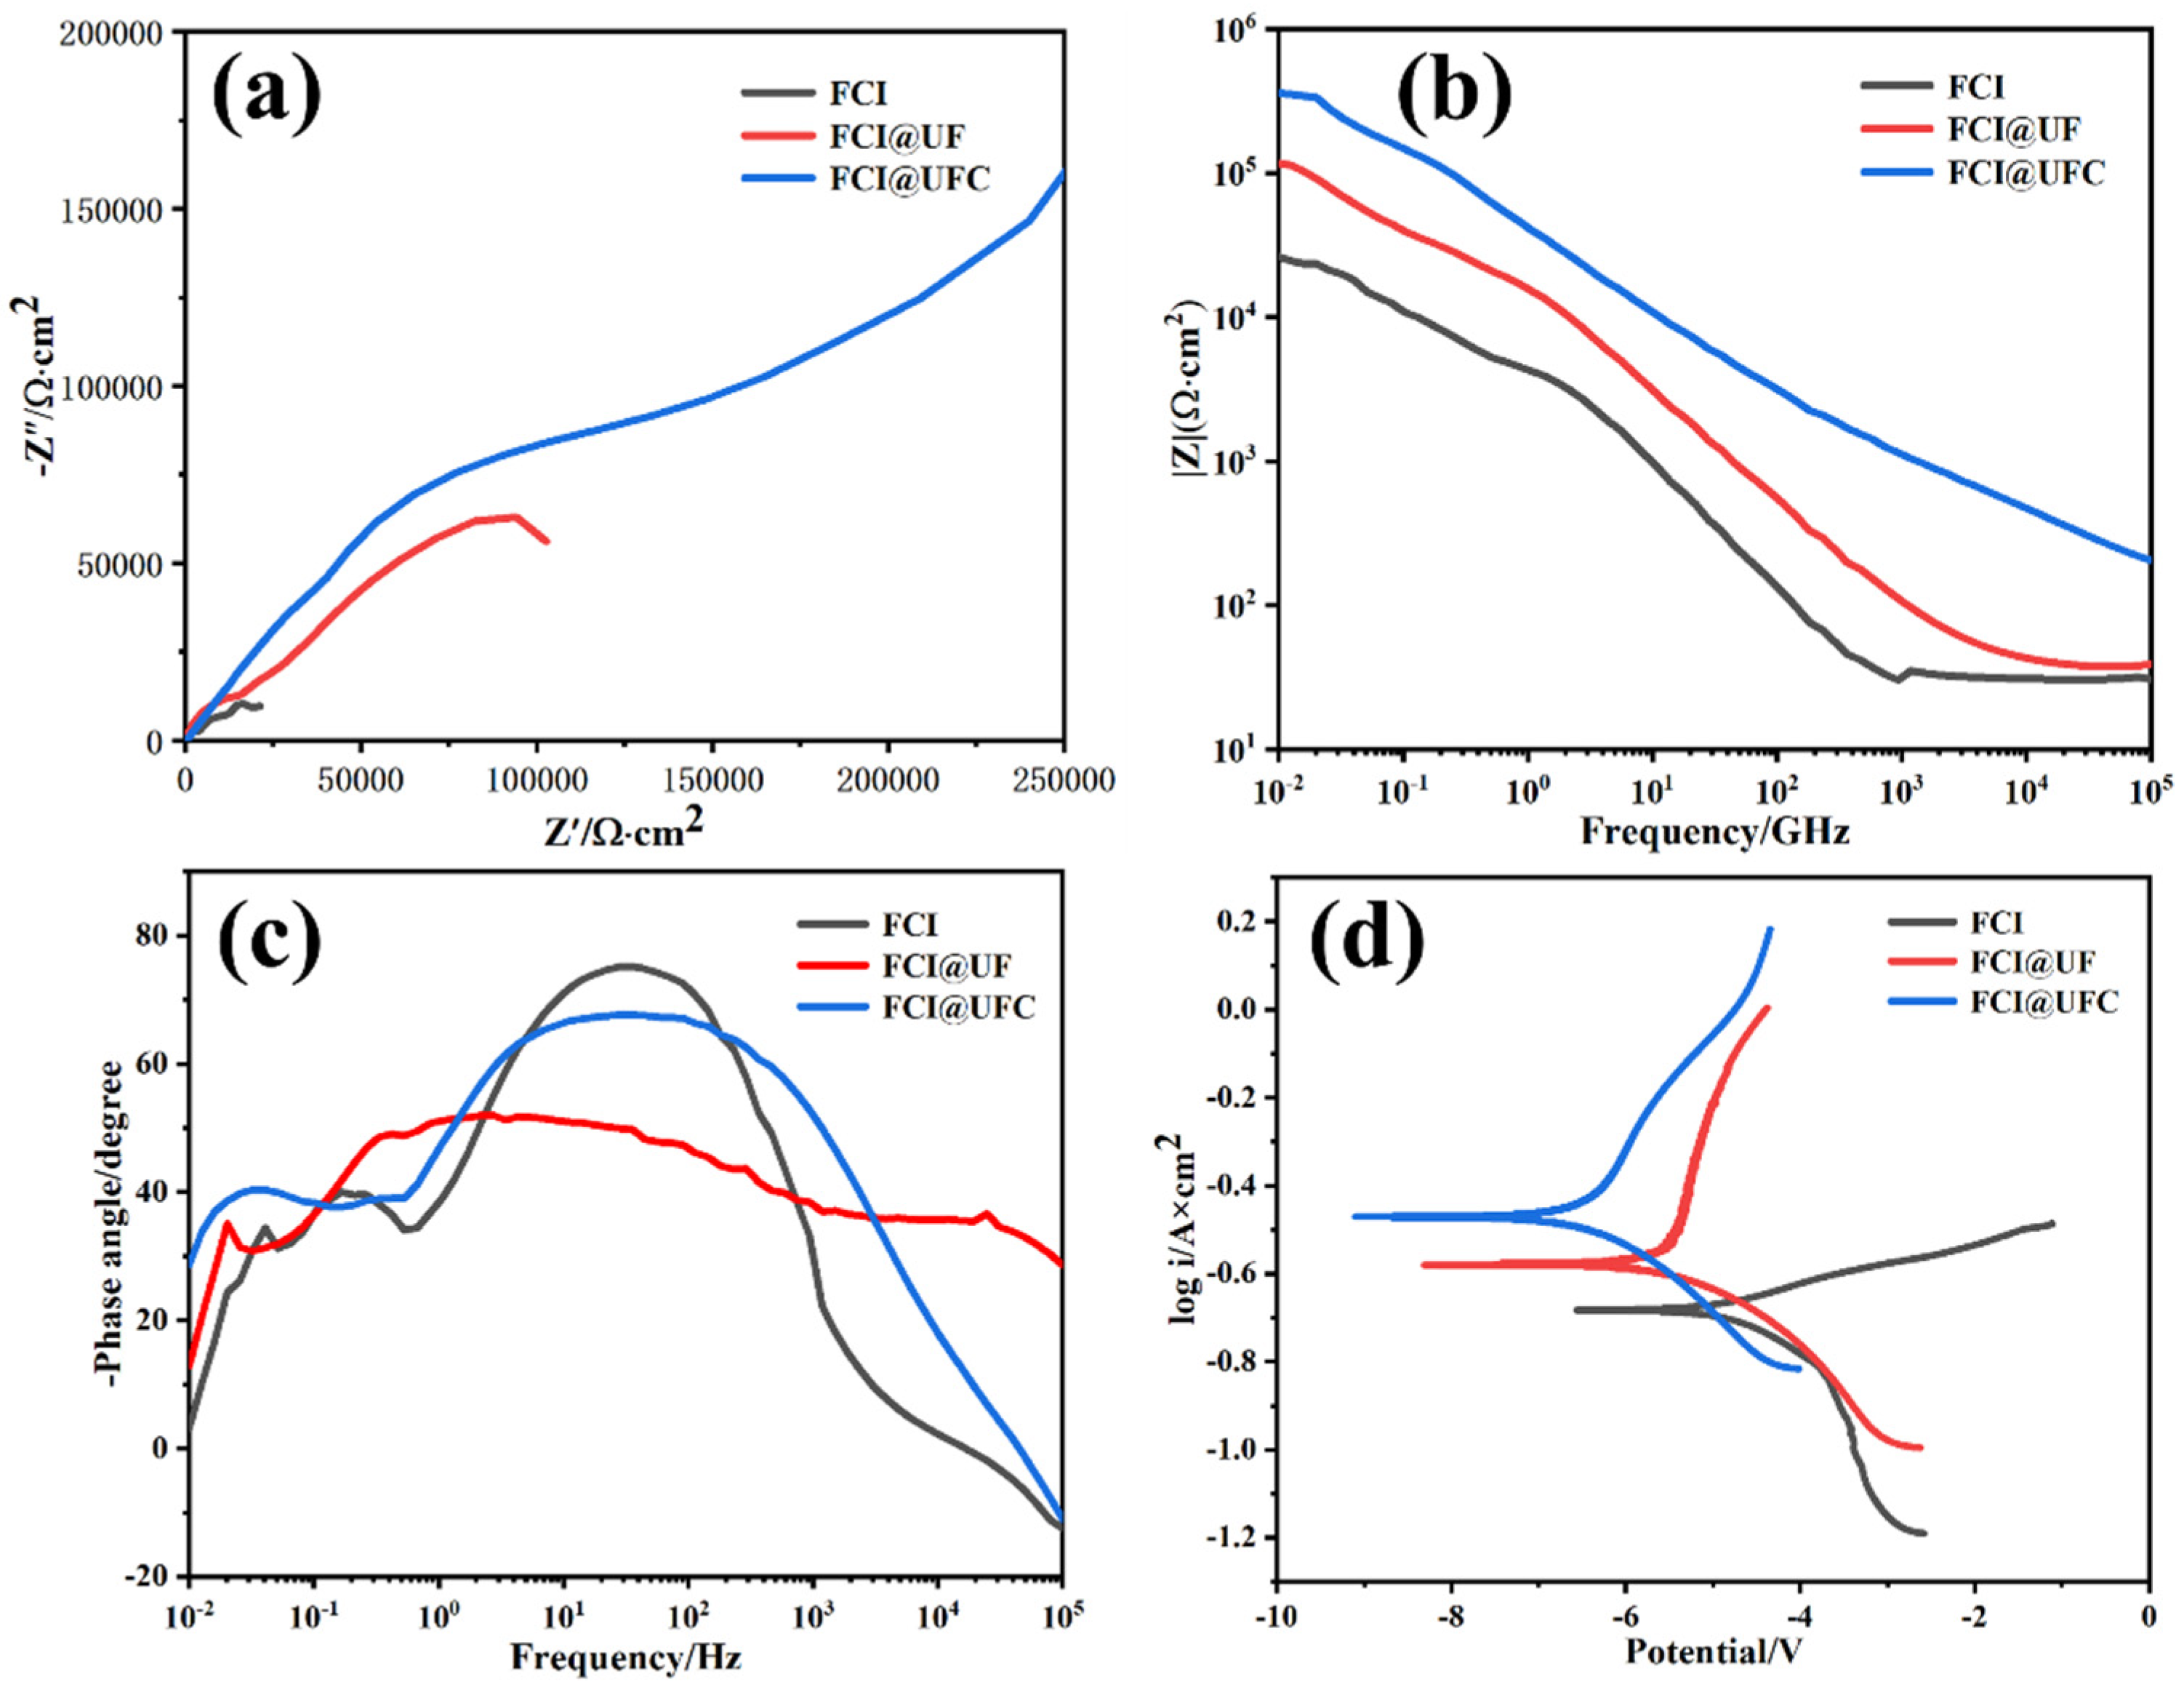
| FCI | 36.24 | 72.13 | 3.25 × 10⁻⁵ | −0.682 | 0.2651 | 165 |
| FCI@UF | 231.45 | 69.5 | 2.31 × 10⁻⁶ | −0.501 | 0.0945 | 2169 |
| FCI@UFC | 183.18 | 64.2 | 1.45 × 10⁻⁷ | −0.472 | 0.0432 | 5214 |
Disclaimer/Publisher’s Note: The statements, opinions and data contained in all publications are solely those of the individual author(s) and contributor(s) and not of MDPI and/or the editor(s). MDPI and/or the editor(s) disclaim responsibility for any injury to people or property resulting from any ideas, methods, instructions or products referred to in the content. |
© 2025 by the authors. Licensee MDPI, Basel, Switzerland. This article is an open access article distributed under the terms and conditions of the Creative Commons Attribution (CC BY) license (https://creativecommons.org/licenses/by/4.0/).
Share and Cite
Yang, W.; Gao, Z.; Zhang, Y.; Shi, H.; Wang, A.; Fan, W. Controlled Synthesis and Absorption Mechanism Study of FCI@UFC Absorbents. Materials 2025, 18, 1017. https://doi.org/10.3390/ma18051017
Yang W, Gao Z, Zhang Y, Shi H, Wang A, Fan W. Controlled Synthesis and Absorption Mechanism Study of FCI@UFC Absorbents. Materials. 2025; 18(5):1017. https://doi.org/10.3390/ma18051017
Chicago/Turabian StyleYang, Wenfei, Zhan Gao, Yong Zhang, Hao Shi, Andong Wang, and Weijie Fan. 2025. "Controlled Synthesis and Absorption Mechanism Study of FCI@UFC Absorbents" Materials 18, no. 5: 1017. https://doi.org/10.3390/ma18051017
APA StyleYang, W., Gao, Z., Zhang, Y., Shi, H., Wang, A., & Fan, W. (2025). Controlled Synthesis and Absorption Mechanism Study of FCI@UFC Absorbents. Materials, 18(5), 1017. https://doi.org/10.3390/ma18051017