Influence of Laser Processing Parameters on Surface Roughness and Color Formation in the Marked Zone
Abstract
1. Introduction
2. Material, Equipment, and Methods
2.1. Material: AISI 304 Stainless Steel
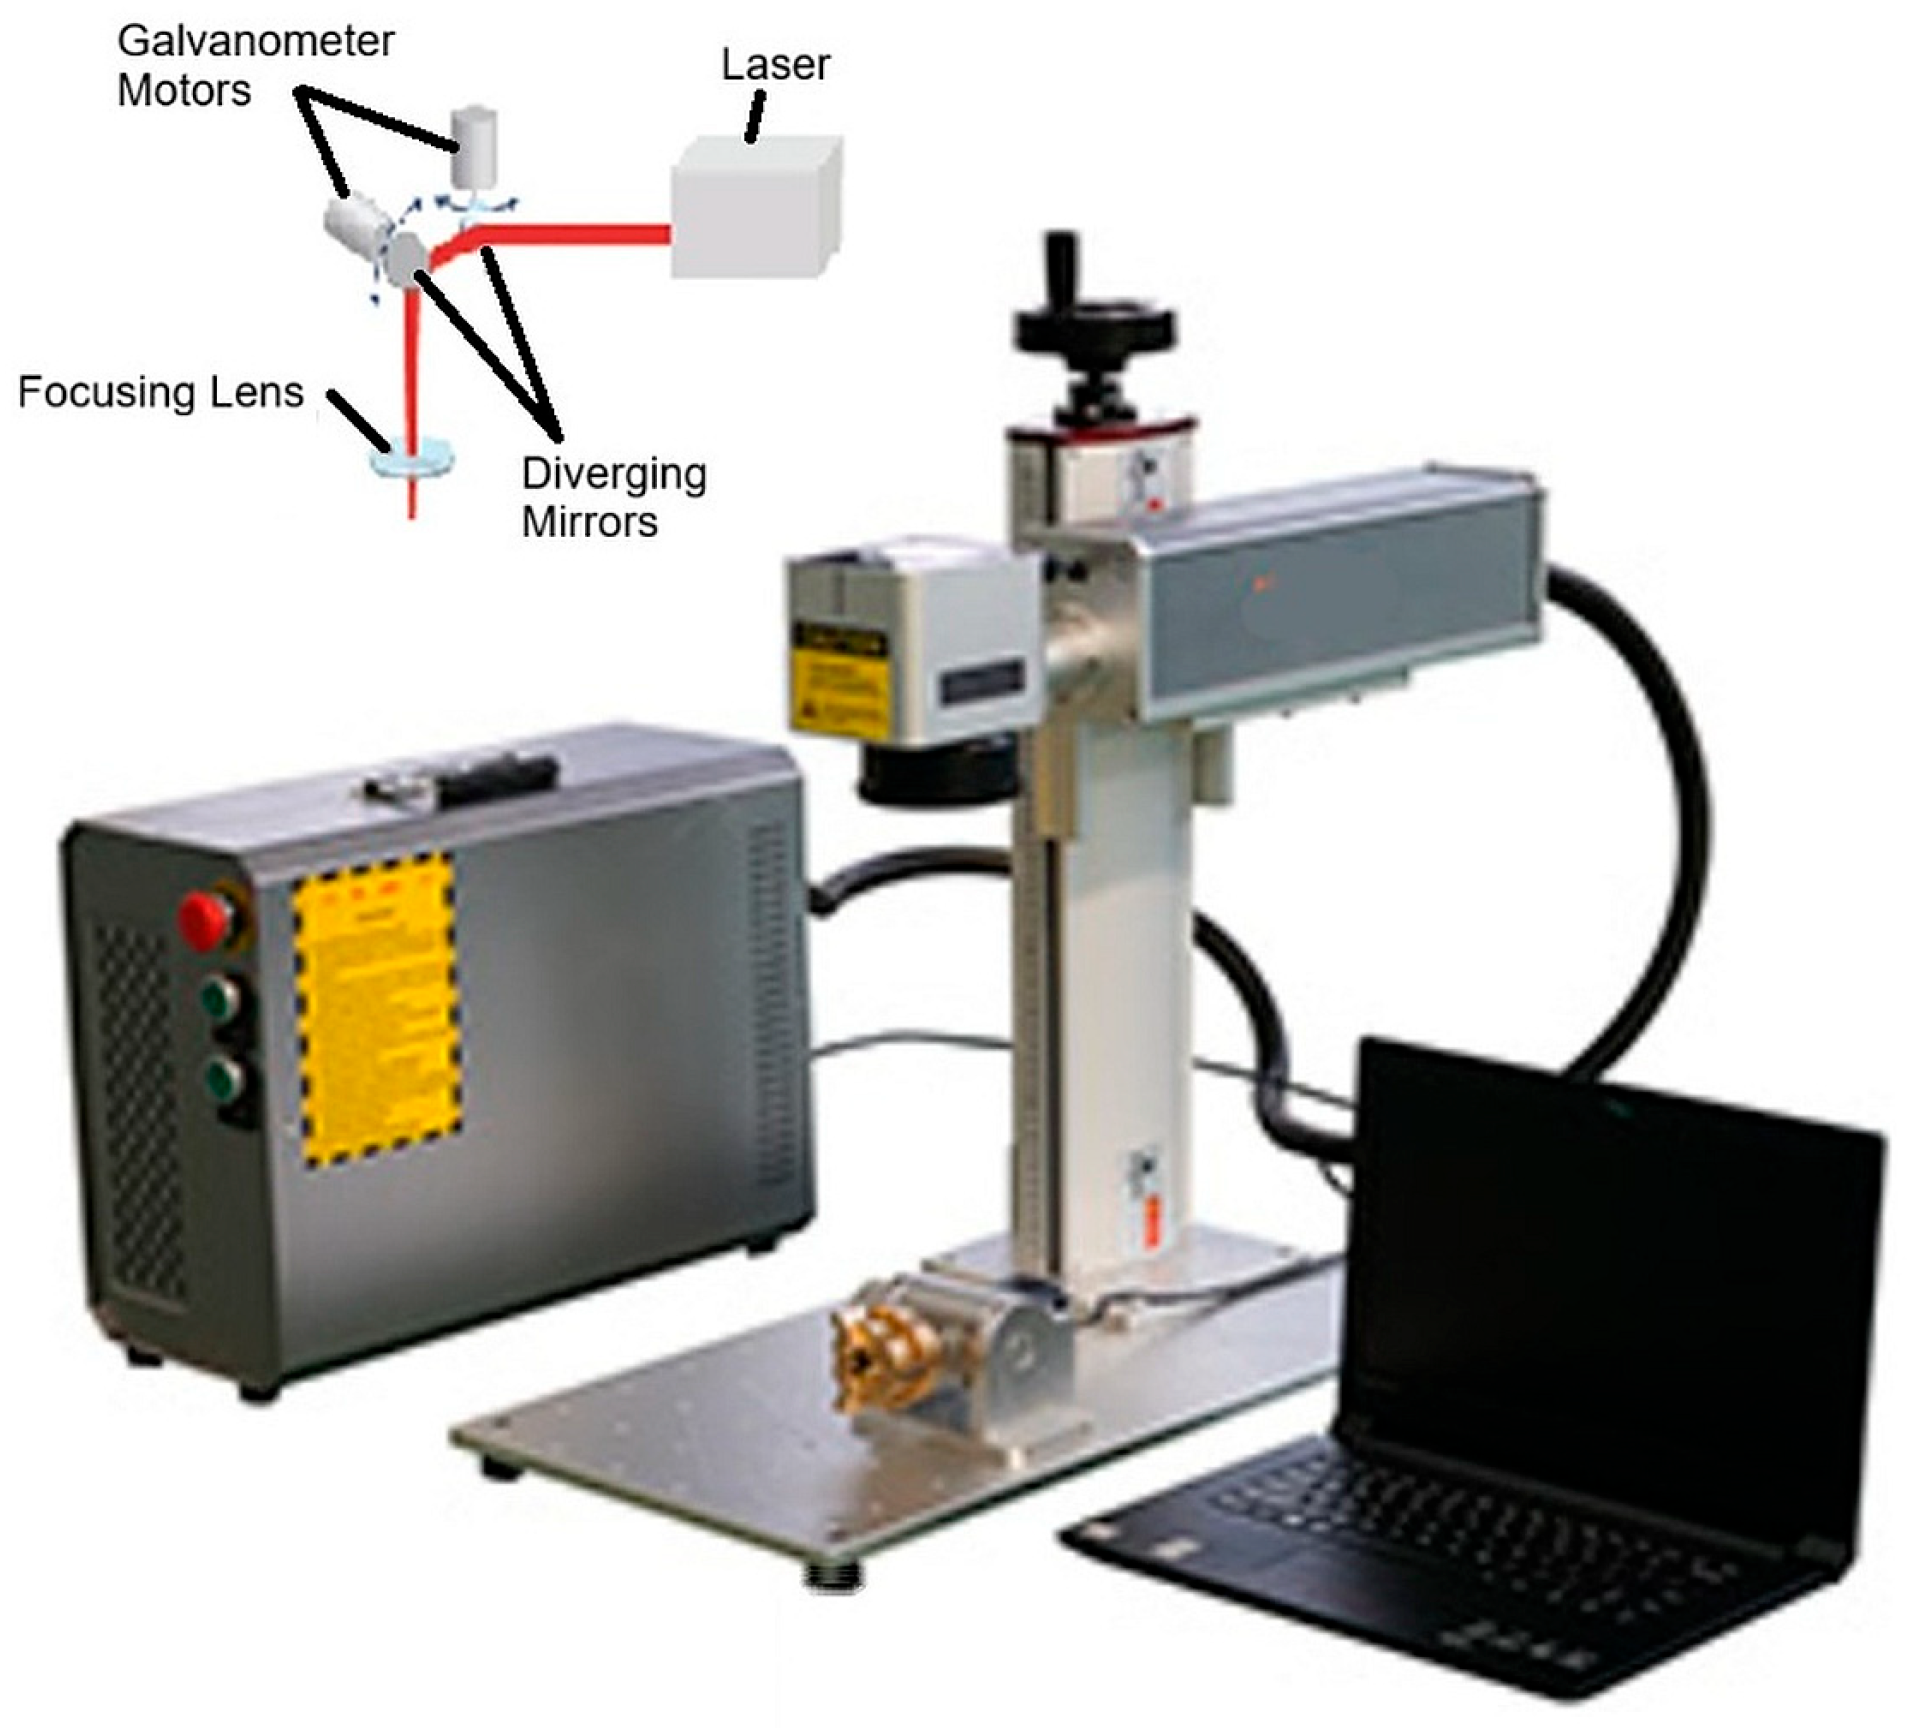
2.2. Laser System
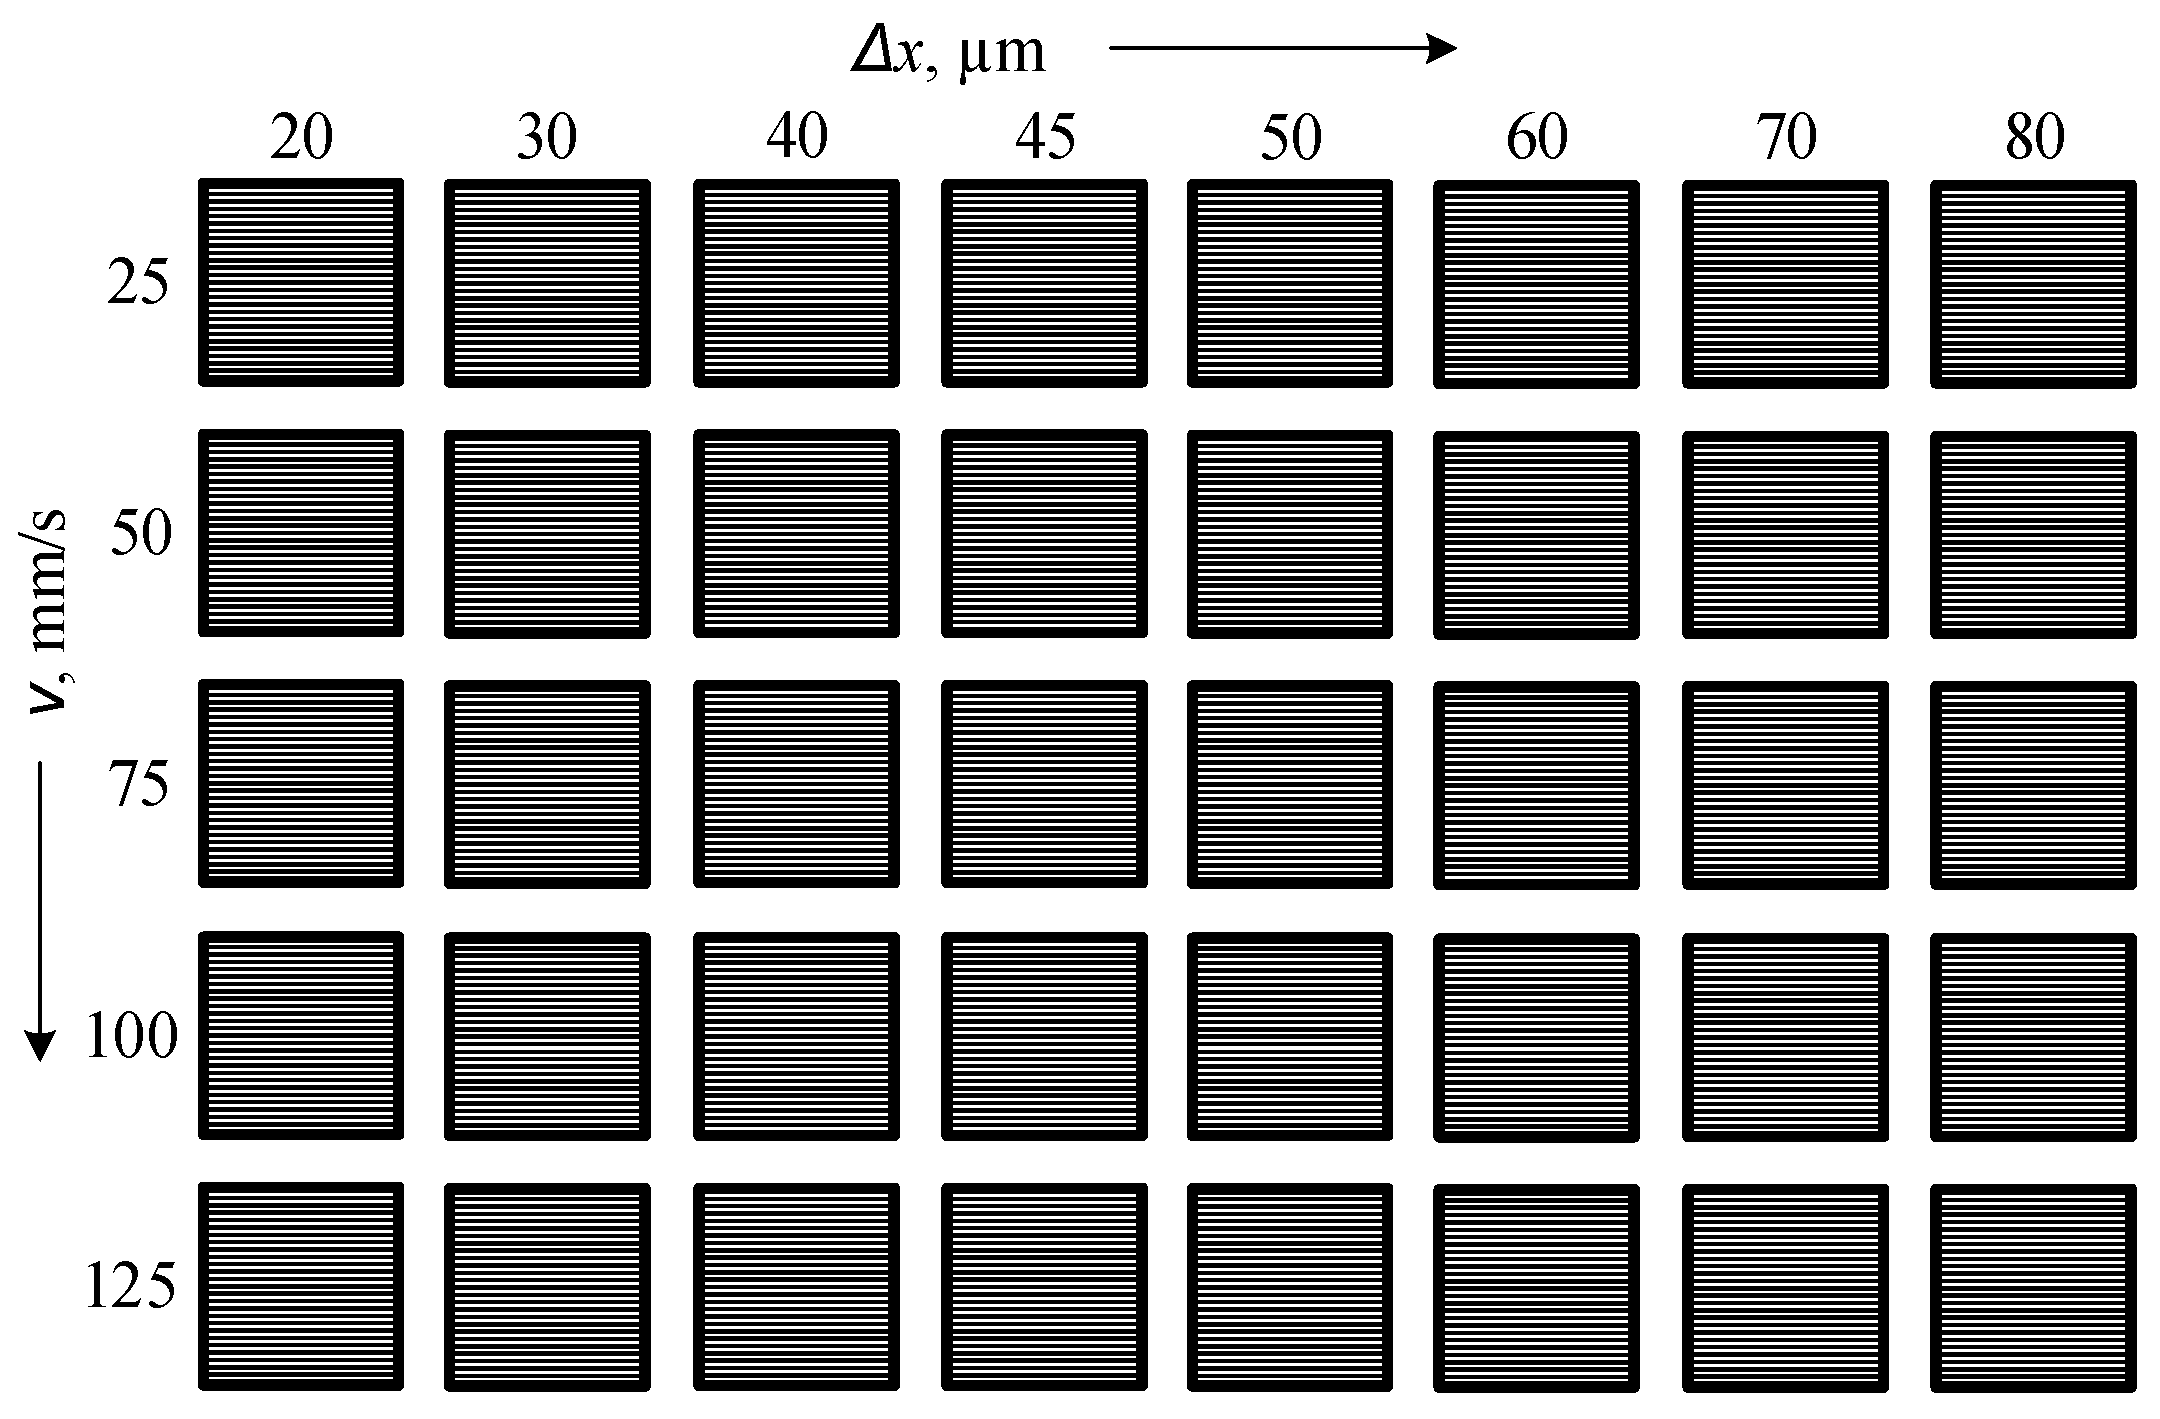
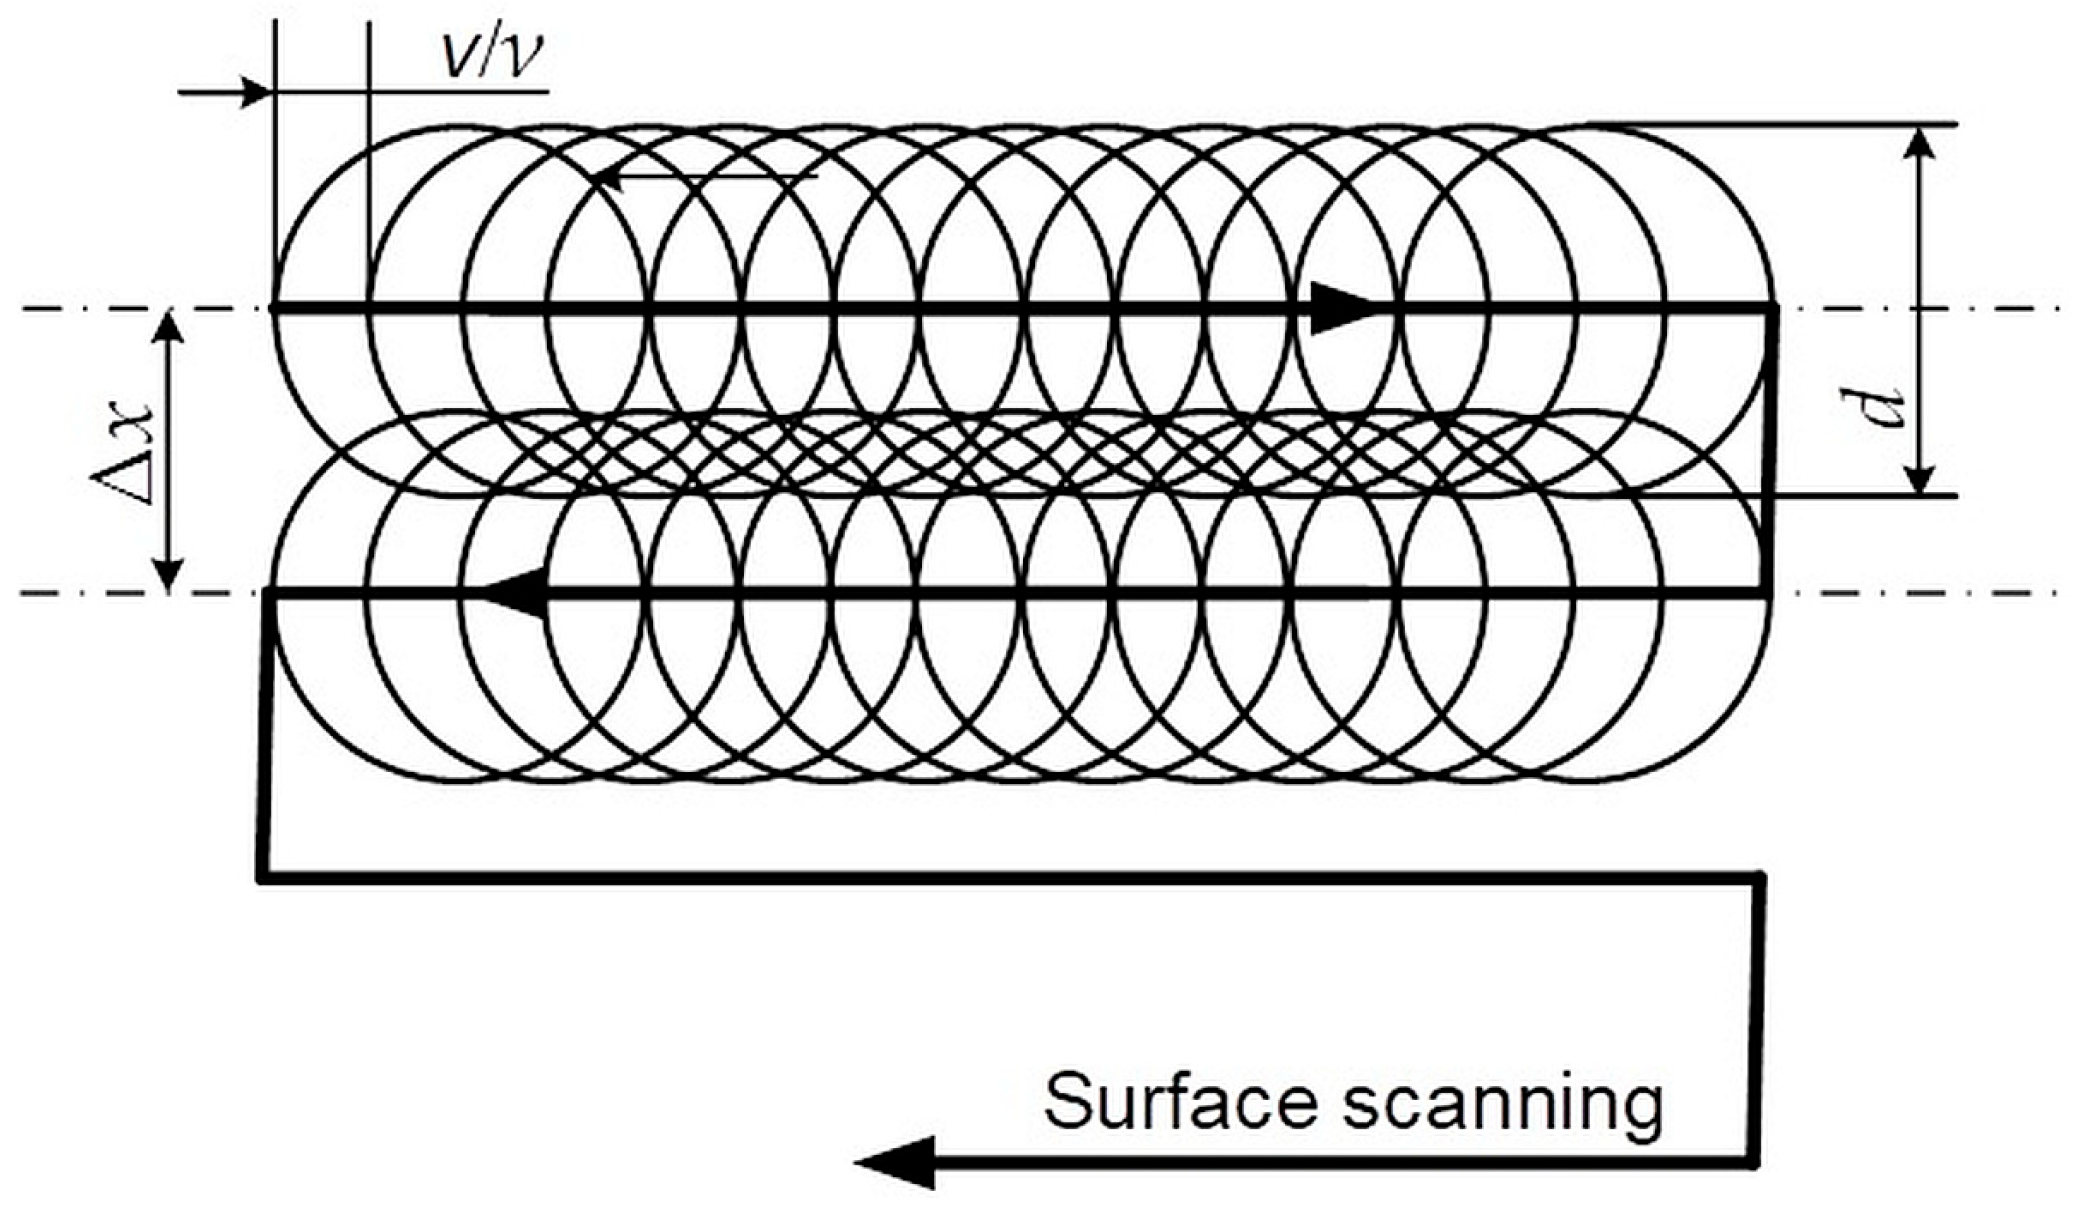
2.3. Experimental Methodology
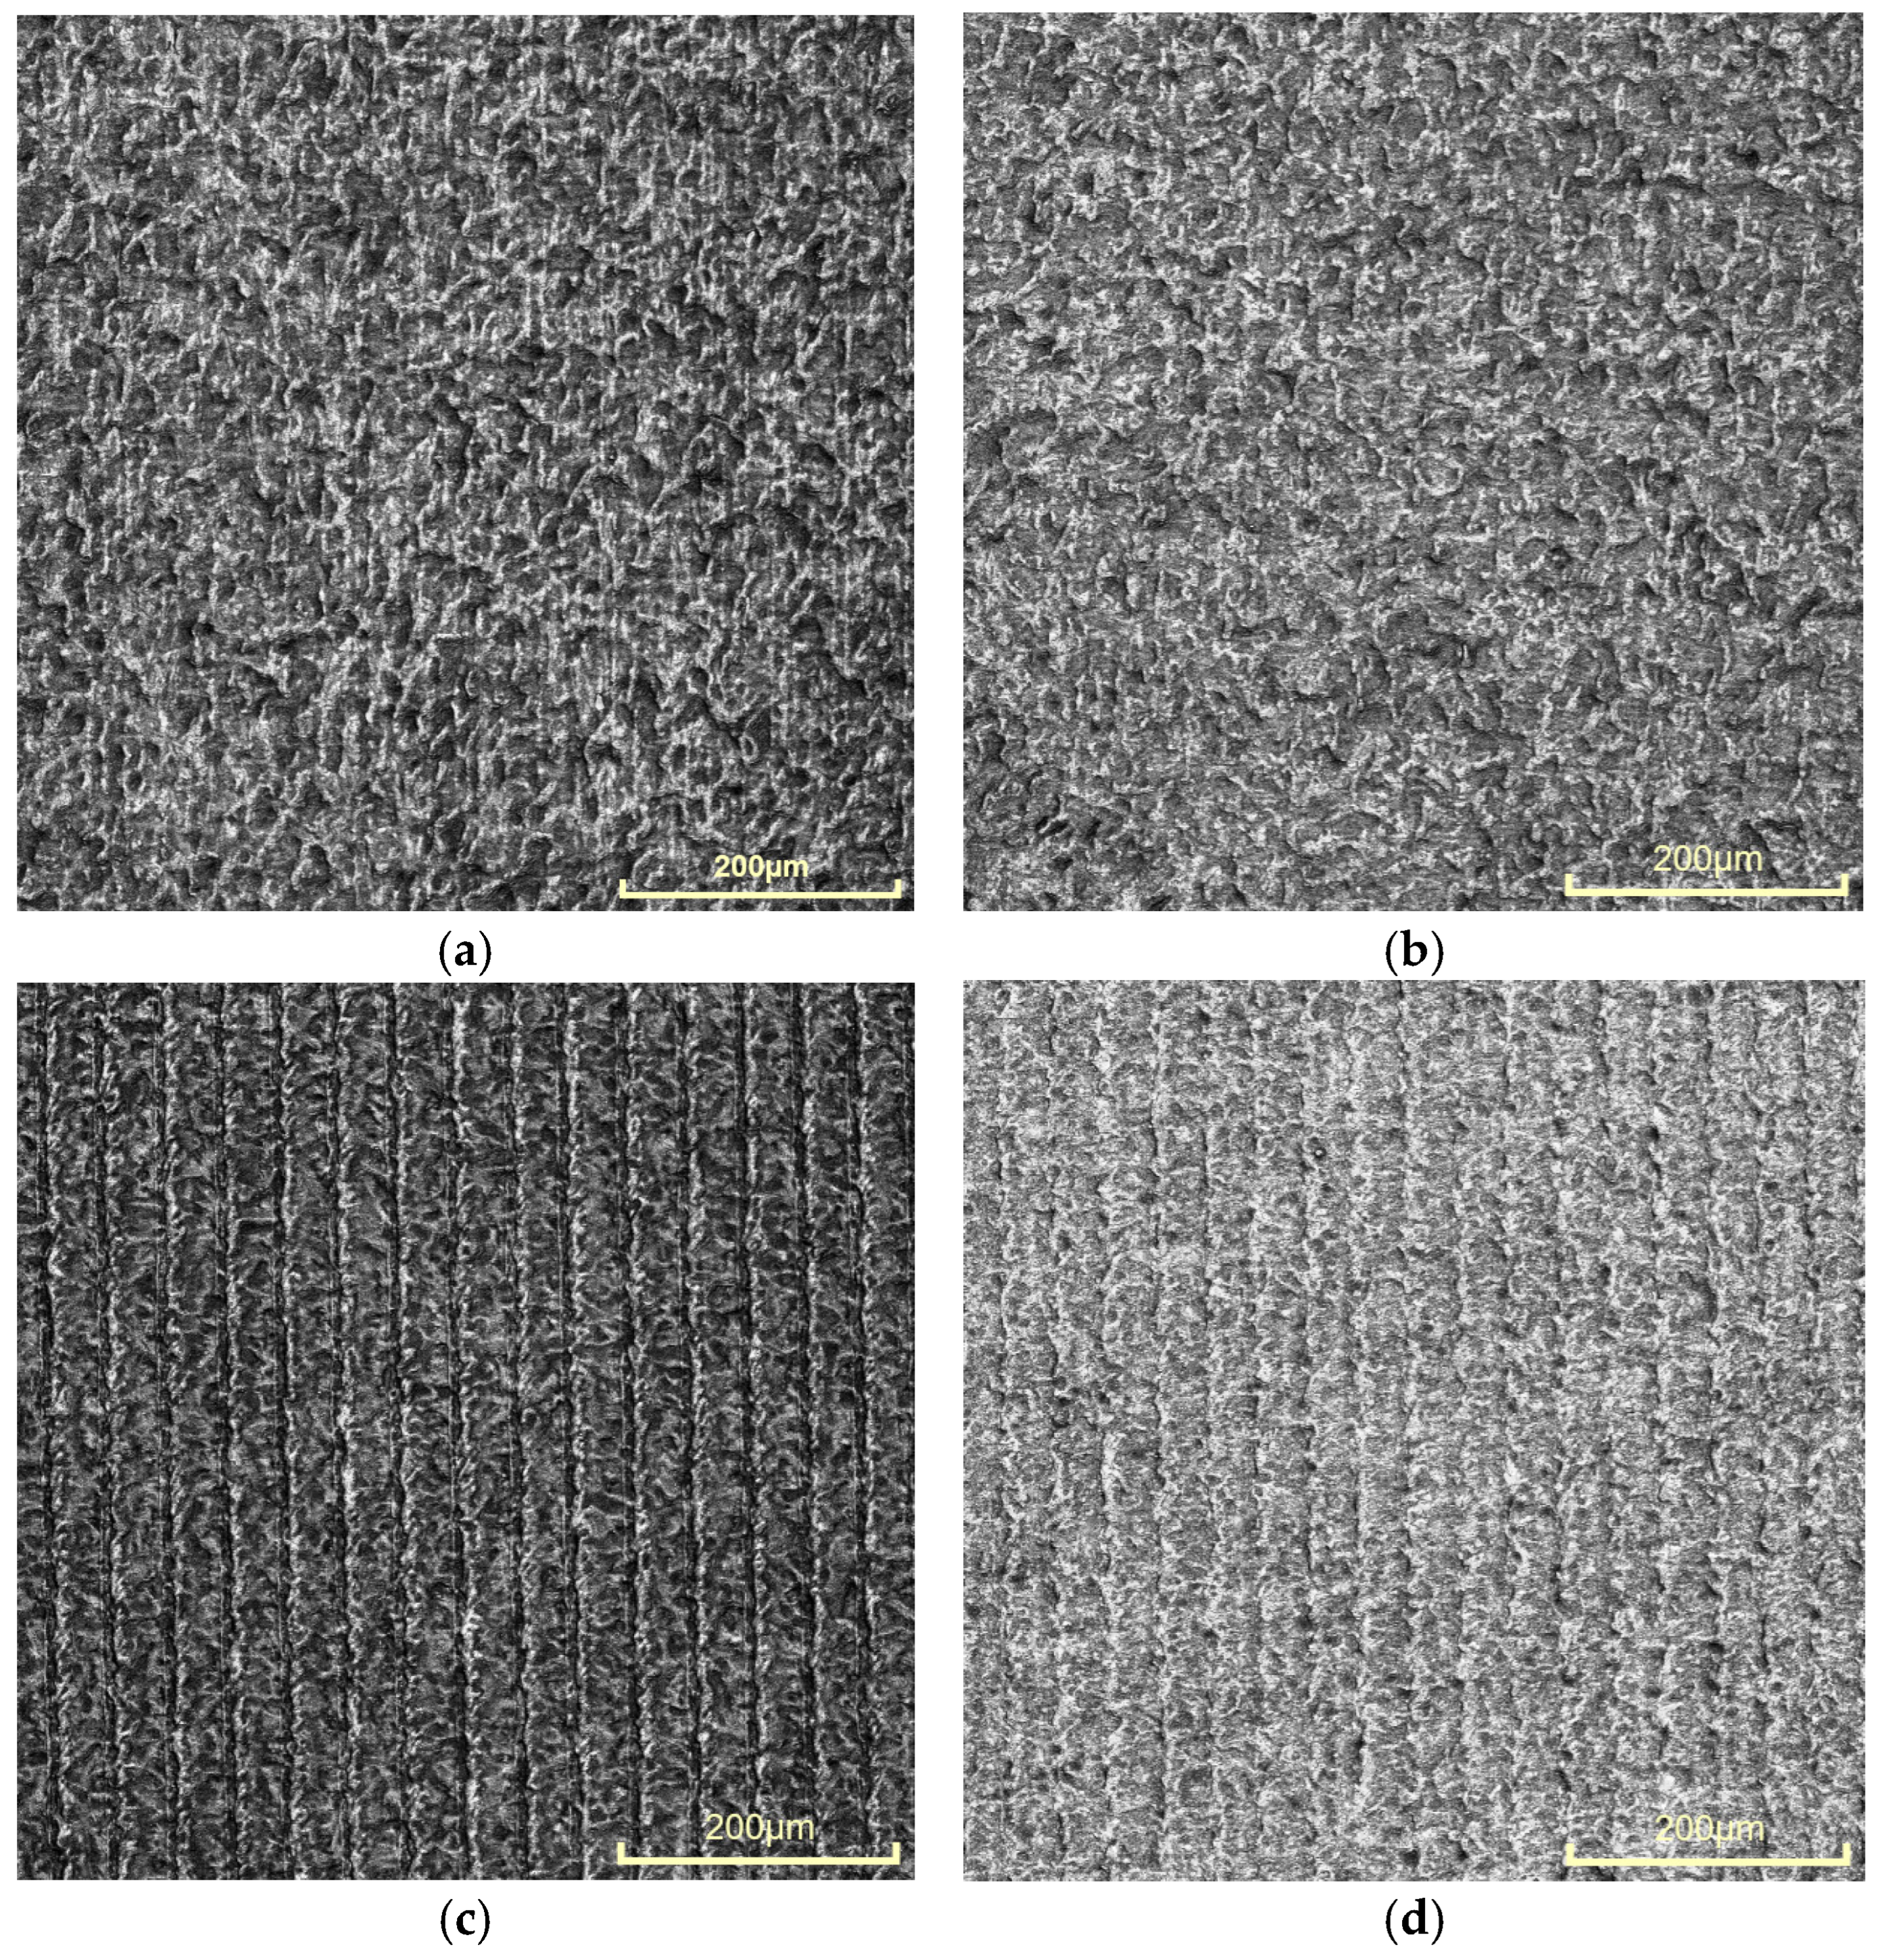
2.4. Surface Roughness Measurements
2.5. Measurement of Spectral Characteristics of Color-Marked Areas
2.6. Investigated Functional Dependencies in the Conducted Experiments
- The role of raster step Δx on roughness Ra = Ra (Δx)
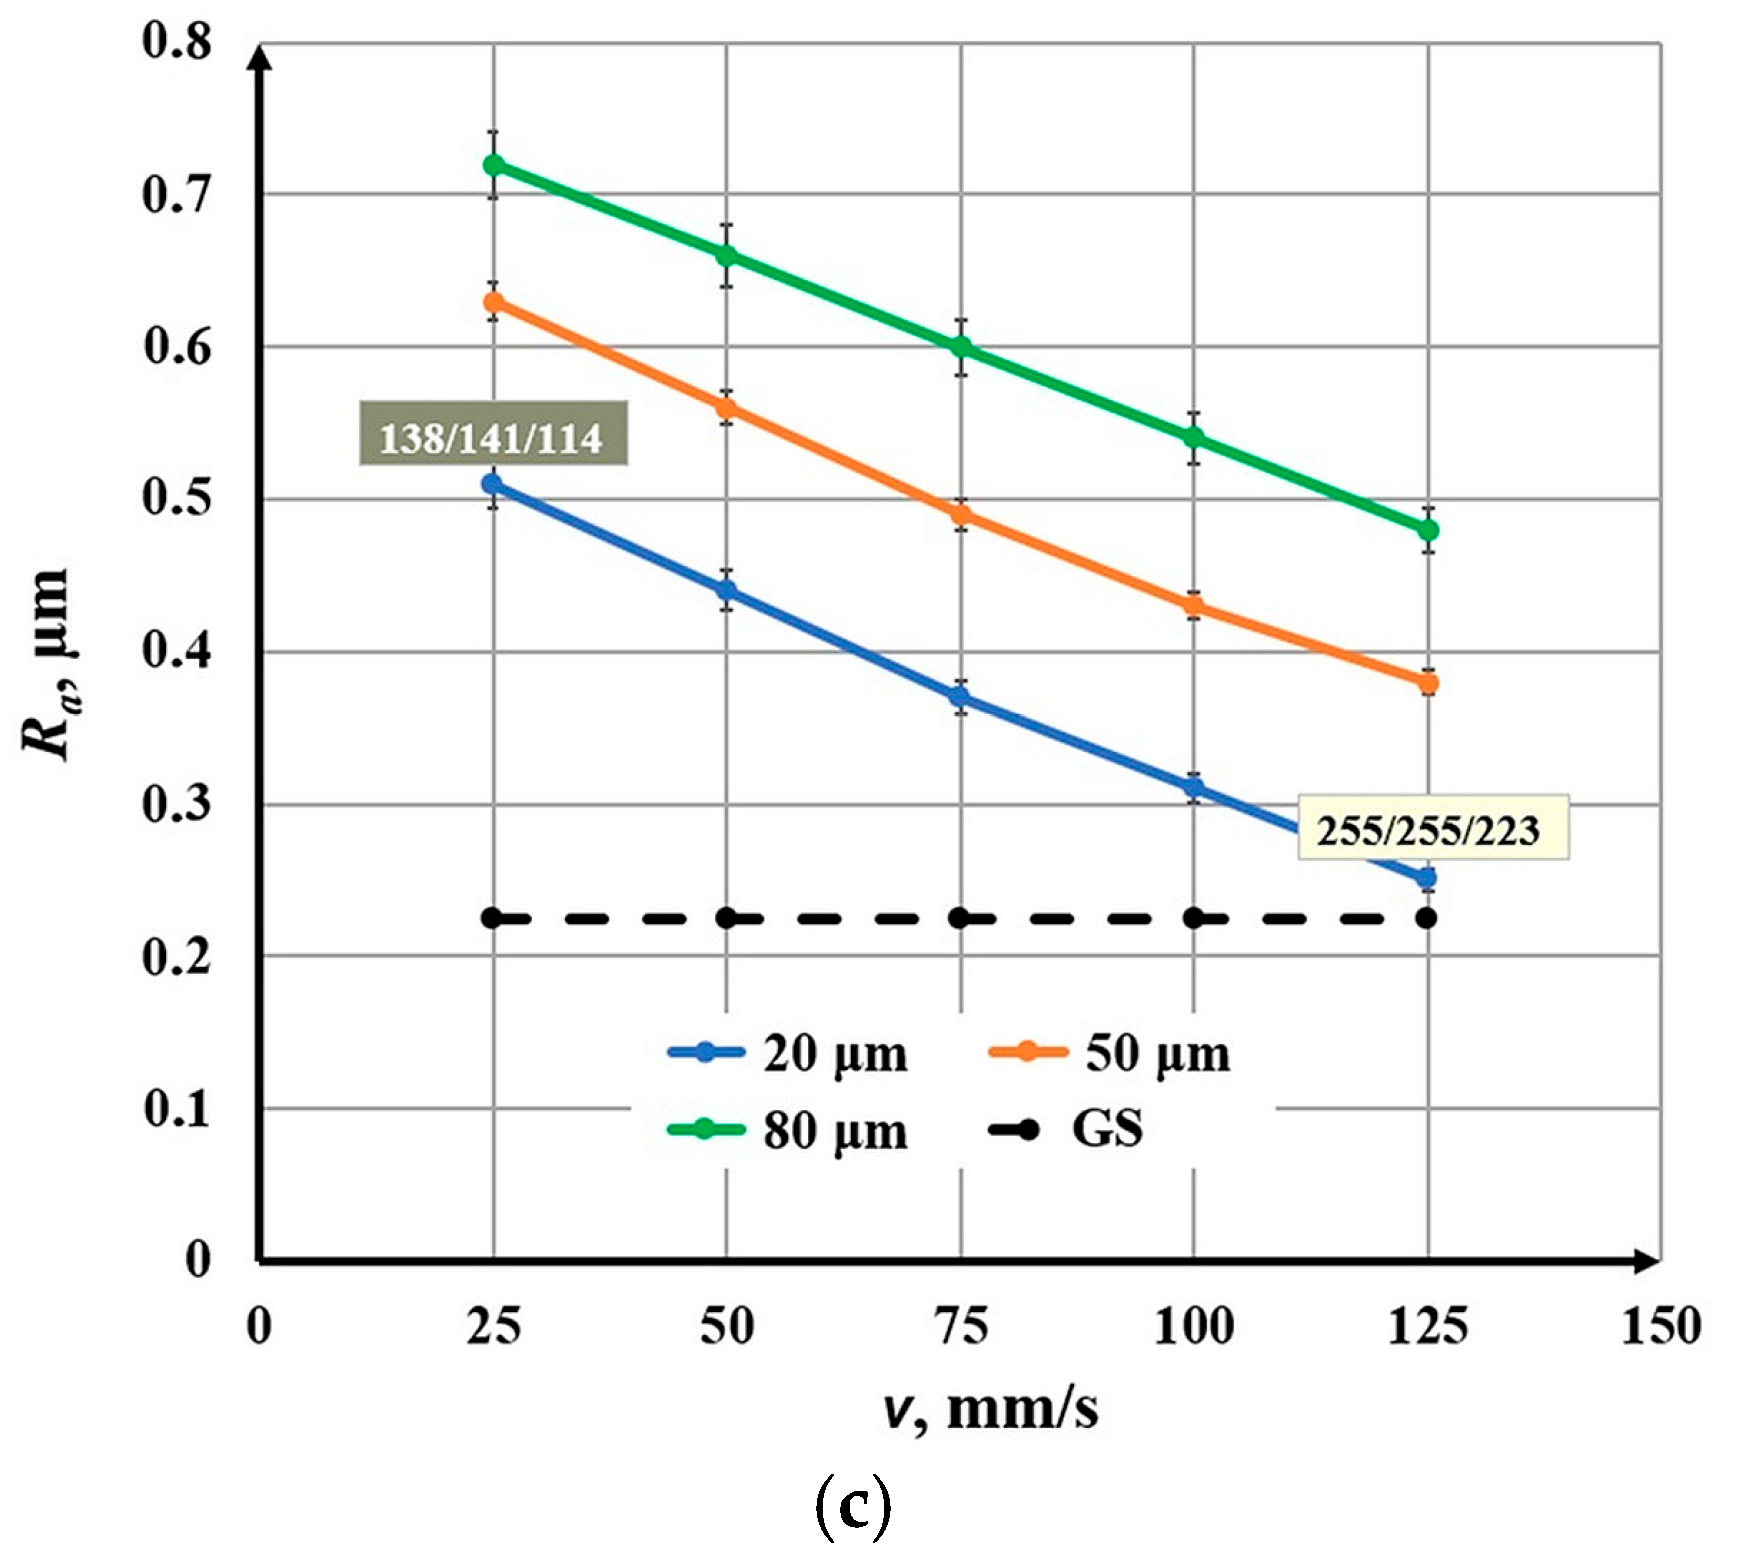
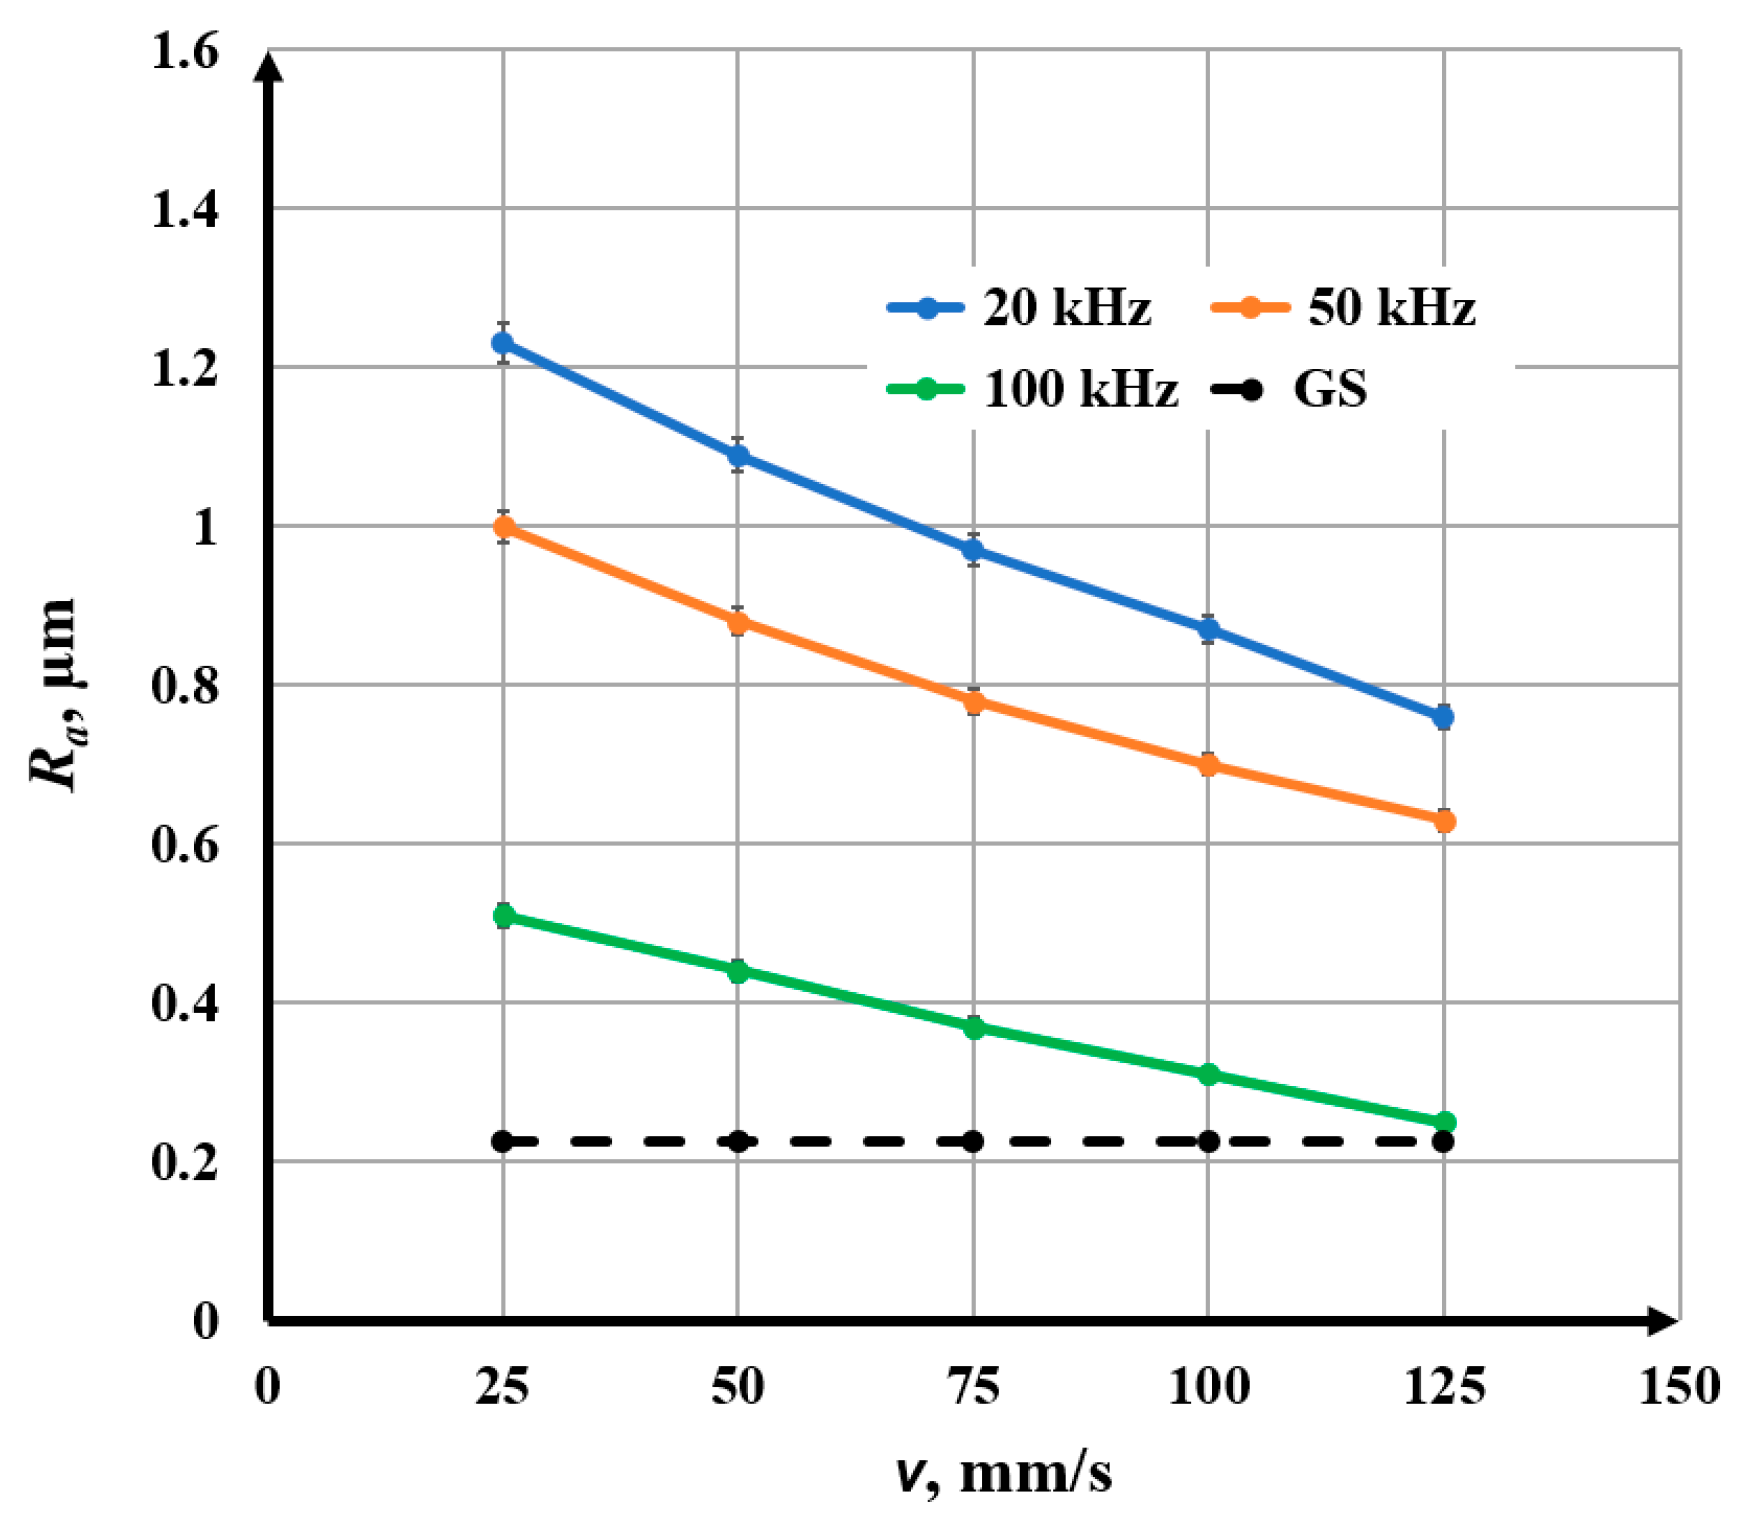
- The role of speed v on roughness Ra = Ra (v)
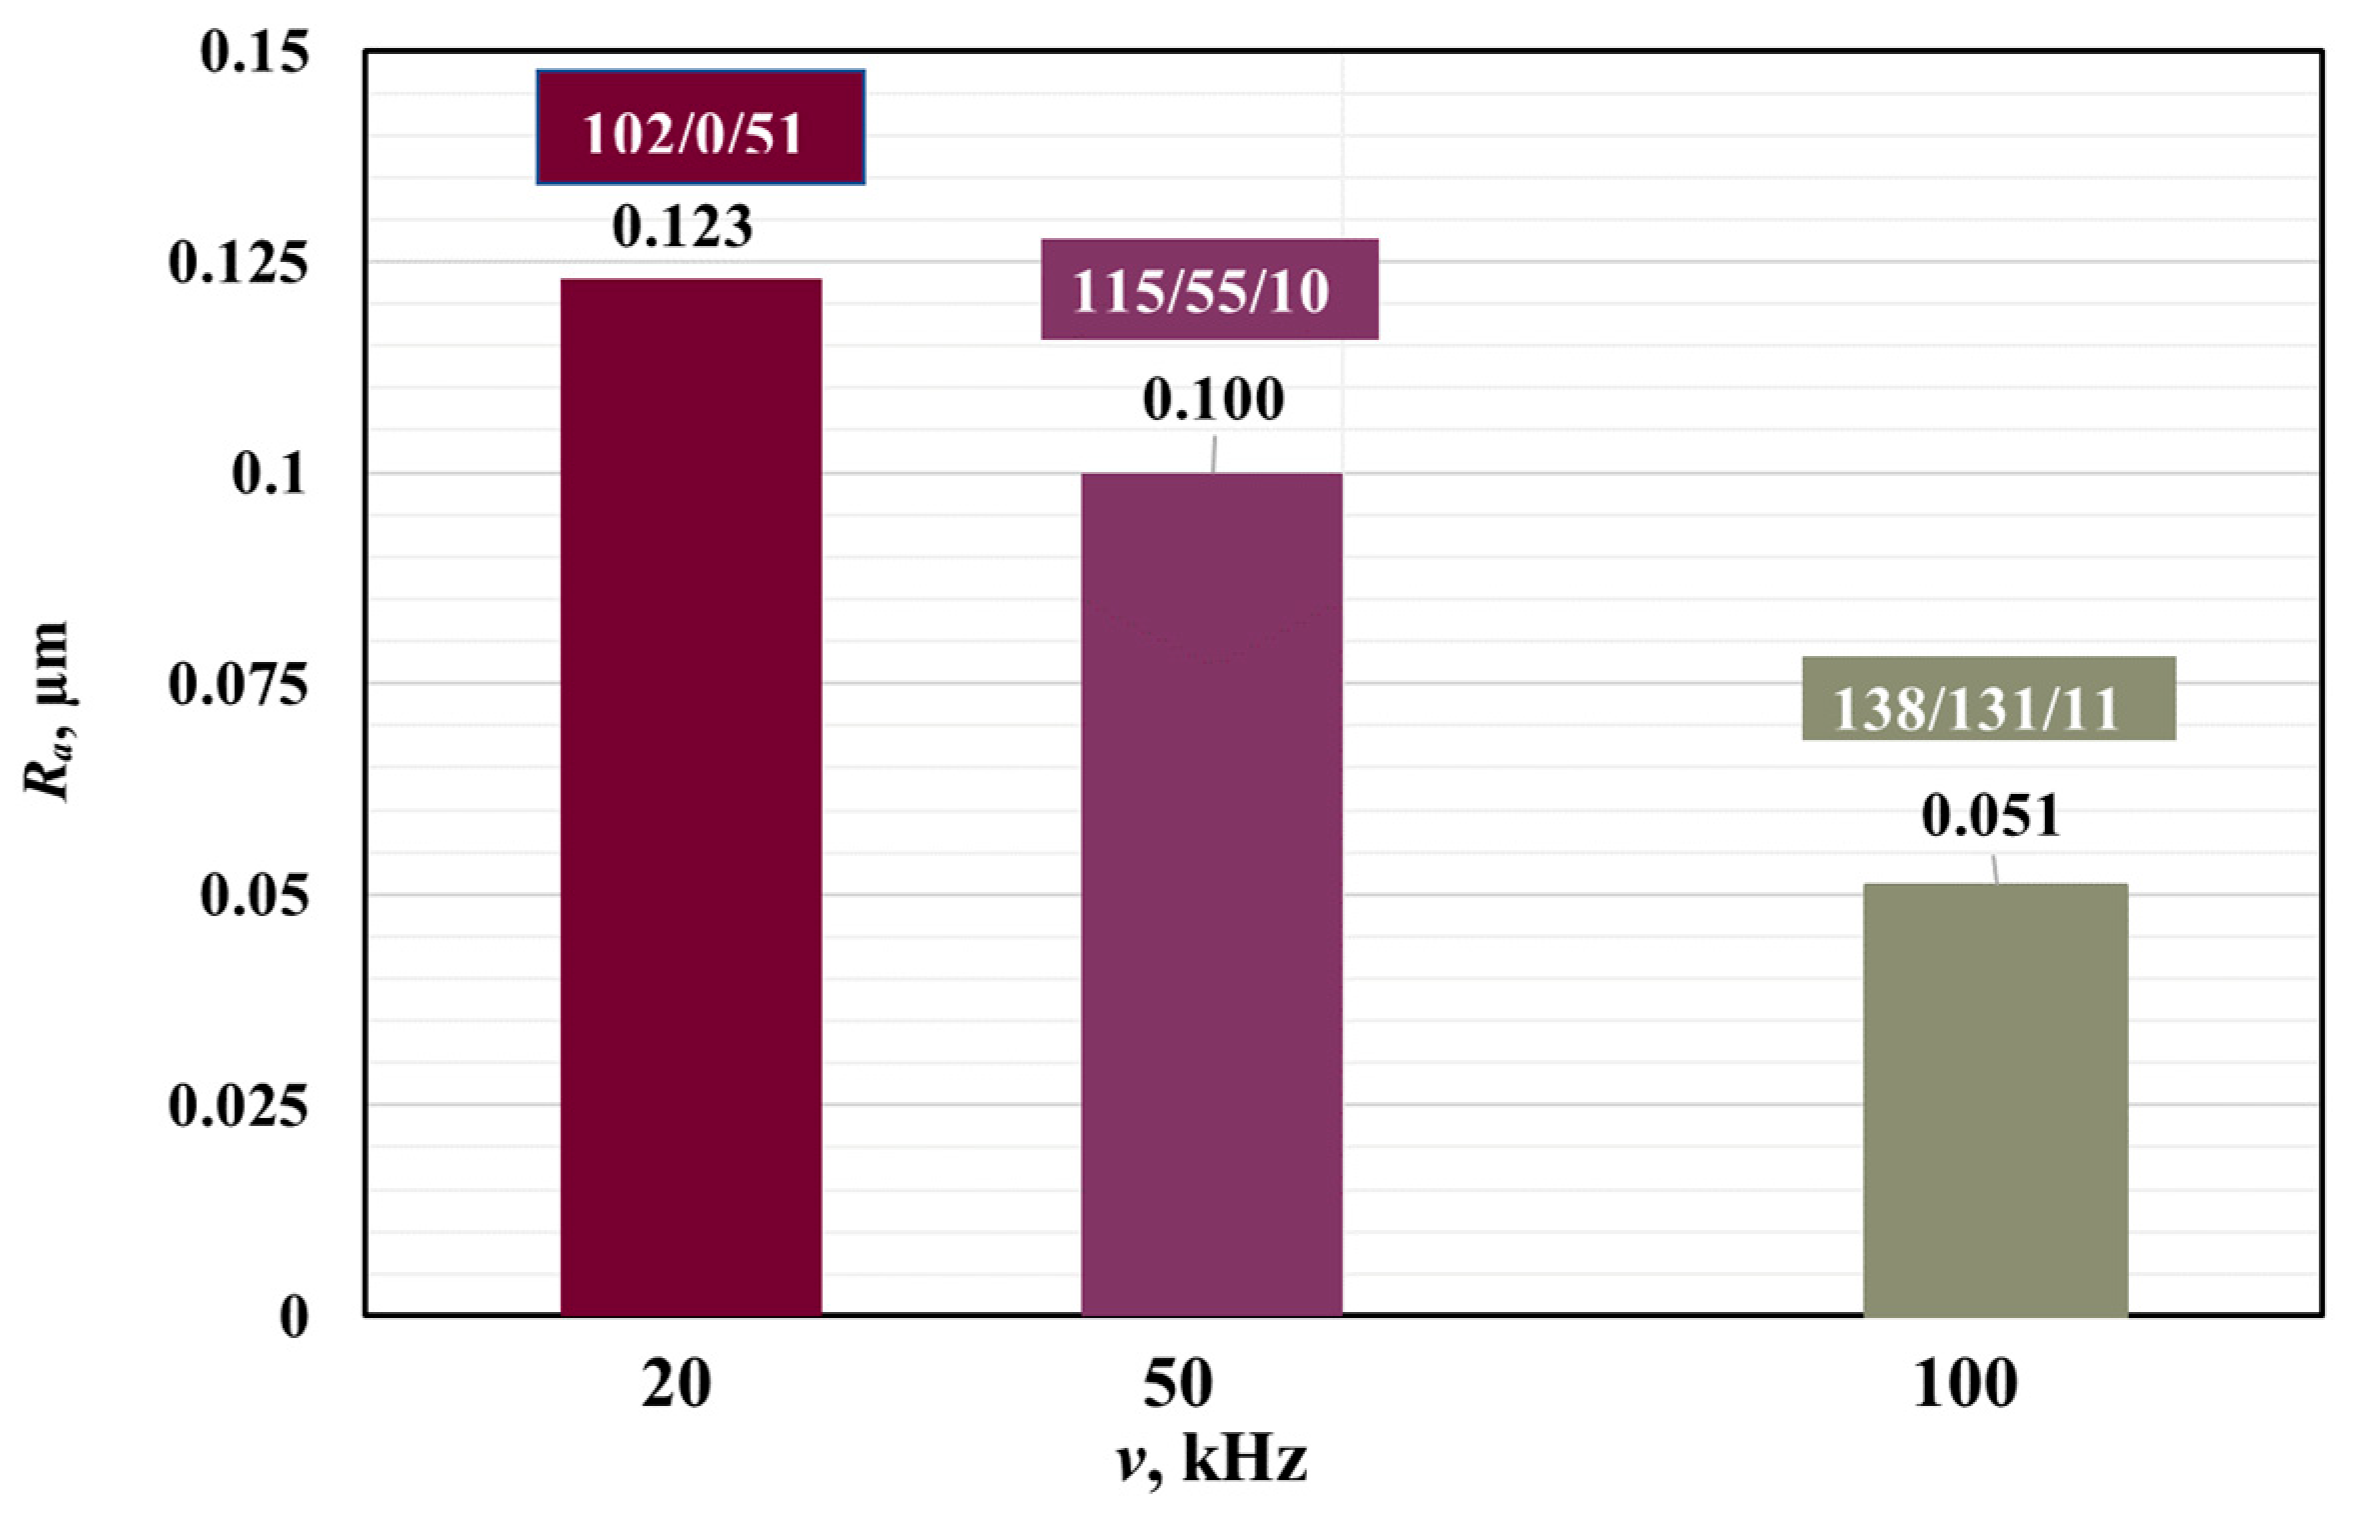
- The role of frequency ν on roughness (column diagram) Ra = Ra (ν)
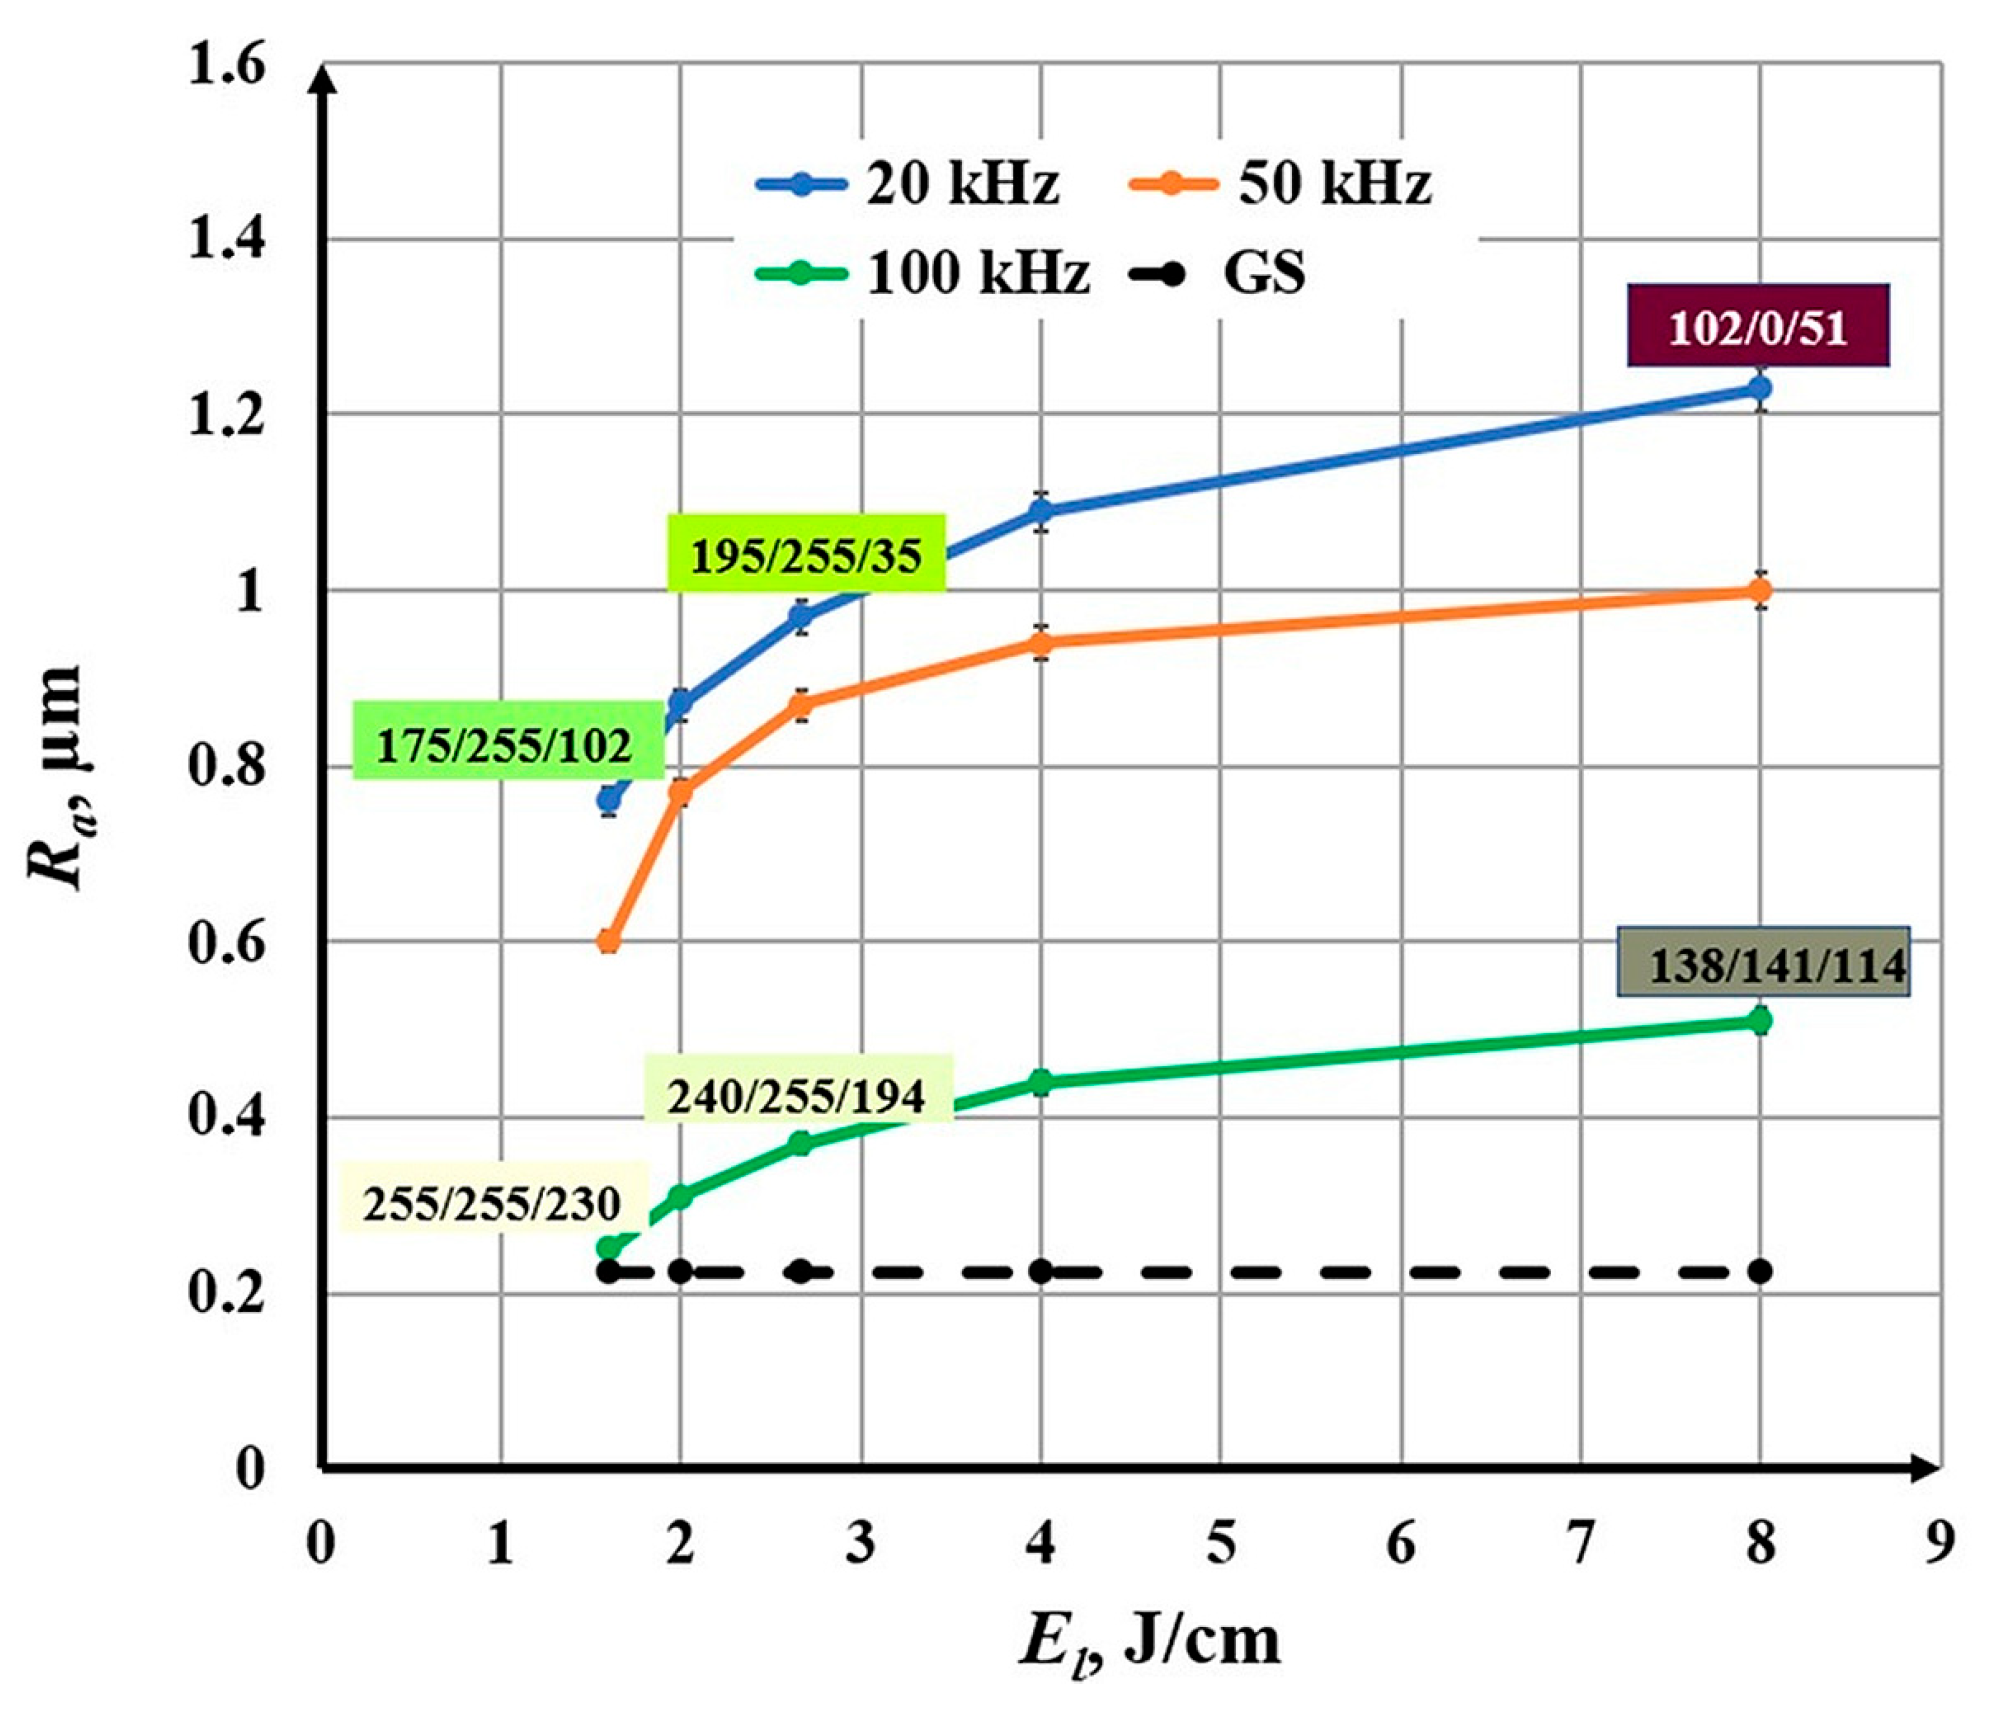
- The role of linear energy density El on roughness Ra = Ra (El) for obtaining a certain color in the processing area
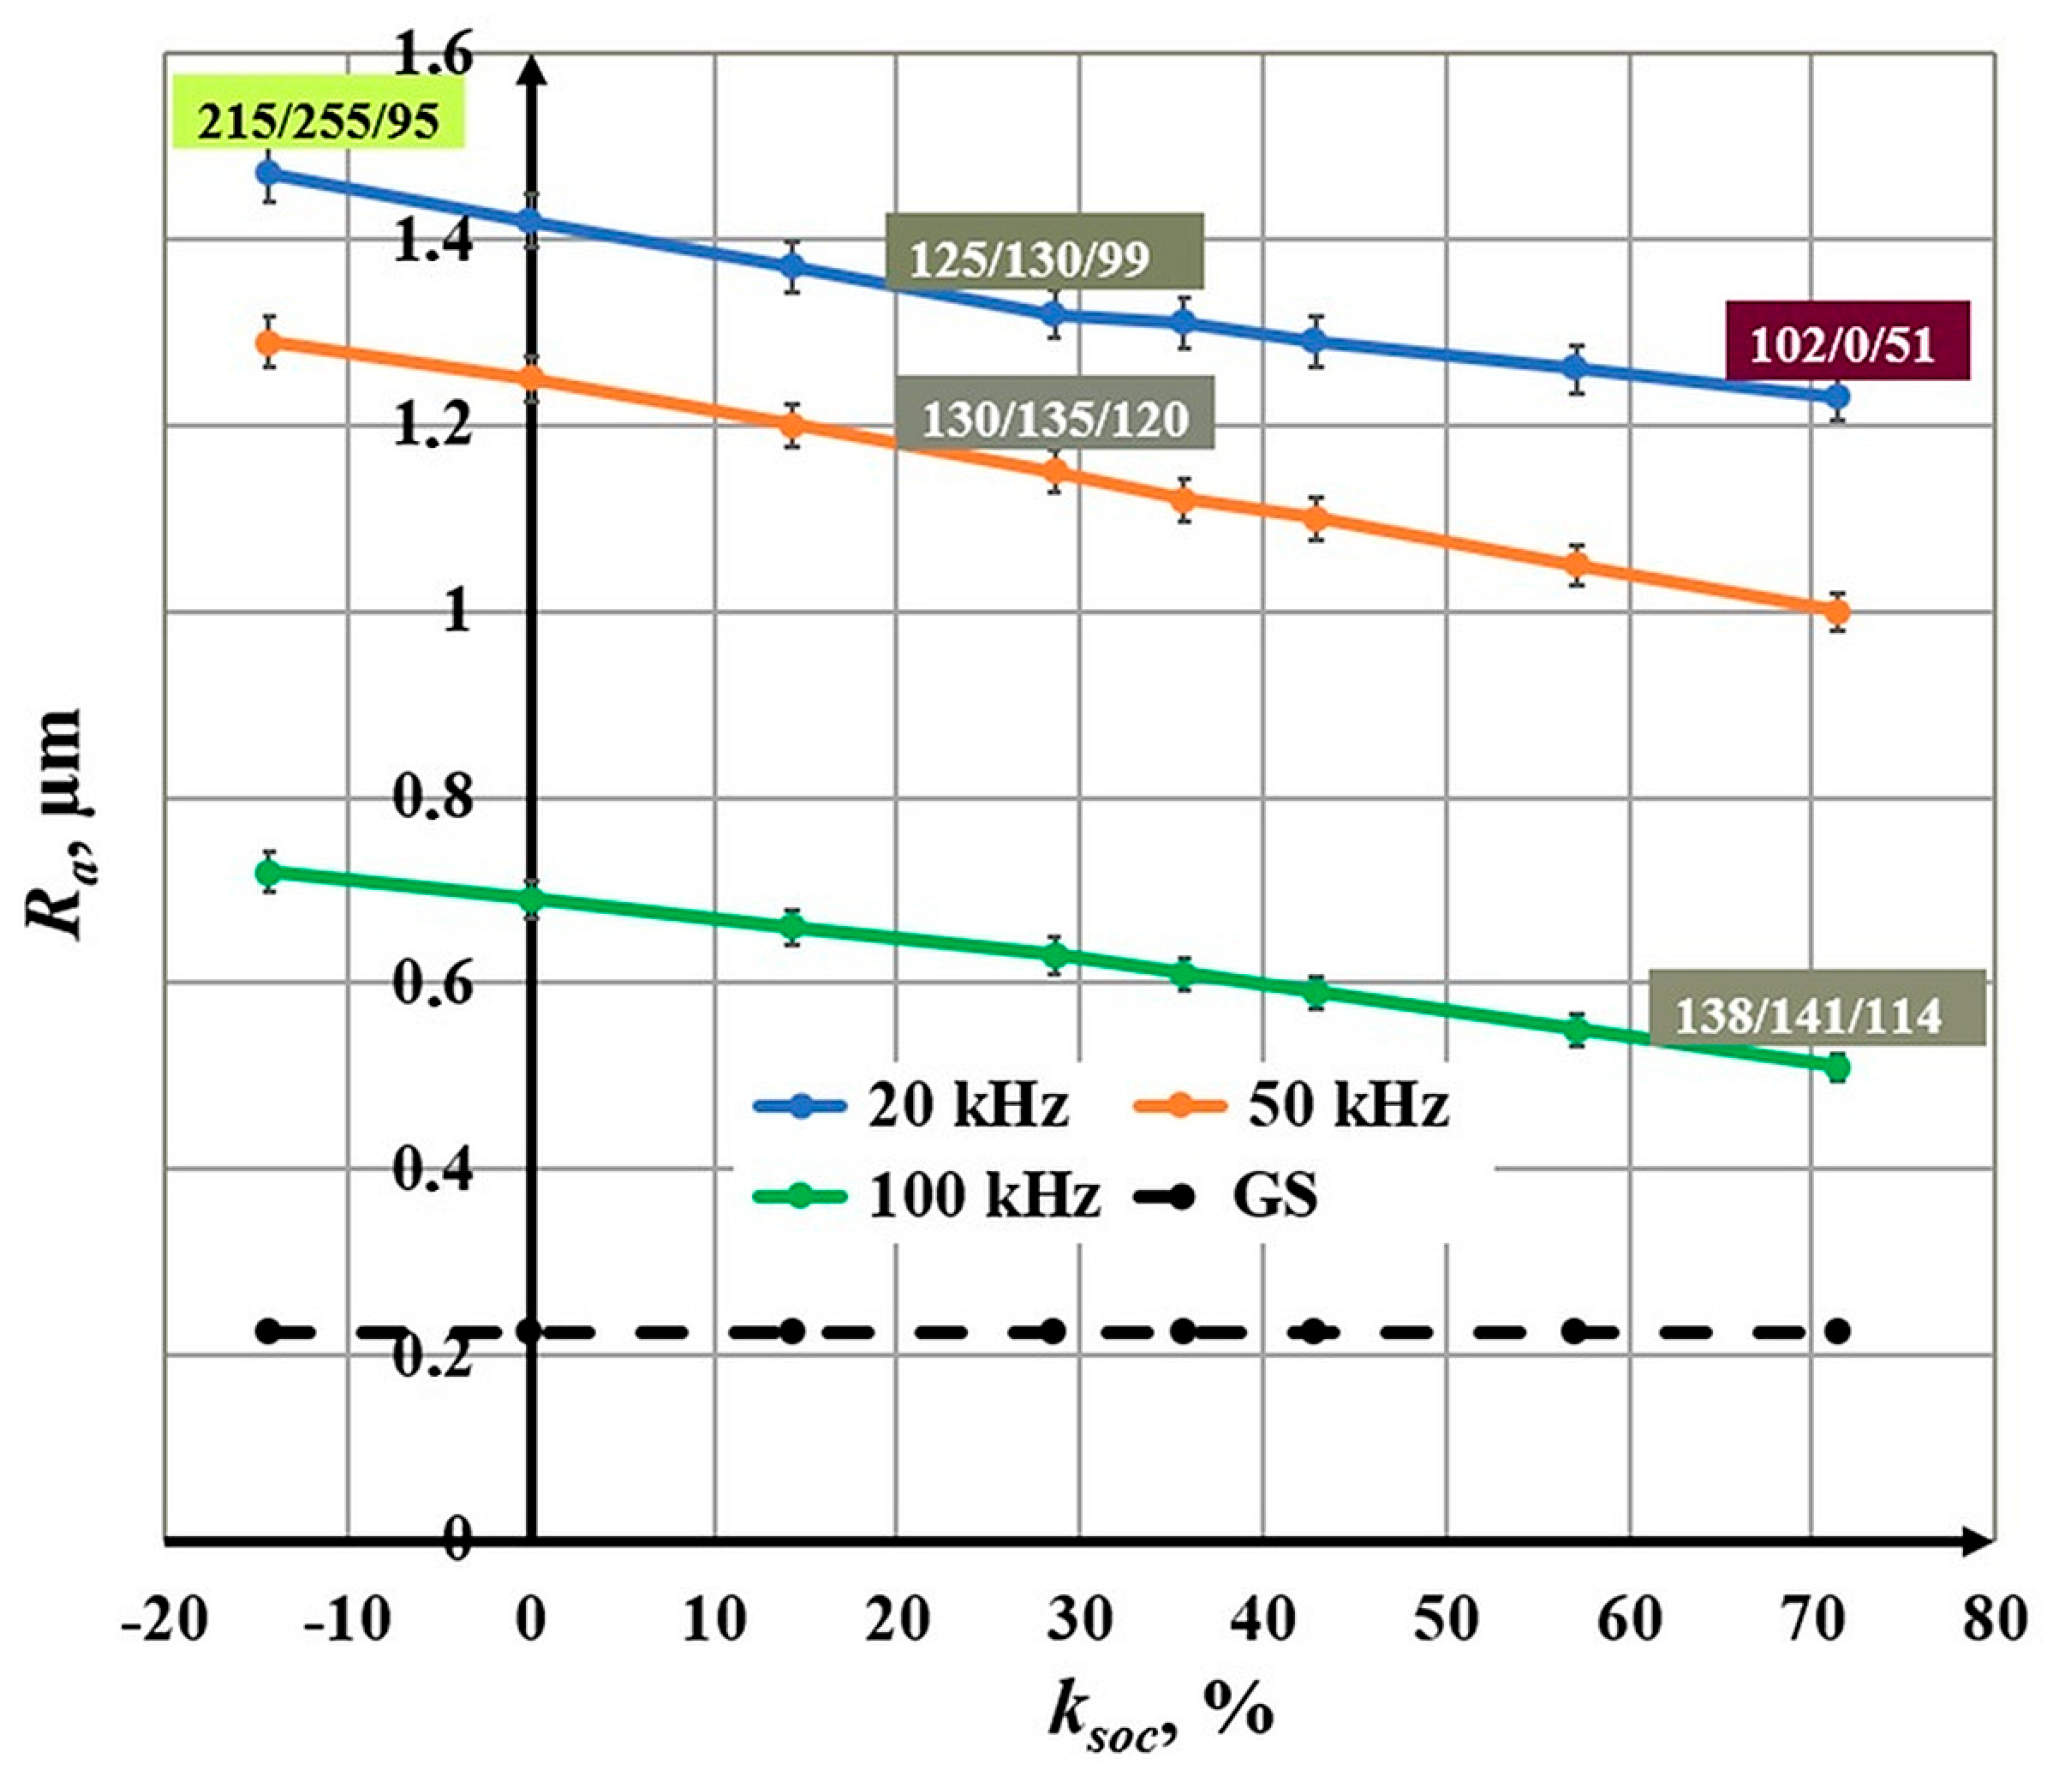
- The role of the scan overlap coefficient ksoc on roughness Ra = Ra (ksoc)
3. Results
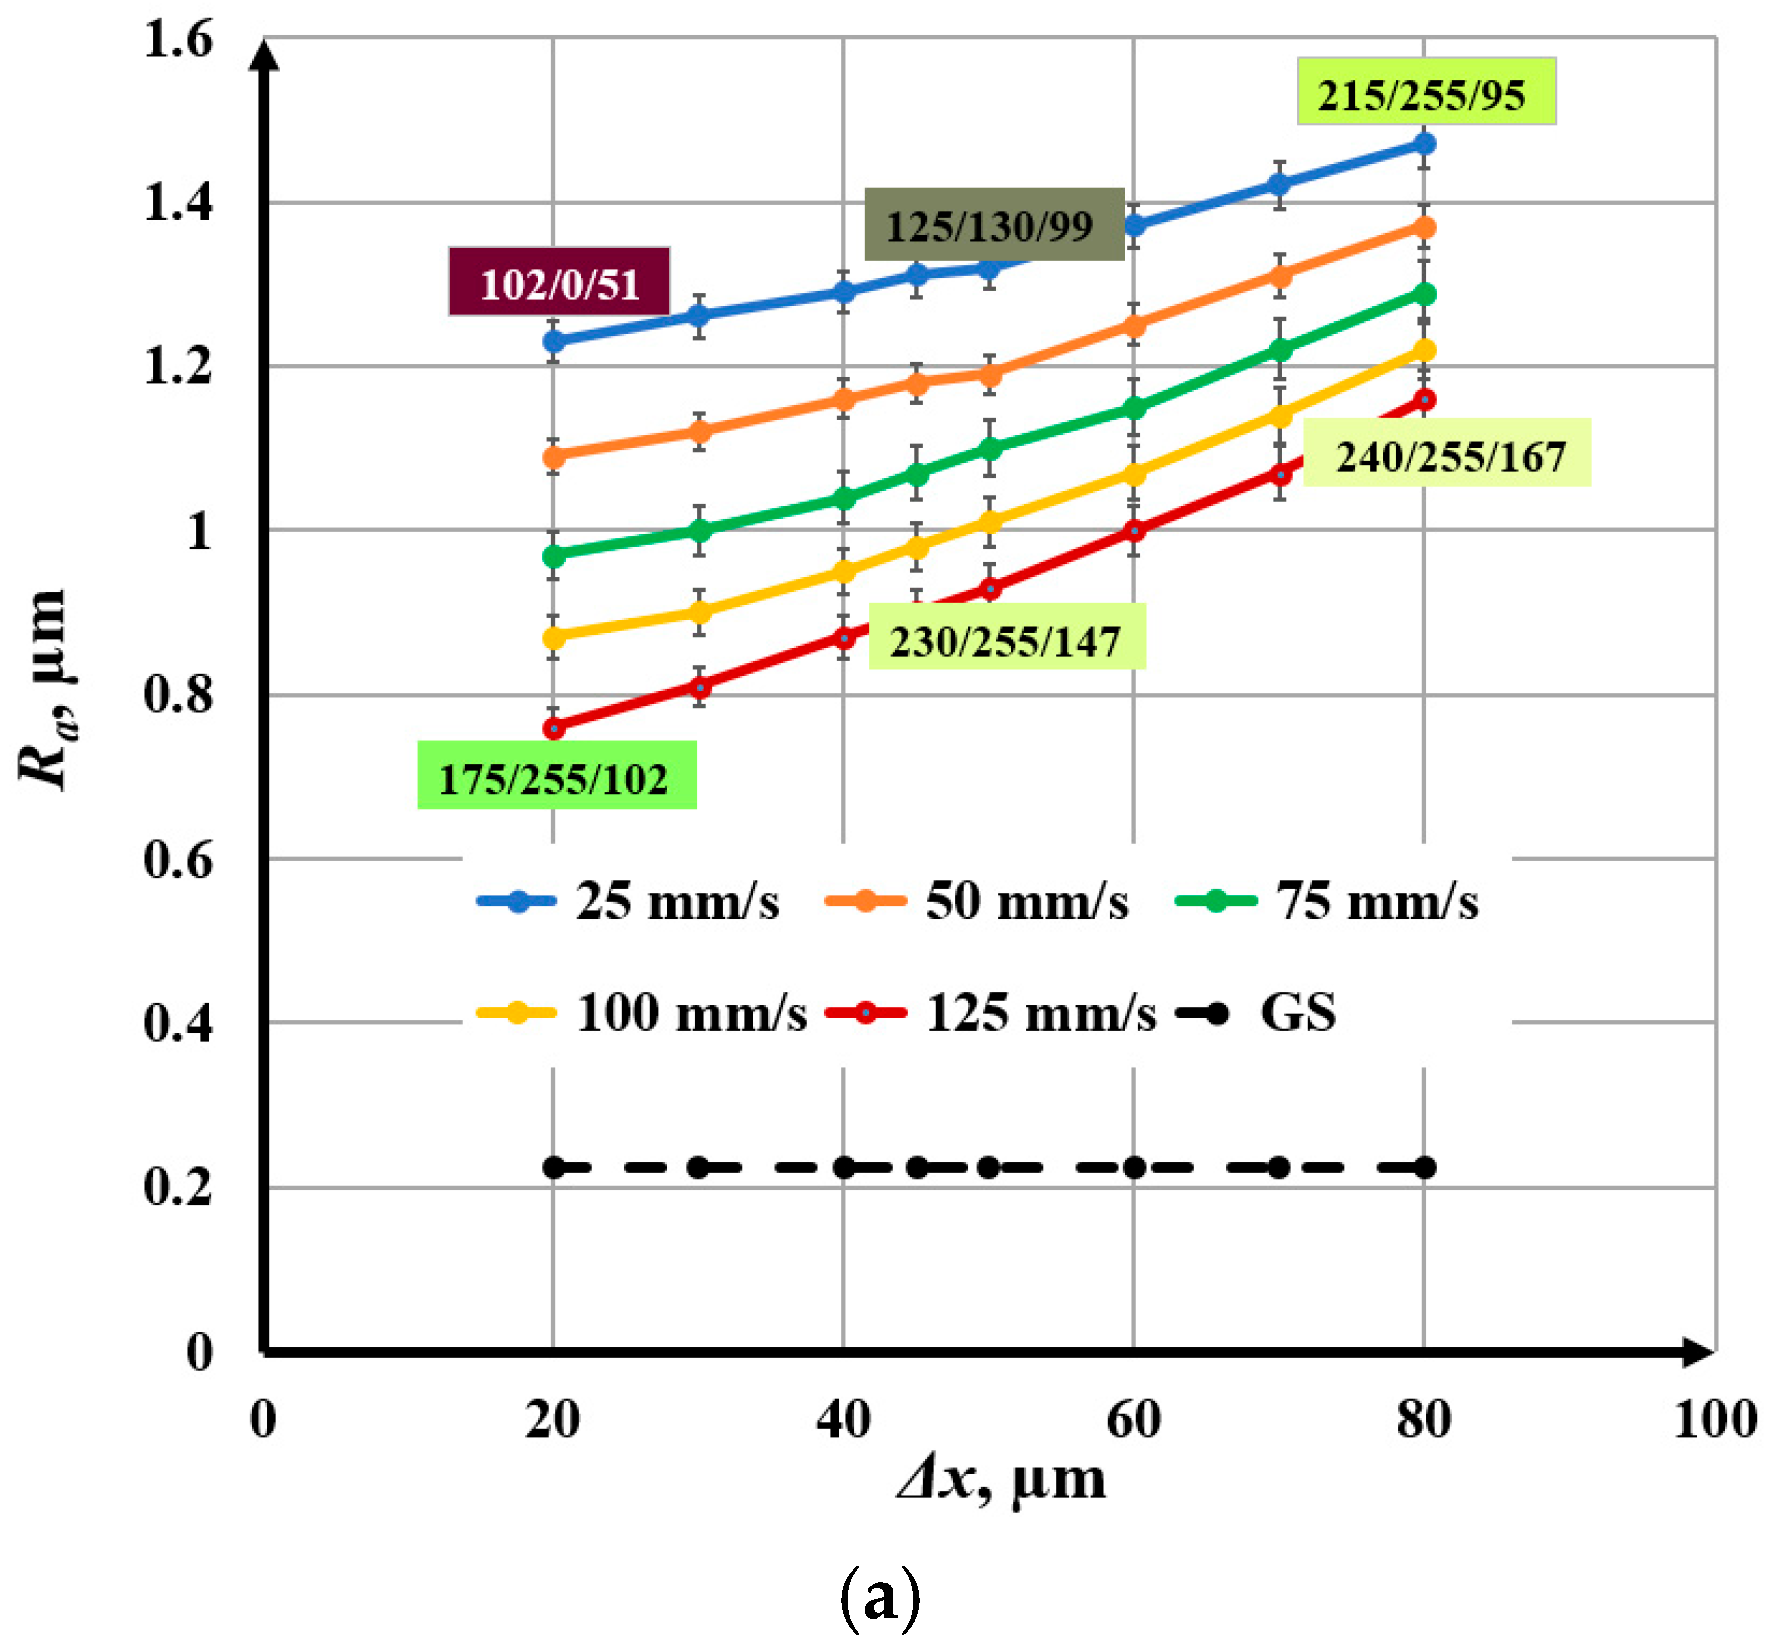
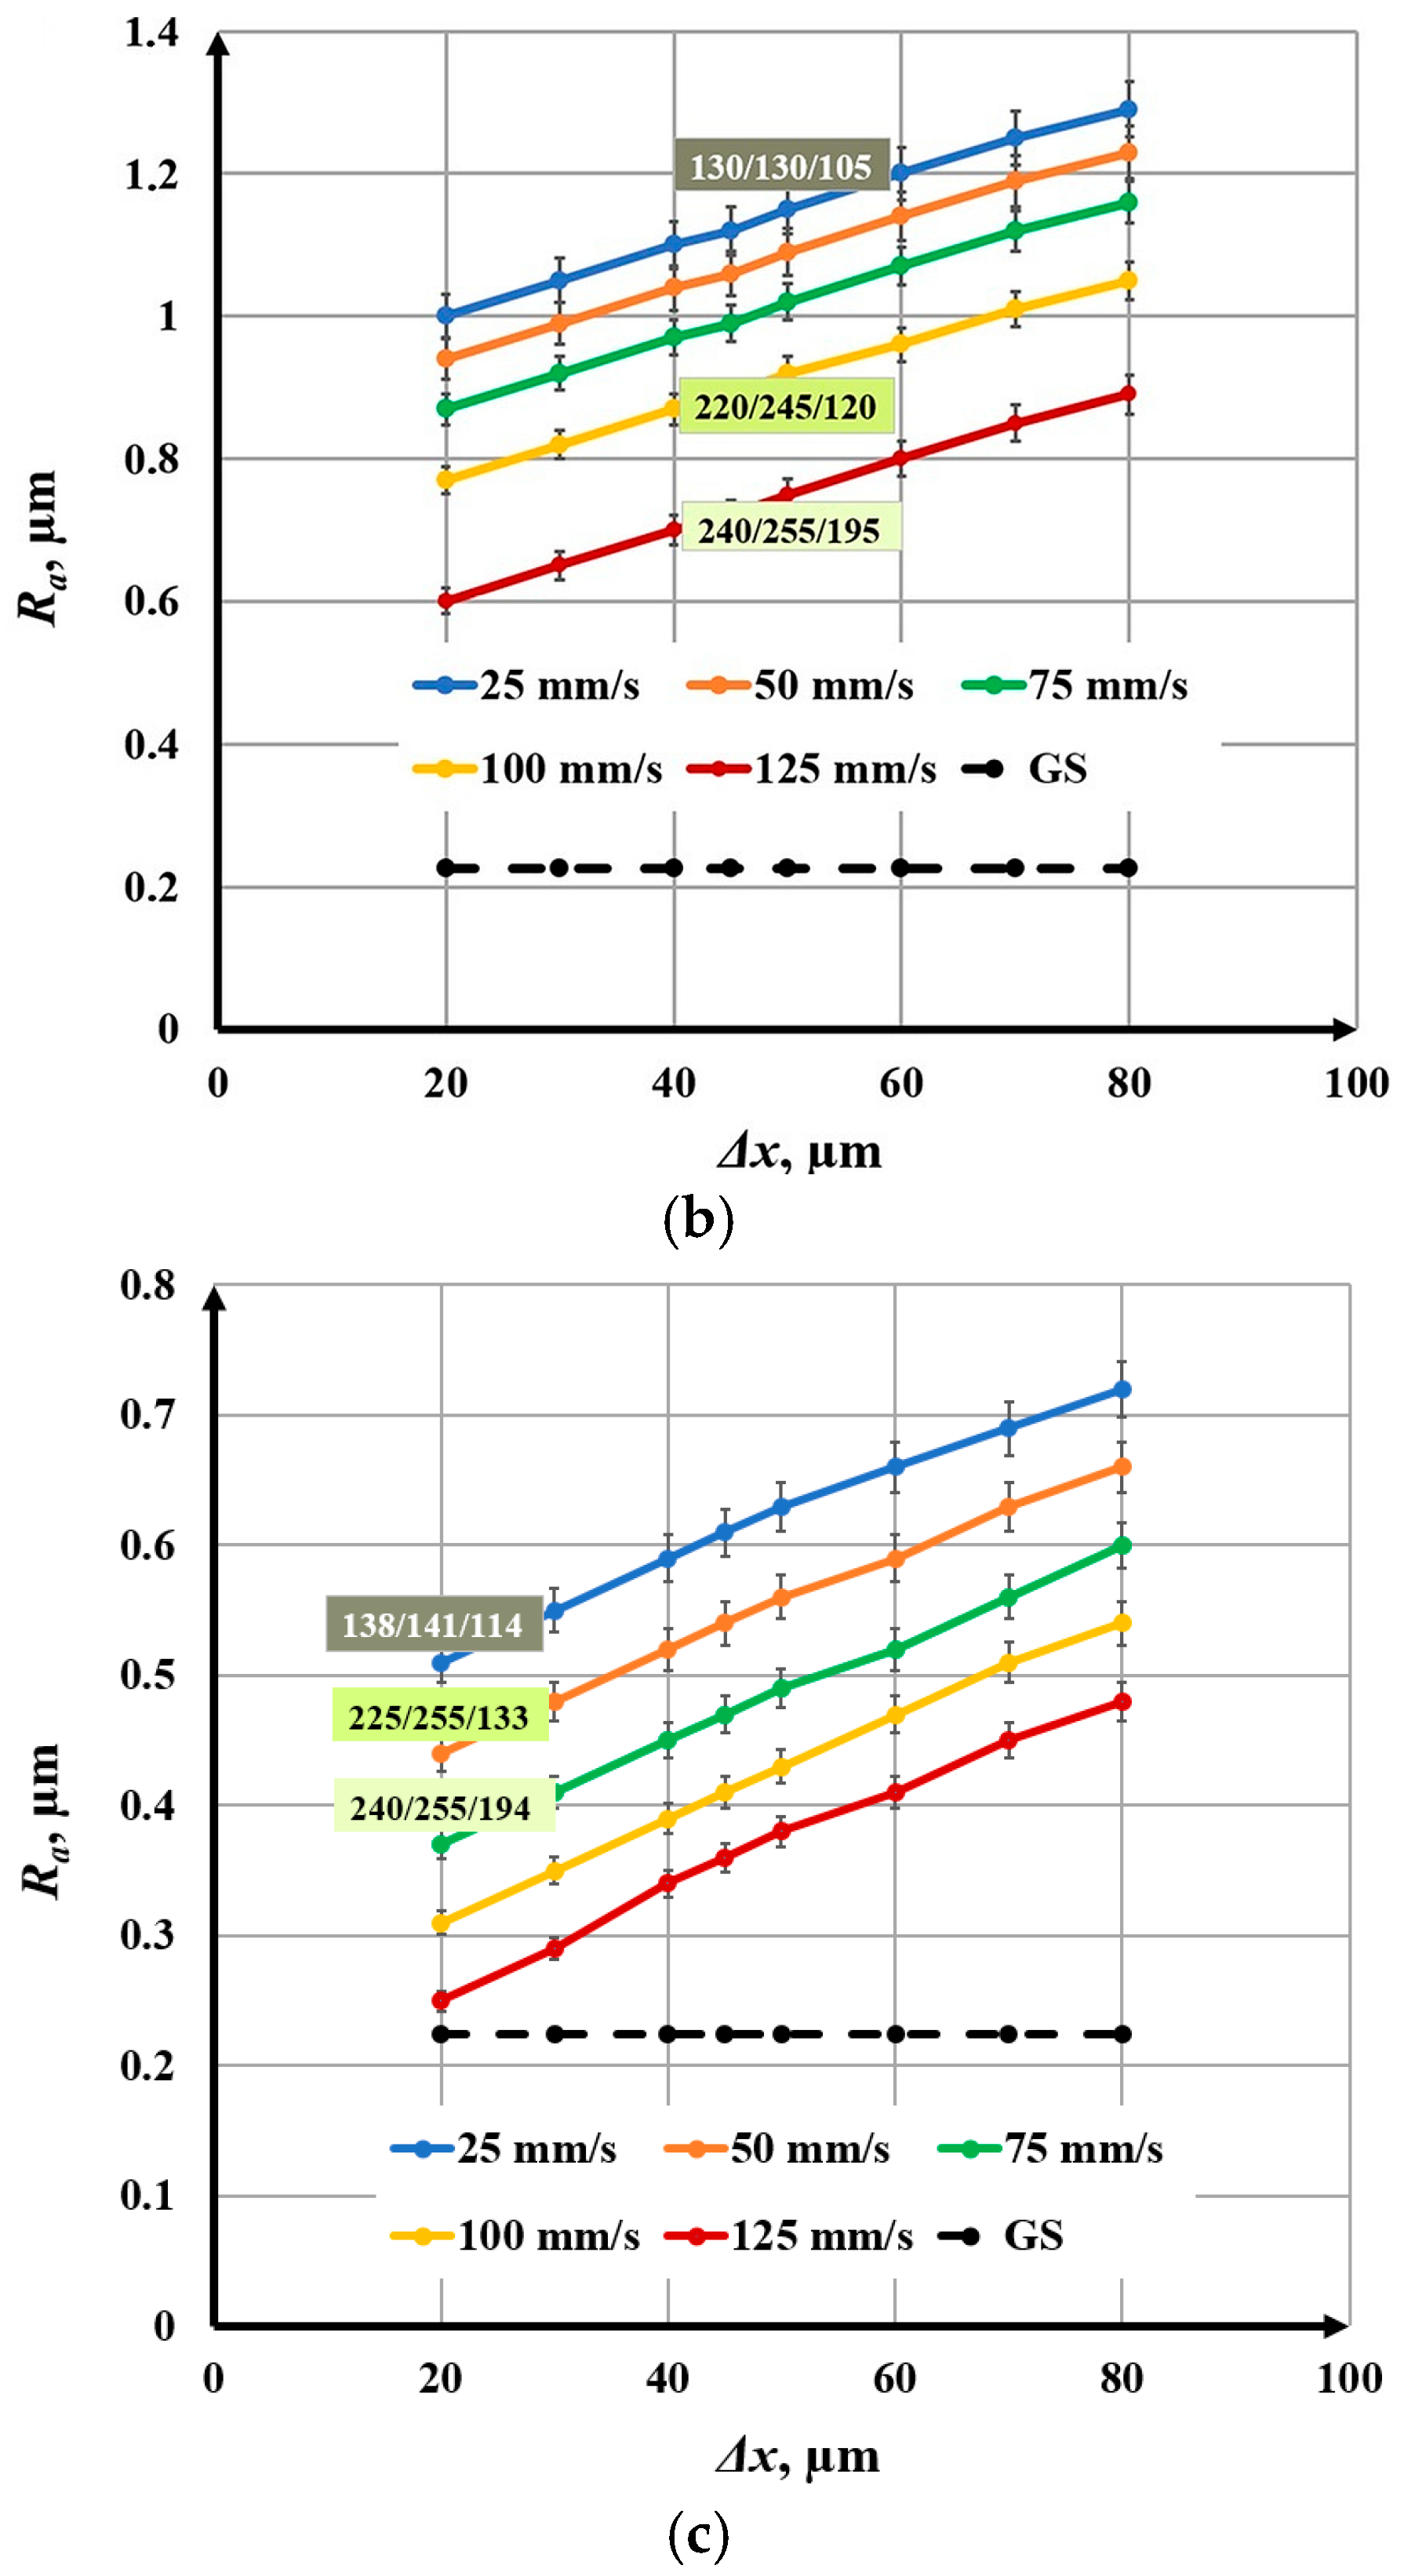
3.1. Influence of Raster Step on Roughness
- With increasing the raster step, an increase in roughness is observed for the five studied speeds and three frequencies;
- For a frequency of 20 kHz and a speed of 25 mm/s, the roughness increases from 1.23 μm to 1.47 μm for the raster step interval from 20 μm to 80 μm. For a frequency of 20 kHz and a speed of 125 mm/s, the roughness increases from 0.76 μm to 1.16 μm for the entire studied raster step interval;
- For a frequency of 50 kHz and a speed of 25 mm/s, the roughness changes from 1.00 μm to 1.29 μm for the raster step interval from 20 μm to 80 μm. For a frequency of 50 kHz and a speed of 125 mm/s, the roughness increases from 0.60 μm to 0.89 μm for the investigated raster pitch interval;
- For a frequency of 100 kHz and a speed of 25 mm/s, the roughness varies from 0.51 μm to 0.72 μm for the raster pitch interval from 20 μm to 80 μm. For a frequency of 100 kHz and a speed of 125 mm/s, the roughness varies from 0.25 μm to 0.48 μm for the investigated raster pitch interval;
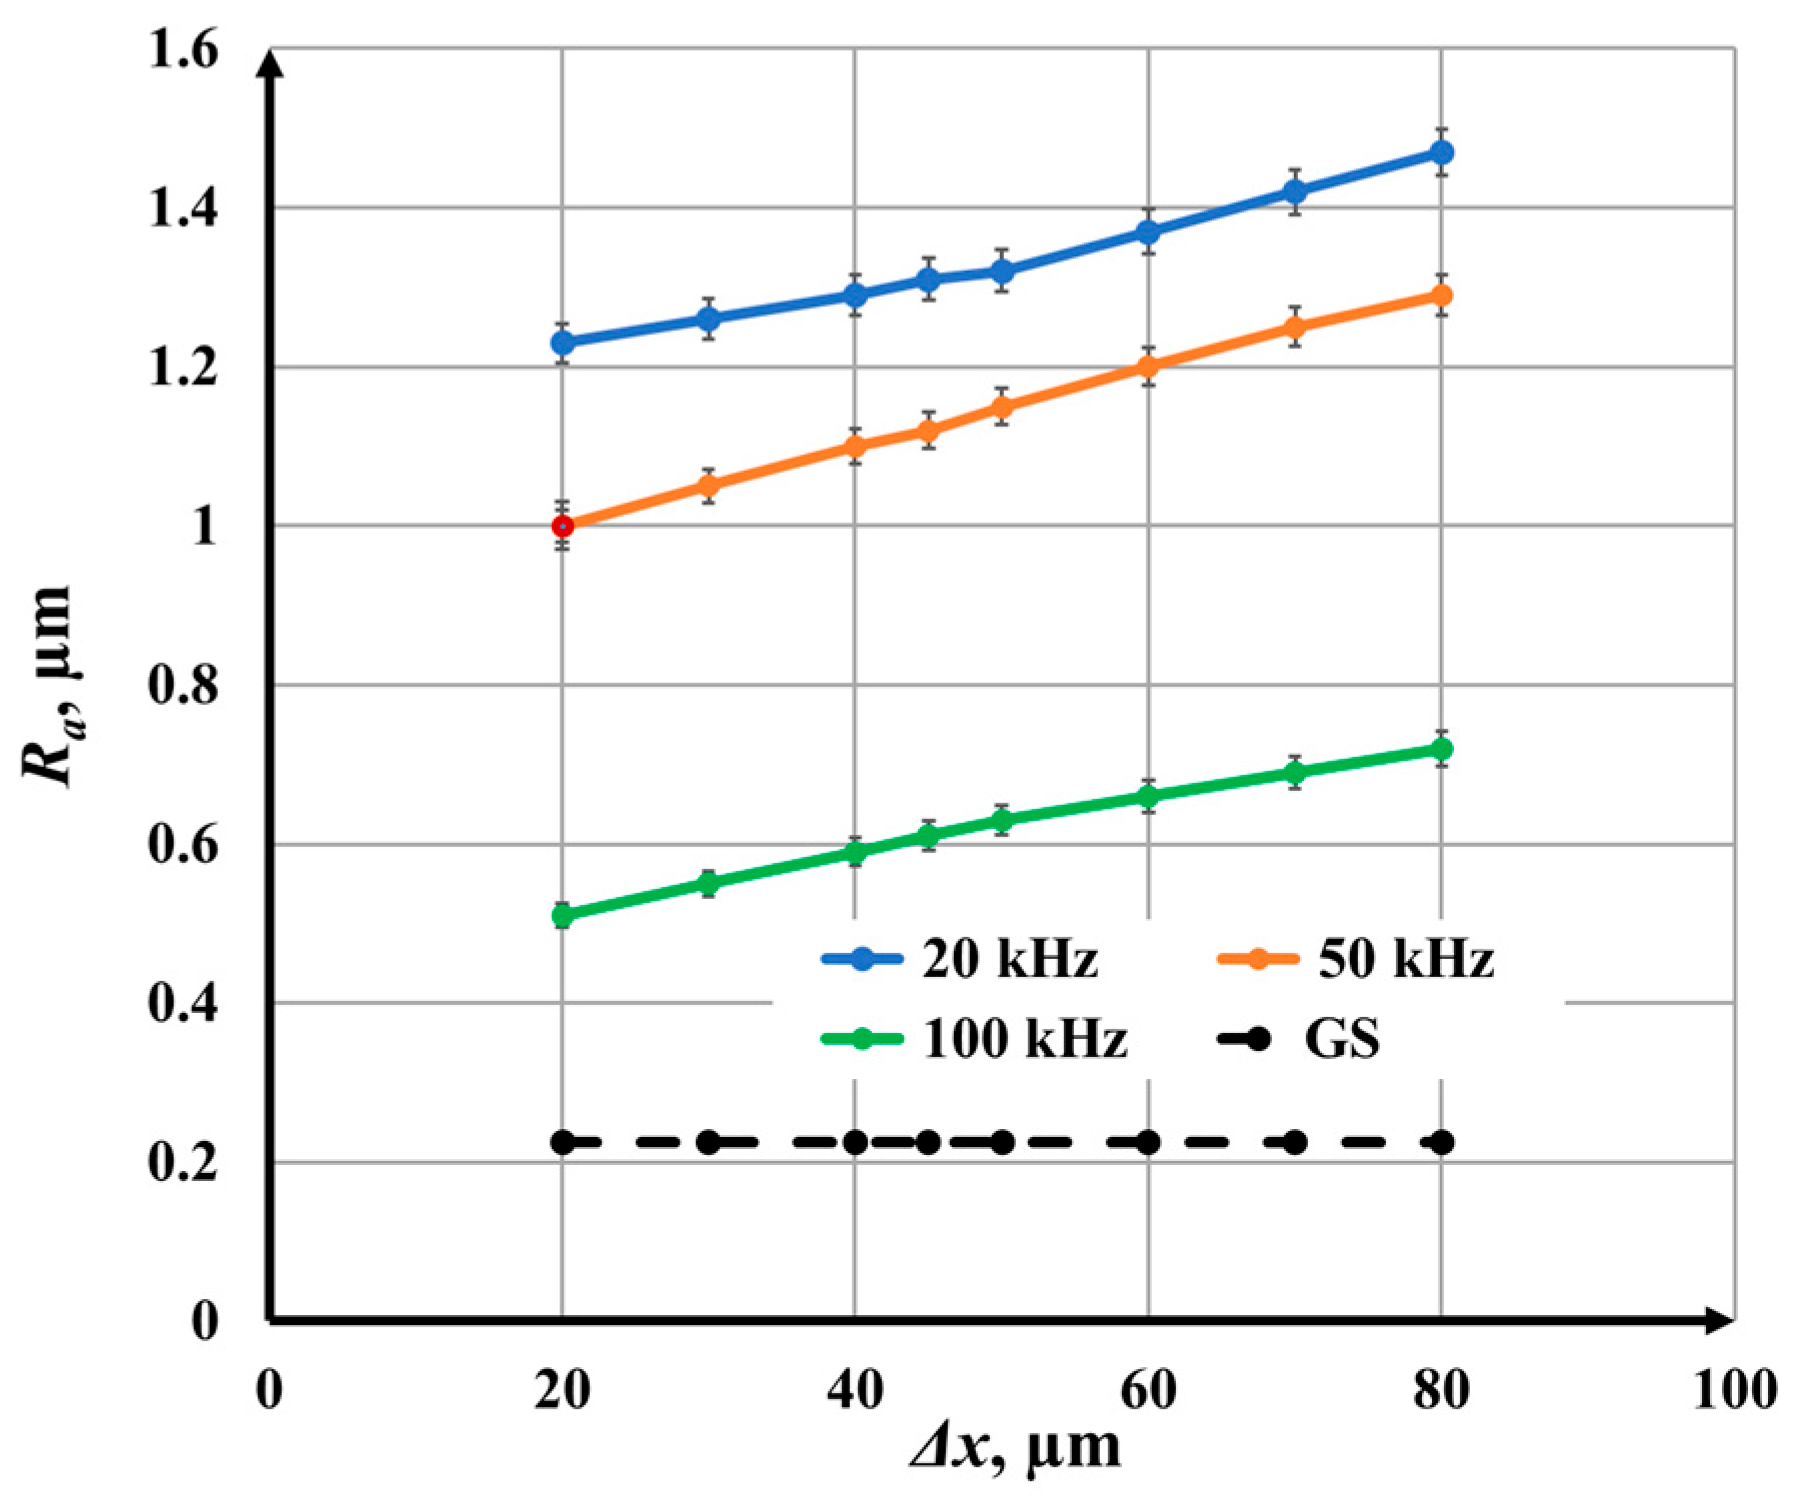
- Graphics of the dependence of roughness on the raster pitch for a speed of 25 mm/s and three frequencies: 20 kHz, 50 kHz, and 100 kHz are presented in Figure 6. For a frequency of 20 kHz, the roughness is about 15% greater than that for 50 kHz and 3–4 times greater than that for a frequency of 100 kHz.
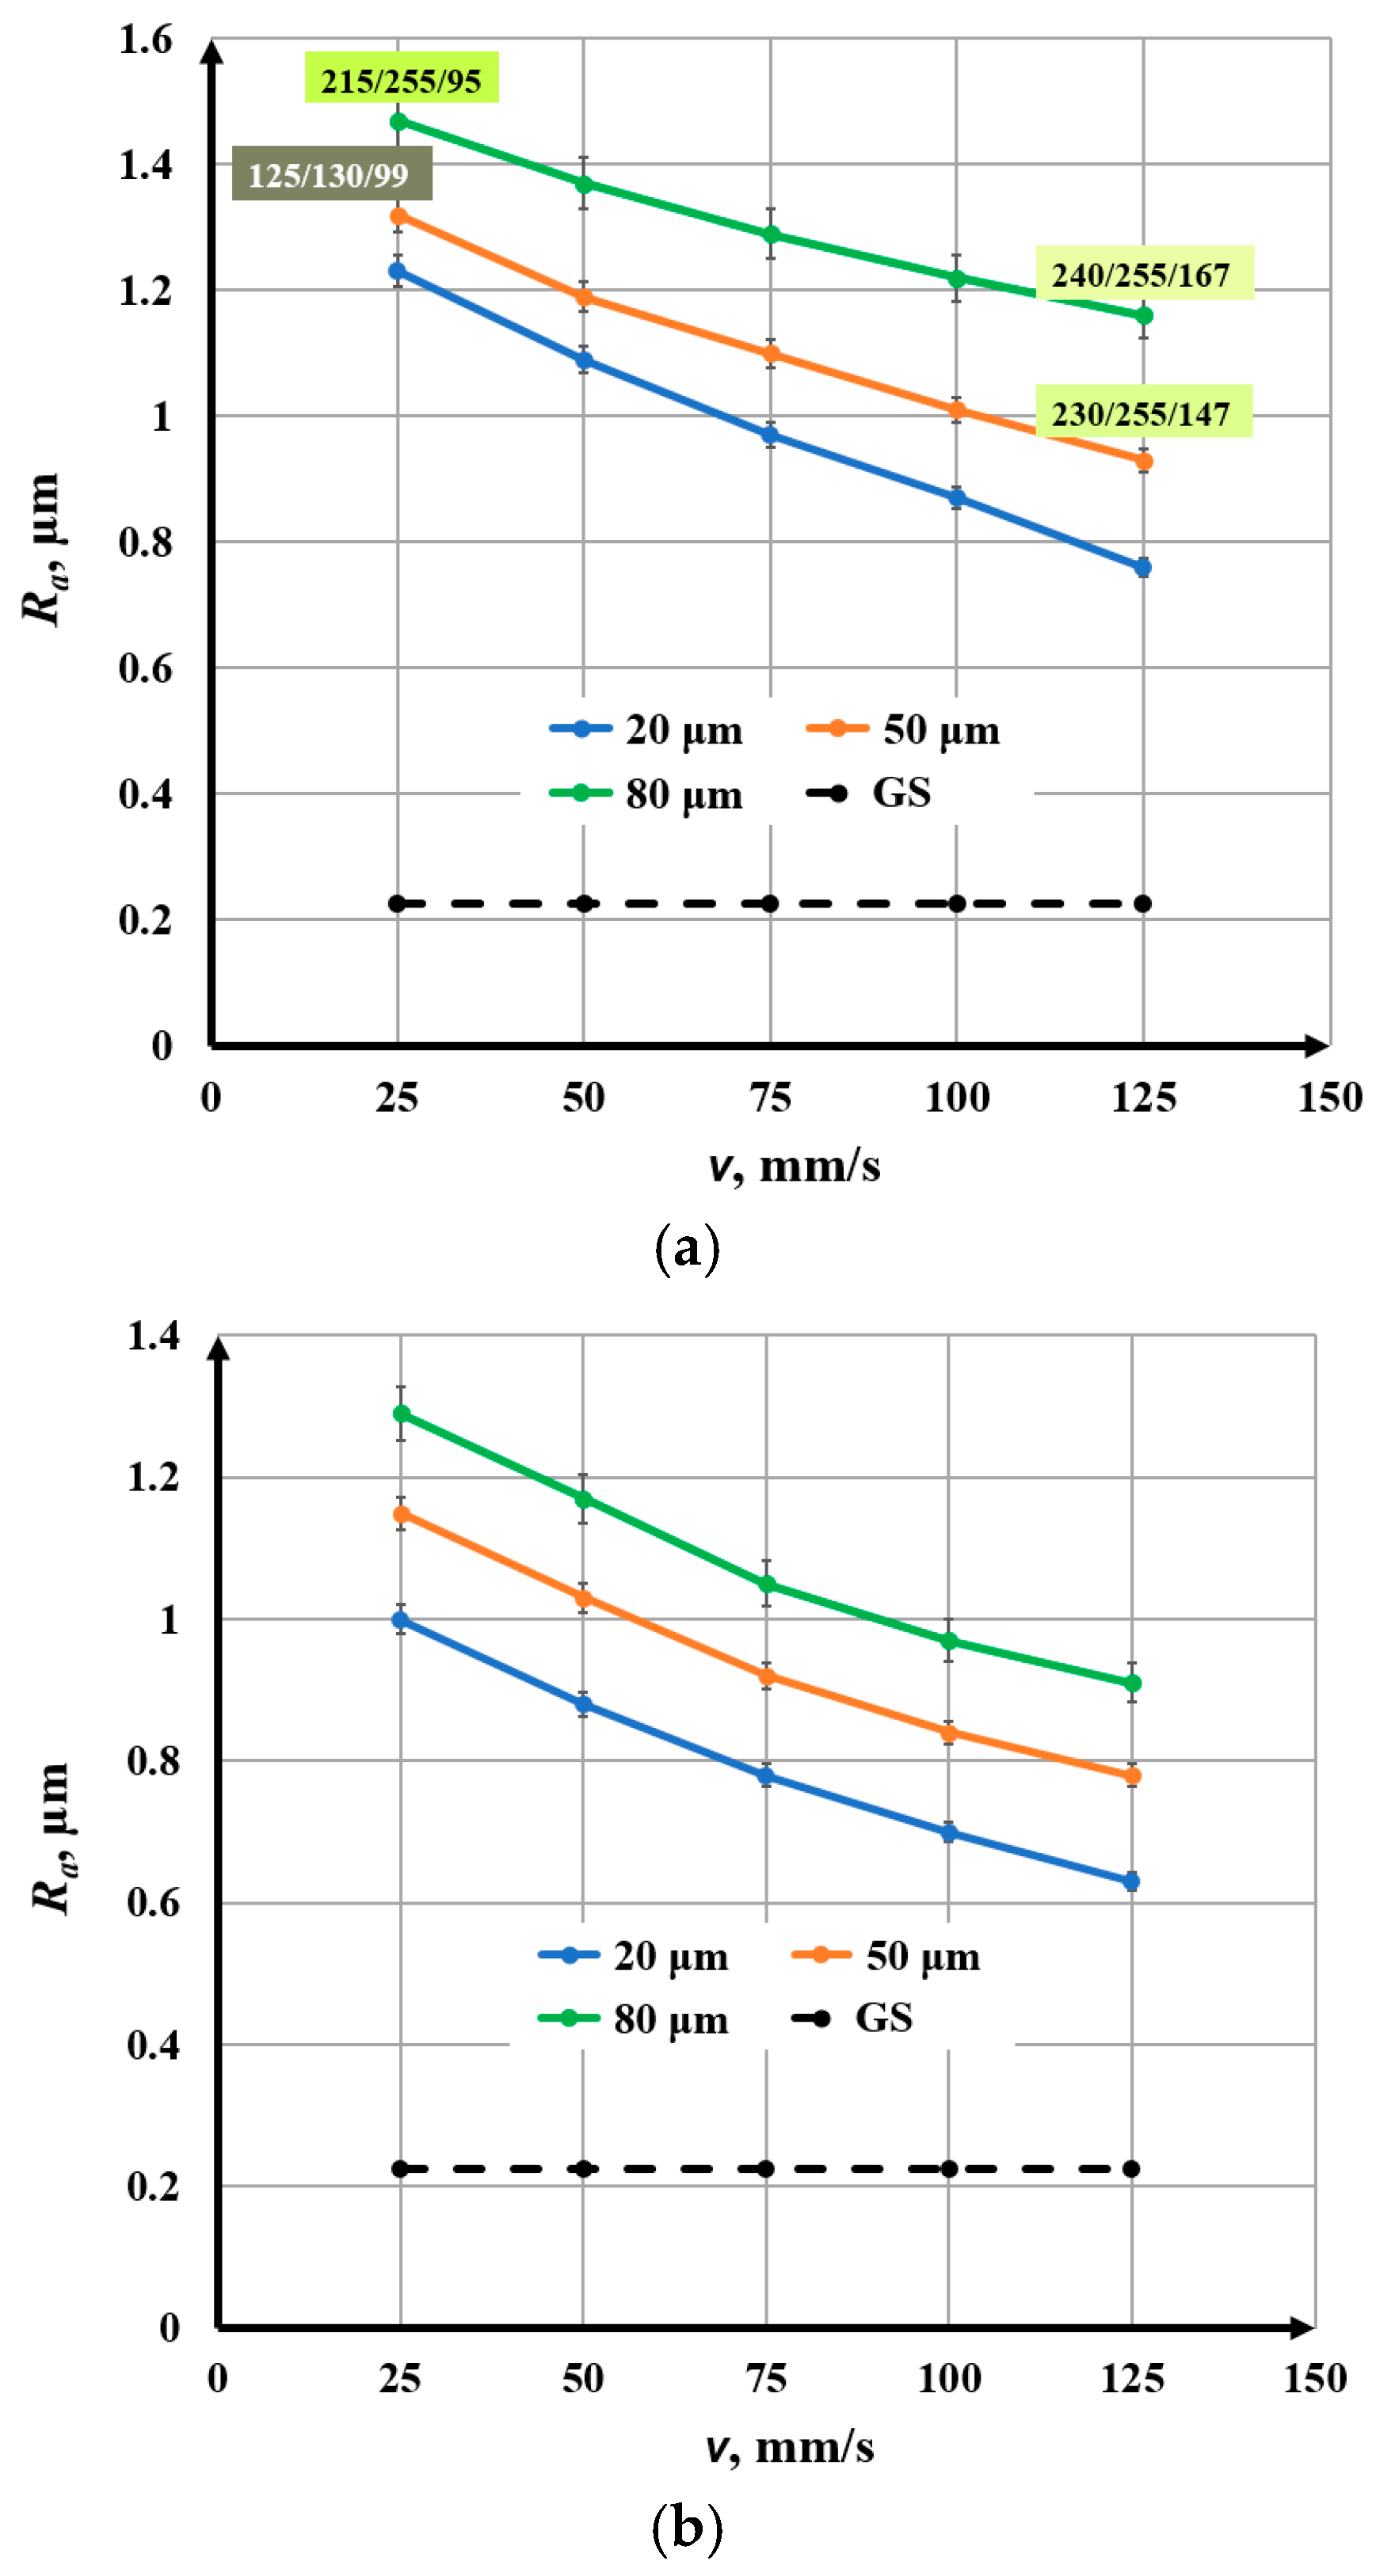
3.2. Influence of Speed on Roughness
- With increasing speed, a nonlinear decrease in roughness is observed for the three studied raster steps and the three frequencies;
- For a frequency of 20 kHz and a raster step of 20 μm, the roughness decreases from 1.23 μm to 0.76 μm for the speed interval from 25 mm/s to 125 mm/s. For a frequency of 20 kHz and a raster step of 80 μm, the roughness decreases from 1.47 μm to 1.16 μm for the entire studied speed interval;
- For a frequency of 50 kHz and a raster step of 20 μm, the roughness changes from 1.00 μm to 0.60 μm for the studied speed interval. For a frequency of 50 kHz and a raster step of 50 μm, the roughness decreases from 1.29 μm to 0.89 μm for the studied speed interval;
- For a frequency of 100 kHz and a raster step of 20 μm, the roughness varies from 0.51 μm to 0.25 μm for the studied speed interval. For a frequency of 100 kHz and a raster step of 80 μm, the roughness varies from 0.72 μm to 0.48 μm for the studied speed interval;
- The graphics of the dependence of roughness on speed for a raster step of 20 μm and three frequencies: 20 kHz, 50 kHz, and 100 kHz are presented in Figure 8. For the frequency of 20 kHz, the roughness is about 20% greater than that for 50 kHz and about 2.5 times greater than that for the frequency of 100 kHz.
3.3. Influence of the Linear Energy Density on the Roughness
- With increasing linear energy density, a nonlinear increase in roughness is observed for the three studied frequencies;
- For a frequency of 20 kHz, the roughness increases from 0.76 μm to 1.23 μm for the linear energy density interval from 1.60 J/cm to 8.00 J/cm;
- For a frequency of 50 kHz, the roughness varies from 0.60 μm to 1.00 μm for the studied linear energy density interval;
- For a frequency of 100 kHz, the roughness increases from 0.25 μm to 0.51 μm for the studied linear energy density interval.
3.4. Influence of the Scan Overlap Coefficient on the Roughness
- With an increasing scanning overlap coefficient, a linear decrease in roughness is observed for the three studied frequencies;
- For a frequency of 20 kHz, the roughness decreases from 1.47 μm to 1.23 μm for the scanning overlap coefficient interval from 10.4% to 71.4%;
- For a frequency of 50 kHz, the roughness changes from 1.29 μm to 1.00 μm for the studied scanning overlap coefficient interval;
- For a frequency of 100 kHz, the roughness decreases from 0.72 μm to 0.51 μm for the studied scanning overlap coefficient interval.
3.5. Influence of Frequency on Roughness
3.6. Relationship Between Technological Parameters and Color Contrast
- With increasing raster step, the roughness of the marked areas increases and a change in the marking from dark (brown color) to light (yellow color) is observed when the other technological parameters are kept constant;
- With increasing speed, the roughness of the marked areas decreases and a change in the marking from dark to light is observed;
- With increasing frequency, the roughness of the marked areas decreases and a lightening of the marking is observed;
- Increasing the linear energy density leads to an increase in the roughness of the marked areas and a darkening of the marking;
- Increasing the scanning overlap coefficient leads to an increase in the roughness of the marked areas and a darkening of the marking.
4. Conclusions
Author Contributions
Funding
Data Availability Statement
Acknowledgments
Conflicts of Interest
References
- Chainarong, S.; Pitakaso, R.; Sirirak, W.; Srichok, T.; Khonjun, S.; Sethanan, K.; Sangthean, T. Multi-Objective Variable Neighborhood Strategy Adaptive Search for Tuning Optimal Parameters of SSM-ADC12 Aluminum Friction Stir Welding. J. Manuf. Mater. Process. 2021, 5, 123. [Google Scholar] [CrossRef]
- Veiko, V.; Odintsova, G.; Ageev, E.; Karlagina, Y.; Loginov, A.; Skuratova, A.; Gorbunova, E. Controlled Oxide Films Formation by Nanosecond Laser Pulses for Color Marking. Opt. Express 2014, 22, 24342–24347. [Google Scholar] [CrossRef] [PubMed]
- Yang, X.; Sheng, J.; Zhao, Y.; Li, L.; Xiao, P.; Liang, S. Effect of TiB2 on properties and microstructures of Cu–W electrical contact materials. Int. J. Refract. Met. Hard Mater. 2024, 119, 106542. [Google Scholar] [CrossRef]
- Schkutow, A.; Frick, T. Laser Color Marking of Stainless Steel—Investigation of the Fluence-Dependent and Thermal Mechanisms in Generating Laser-Induced Surface Modifications. Procedia CIRP 2024, 124, 345–352. [Google Scholar] [CrossRef]
- Leone, C.; Genna, S.; Caprino, G.; De Iorio, I. AISI 304 Stainless Steel Marking by a Q-Switched Diode Pumped Nd:YAG Laser. J. Mater. Process. Technol. 2010, 210, 1297–1303. [Google Scholar] [CrossRef]
- Amara, E.H.; Haïd, F.; Noukaz, A. Experimental Investigations on Fiber Laser Color Marking of Steels. Appl. Surf. Sci. 2015, 351, 142–150. [Google Scholar] [CrossRef]
- Cui, C.Y.; Cui, X.G.; Ren, X.D.; Qi, M.J.; Hu, J.D.; Wang, Y.M. Surface Oxidation Phenomenon and Mechanism of AISI 304 Stainless Steel Induced by Nd:YAG Pulsed Laser. Appl. Surf. Sci. 2014, 305, 817–824. [Google Scholar] [CrossRef]
- Lu, Y.; Tan, Q.; Xia, X.; Xu, S.; Wang, Z.; Zhou, H. Nanosecond Laser Coloration on Stainless Steel Surface. Sci. Rep. 2017, 7, 15538. [Google Scholar] [CrossRef] [PubMed]
- Wang, X.; Xue, Z.; Qin, X.; Song, K.; Liu, D.; Wan, X. Enhancement of laser-induced surface coloring through laser double-scan method. Opt. Laser Technol. 2024, 175, 110738. [Google Scholar] [CrossRef]
- Qin, X.; Xue, Z.; Wang, X.; Song, K.; Wan, X. A Color Reproduction Method for Exploring the Laser-Induced Color Gamut on Stainless Steel Surfaces Based on a Genetic Algorithm. Appl. Sci. 2025, 15, 28. [Google Scholar] [CrossRef]
- Dong, S.; Qu, K.; Hu, Q.; Wang, S.; Chen, K.; Feng, Y. Full-Space Janus Meta-Lens for Shared-Aperture Transmission-Reflection-Independent Focusing of Electromagnetic Wave. Adv. Photon Res. 2024, 5, 2300349. [Google Scholar] [CrossRef]
- Geng, J.; Xu, L.; Yan, W.; Shi, L.; Qiu, M. High-speed laser writing of structural colors for full-color inkless printing. Nat. Commun. 2023, 14, 565. [Google Scholar] [CrossRef] [PubMed]
- Outokumpu. Core 304/4301 Datasheet. Available online: https://www.outokumpu.com (accessed on 23 August 2025).
- AZoMaterials. Medical Applications of Stainless Steel 304 (UNS S30400). AZoM.com. 2012. Available online: https://www.azom.com/article.aspx?ArticleID=6891 (accessed on 23 August 2025).
- Labutin, N.A.; Benin, A.V.; Diachenko, L.K. Experimental verification of a simulation model of high-speed train aerodynamic impact on railway infrastructure. IOP Conf. Ser. Mater. Sci. Eng. 2022, 1252, 012003. [Google Scholar] [CrossRef]
- Dobrotvorskiy, S.; Gnilitskyi, L.; Aleksenko, B.; Basova, Y.; Zawadzki, P.; Mikołaj Kościński, M. Influence of stainless steel surface roughness parameters on the degree of its blackening during femtosecond laser processing. Results Surf. Interfaces 2025, 18, 100390. [Google Scholar] [CrossRef]
- Qin, Q.; Chen, G. Effects of Parameters on Surface Roughness of Metal Parts by Selective Laser Melting. Adv. Mater. Res. 2013, 834–836, 872–875. [Google Scholar] [CrossRef]
- Zhu, H.; Shen, Y.; Sun, H.; Zhang, Z.; Jin, C.; Ge, S.; Xu, K.; Liu, Y.; Wang, J.; Gu, Q. Ultrafast laser-driven precision removal of silver coatings on ceramic substrates: Synergistic experimental investigation and TTM simulation. Int. J. Heat Mass Transf. 2026, 255 Pt 1, 127758. [Google Scholar] [CrossRef]
- AGUS. AISI 304 (1.4301/304S31/X5CrNi18-10)—Austenitic Steel. Available online: https://www.agst.de/4301?lang=en (accessed on 14 October 2025).
- Xiao, B.; Zhang, Y. Marangoni and Buoyancy Effects on Direct Metal Laser Sintering with a Moving Laser Beam. Numer. Heat Transf. Part A Appl. 2007, 51, 715–733. [Google Scholar] [CrossRef]
| Chemical Element | Content, % | Chemical Element | Content, % |
|---|---|---|---|
| C | <0.07 | Si | <1.0 |
| Cr | 17.5–19.5 | P | <0.045 |
| Ni | 8.0–10.5 | S | <0.03 |
| Mn | <2.0 | Fe | Balance |
| N | <0.10 |
| Parameter | Value |
|---|---|
| Coefficients of thermal conductivity k, W/(m.K) | 16.2 |
| Density ρ, kg/m3 | 7850 |
| Specific heat capacity c, J/(kg.K) | 504 |
| Coefficients of thermal diffusivity a, m2/s | 4.09 × 10⁻⁶ |
| Parameter | Value | Parameter | Value |
|---|---|---|---|
| Wavelength λ, nm | 1064 | Pulse energy Ep, mJ | 0.08–1.00 |
| Average power P, W | 20 | Pulse power Pp, kW | 0.80–10.0 |
| Frequency ν, kHz | 20–250 | Beam quality M2 | <1.1 |
| Pulse duration τ, ns | 100 | Scan speed v, mm/s | 1–20,000 |
| Positioning accuracy | ±2.5 μm | Efficiency, % | 40 |
| Diameter in focus d, µm | 70 |
| Parameter | Value | Parameter | Value |
|---|---|---|---|
| Total magnification | 54×–17,280× | Measurement accuracy | ±1.5% |
| Field of view | 16 μm–5120 μm | Laser wavelength | 405 nm |
| Display resolution | 1 nm | Laser source power | 0.95 mW |
| Max measuring points | 4096 × 4096 pixels | Optical zoom | 54×–2160× |
| Parameter | Value | Parameter | Value |
|---|---|---|---|
| Power P, W | 20 | Number of repetition Pp, kW | 1 |
| Frequency v, kHz | 20, 50, 100 | Defocusing Δf | 0 |
| Pulse duration τ, ns | 100 | Diameter of working spot d, µm | 70 |
| ν, kHz | v, mm/s | Δx, μm | ksoc, % | El, J/cm | Ra, μm | R/G/B |
|---|---|---|---|---|---|---|
| 20 | 25 | 20 | 71.4 | 8.00 | 1.23 | 102/0/51 |
| 20 | 25 | 50 | 28.6 | 8.00 | 1.32 | 125/130/99 |
| 20 | 25 | 80 | −14.3 | 8.00 | 1.47 | 215/255/95 |
| 20 | 75 | 20 | 71.4 | 2.67 | 0.97 | 195/255/35 |
| 20 | 75 | 50 | 28.6 | 2.67 | 1.10 | 215/255/130 |
| 20 | 125 | 20 | 71.4 | 1.60 | 0.76 | 175/255/102 |
| 20 | 125 | 50 | 28.6 | 1.60 | 0.93 | 230/255/147 |
| 20 | 125 | 80 | −14.3 | 1.60 | 1.16 | 240/255/167 |
| 50 | 25 | 50 | 28.6 | 8.00 | 1.15 | 130/135/120 |
| 50 | 50 | 50 | 28.6 | 4.00 | 1.09 | 210/240/107 |
| 50 | 100 | 50 | 28.6 | 2.00 | 0.92 | 220/245/120 |
| 50 | 125 | 50 | 28.6 | 1.60 | 0.75 | 240/255/195 |
| 100 | 25 | 20 | 71.4 | 8.00 | 0.51 | 138/141/114 |
| 100 | 50 | 20 | 71.4 | 4.00 | 0.44 | 225/255/133 |
| 100 | 75 | 20 | 71.4 | 2.67 | 0.37 | 240/255/194 |
| 100 | 125 | 20 | 71.4 | 1.60 | 0.25 | 255/255/223 |
Disclaimer/Publisher’s Note: The statements, opinions and data contained in all publications are solely those of the individual author(s) and contributor(s) and not of MDPI and/or the editor(s). MDPI and/or the editor(s) disclaim responsibility for any injury to people or property resulting from any ideas, methods, instructions or products referred to in the content. |
© 2025 by the authors. Licensee MDPI, Basel, Switzerland. This article is an open access article distributed under the terms and conditions of the Creative Commons Attribution (CC BY) license (https://creativecommons.org/licenses/by/4.0/).
Share and Cite
Lazov, L.; Angelov, N.; Yankov, E.; Karadzhov, T.; Pulov, D.; Dichev, D. Influence of Laser Processing Parameters on Surface Roughness and Color Formation in the Marked Zone. Materials 2025, 18, 5037. https://doi.org/10.3390/ma18215037
Lazov L, Angelov N, Yankov E, Karadzhov T, Pulov D, Dichev D. Influence of Laser Processing Parameters on Surface Roughness and Color Formation in the Marked Zone. Materials. 2025; 18(21):5037. https://doi.org/10.3390/ma18215037
Chicago/Turabian StyleLazov, Lyubomir, Nikolay Angelov, Emil Yankov, Tsanko Karadzhov, Dimcho Pulov, and Dimitar Dichev. 2025. "Influence of Laser Processing Parameters on Surface Roughness and Color Formation in the Marked Zone" Materials 18, no. 21: 5037. https://doi.org/10.3390/ma18215037
APA StyleLazov, L., Angelov, N., Yankov, E., Karadzhov, T., Pulov, D., & Dichev, D. (2025). Influence of Laser Processing Parameters on Surface Roughness and Color Formation in the Marked Zone. Materials, 18(21), 5037. https://doi.org/10.3390/ma18215037


