


Investigation of Biodegradation, Artificial Aging and Antibacterial Properties of Poly(Butylene Succinate) Biocomposites with Onion Peels and Wheat Bran

 , , and
Abstract
1. Introduction
2. Materials and Methods
2.1. Materials and Production of Measurement Samples of Biocomposites
- −
- PBS for injection molding, named BioPBS with symbol FZ71 PB [40] (PTT MCC BIOCHEM Co., Ltd., Bangkok, Thailand) in the form of granules—density 1.26 g/cm3, melting point 115 °C, MFR (190 °C, 2.16 kg) 22 g/10 min.
- −
- Onion peels (OPs) came from a local fruit and vegetable processing plant (Lublin, Poland) in the form of thin yellow-brown peels that were ground in a knife mill before being introduced into the biocomposite; particle diameter was up to 300 µm.
- −
- Wheat bran WB from durum wheat (Triricum durum) came from PZZ Lubella GMW (Lublin, Poland) in the form of flakes; particle diameter was up to 500 µm.
2.2. Methodology
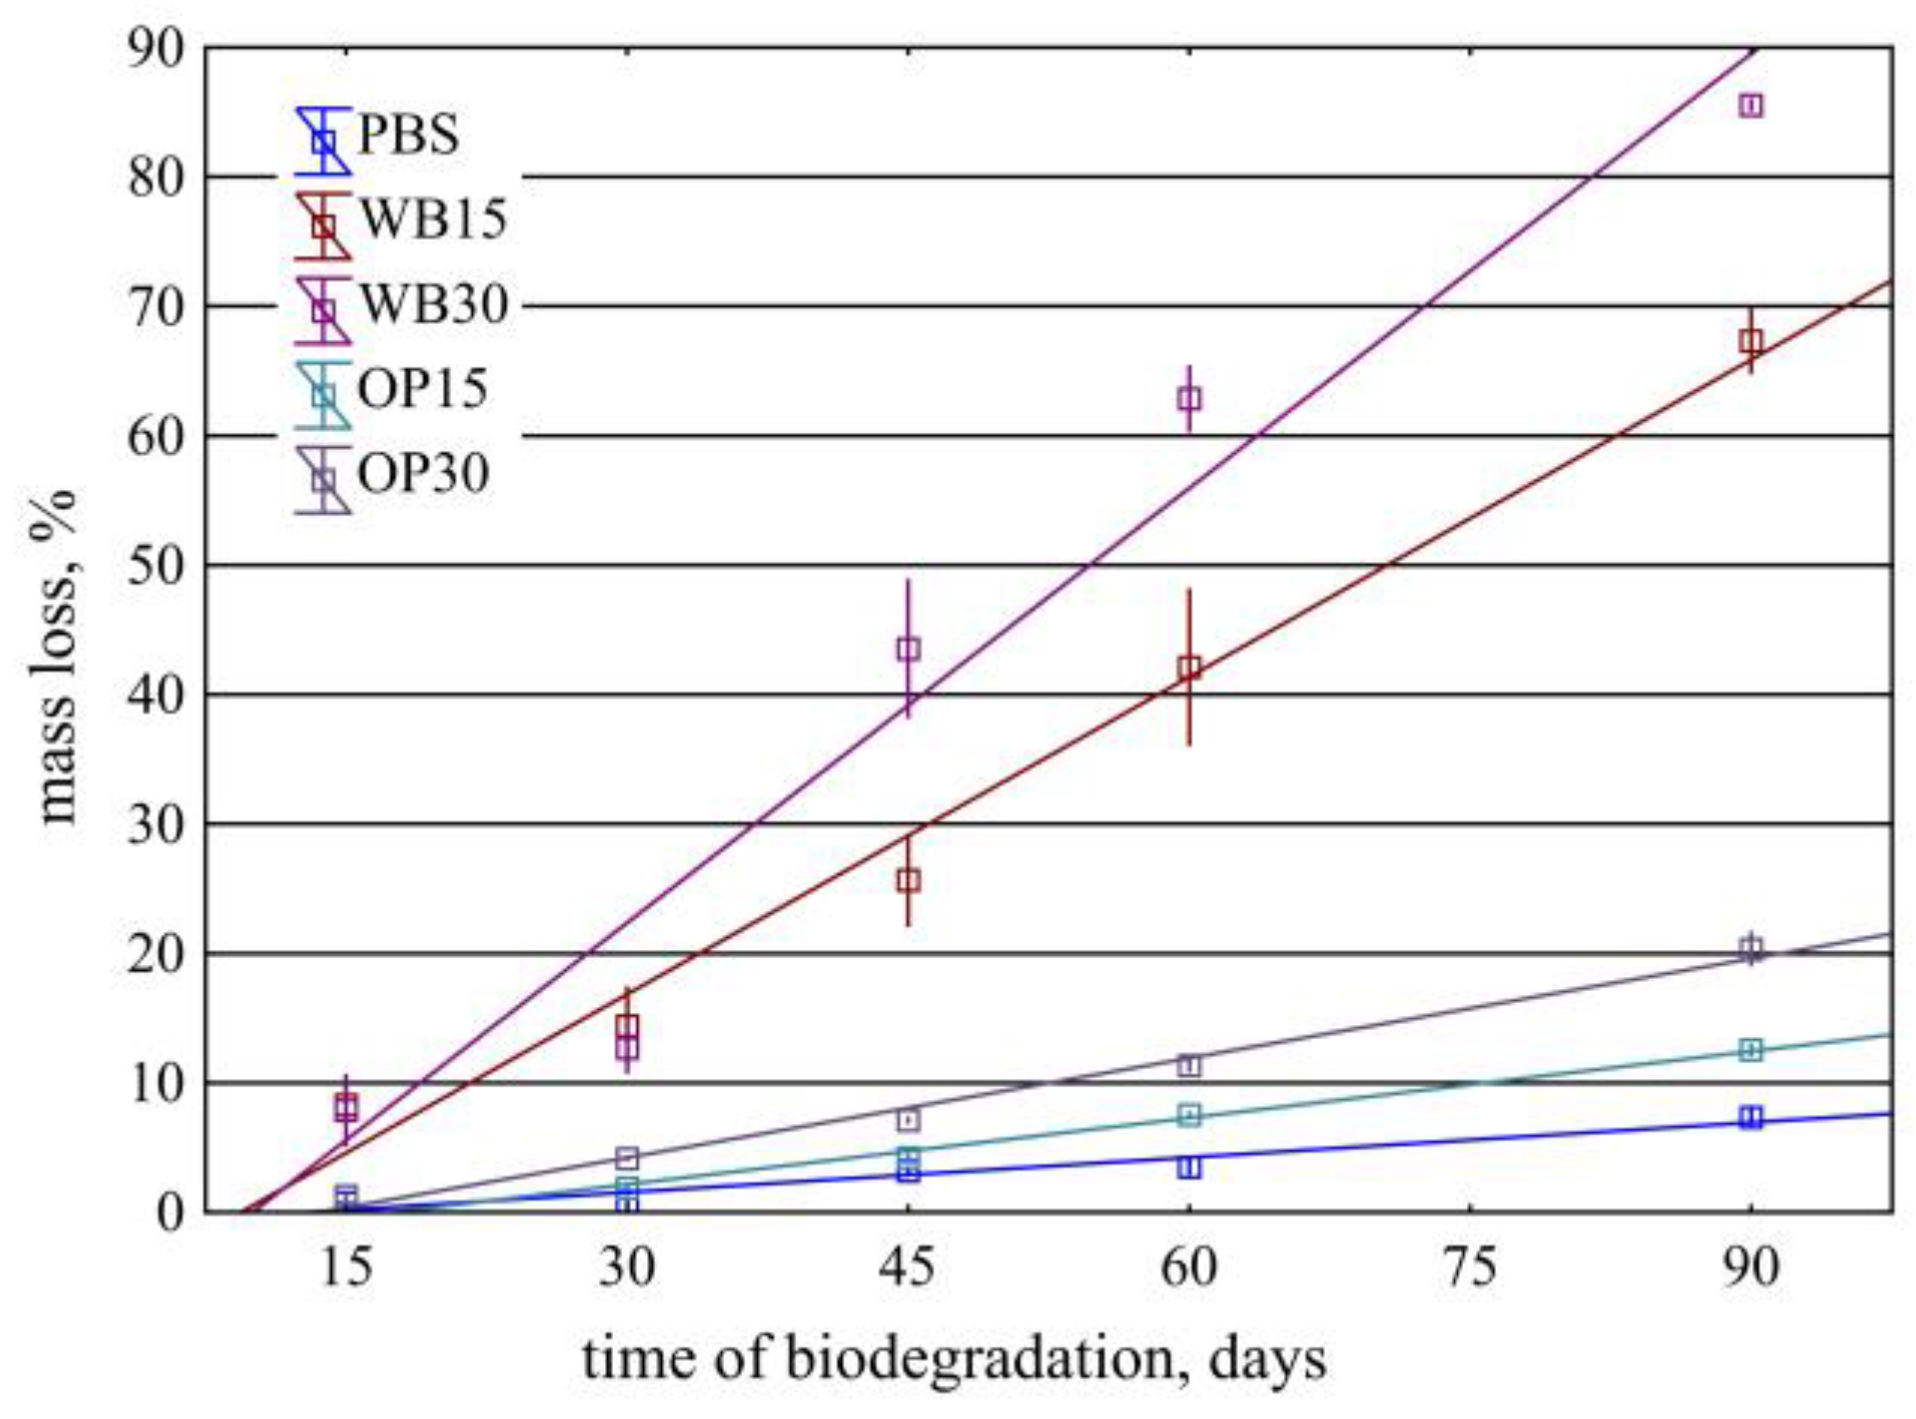
- Mass loss of the biocomposites was determined based on the measurement of the dry mass of individual samples before and after the composting process. Mass loss was calculated from Equation (1), where mi—initial dry mass of the sample; mr—dry mass of the remaining sample after composting that has not decomposed.
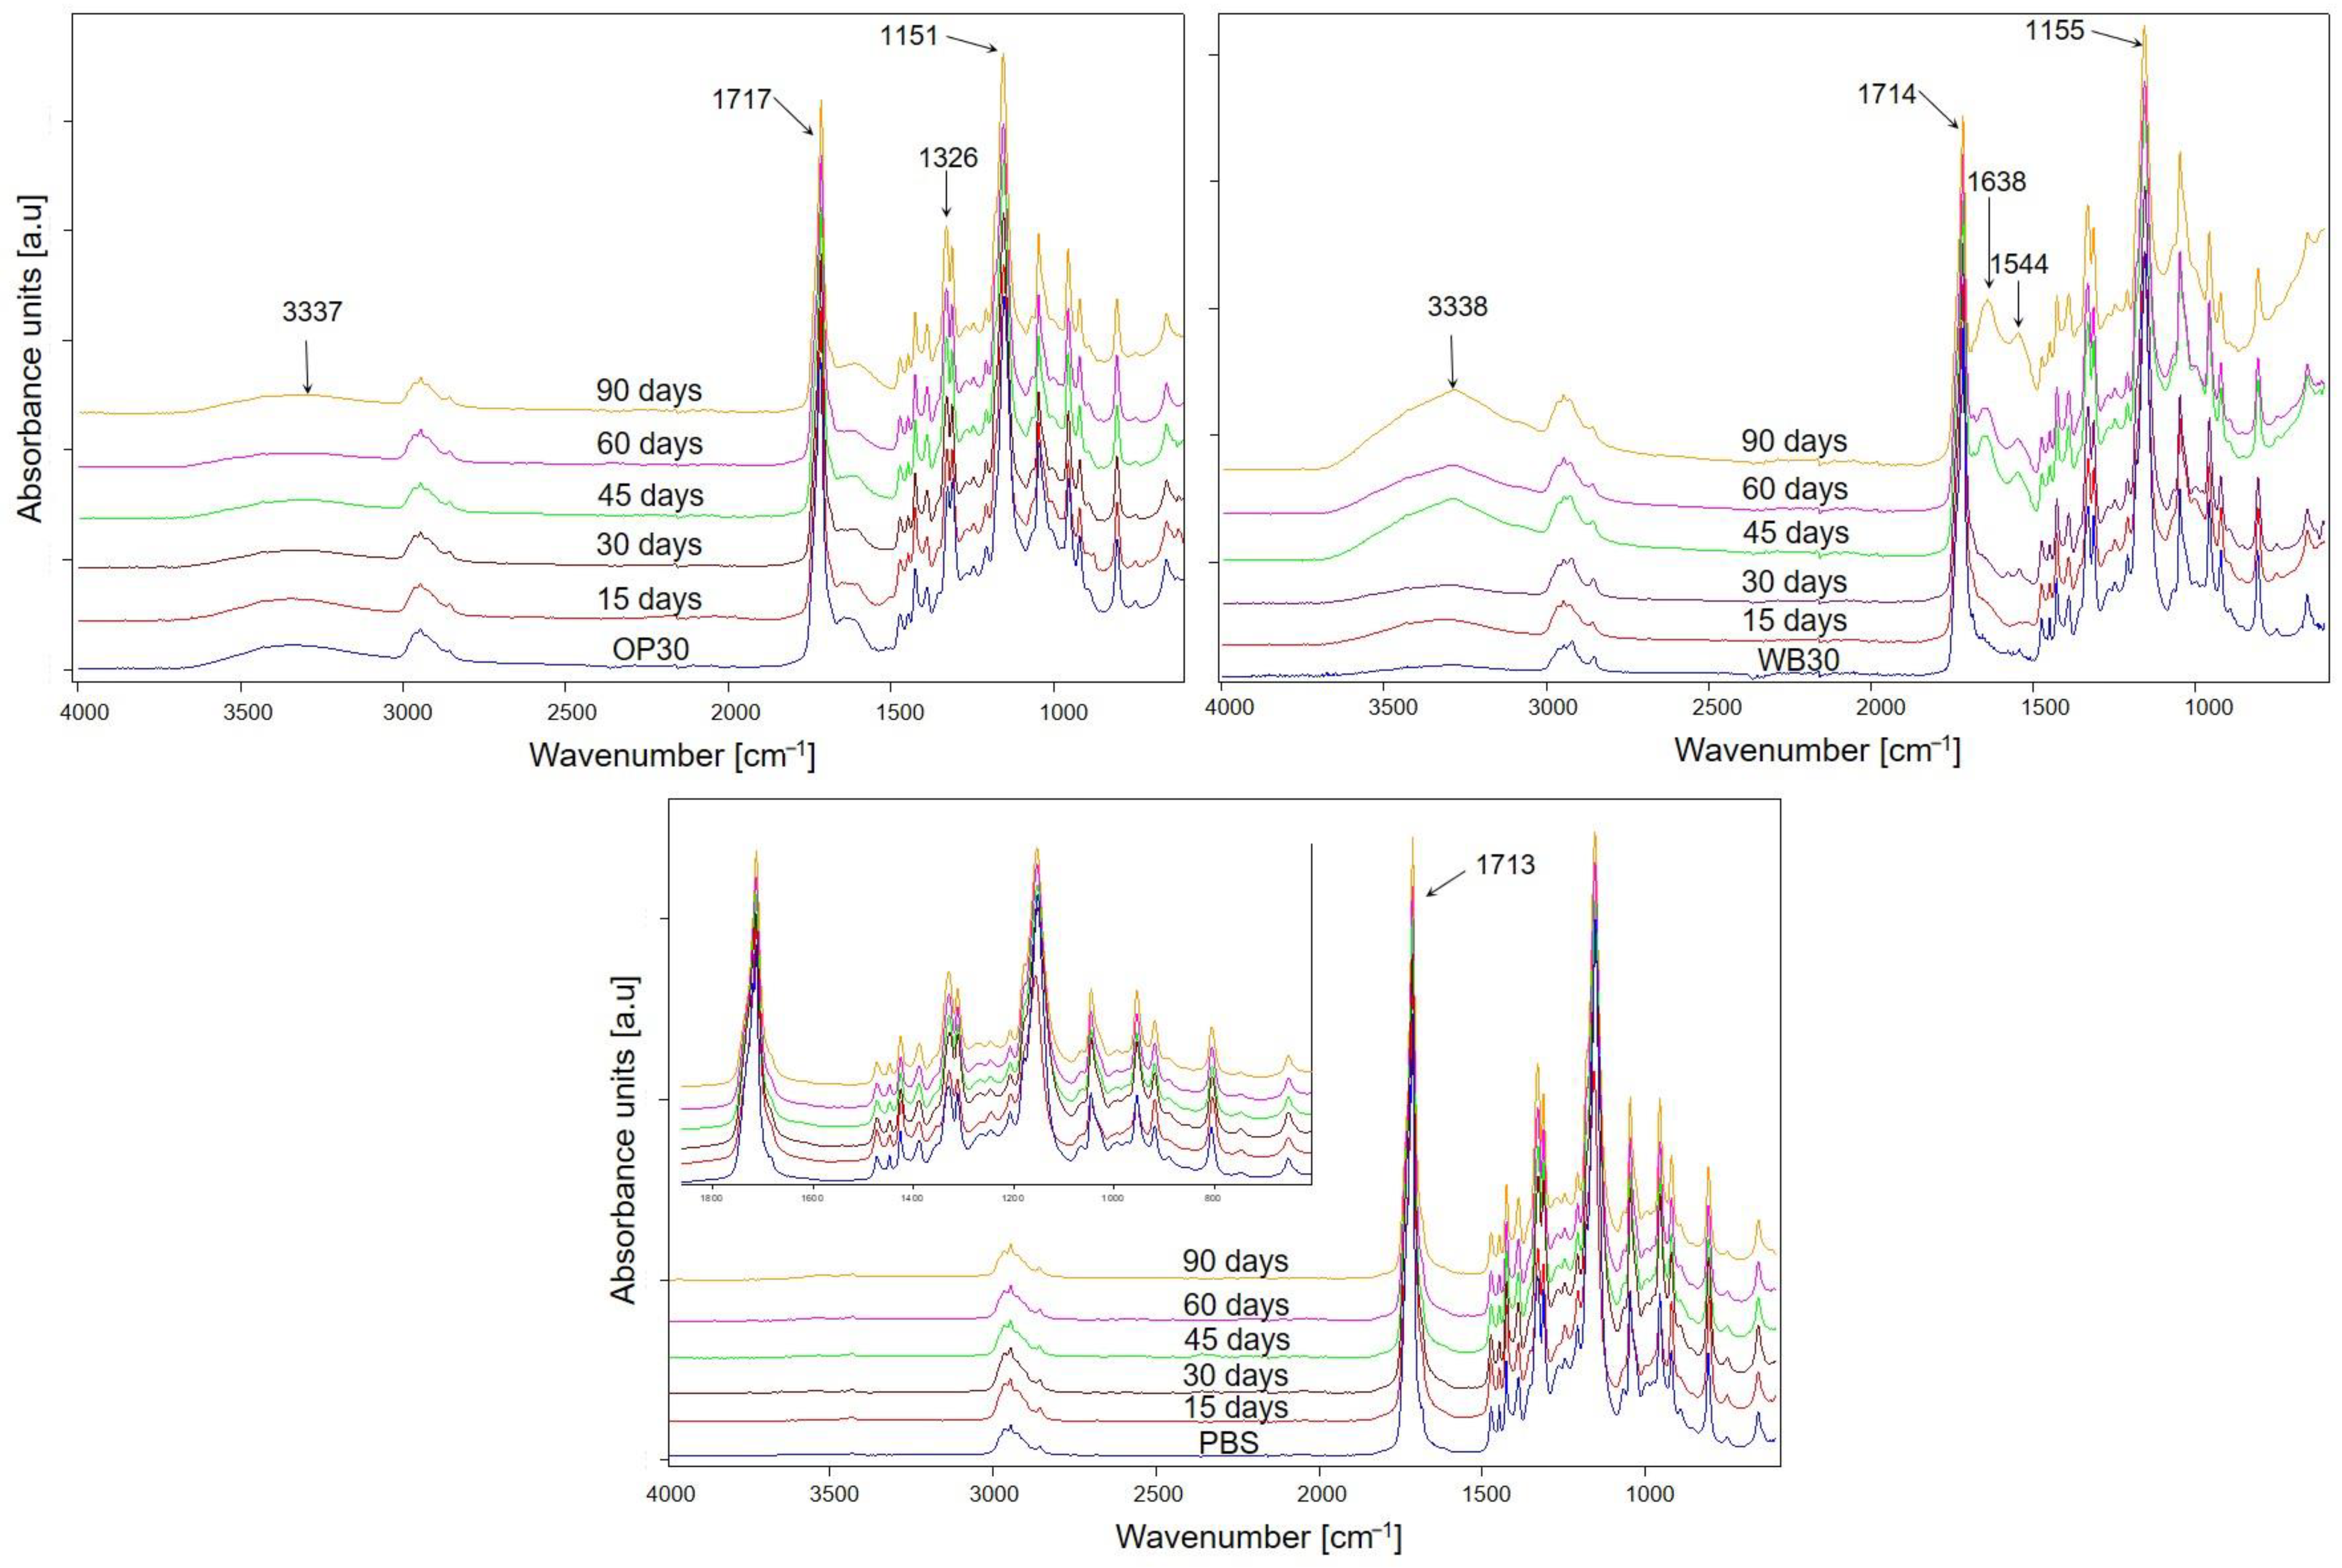
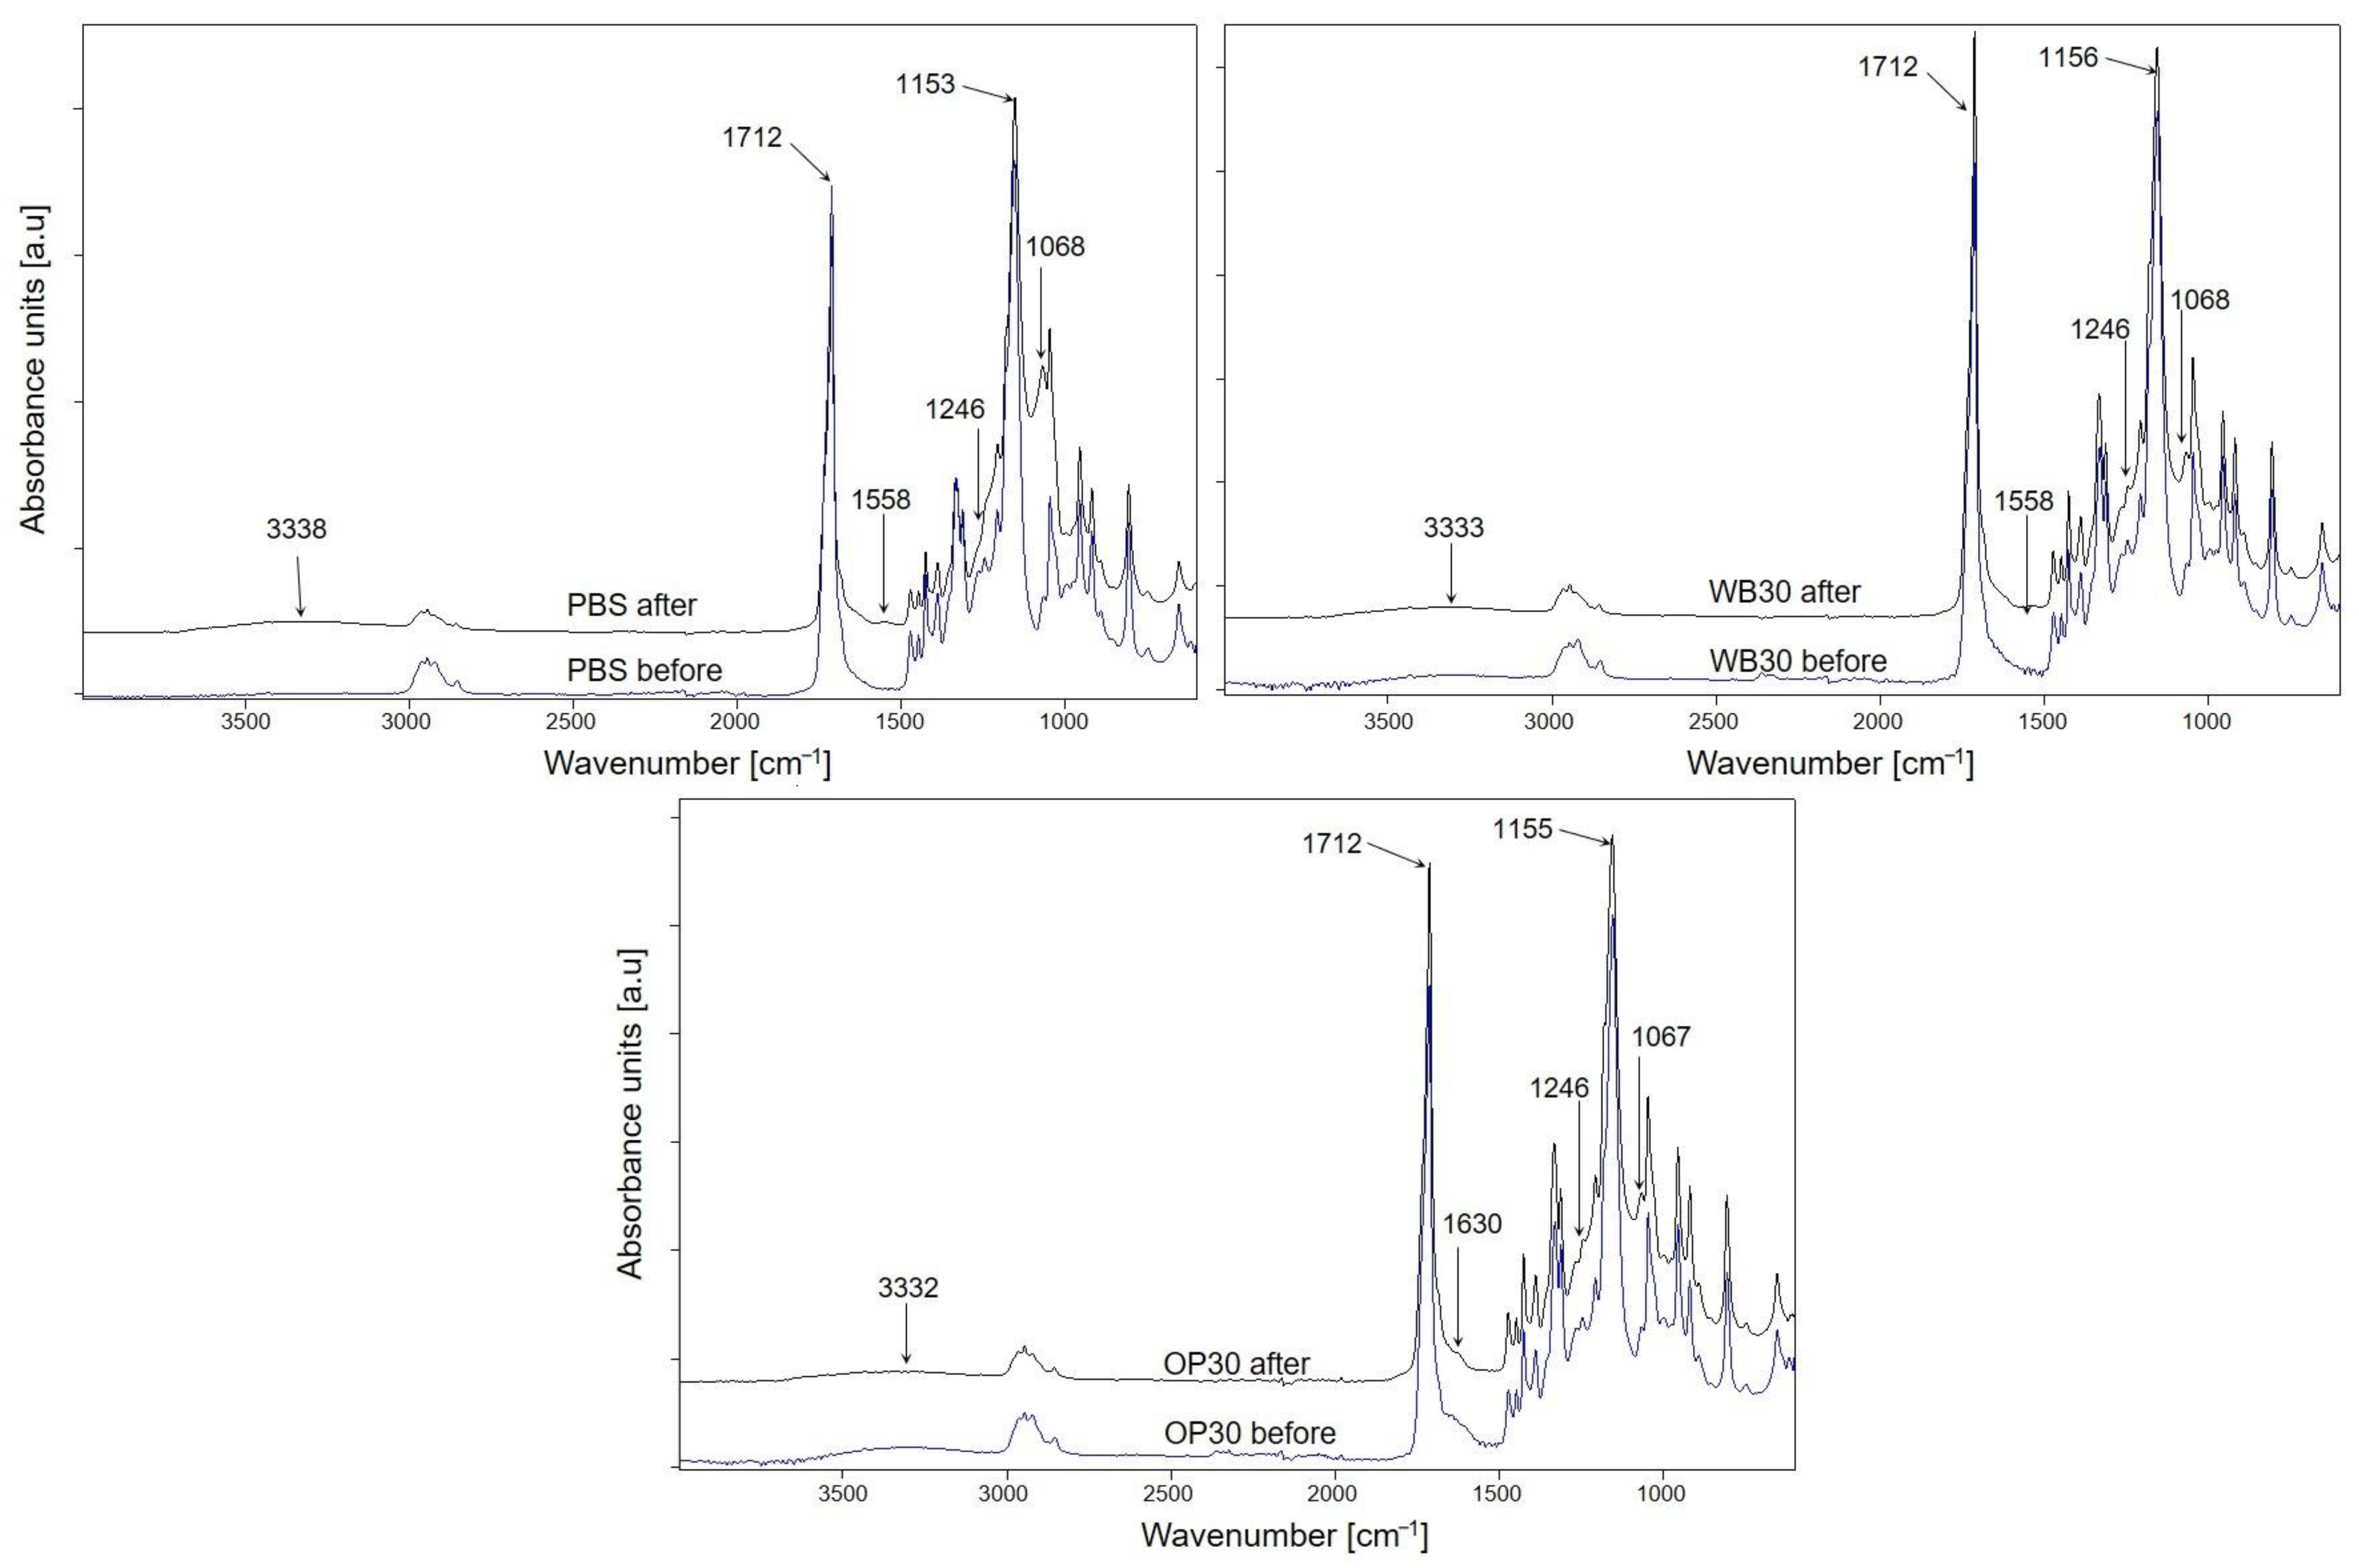
- FTIR analysis of the samples was performed using a TENSOR 27 FTIR spectrophotometer (Bruker, Billerica, MA, USA) equipped with an ATR (Attenuated Total Reflectance) attachment with a diamond crystal. The spectra (32 scans per spectrum) were collected for a range of 600–4000 cm−1 and a resolution of 4 cm−1.
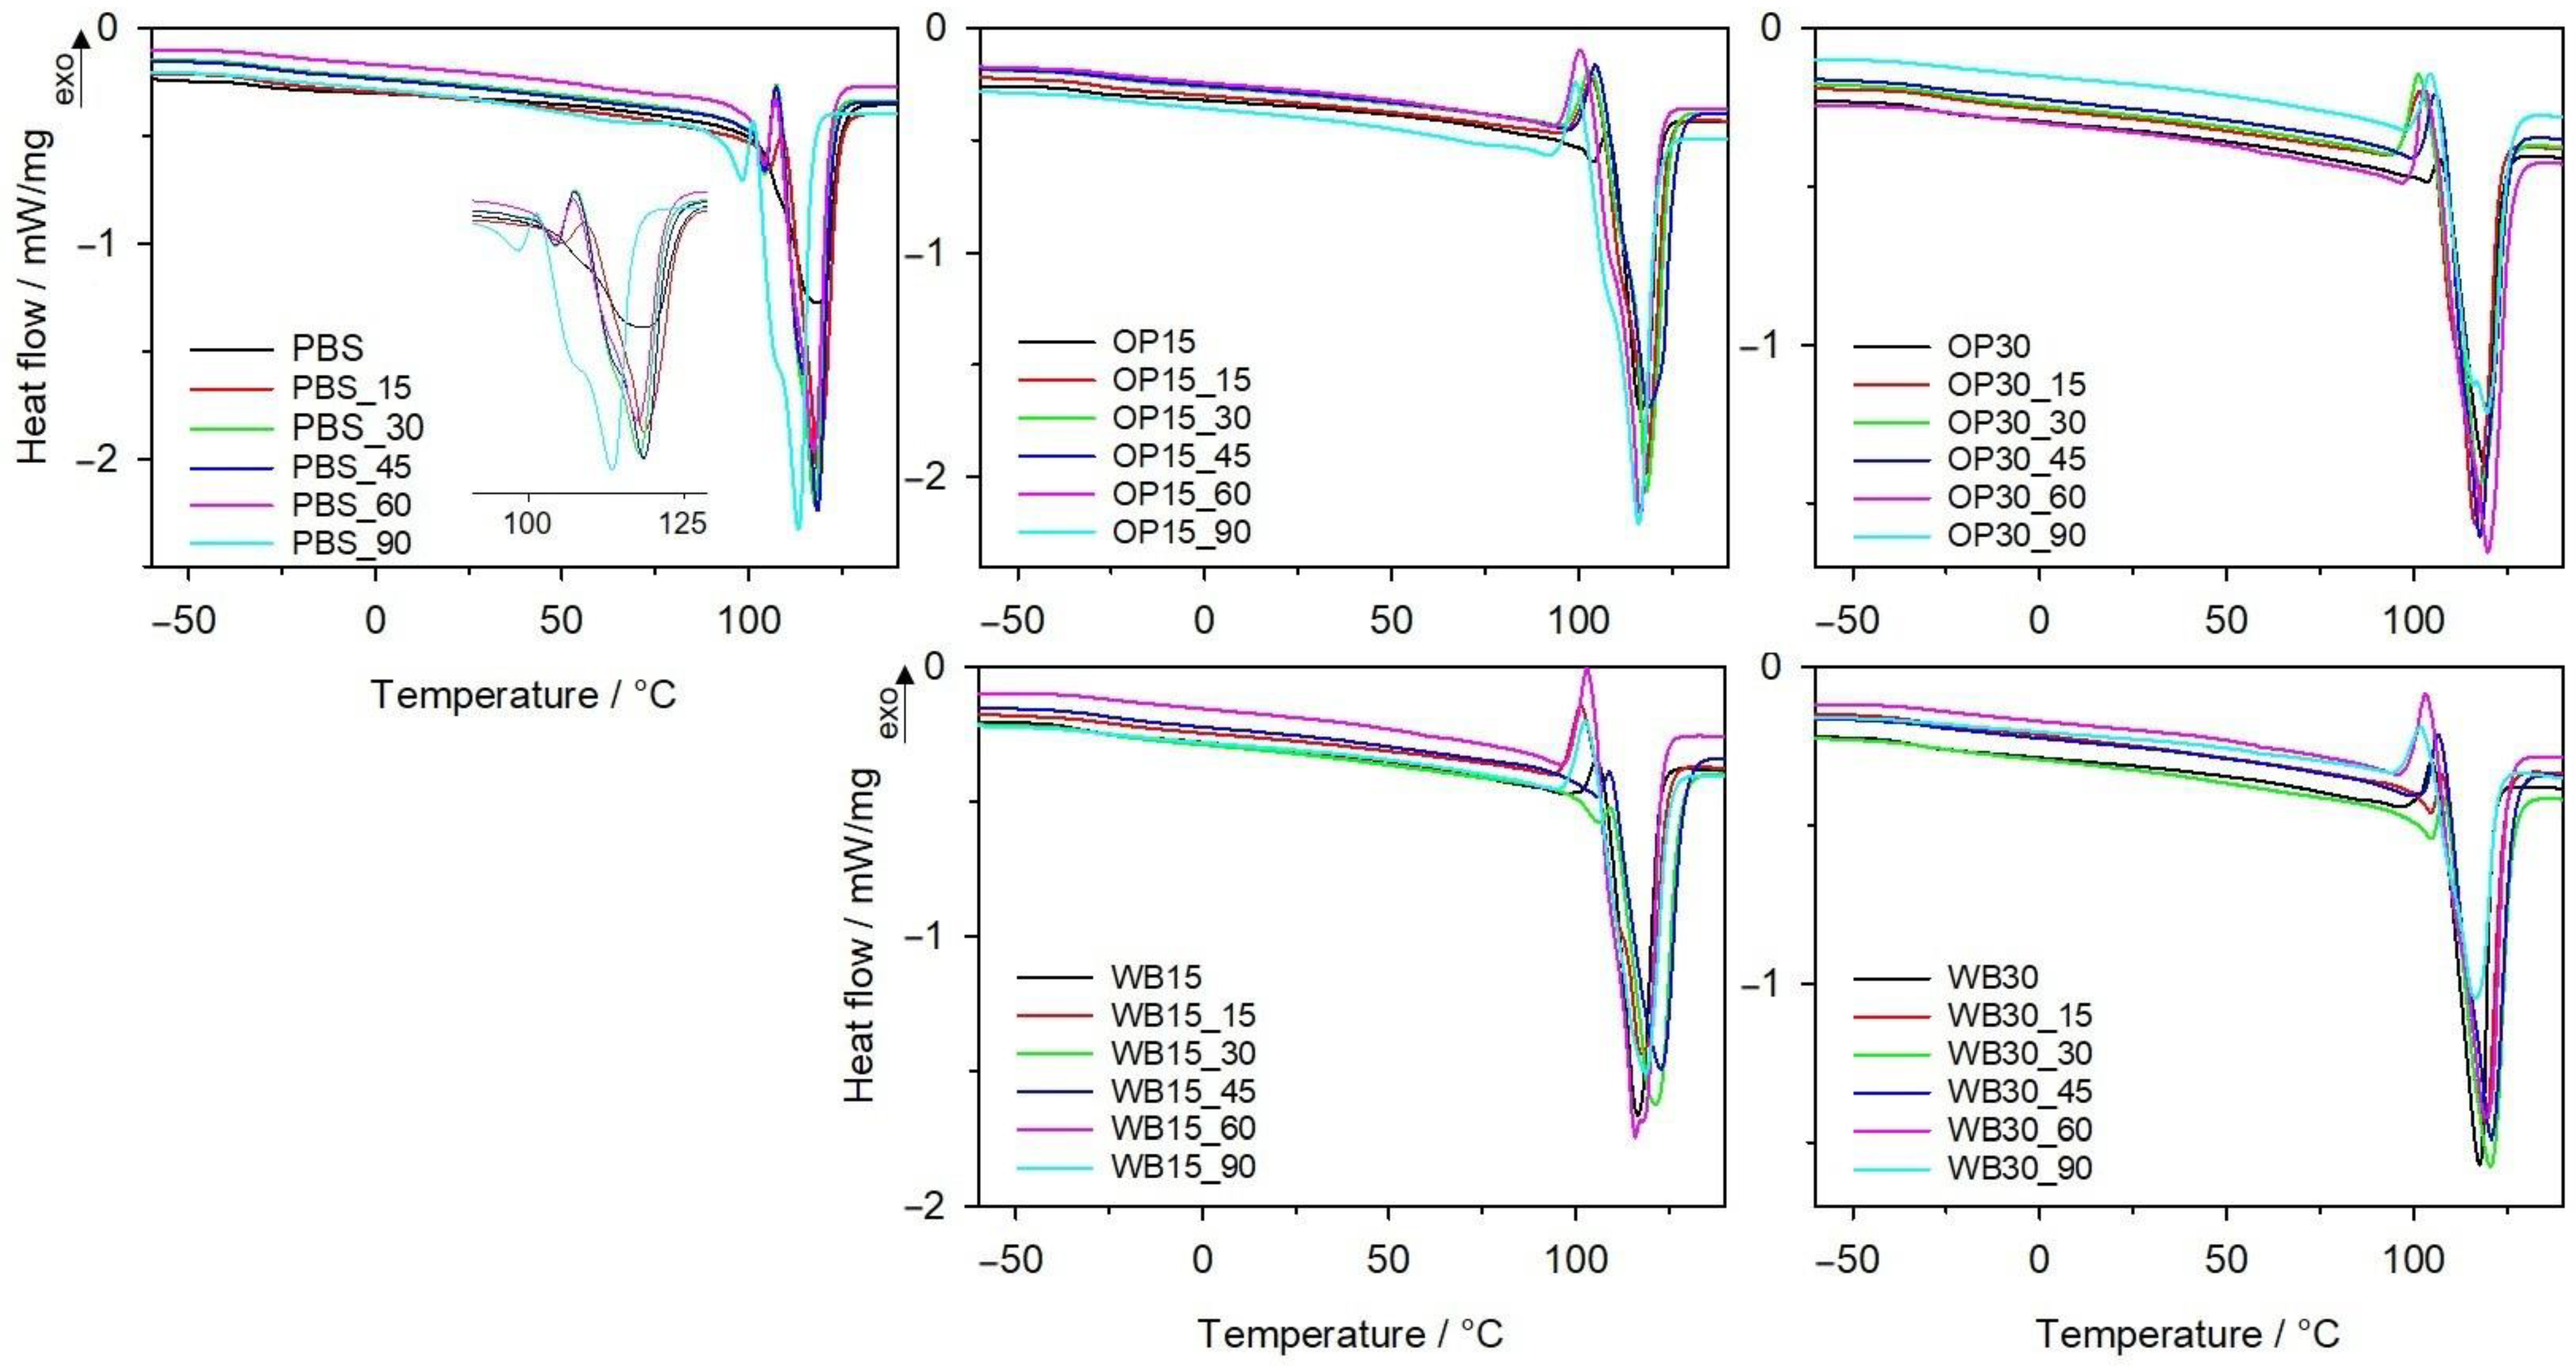
- Differential scanning calorimetry (DSC) testing of the samples was made using a 204 F1 Phoenix DSC scanning calorimeter (NETZSCH, Günzbung, Germany) and NETZSCH Proteus data processing software version 6 (NETZSCH, Günzbung, Germany), in accordance with the standard ISO 11357-1: 2023 [43]. DSC thermograms were recorded for the following cycles: heating (I) from −100 °C to 140 °C (at a rate of 10 °C/min), cooling from 140 °C to −100 °C (at a rate of 10 °C/min) and heating (II) from −100 °C to 140 °C (at a rate of 10 °C/min). The samples, weighing approximately 10 mg, were tested in aluminum crucibles with a pierced lid. DSC curves were used to determine the degree of crystallinity Xc, melting enthalpy ΔHm, melting point Tm, crystallization temperature Tc and glass transition temperature Tg for the obtained composites. The degree of crystallinity was calculated from the relationship presented in Equation (2):
- assuming that for PBS, ΔH100% = 110.3 J/g; u—share of the organic filler. The u parameter for composted samples was calculated based on thermogravimetric curves. The DSC curve inflection point in the glass transition area was adopted as the glass transition temperature.
- The color of the samples was determined using an X-Rite Ci4200 spectrophotometer in accordance with the ASTM E308 standard [44]. The CIELab system was used to describe the color, in which it is defined in the L*, a*, b* space. The a parameter describes the color from green (negative values) to red (positive values); b parameter—the color from blue (negative values) to yellow (positive values). The L parameter is luminance—lightness, representing the gray scale from black to white (value 0 corresponds to black, and 100 to white). The difference between two colors, which in this system correspond to two points in the three-dimensional L*, a*, b* space, is described by the following relationship:ΔL, Δa and Δb denote the difference in color parameters between the compared samples, respectively.
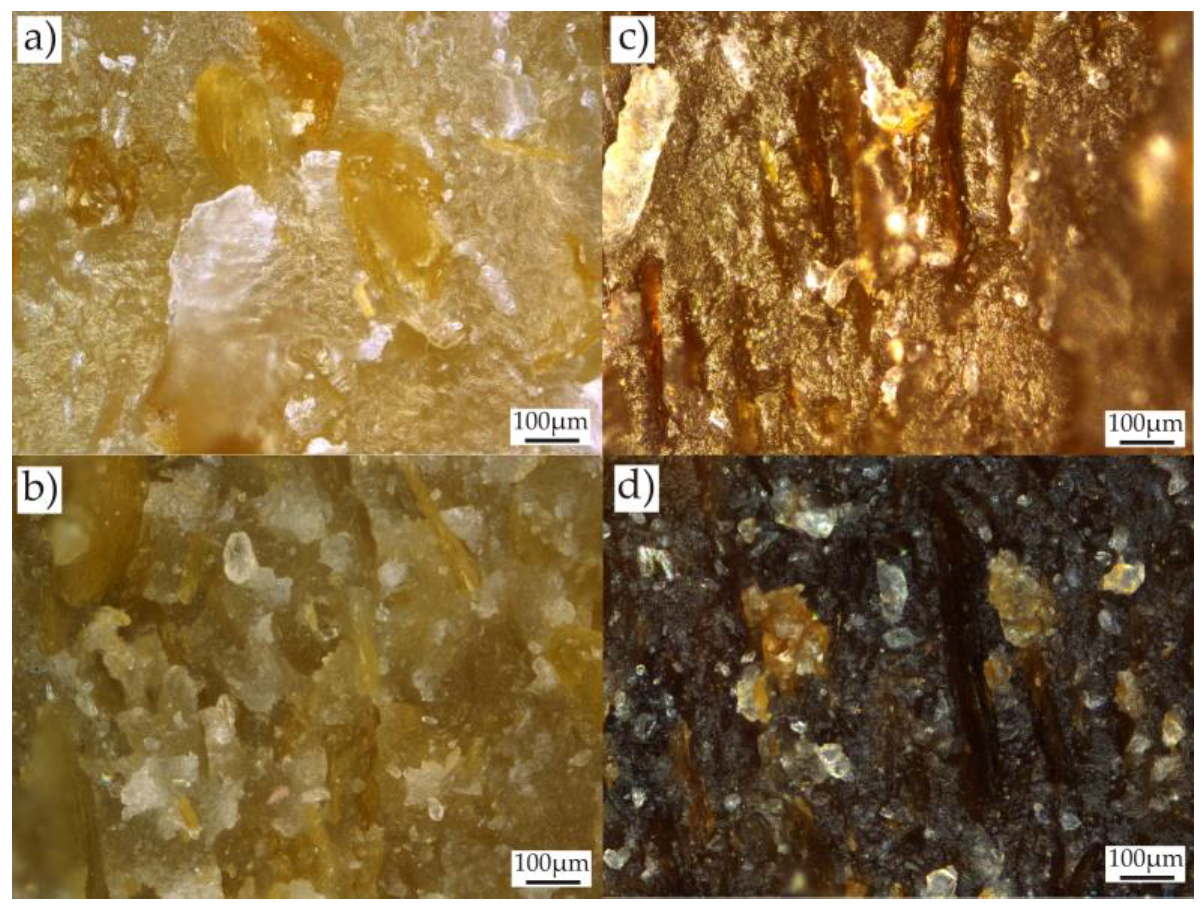
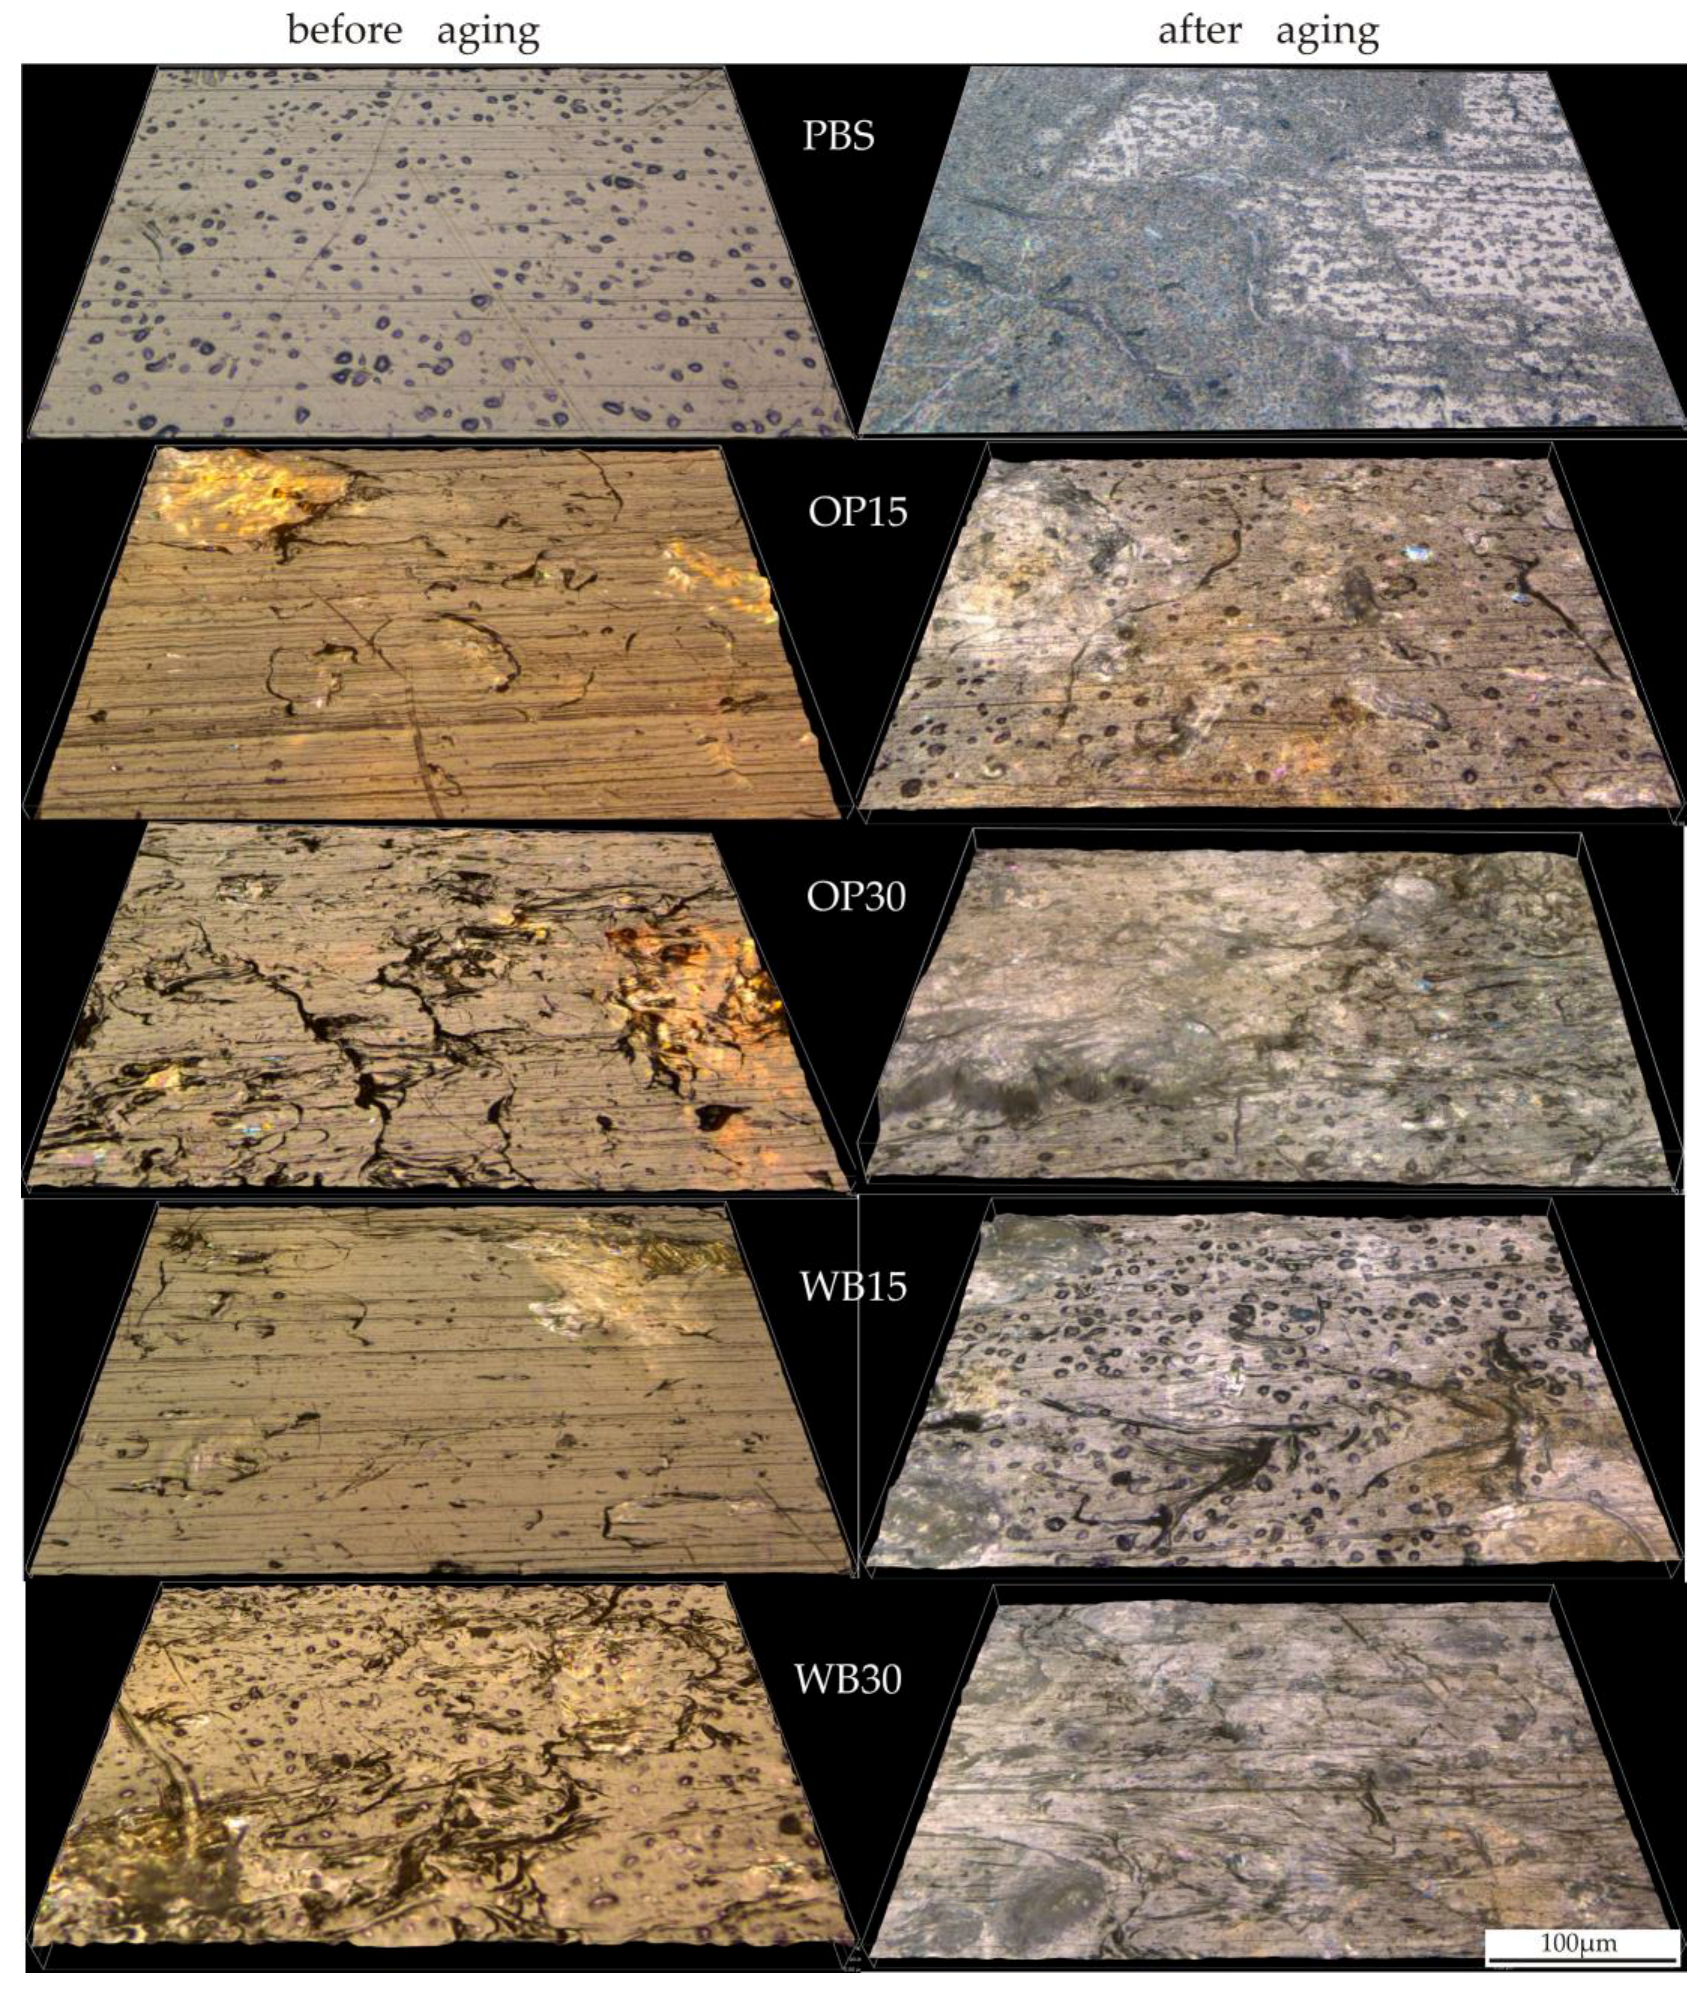
- The surface and fracture photos of the samples were taken using a NIKON Eclipse LV100ND optical microscope equipped (Tokyo, Japan) with a DS-U3 camera with NIS-Elements AR 4.20.00 software. The reflected light method was used for observation. The black field method was used for fracture photos, and the focus stacking method was used to obtain a large depth of field. The bright field observation method and 3D photo stacking were used to take surface photos of the samples. The compared samples were observed at the same magnification and illumination values.
- The tests of fungal growth on the studied biocomposites were performed based on the ISO 846:2019 standard (Method A) [45]. According to the standard, the inoculum used was a mixture of five reference strains of fungi: Aspergillus niger (ATCC 6275), Penicillium pinophilum (ATCC 36839) syn. Talaromyces pinophilus, Paecilomyces variotii (ATCC 18502), syn. Byssochlamys spectabilis, Trichoderma virens (ATCC 9645) and Chaetomium globosum (ATCC 6205). According to the standard, the samples were divided into three test batches: batch 0—control samples, stored in standardized climatic conditions of conditioning and testing according to ISO 291:2008 [46] (23 ± 1 °C, 50 ± 5% RH); two fragments/sample were used; batch S—sterile samples, stored in the same conditions as test batch I; two fragments/sample were used; batch I—test samples inoculated with microorganisms and incubated; five fragments/sample were used. The samples were incubated for 28 days at 29 ± 1 °C. Visual evaluation was performed using a SCAN 1200 automatic colony counter (Interscience, Saint-Nom-la-Breteche, France).
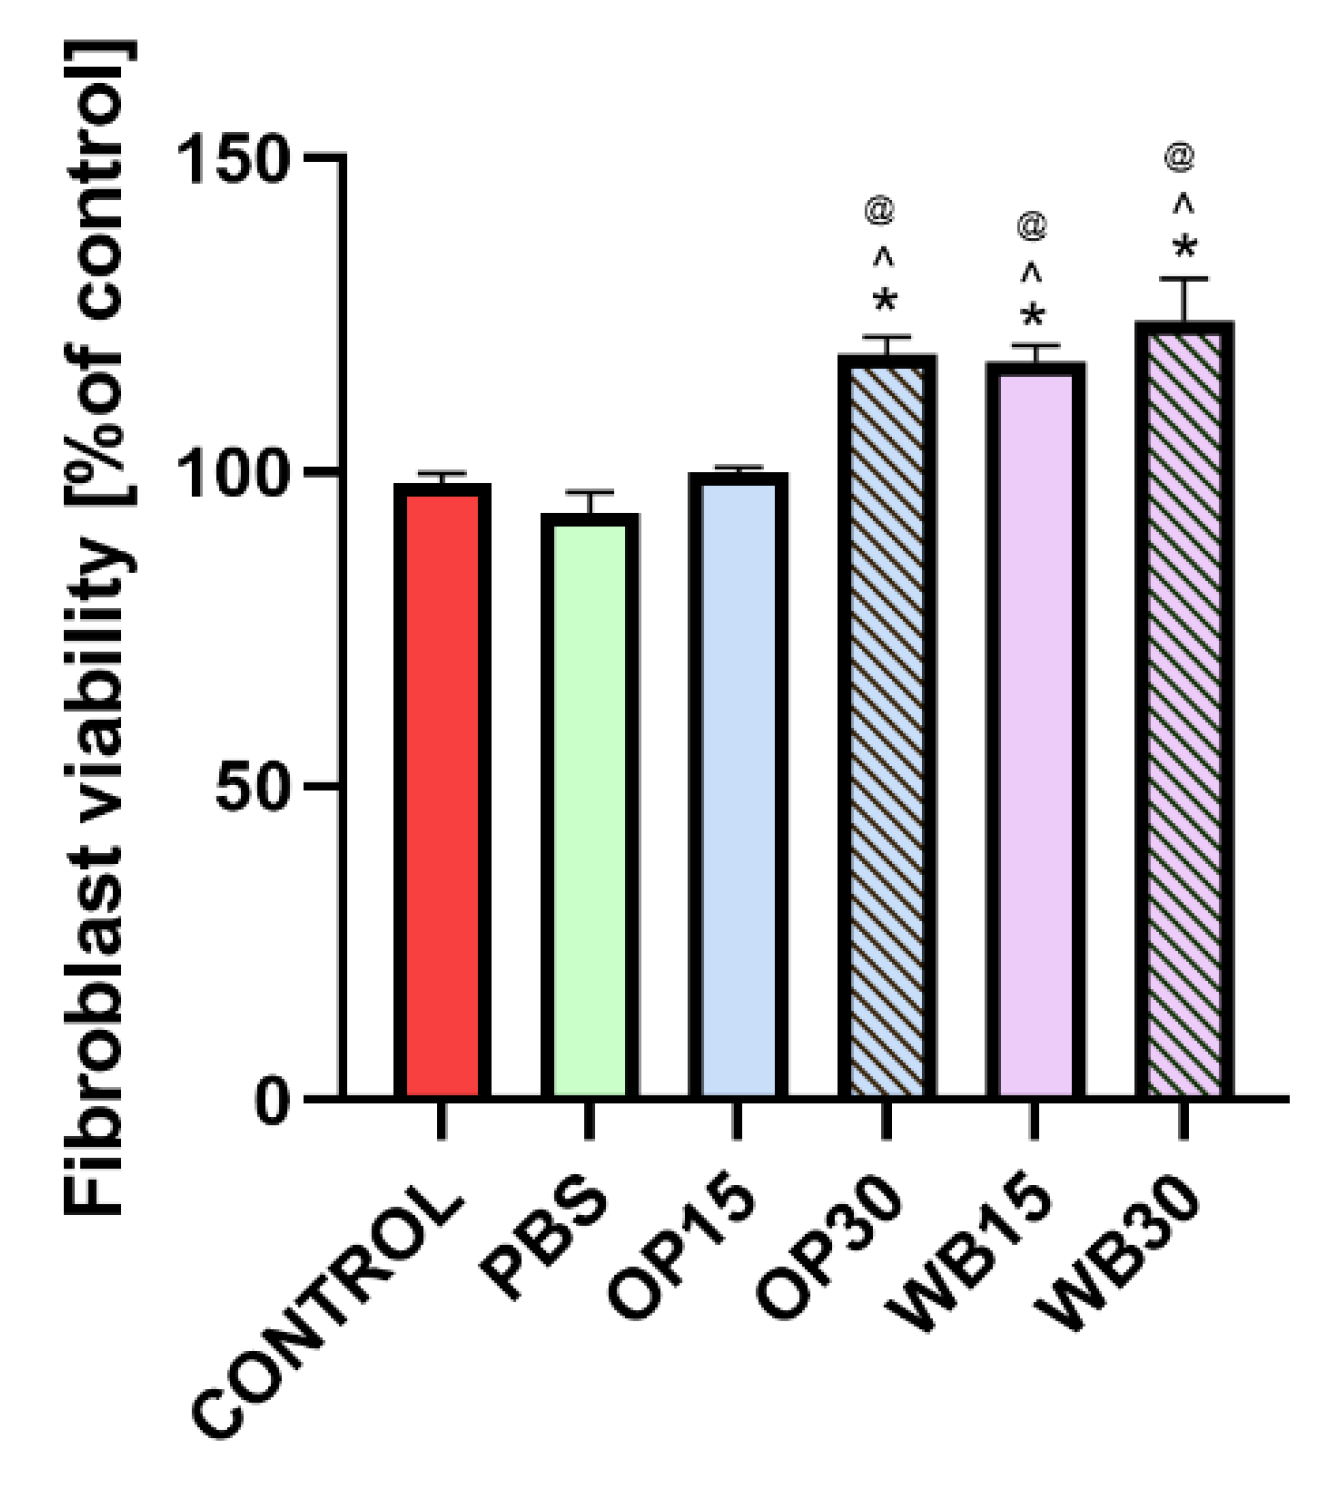
- Cell culture experiments were conducted using a normal human skin fibroblast BJ cell line (ATCC, London, UK). The cells were cultured in EMEM supplemented with 10% FBS (Pan-Biotech GmbH, Aidenbach, Bavaria, Germany), 100 U/mL of penicillin and 100 µg/mL of streptomycin (Sigma-Aldrich Chemicals, Warsaw, Poland) at 37 °C in a humidified atmosphere of 5% CO2 and 95% air (Heraeus Cytoperm 2, Thermo Scientific, Waltham, MA, USA). The cytotoxicity test was performed by an indirect method using material extracts according to the ISO 10993-12:2012 standard [47]. The sterilized materials (ethylene oxide sterilization) were incubated in EMEM culture medium with 2% FBS for 24 h at 37 °C, in a ratio of 1.25 cm2/mL of culture fluid. Simultaneously, cells at a density of 2 × 10⁵ cells/mL were seeded in a 96-well plate in a volume of 100 µL and also cultured for 24 h at 37 °C. After this period, the medium was removed from the cells and replaced with the material extracts. The negative cytotoxicity control (sample designated as “control”) consisted of cells cultured exclusively in culture medium (EMEM with 2% FBS). The prepared cells were then incubated for an additional 24 h under the same conditions. After this incubation, an MTT colorimetric assay was performed (Sigma-Aldrich Chemical, Warsaw, Poland). MTT solution (1 mg/mL) was prepared in culture medium, and 100 µL of this solution was added to each well containing cells, followed by incubation for 3 h at 37 °C. During this period, mitochondrial dehydrogenase enzymes in viable cells reduced MTT to formazan, resulting in the formation of formazan crystals within living cells. After incubation, 100 µL of a 10% SDS solution in 0.01 M HCl was added to each well to dissolve the formazan crystals. After 12 h, the absorbance of the formazan solution was measured at a wavelength of 570 nm using a plate reader. The amount of formazan formed was proportional to the number of viable cells. MTT test results were expressed as a percentage of the optical density (OD) value obtained relative to the negative cytotoxicity control.
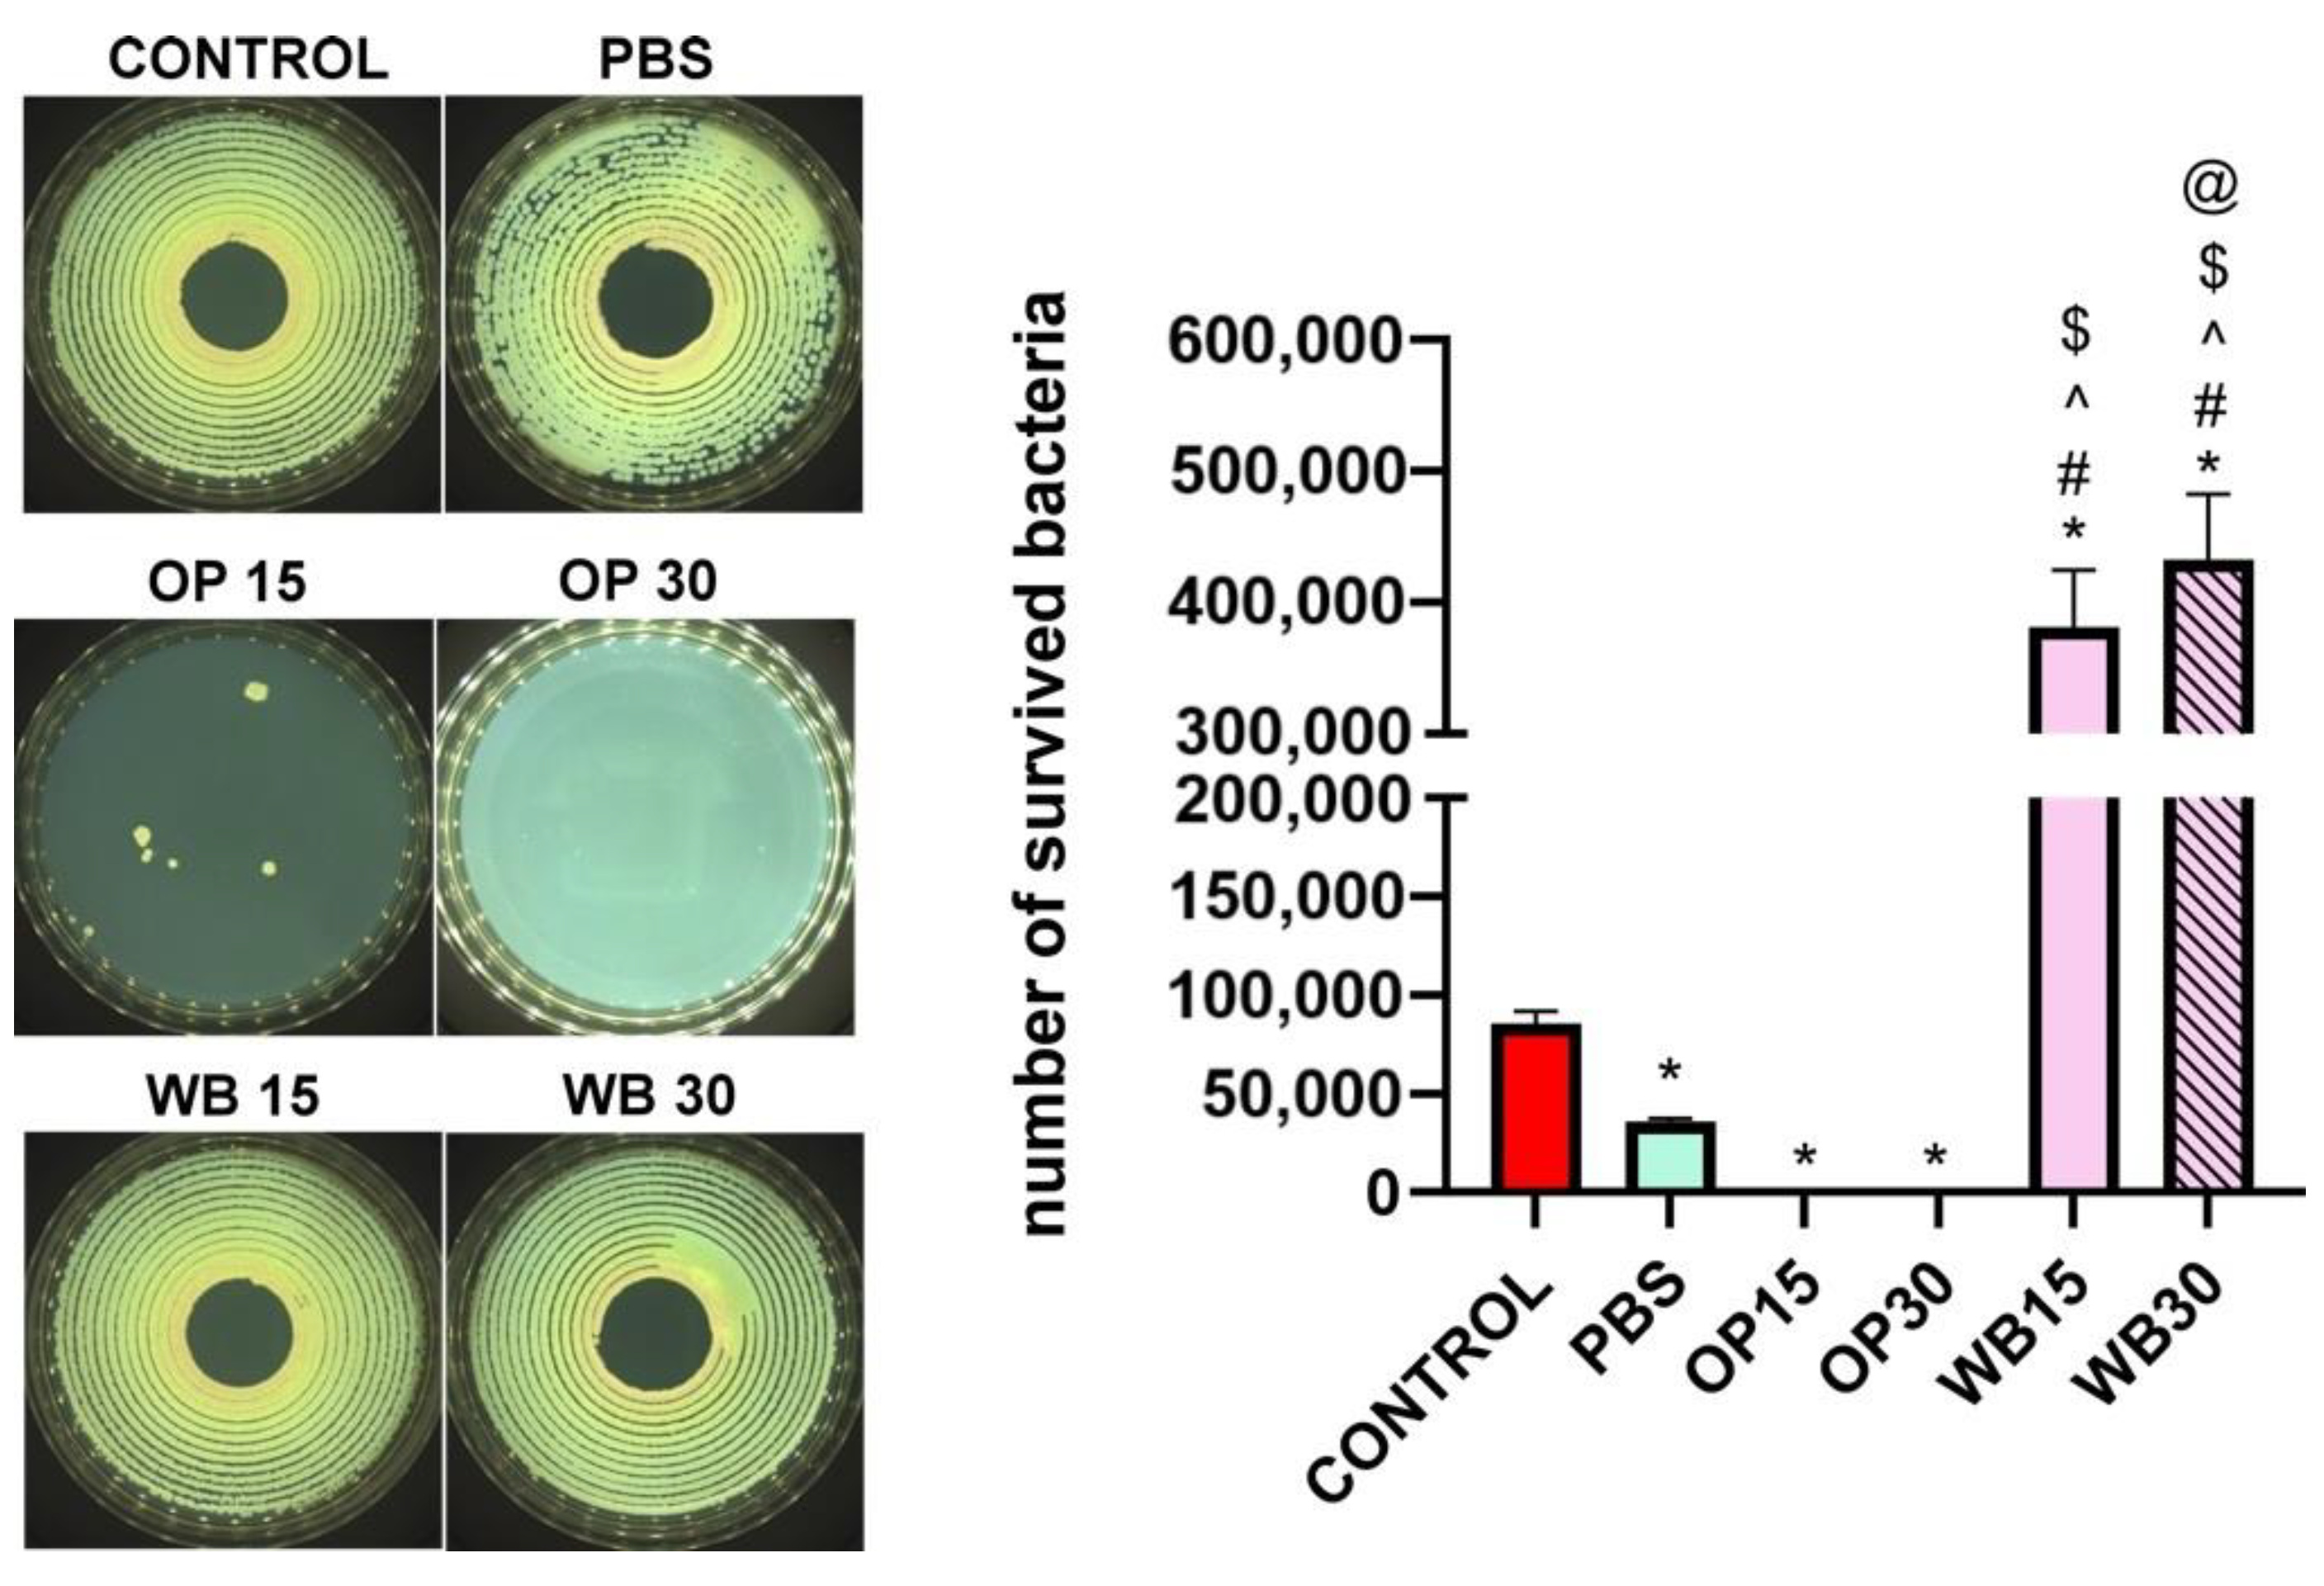
- Antibacterial activity evaluation was performed based on the standard AATCC Test Method 100-2004, as previously described [48]. Reference bacterial strain Escherichia coli (ATCC 25922) was grown at 37 °C for 24 h in Mueller–Hinton Agar medium (Biomaxima, Lublin, Poland). Then, the bacteria were scraped and suspended in sterile Mueller–Hinton broth to a density of 0.5 McFarland. Briefly, the materials (previously sterilized with ethylene oxide) were placed in sterile Petri dishes and treated with 50 µL bacterial suspension diluted to a concentration of 1.5 × 10⁴ CFU (prepared in 250-fold-diluted Mueller–Hinton broth). All samples were incubated at 37 °C for 24 h and then transferred into an appropriate volume of sterile 0.9% NaCl solution. In the next step, the samples were vigorously shaken for 60 s to remove bacteria from the materials. Simultaneously, a bacterial growth control was prepared by incubating the same volume of the bacterial suspension without contact with tested materials. All samples were then plated on Mueller–Hinton agar using an automated plater (EasySpiral Dilute, Interscience, Saint-Nom-la-Bretéche, France). The plates were incubated at 37 °C for 24 h. Next, CFUs were counted for each plate using the Scan 300 counter. Additionally, representative images of bacterial growth on the plates were taken.
3. Results and Discussion
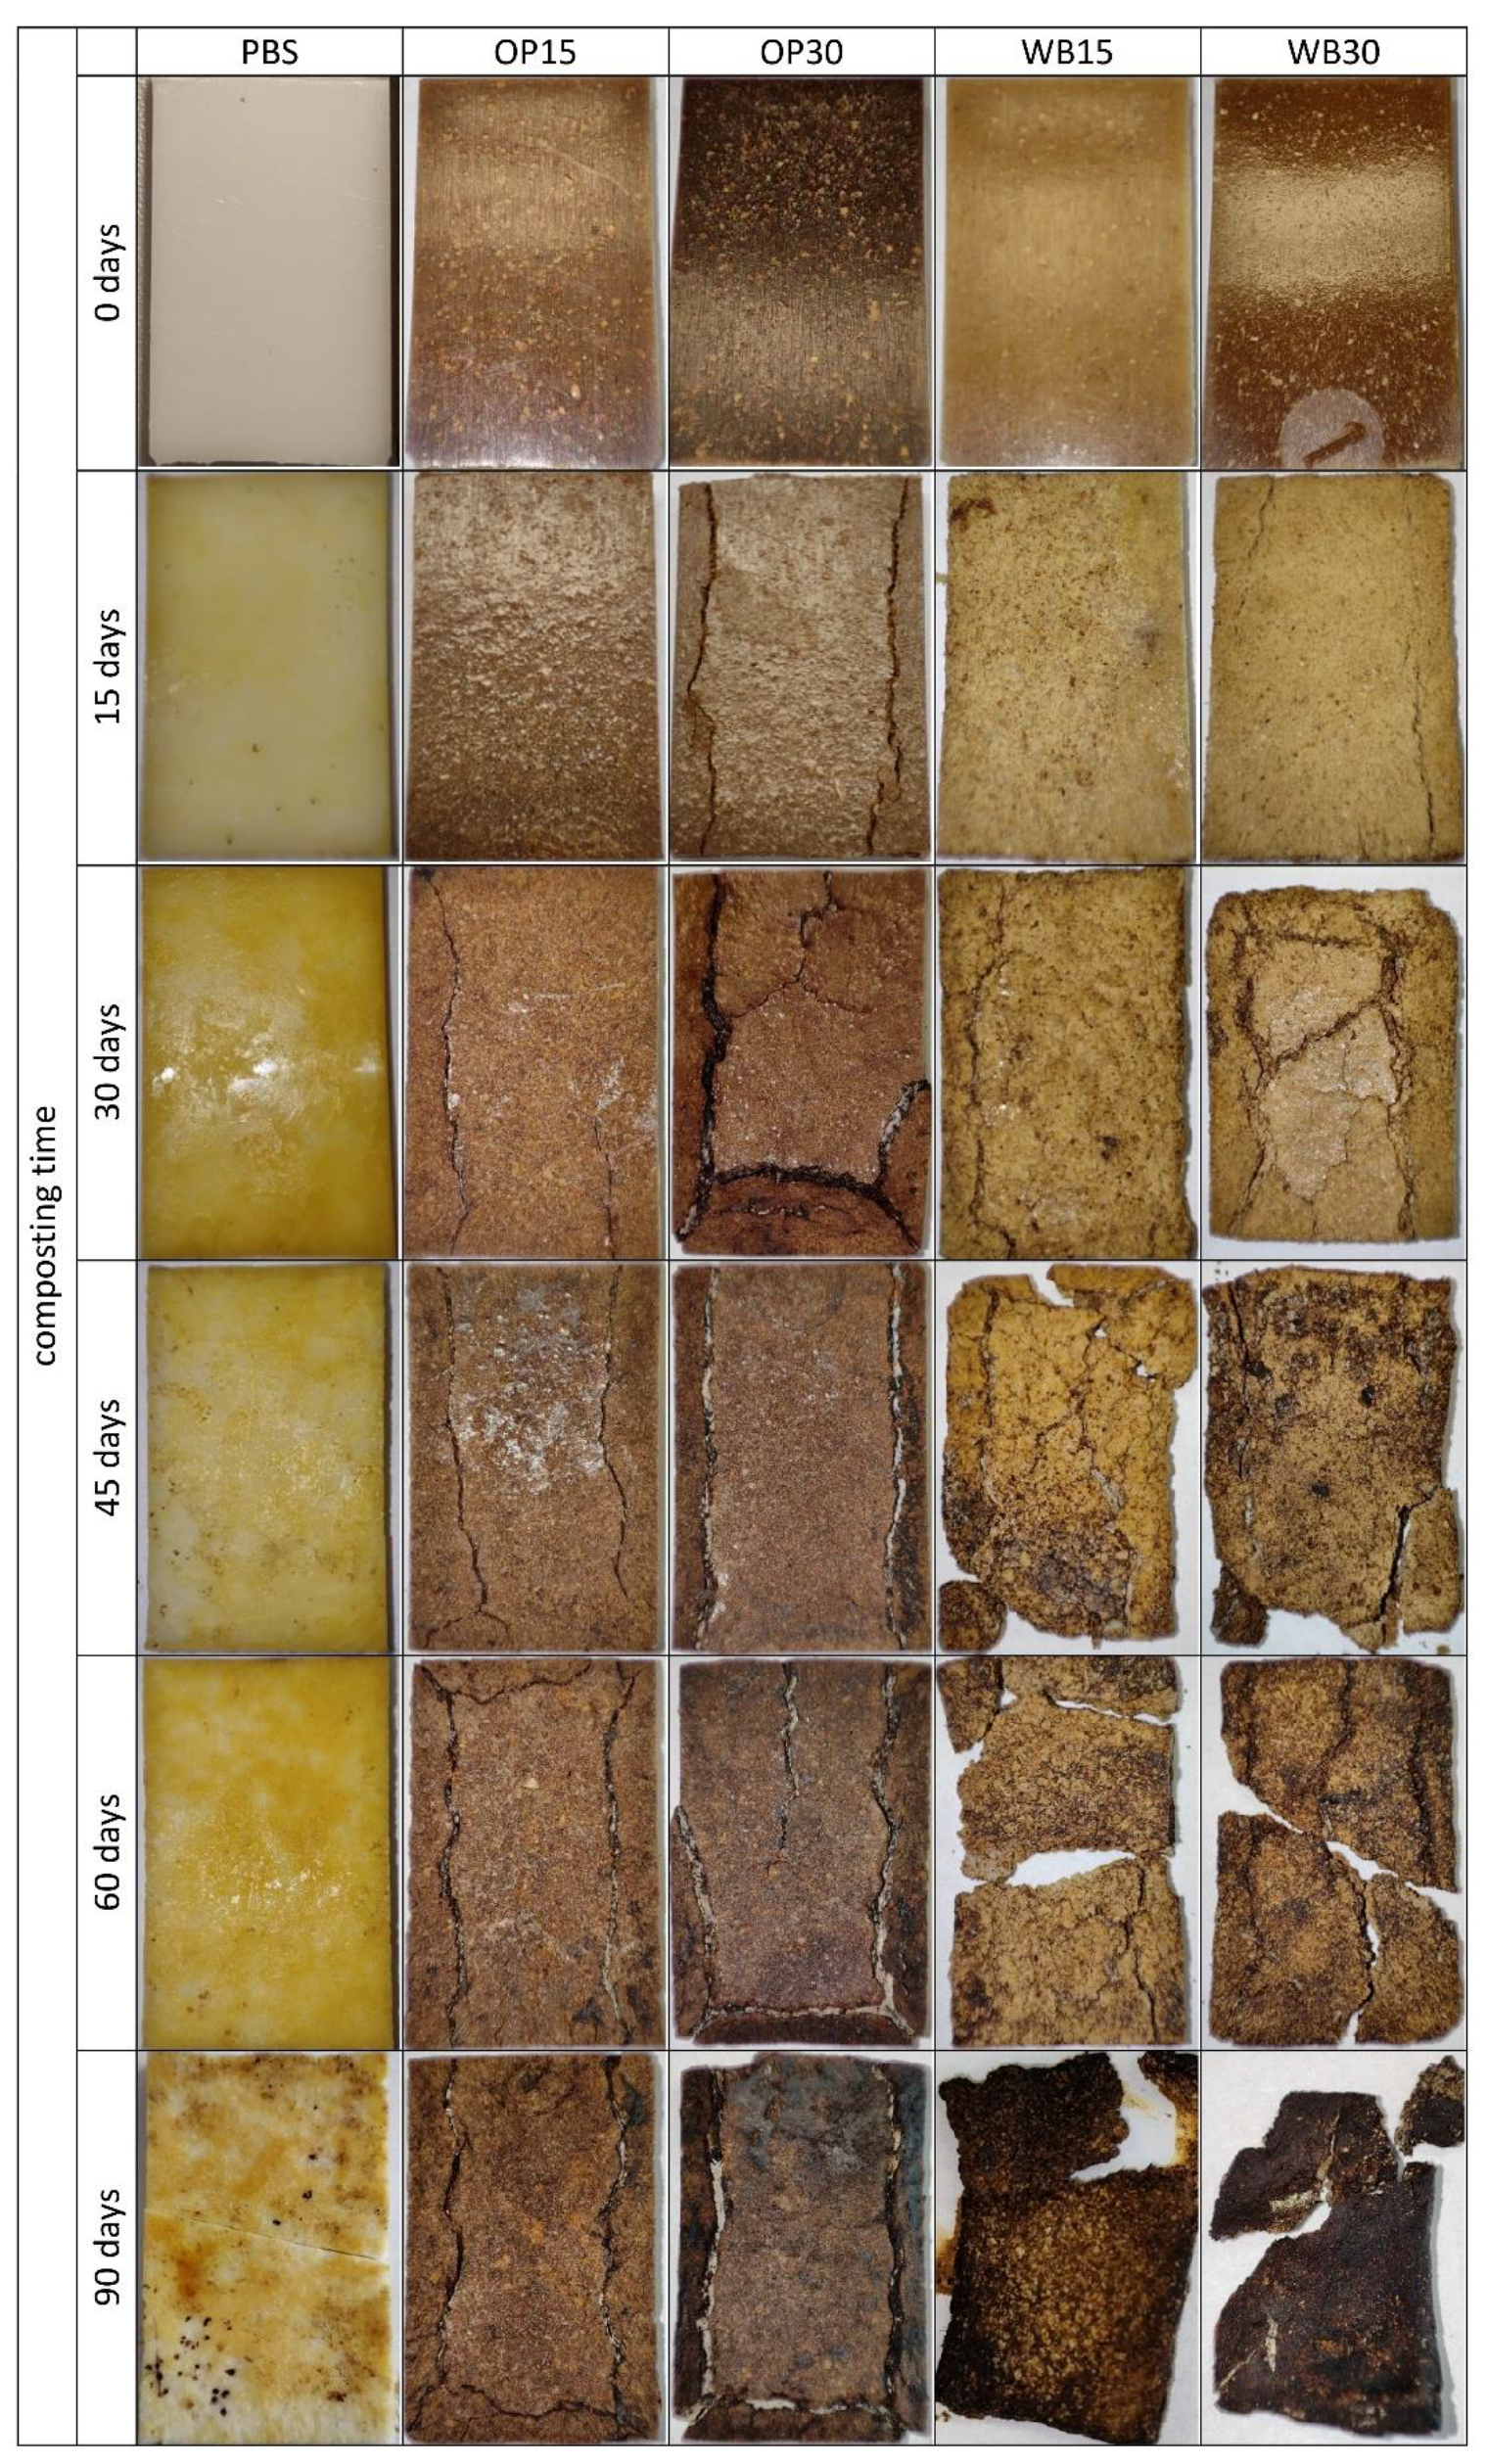
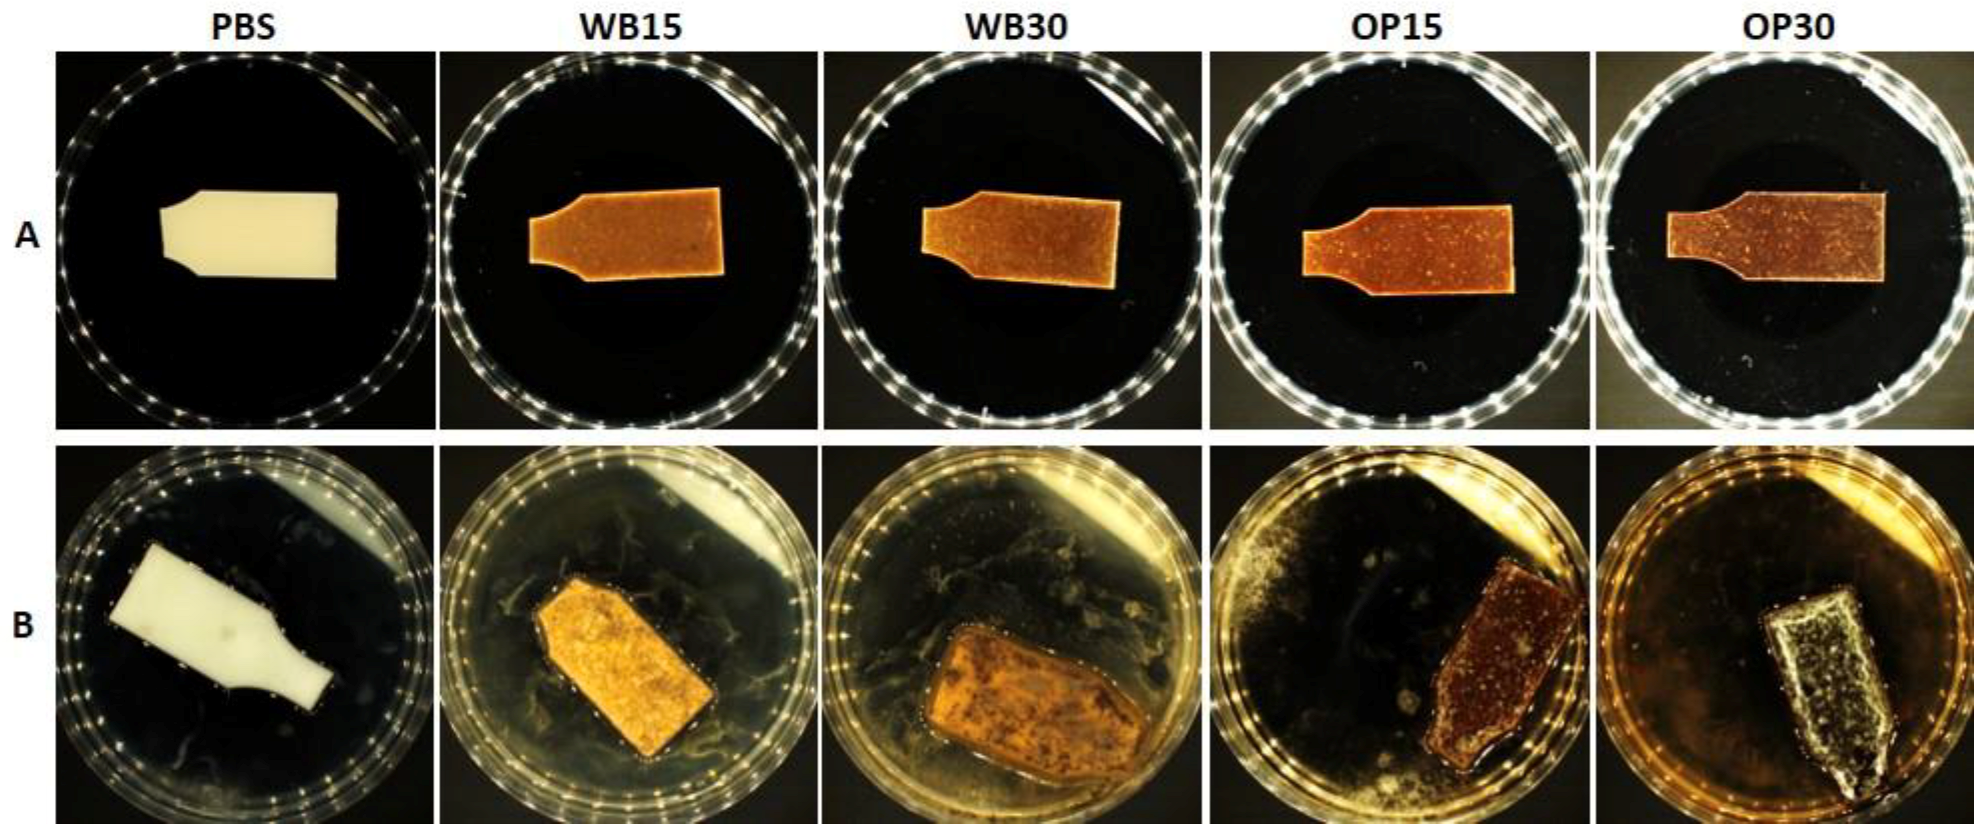
3.1. Composting
3.1.1. Mass Loss
3.1.2. DSC
3.1.3. Changes in Chemical Structure
3.2. Evaluation of Fungal Growth
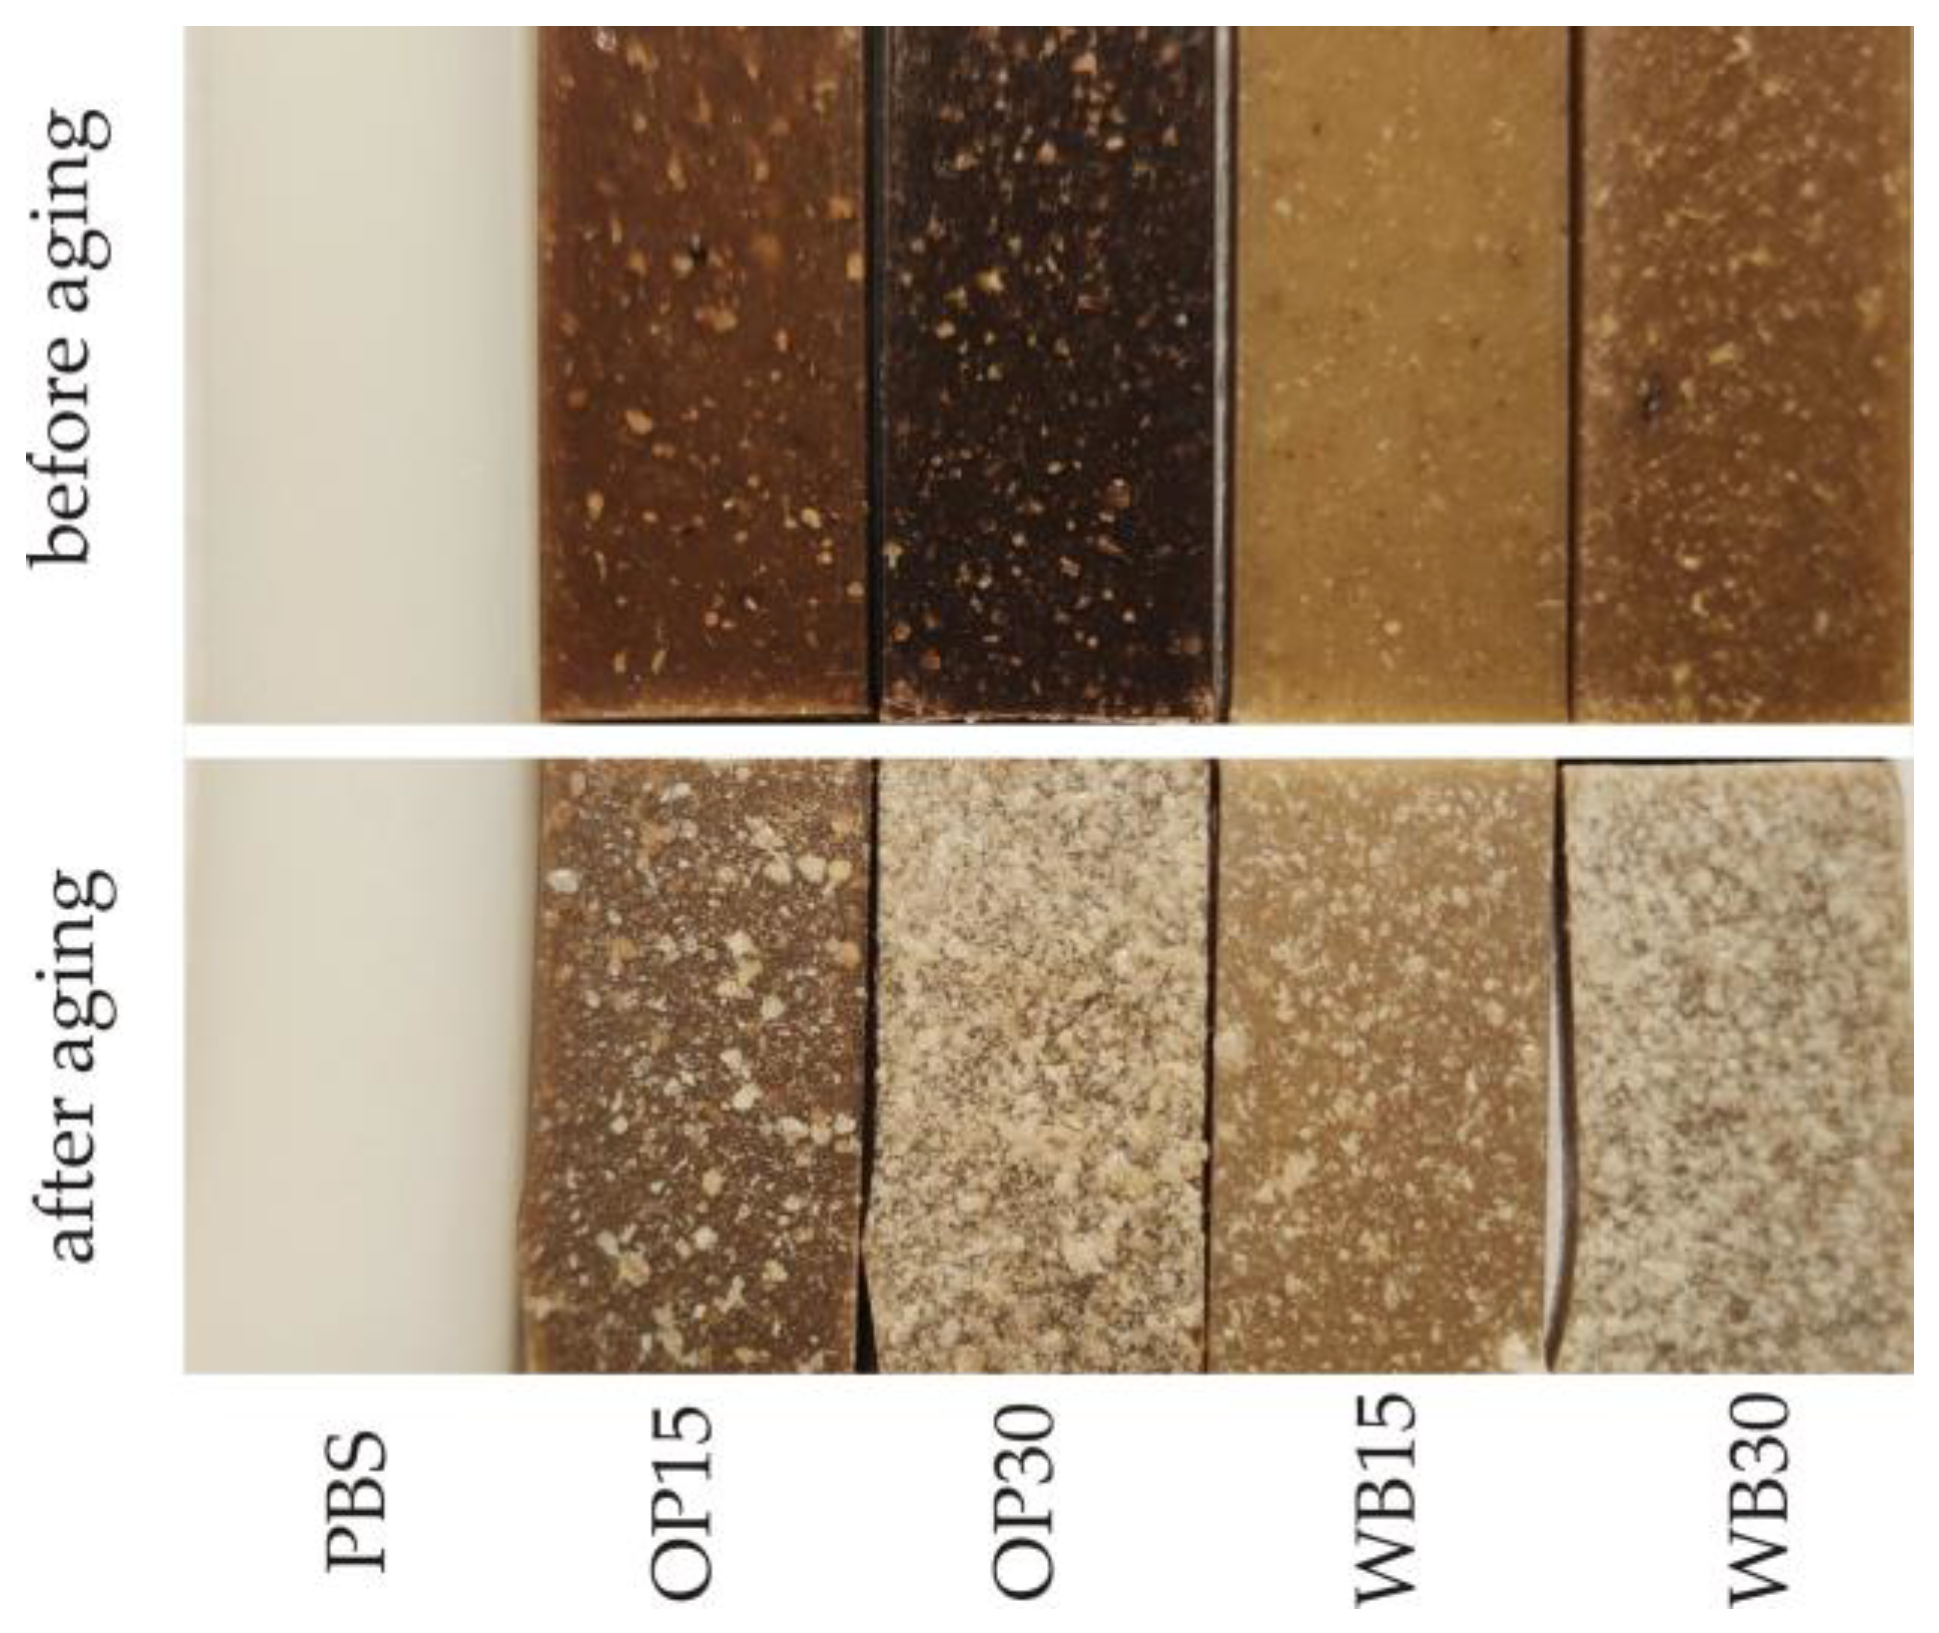
3.3. Artificial Aging
3.3.1. Color
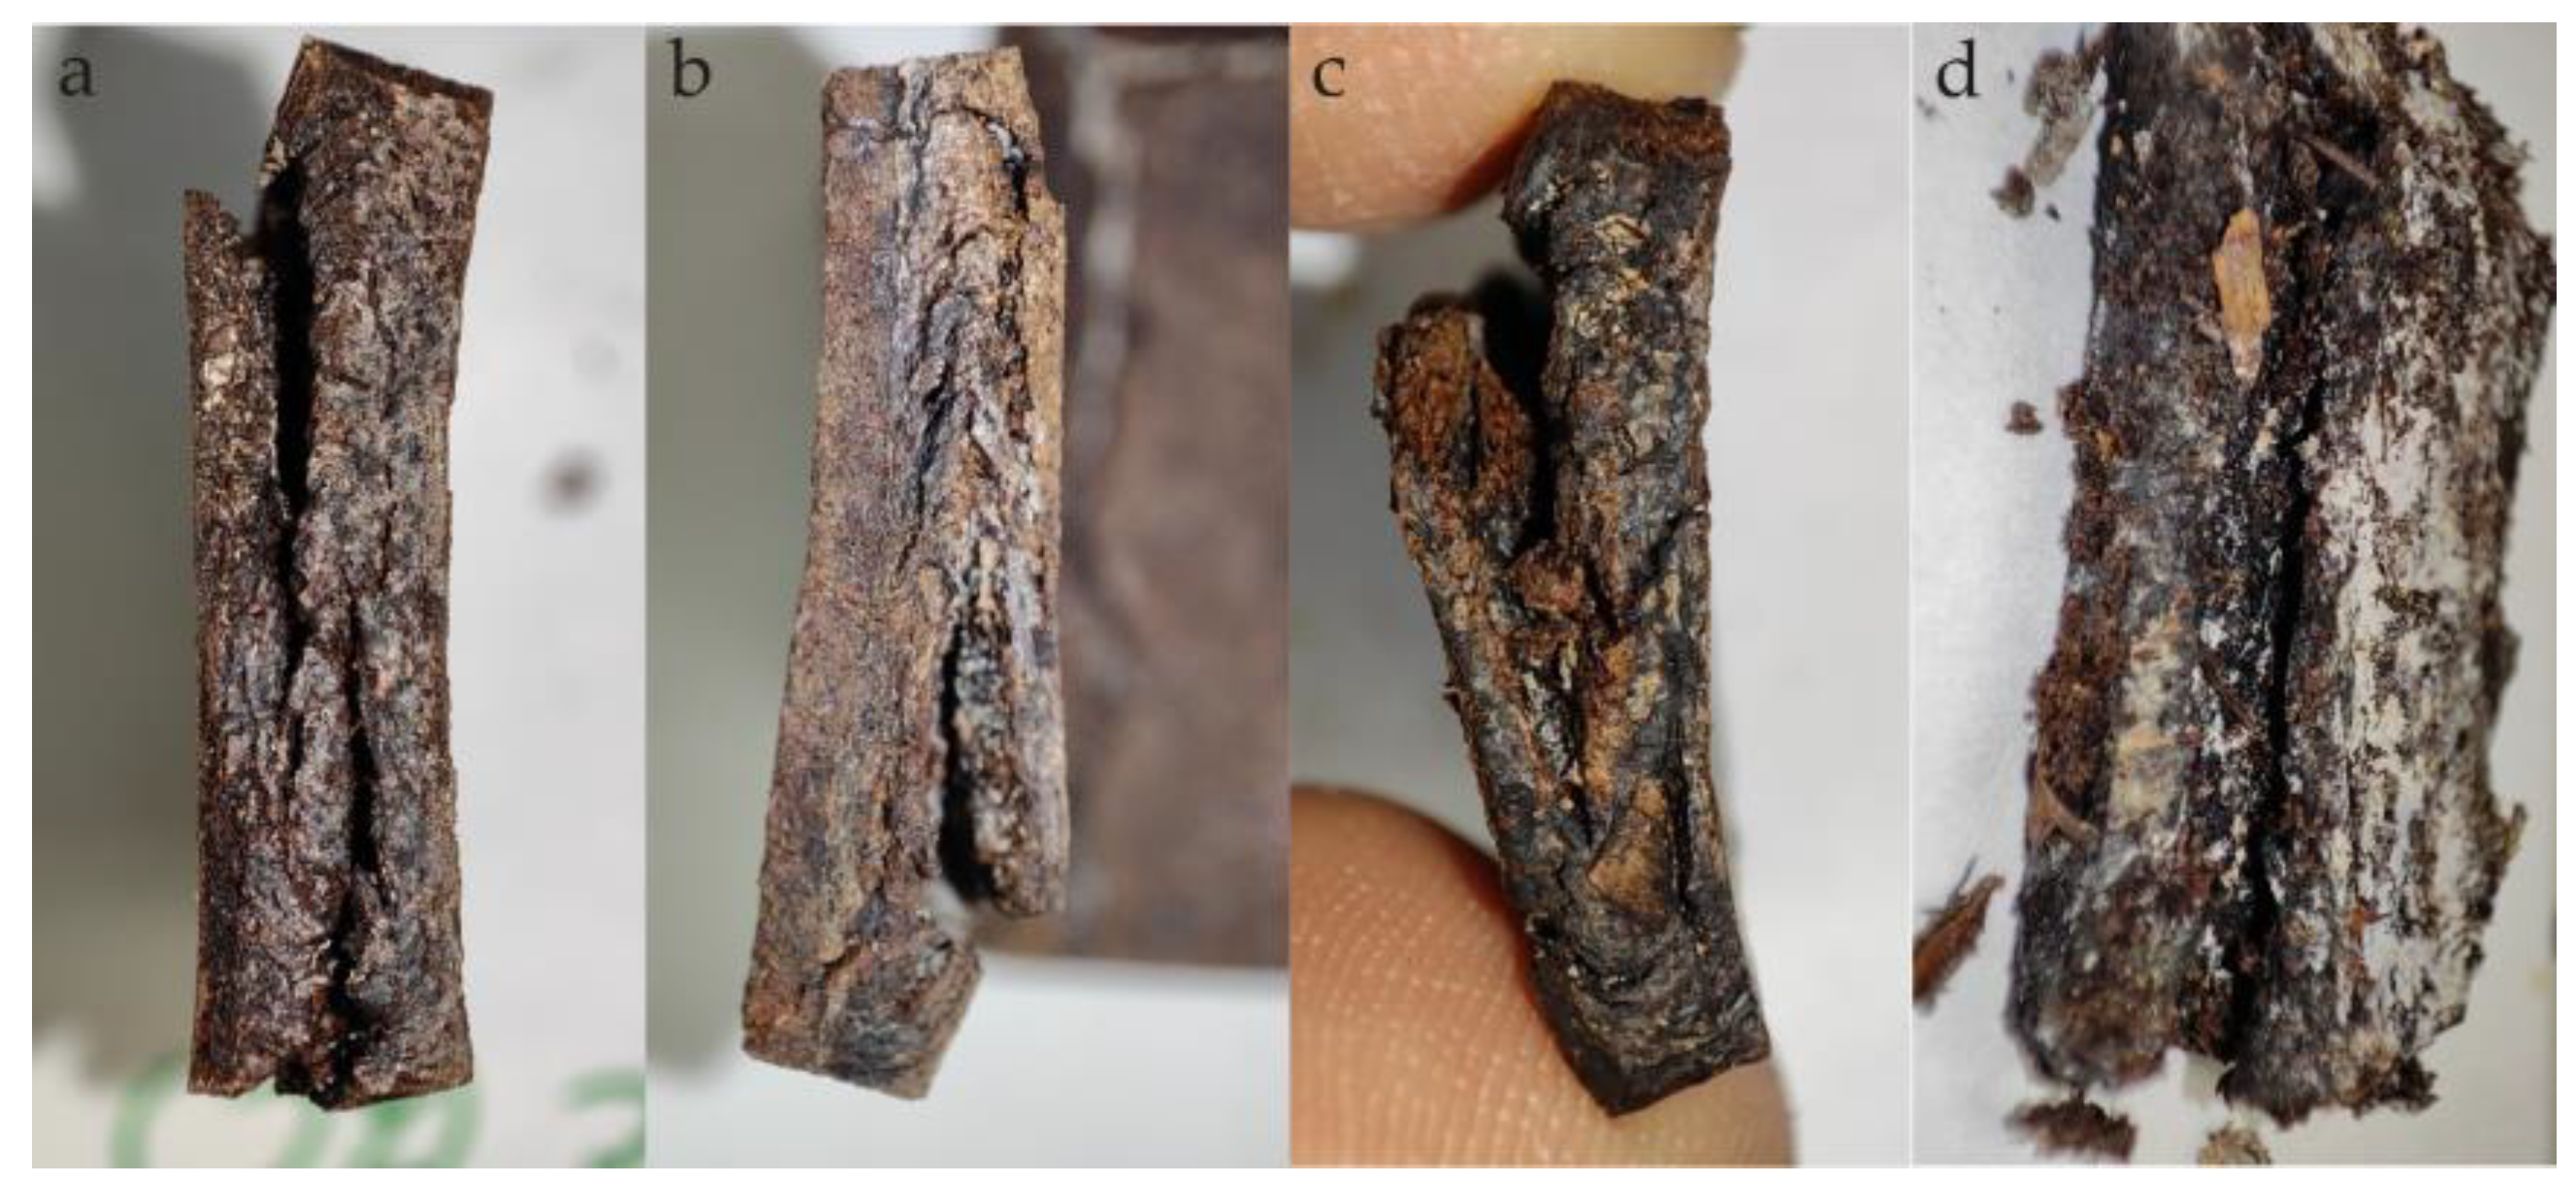
3.3.2. Morphology
3.3.3. Changes in Chemical Structure
3.4. Cell Culture Assessment
3.5. Antibacterial Properties
4. Conclusions
Author Contributions
Funding
Institutional Review Board Statement
Informed Consent Statement
Data Availability Statement
Conflicts of Interest
References
- Plastic Waste and Recycling in the EU: Facts and Figures. Available online: https://www.europarl.europa.eu/topics/en/article/20181212STO21610/plastic-waste-and-recycling-in-the-eu-facts-and-figures (accessed on 3 November 2024).
- OECD. Policy Scenarios for Eliminating Plastic Pollution by 2040; Organisation for Economic Co-operation and Development: Paris, France, 2024. [Google Scholar]
- Bahrami, M.; Abenojar, J.; Martínez, M.Á. Recent Progress in Hybrid Biocomposites: Mechanical Properties, Water Absorption, and Flame Retardancy. Materials 2020, 13, 5145. [Google Scholar] [CrossRef]
- Ochi, D.; Barbieri, D.; Reis, A.F.; Severino, P.; Venturini, A.C.; Pedroso Yoshida, C.M.; Souto, E.B.; da Silva, C.F. Chapter 1—Agro-Industrial Waste as Fillers for Green Composites. In Green Sustainable Process for Chemical and Environmental Engineering and Science; Inamuddin, A.T., Alrooqi, A., Eds.; Elsevier: Amsterdam, The Netherlands, 2023; pp. 1–26. ISBN 978-0-323-95183-8. [Google Scholar]
- Oliver-Cuenca, V.; Salaris, V.; Muñoz-Gimena, P.F.; Agüero, Á.; Peltzer, M.A.; Montero, V.A.; Arrieta, M.P.; Sempere-Torregrosa, J.; Pavon, C.; Samper, M.D.; et al. Bio-Based and Biodegradable Polymeric Materials for a Circular Economy. Polymers 2024, 16, 3015. [Google Scholar] [CrossRef]
- Świerczyńska, M.; Kudzin, M.H.; Chruściel, J.J. Poly(Lactide)-Based Materials Modified with Biomolecules: A Review. Materials 2024, 17, 5184. [Google Scholar] [CrossRef]
- Lewicka, K.; Szymanek, I.; Rogacz, D.; Wrzalik, M.; Łagiewka, J.; Nowik-Zając, A.; Zawierucha, I.; Coseri, S.; Puiu, I.; Falfushynska, H.; et al. Current Trends of Polymer Materials’ Application in Agriculture. Sustainability 2024, 16, 8439. [Google Scholar] [CrossRef]
- Stoica, M.; Bichescu, C.I.; Crețu, C.-M.; Dragomir, M.; Ivan, A.S.; Podaru, G.M.; Stoica, D.; Stuparu-Crețu, M. Review of Bio-Based Biodegradable Polymers: Smart Solutions for Sustainable Food Packaging. Foods 2024, 13, 3027. [Google Scholar] [CrossRef] [PubMed]
- Folino, A.; Karageorgiou, A.; Calabrò, P.S.; Komilis, D. Biodegradation of Wasted Bioplastics in Natural and Industrial Environments: A Review. Sustainability 2020, 12, 6030. [Google Scholar] [CrossRef]
- Aliotta, L.; Seggiani, M.; Lazzeri, A.; Gigante, V.; Cinelli, P. A Brief Review of Poly (Butylene Succinate) (PBS) and Its Main Copolymers: Synthesis, Blends, Composites, Biodegradability, and Applications. Polymers 2022, 14, 844. [Google Scholar] [CrossRef]
- Kim, J.; Yun, H.; Won, S.; Lee, D.; Baek, S.; Heo, G.; Park, S.; Jin, H.-J.; Kwak, H.W. Comparative Degradation Behavior of Polybutylene Succinate (PBS), Used PBS, and PBS/Polyhydroxyalkanoates (PHA) Blend Fibers in Compost and Marine–Sediment Interfaces. Sustain. Mater. Technol. 2024, 41, e01065. [Google Scholar] [CrossRef]
- Strangis, G.; Rossi, D.; Cinelli, P.; Seggiani, M. Seawater Biodegradable Poly(Butylene Succinate-Co-Adipate)—Wheat Bran Biocomposites. Materials 2023, 16, 2593. [Google Scholar] [CrossRef] [PubMed]
- Rafiqah, S.A.; Khalina, A.; Harmaen, A.S.; Tawakkal, I.A.; Zaman, K.; Asim, M.; Nurrazi, M.N.; Lee, C.H. A Review on Properties and Application of Bio-Based Poly(Butylene Succinate). Polymers 2021, 13, 1436. [Google Scholar] [CrossRef] [PubMed]
- Biodegradable Plastics Market Size & Forecast, [Latest]. Available online: https://www.marketsandmarkets.com/Market-Reports/biodegradable-plastics-93.html (accessed on 20 June 2023).
- Silva, R.R.A.; Marques, C.S.; Arruda, T.R.; Teixeira, S.C.; de Oliveira, T.V. Biodegradation of Polymers: Stages, Measurement, Standards and Prospects. Macromol 2023, 3, 371–399. [Google Scholar] [CrossRef]
- Sasimowski, E.; Majewski, Ł.; Grochowicz, M. Artificial Ageing, Chemical Resistance, and Biodegradation of Biocomposites from Poly(Butylene Succinate) and Wheat Bran. Materials 2021, 14, 7580. [Google Scholar] [CrossRef] [PubMed]
- Sasimowski, E.; Majewski, Ł.; Grochowicz, M. Efficiency of Twin-Screw Extrusion of Biodegradable Poly (Butylene Succinate)-Wheat Bran Blend. Materials 2021, 14, 424. [Google Scholar] [CrossRef]
- Sasimowski, E.; Majewski, Ł.; Grochowicz, M. Analysis of Selected Properties of Injection Moulded Sustainable Biocomposites from Poly(Butylene Succinate) and Wheat Bran. Materials 2021, 14, 7049. [Google Scholar] [CrossRef]
- Kim, H.-S.; Kim, H.-J.; Lee, J.-W.; Choi, I.-G. Biodegradability of Bio-Flour Filled Biodegradable Poly(Butylene Succinate) Bio-Composites in Natural and Compost Soil. Polym. Degrad. Stab. 2006, 91, 1117–1127. [Google Scholar] [CrossRef]
- Park, C.-W.; Youe, W.-J.; Han, S.-Y.; Park, J.-S.; Lee, E.-A.; Park, J.-Y.; Kwon, G.-J.; Kim, S.-J.; Lee, S.-H. Influence of Lignin and Polymeric Diphenylmethane Diisocyante Addition on the Properties of Poly(Butylene Succinate)/Wood Flour Composite. Polymers 2019, 11, 1161. [Google Scholar] [CrossRef] [PubMed]
- Fang, Y.; Jiang, Z.; Zhao, X.; Dong, J.; Li, X.; Zhang, Q. Spent Coffee Grounds/Poly(Butylene Succinate) Biocomposites with Robust Mechanical Property and Heat Resistance via Reactive Compatibilization. Compos. Commun. 2022, 29, 101003. [Google Scholar] [CrossRef]
- de Bomfim, A.S.C.; de Oliveira, D.M.; Benini, K.C.C.D.C.; Cioffi, M.O.H.; Voorwald, H.J.C.; Rodrigue, D. Effect of Spent Coffee Grounds on the Crystallinity and Viscoelastic Behavior of Polylactic Acid Composites. Polymers 2023, 15, 2719. [Google Scholar] [CrossRef] [PubMed]
- Hiller, B.T.; Schübel, L.; Rennert, M.; Krieg, D.; Nase, M.; Puch, F. Study of Wine Grape Pomaces from Different Vintages Regarding Their Use as Reliable Sustainable Antioxidants in Biobased Poly(Butylene Succinate). J. Polym. Env. 2024, 1–27. [Google Scholar] [CrossRef]
- Akindoyo, J.O.; Husney, N.A.A.B.; Ismail, N.H.; Mariatti, M. Structure and Performance of Poly(Lactic Acid)/Poly(Butylene Succinate-Co-L-Lactate) Blend Reinforced with Rice Husk and Coconut Shell Filler. Polym. Polym. Compos. 2021, 29, 992–1002. [Google Scholar] [CrossRef]
- Hongsriphan, N.; Kamsantia, P.; Sillapasangloed, P.; Loychuen, S. Bio-Based Composite from Poly(Butylene Succinate) and Peanut Shell Waste Adding Maleinized Linseed Oil. IOP Conf. Ser. Mater. Sci. Eng. 2020, 773, 012046. [Google Scholar] [CrossRef]
- Rojas-Lema, S.; Arevalo, J.; Gomez-Caturla, J.; Garcia-Garcia, D.; Torres-Giner, S. Peroxide-Induced Synthesis of Maleic Anhydride-Grafted Poly(Butylene Succinate) and Its Compatibilizing Effect on Poly(Butylene Succinate)/Pistachio Shell Flour Composites. Molecules 2021, 26, 5927. [Google Scholar] [CrossRef]
- Tadda, M.A.; Gouda, M.; Shitu, A.; Yu, Q.; Zhao, X.; Ying, L.; Zhu, S.; Liu, D. Baobab Fruit Powder Promotes Denitrifiers’ Abundance and Improves Poly(Butylene Succinate) Biodegradation for a Greener Environment. J. Environ. Chem. Eng. 2023, 11, 109654. [Google Scholar] [CrossRef]
- Dönitz, A.; Köllner, A.; Richter, T.; Löschke, O.; Auhl, D.; Völlmecke, C. Additive Manufacturing of Biodegradable Hemp-Reinforced Polybutylene Succinate (PBS) and Its Mechanical Characterization. Polymers 2023, 15, 2271. [Google Scholar] [CrossRef]
- Dorez, G.; Taguet, A.; Ferry, L.; Lopez-Cuesta, J.M. Thermal and Fire Behavior of Natural Fibers/PBS Biocomposites. Polym. Degrad. Stab. 2013, 98, 87–95. [Google Scholar] [CrossRef]
- Rodriguez-Uribe, A.; Harder, N.; Misra, M.; Mohanty, A.K. Biocomposites from Poly (Butylene Succinate-Co-Butylene Adipate) Biodegradable Plastic and Hop Natural Fiber: Studies on the Effect of Compatibilizer on Performance of the Composites. Compos. Part C Open Access 2023, 12, 100408. [Google Scholar] [CrossRef]
- Ortega, F.; Versino, F.; López, O.V.; García, M.A. Biobased Composites from Agro-Industrial Wastes and by-Products. Emergent Mater. 2022, 5, 873–921. [Google Scholar] [CrossRef] [PubMed]
- Gowman, A.; Wang, T.; Rodriguez-Uribe, A.; Mohanty, A.K.; Misra, M. Bio-Poly(Butylene Succinate) and Its Composites with Grape Pomace: Mechanical Performance and Thermal Properties. ACS Omega 2018, 3, 15205–15216. [Google Scholar] [CrossRef]
- Picard, M.C.; Rodriguez-Uribe, A.; Thimmanagari, M.; Misra, M.; Mohanty, A.K. Sustainable Biocomposites from Poly(Butylene Succinate) and Apple Pomace: A Study on Compatibilization Performance. Waste Biomass Valor. 2020, 11, 3775–3787. [Google Scholar] [CrossRef]
- Shen, Y.; Ren, L.; Ma, H.; Liu, X.; Song, T.; Liu, Q.; Xue, M.; Li, C.; Shao, M.; Zhang, M. Fabrication and Properties of Biodegradable Poly (Butylene Succinate) Composites by Regulating the Dispersed Oyster Shell Powder with the Silane Coupling Agent. J. Polym Res. 2024, 31, 216. [Google Scholar] [CrossRef]
- Noh, S.; Kim, D.; Jeong, G.; Koo, J.M.; Koo, J. Highly Dispersed Biochar as a Sustainable Filler for Enhancing Mechanical Performance and Biodegradation of Polybutylene Succinate. J. Appl. Polym. Sci. 2024, 141, e55539. [Google Scholar] [CrossRef]
- Papadopoulou, K.; Klonos, P.A.; Kyritsis, A.; Mašek, O.; Wurzer, C.; Tsachouridis, K.; Anastasiou, A.D.; Bikiaris, D.N. Synthesis and Study of Fully Biodegradable Composites Based on Poly(Butylene Succinate) and Biochar. Polymers 2023, 15, 1049. [Google Scholar] [CrossRef]
- Sasimowski, E.; Majewski, Ł.; Grochowicz, M. Study on the Biodegradation of Poly(Butylene Succinate)/Wheat Bran Biocomposites. Materials 2023, 16, 6843. [Google Scholar] [CrossRef] [PubMed]
- ISO 20200:2015; Plastics—Determination of the Degree of Disintegration of Plastic Materials under Simulated Composting Conditions in a Laboratory-Scale Test. ISO: Geneva, Switzerland, 2015.
- Sasimowski, E.; Grochowicz, M.; Szajnecki, Ł. Preparation and Spectroscopic, Thermal, and Mechanical Characterization of Biocomposites of Poly(Butylene Succinate) and Onion Peels or Durum Wheat Bran. Materials 2023, 16, 6799. [Google Scholar] [CrossRef] [PubMed]
- Data Sheet of PBS FZ71PM_and_FZ71PB. Available online: https://www.pttmcc.com/file_upload/tds/TDS-FZ71PM_PB.pdf (accessed on 22 June 2023).
- ISO 294-1:2017; Plastics—Injection Moulding of Test Specimens of Thermoplastic Materials—Part 1: General Principles, and Moulding of Multipurpose and Bar Test Specimens. ISO: Geneva, Switzerland, 2017.
- ISO 4892-2:2013; Plastics—Methods of Exposure to Laboratory Light Sources, Part 2 Xenon-Arc Lamps. ISO: Geneva Switzerland, 2013.
- ISO 11357-1:2023; Plastics—Differential Scanning Calorimetry (DSC)—Part 1: General Principles. ISO: Geneva, Switzerland, 2023.
- ASTM E308-22; Standard Practice for Computing the Colors of Objects by Using the CIE System. ASTM: West Conshohocken, PA, USA, 2022.
- ISO 846:2019; Plastics—Evaluation of the Action of Microorganisms. ISO: Geneva, Switzerland, 2019.
- ISO 291:2008; Plastics—Standard Atmospheres for Conditioning and Testing. ISO: Geneva, Switzerland, 2008.
- ISO 10993-12:2012; Biological Evaluation of Medical Devices, Sample Preparation and Reference Materials. ISO: Geneva, Switzerland, 2012.
- Michalicha, A.; Roguska, A.; Przekora, A.; Budzyńska, B.; Belcarz, A. Poly(Levodopa)-Modified β-Glucan as a Candidate for Wound Dressings. Carbohydr. Polym. 2021, 272, 118485. [Google Scholar] [CrossRef] [PubMed]
- Zhao, J.-H.; Wang, X.-Q.; Zeng, J.; Yang, G.; Shi, F.-H.; Yan, Q. Biodegradation of Poly(Butylene Succinate) in Compost. J. Appl. Polym. Sci. 2005, 97, 2273–2278. [Google Scholar] [CrossRef]
- Puchalski, M.; Szparaga, G.; Biela, T.; Gutowska, A.; Sztajnowski, S.; Krucińska, I. Molecular and Supramolecular Changes in Polybutylene Succinate (PBS) and Polybutylene Succinate Adipate (PBSA) Copolymer during Degradation in Various Environmental Conditions. Polymers 2018, 10, 251. [Google Scholar] [CrossRef]
- Vu, V.; Farkas, C.; Riyad, O.; Bujna, E.; Kilin, A.; Sipiczki, G.; Sharma, M.; Usmani, Z.; Gupta, V.K.; Nguyen, Q.D. Enhancement of the Enzymatic Hydrolysis Efficiency of Wheat Bran Using the Bacillus Strains and Their Consortium. Bioresour. Technol. 2022, 343, 126092. [Google Scholar] [CrossRef] [PubMed]
- Anstey, A.; Muniyasamy, S.; Reddy, M.M.; Misra, M.; Mohanty, A. Processability and Biodegradability Evaluation of Composites from Poly(Butylene Succinate) (PBS) Bioplastic and Biofuel Co-Products from Ontario. J. Polym. Env. 2014, 22, 209–218. [Google Scholar] [CrossRef]
- Huang, Z.; Qian, L.; Yin, Q.; Yu, N.; Liu, T.; Tian, D. Biodegradability Studies of Poly(Butylene Succinate) Composites Filled with Sugarcane Rind Fiber. Polym. Test. 2018, 66, 319–326. [Google Scholar] [CrossRef]
- Terzopoulou, Z.N.; Papageorgiou, G.Z.; Papadopoulou, E.; Athanassiadou, E.; Reinders, M.; Bikiaris, D.N. Development and Study of Fully Biodegradable Composite Materials Based on Poly(Butylene Succinate) and Hemp Fibers or Hemp Shives. Polym. Compos. 2016, 37, 407–421. [Google Scholar] [CrossRef]
- Steiner, T.; Zhang, Y.; Möller, J.N.; Agarwal, S.; Löder, M.G.J.; Greiner, A.; Laforsch, C.; Freitag, R. Municipal Biowaste Treatment Plants Contribute to the Contamination of the Environment with Residues of Biodegradable Plastics with Putative Higher Persistence Potential. Sci. Rep. 2022, 12, 9021. [Google Scholar] [CrossRef]
- Nelson, T.F.; Baumgartner, R.; Jaggi, M.; Bernasconi, S.M.; Battagliarin, G.; Sinkel, C.; Künkel, A.; Kohler, H.-P.E.; McNeill, K.; Sander, M. Biodegradation of Poly(Butylene Succinate) in Soil Laboratory Incubations Assessed by Stable Carbon Isotope Labelling. Nat. Commun. 2022, 13, 5691. [Google Scholar] [CrossRef]
- Socrates, G. Infrared and Raman Characteristic Group Frequencies: Tables and Charts, 3rd ed.; Wiley: Chichester, UK, 2004; ISBN 978-0-470-09307-8. [Google Scholar]
- Olsson, A.-M.; Salmén, L. The Association of Water to Cellulose and Hemicellulose in Paper Examined by FTIR Spectroscopy. Carbohydr. Res. 2004, 339, 813–818. [Google Scholar] [CrossRef] [PubMed]
- Cichosz, S.; Masek, A. IR Study on Cellulose with the Varied Moisture Contents: Insight into the Supramolecular Structure. Materials 2020, 13, 4573. [Google Scholar] [CrossRef] [PubMed]
- Kamnev, A.A.; Tugarova, A.V. Specificities of the Fourier Transform Infrared Spectroscopic Methodology and Interpretation of Spectroscopic Data in Microbiological Analyses. J. Anal. Chem. 2023, 78, 1320–1332. [Google Scholar] [CrossRef]
- Daly, P.; Cai, F.; Kubicek, C.P.; Jiang, S.; Grujic, M.; Rahimi, M.J.; Sheteiwy, M.S.; Giles, R.; Riaz, A.; de Vries, R.P.; et al. From Lignocellulose to Plastics: Knowledge Transfer on the Degradation Approaches by Fungi. Biotechnol. Adv. 2021, 50, 107770. [Google Scholar] [CrossRef]
- Urbanek, A.K.; Mirończuk, A.M.; García-Martín, A.; Saborido, A.; de la Mata, I.; Arroyo, M. Biochemical Properties and Biotechnological Applications of Microbial Enzymes Involved in the Degradation of Polyester-Type Plastics. Biochim. Biophys. Acta (BBA)-Proteins Proteom. 2020, 1868, 140315. [Google Scholar] [CrossRef] [PubMed]
- Temporiti, M.E.E.; Nicola, L.; Nielsen, E.; Tosi, S. Fungal Enzymes Involved in Plastics Biodegradation. Microorganisms 2022, 10, 1180. [Google Scholar] [CrossRef]
- Okal, E.J.; Heng, G.; Magige, E.A.; Khan, S.; Wu, S.; Ge, Z.; Zhang, T.; Mortimer, P.E.; Xu, J. Insights into the Mechanisms Involved in the Fungal Degradation of Plastics. Ecotoxicol. Environ. Saf. 2023, 262, 115202. [Google Scholar] [CrossRef]
- Rhim, J.-W.; Reddy, J.P.; Luo, X. Isolation of Cellulose Nanocrystals from Onion Skin and Their Utilization for the Preparation of Agar-Based Bio-Nanocomposites Films. Cellulose 2015, 22, 407–420. [Google Scholar] [CrossRef]
- Combrzyński, M.; Wójtowicz, A.; Oniszczuk, A.; Karcz, D.; Szponar, J.; Matwijczuk, A.P. Selected Physical and Spectroscopic Properties of TPS Moldings Enriched with Durum Wheat Bran. Materials 2022, 15, 5061. [Google Scholar] [CrossRef]
- Kamal-Eldin, A.; Lærke, H.N.; Knudsen, K.-E.B.; Lampi, A.-M.; Piironen, V.; Adlercreutz, H.; Katina, K.; Poutanen, K.; Åman, P. Physical, Microscopic and Chemical Characterisation of Industrial Rye and Wheat Brans from the Nordic Countries. Food Nutr. Res. 2009, 53, 1912. [Google Scholar] [CrossRef] [PubMed]
- Laurichesse, S.; Avérous, L. Chemical Modification of Lignins: Towards Biobased Polymers. Prog. Polym. Sci. 2014, 39, 1266–1290. [Google Scholar] [CrossRef]
- Robledo-Ortíz, J.R.; González-López, M.E.; Martín del Campo, A.S.; Pérez-Fonseca, A.A. Lignocellulosic Materials as Reinforcement of Polyhydroxybutyrate and Its Copolymer with Hydroxyvalerate: A Review. J. Polym. Env. 2021, 29, 1350–1364. [Google Scholar] [CrossRef]
- Azwa, Z.N.; Yousif, B.F.; Manalo, A.C.; Karunasena, W. A Review on the Degradability of Polymeric Composites Based on Natural Fibres. Mater. Des. 2013, 47, 424–442. [Google Scholar] [CrossRef]
- Stark, N.M. Effect of Weathering Cycle and Manufacturing Method on Performance of Wood Flour and High-Density Polyethylene Composites. J. Appl. Polym. Sci. 2006, 100, 3131–3140. [Google Scholar] [CrossRef]
- Benítez, V.; Mollá, E.; Martín-Cabrejas, M.A.; Aguilera, Y.; López-Andréu, F.J.; Cools, K.; Terry, L.A.; Esteban, R.M. Characterization of Industrial Onion Wastes (Allium cepa L.): Dietary Fibre and Bioactive Compounds. Plant Foods Hum. Nutr. 2011, 66, 48–57. [Google Scholar] [CrossRef] [PubMed]
- Ferreyra, M.L.F.; Serra, P.; Casati, P. Recent Advances on the Roles of Flavonoids as Plant Protective Molecules after UV and High Light Exposure. Physiol. Plant. 2021, 173, 736–749. [Google Scholar] [CrossRef] [PubMed]
- Asif, M.; Liaqat, M.A.; Khan, M.A.; Ahmed, H.; Quddusi, M.; Hussain, Z.; Liaqat, U. Studying the Effect of nHAP on the Mechanical and Surface Properties of PBS Matrix. J. Polym. Res. 2021, 28, 349. [Google Scholar] [CrossRef]
- Patwary, F.; Matsko, N.; Mittal, V. Biodegradation Properties of Melt Processed PBS/Chitosan Bio-Nanocomposites with Silica, Silicate, and Thermally Reduced Graphene. Polym. Compos. 2018, 39, 386–397. [Google Scholar] [CrossRef]
- Carroccio, S.; Rizzarelli, P.; Puglisi, C.; Montaudo, G. MALDI Investigation of Photooxidation in Aliphatic Polyesters: Poly(Butylene Succinate). Macromolecules 2004, 37, 6576–6586. [Google Scholar] [CrossRef]
- Fritz, M.; Lauschke, T.; Schlebrowski, T.; Beucher, L.; Schweyen, P.; Alenezi, B.; Hahn, B.; Dierkes, G.; Ternes, T.; Fischer, C.B. Photoaging Phenomena of Biodegradable Polybutylene Succinate and Conventional Low Density Polyethylene by Artificial Weathering—A Comparative Surface Study. Appl. Surf. Sci. 2022, 590, 153058. [Google Scholar] [CrossRef]
- Cai, L.; Qi, Z.; Xu, J.; Guo, B.; Huang, Z. Study on the Photodegradation Stability of Poly(Butylene Succinate-Co-Butylene Adipate)/TiO2 Nanocomposites. J. Chem. 2019, 2019, 5036019. [Google Scholar] [CrossRef]
- Zhang, Y.; Xu, J.; Guo, B. Photodegradation Behavior of Poly(Butylene Succinate-Co-Butylene Adipate)/ZnO Nanocomposites. Colloids Surf. A Physicochem. Eng. Asp. 2016, 489, 173–181. [Google Scholar] [CrossRef]
- Zhang, S.; Wang, L.; Yang, S.; Gong, Y. Improved Biocompatibility of Phosphorylcholine End-Capped Poly(Butylene Succinate). Sci. China Chem. 2013, 56, 174–180. [Google Scholar] [CrossRef]
- Stevenson, L.; Phillips, F.; O’sullivan, K.; Walton, J. Wheat Bran: Its Composition and Benefits to Health, a European Perspective. Int. J. Food Sci. Nutr. 2012, 63, 1001–1013. [Google Scholar] [CrossRef] [PubMed]
- Shabir, I.; Pandey, V.K.; Dar, A.H.; Pandiselvam, R.; Manzoor, S.; Mir, S.A.; Shams, R.; Dash, K.K.; Fayaz, U.; Khan, S.A.; et al. Nutritional Profile, Phytochemical Compounds, Biological Activities, and Utilisation of Onion Peel for Food Applications: A Review. Sustainability 2022, 14, 11958. [Google Scholar] [CrossRef]
- Mounir, R.; Alshareef, W.A.; El Gebaly, E.A.; El-Haddad, A.E.; Ahmed, A.M.S.; Mohamed, O.G.; Enan, E.T.; Mosallam, S.; Tripathi, A.; Selim, H.M.R.M.; et al. Unlocking the Power of Onion Peel Extracts: Antimicrobial and Anti-Inflammatory Effects Improve Wound Healing through Repressing Notch-1/NLRP3/Caspase-1 Signaling. Pharmaceuticals 2023, 16, 1379. [Google Scholar] [CrossRef]


| Sample | Heating I | Cooling | Heating II | |||||
|---|---|---|---|---|---|---|---|---|
| Tg [°C] | Tm [°C] | ΔHm [J/g] | Tc [°C] | Tg [°C] | Tm [°C] | ΔHm [J/g] | Xc [%] | |
| PBS | −25.6 | 121.3 | 72.39 | 86.4 | −31.7 | 118.5 | 70.03 | 63.49 |
| PBS_15 | −32.8 | 121.9 | 117.4 | 83.3 | −32.6 | 104/118.4 | 75.18 | 68.2 |
| PBS_30 | −32.0 | 120.8 | 123.0 | 84.9 | −31.3 | 105/117.6 | 93.12 | 84.4 |
| PBS_45 | −28.3 | 120.1 | 120.5 | 84.3 | −30.9 | 104/118.0 | 96.17 | 87.2 |
| PBS_60 | −34.3 | 120.0 | 123.2 | 84.9 | −27.1 | 104/117.4 | 98.4 | 89.1 |
| PBS_90 | −37.9 | 115.7 | 119.3 | 82.1 | −24.5 | 98/113.3 | 104.8 | 95.0 |
| OP15 | −25.1 | 121.9 | 71.32 | 82.1 | −33.2 | 116.7 | 59.05 | 62.98 |
| OP15_15 | −30.9 | 124.2 | 110.5 | 77.3 | −29.1 | 118.0 | 76.79 | 81.9 |
| OP15_30 | −30.9 | 122.5 | 111.1 | 77.3 | −27.3 | 118.0 | 79.5 | 84.8 |
| OP15_45 | −29.8 | 122.2 | 118.1 | 76.8 | −28.2 | 118.5 | 84.4 | 90.0 |
| OP15_60 | −28.7 | 122.5 | 117.9 | 77.5 | −29.4 | 116.5 | 86.91 | 92.7 |
| OP15_90 | −30.9 | 119.4 | 111.6 | 75.1 | −20.7 | 116.1 | 88.2 | 94.1 |
| OP30 | −29.5 | 119.0 | 72.15 | 78.0 | −30.2 | 119.2 | 51.89 | 67.21 |
| OP30_15 | −26.6 | 120.7 | 94.59 | 76.7 | −26.6 | 116.6 | 60.65 | 78.6 |
| OP30_30 | −28.2 | 121.9 | 98.99 | 74.2 | −25.2 | 117.8 | 65.82 | 85.2 |
| OP30_45 | −30.6 | 120.7 | 89.35 | 78.7 | −29.9 | 117.4 | 69.47 | 90.0 |
| OP30_60 | −28.6 | 121.3 | 103.6 | 74.1 | −27.5 | 119.9 | 72.4 | 93.8 |
| OP30_90 | −27.4 | 120.4 | 83.04 | 74.2 | −28.0 | 116/119.6 | 75.34 | 97.6 |
| WB15 | −34.4 | 118.6 | 81.5 | 79.6 | −33.6 | 116.7 | 69.05 | 73.65 |
| WB15_15 | −34.1 | 121.9 | 107.3 | 83.2 | −26.1 | 117.7 | 76.39 | 81.5 |
| WB15_30 | −35.1 | 123.7 | 111.9 | 81.4 | −30.7 | 106/121.3 | 79.78 | 85.1 |
| WB15_45 | −33.5 | 123.1 | 108.6 | 79.9 | −26.0 | 122.4 | 78.01 | 88.4 |
| WB15_60 | −33.1 | 118.9 | 112.7 | 79.8 | −28.7 | 115.9 | 94.5 | 90.2 |
| WB15_90 | −25.0 | 119.6 | 89.18 | 75.0 | −28.9 | 118.7 | 99.18 | 94.7 |
| WB30 | −31.6 | 118.4 | 70.0 | 78.4 | −29.5 | 118.0 | 61.19 | 79.25 |
| WB30_15 | −35.1 | 121.2 | 89.3 | 81.8 | −33.0 | 105/119.7 | 62.56 | 81.0 |
| WB30_30 | −29.9 | 122.0 | 97.37 | 80.6 | −30.7 | 105/120.7 | 70.32 | 85.0 |
| WB30_45 | −32.4 | 120.7 | 89.83 | 78.2 | −29.4 | 120.4 | 79.04 | 89.6 |
| WB30_60 | −30.3 | 119.8 | 84.45 | 76.7 | −17.7 | 119.4 | 87.29 | 87.9 |
| WB30_90 | - | 117.0 | - | 76.9 | −19.4 | 116.6 | 98.92 | 94.4 |
| Batch | Evaluation | PBS | WB15 | WB30 | OP15 | OP30 |
|---|---|---|---|---|---|---|
| 0 | Visual | 0 | 0 | 0 | 0 | 0 |
| S | 0 | 0 | 0 | 0 | 0 | |
| I | 2 | 3 | 4 | 3 | 5 | |
| I | Microscopic | Not applicable | Not applicable | Not applicable | Not applicable | Not applicable |
Disclaimer/Publisher’s Note: The statements, opinions and data contained in all publications are solely those of the individual author(s) and contributor(s) and not of MDPI and/or the editor(s). MDPI and/or the editor(s) disclaim responsibility for any injury to people or property resulting from any ideas, methods, instructions or products referred to in the content. |
© 2025 by the authors. Licensee MDPI, Basel, Switzerland. This article is an open access article distributed under the terms and conditions of the Creative Commons Attribution (CC BY) license (https://creativecommons.org/licenses/by/4.0/).
Share and Cite
Sasimowski, E.; Grochowicz, M.; Janczak, K.; Nurzyńska, A.; Belcarz-Romaniuk, A. Investigation of Biodegradation, Artificial Aging and Antibacterial Properties of Poly(Butylene Succinate) Biocomposites with Onion Peels and Wheat Bran. Materials 2025, 18, 293. https://doi.org/10.3390/ma18020293
Sasimowski E, Grochowicz M, Janczak K, Nurzyńska A, Belcarz-Romaniuk A. Investigation of Biodegradation, Artificial Aging and Antibacterial Properties of Poly(Butylene Succinate) Biocomposites with Onion Peels and Wheat Bran. Materials. 2025; 18(2):293. https://doi.org/10.3390/ma18020293
Chicago/Turabian StyleSasimowski, Emil, Marta Grochowicz, Katarzyna Janczak, Aleksandra Nurzyńska, and Anna Belcarz-Romaniuk. 2025. "Investigation of Biodegradation, Artificial Aging and Antibacterial Properties of Poly(Butylene Succinate) Biocomposites with Onion Peels and Wheat Bran" Materials 18, no. 2: 293. https://doi.org/10.3390/ma18020293
APA StyleSasimowski, E., Grochowicz, M., Janczak, K., Nurzyńska, A., & Belcarz-Romaniuk, A. (2025). Investigation of Biodegradation, Artificial Aging and Antibacterial Properties of Poly(Butylene Succinate) Biocomposites with Onion Peels and Wheat Bran. Materials, 18(2), 293. https://doi.org/10.3390/ma18020293