Article

Investigation on Drying Shrinkage of Basalt Fiber-Reinforced Concrete with Coal Gangue Ceramsite as Coarse Aggregates

School of Civil Engineering, Liaoning Technical University, Fuxin 123000, China
*
Author to whom correspondence should be addressed.
Materials 2025, 18(19), 4627; https://doi.org/10.3390/ma18194627
Submission received: 8 September 2025 / Revised: 29 September 2025 / Accepted: 2 October 2025 / Published: 7 October 2025
(This article belongs to the Topic Solid Waste Recycling in Civil Engineering Materials)

Abstract

In order to investigate the basalt fiber influences on drying shrinkage of coal gangue ceramsite concrete, specimens with varying fiber dosages and matrix strength were prepared. The drying shrinkage (DS) was compared. To elucidate the characteristics of the DS, the internal humidity (IH) and electrical resistivity (ER) were also tested. The properties of the variation in the DS, IH, and ER were verified. The correlation between the values of the DS, IH, and ES was systematically analyzed, and a prediction model of DS considering the influence of fiber dosage and coal gangue ceramsite was proposed. The results showed that the incorporation of basalt fiber can significantly reduce the DS, and the value of the DS decreased with the increment of fiber dosage. The value of the DS also decreased with the enhancement of the matrix strength. An inverse relationship existed between the variation in the IH and DS, whereas the variation in the ER demonstrated a direct proportionality with the variation in the DS. The prediction model for the basalt fiber-reinforced coal gangue ceramsite concrete was obtained by modifying the AFREM model. The values predicted by the improved AFREM model demonstrated excellent consistency with the test data.

1. Introduction

Coal gangue is a solid waste generated during coal production [1,2]. The large-scale open-air stockpiling of coal gangue not only occupies substantial land resources but may also cause atmospheric pollution due to spontaneous combustion [3,4]. Using it as a substitute for conventional aggregates in concrete not only promotes resource utilization but also reduces the need for natural aggregate mining [5]. Coal gangue-derived ceramsite lightweight aggregates reduce the adverse effects of carbon in the matrix while saving energy via carbon combustion during calcination. Utilizing ceramsite as coarse aggregate enhances the structure of the interfacial transition zone in concrete, thereby optimizing its pore size distribution [6]. Compared to ordinary concrete, ceramsite concrete demonstrates advantages including lighter weight, superior thermal and acoustic insulation properties, and enhanced seismic resistance [7,8,9]. Compared to geopolymer concrete, ceramsite concrete offers superior workability, higher impact resistance, enhanced fracture toughness, and a broader operating temperature range [10]. However, it also presents limitations such as lower elastic modulus, higher DS, and increased cracking susceptibility, which constrain its engineering applications [11,12]. Understanding the shrinkage characteristics of coal gangue ceramsite concrete (CGCC) and developing effective shrinkage control methods provides technical foundations for practical engineering implementation.
The influence of fiber dosage on the DS of concrete has been investigated by several researchers. Zhang et al. [13] demonstrated that fibers with high elastic modulus were more effective than those with low elastic modulus in reducing the DS of the composites. Afroughsabet et al. [14] investigated the synergistic effects of hybrid steel-polyvinyl alcohol fibers on the DS of high-performance concrete. The results showed that the steel-PVA fiber combination exhibited a pronounced positive hybrid effect on reduction in the DS of the matrix. Yousefieh et al. [15] found that the fiber incorporation effectively mitigated crack formation induced by the drying-induced shrinkage in the cementitious matrix. Due to the high elastic modulus and tensile strength, the performance of the basalt fiber-reinforced concrete has been verified by researchers.
Jiang et al. [16] conducted a series of mechanical properties tests on BFRC, and the results showed that BFRC presents high flexural strength and tensile strength, but the compressive strength increases slightly at the early age and even decreases at the late age. With the increase in BF dosage, the improvement of mechanical properties of BFRC becomes more obvious; the suitable amount of BF is about 0.3% in volume fraction. Katkhuda et al. [17] investigated the compressive strength, splitting tensile strength, and flexural strength of basalt fiber-reinforced concrete; the results showed that the optimal volume fraction of the fibers was 0.3%, beyond which the mechanical properties of the matrix were weakened. Elshazli et al. [18] investigated the influence of basalt fibers on the fresh properties, mechanical properties, durability, and corrosion resistance of concrete. The results showed that a fiber volume fraction of 0.30% was the optimal ratio, demonstrating overall acceptable performance in terms of both mechanical and corrosion-related properties. Ramesh et al. [19] studied the influence of basalt fiber on crack widths and failure modes of concrete, and the results demonstrated that basalt fibers exhibited good bonding behavior with cement. However, investigations corresponding to the basalt fiber effect on the drying shrinkage and the prediction models of concrete, especially for the lightweight concrete, are still rare.
In this study, the DS of basalt fiber-reinforced CGCC was evaluated. The DS, IH, and ER of the samples were measured over 90 days. The influence of the fiber dosage and matrix strength was verified. The variation pattern of the DS, IH, and ER of the matrix was explored, and the relationship between the variation in IH, ER, and DS was evaluated. Taking into account the combined effects of coal gangue ceramsite and fiber dosage, a modified AFREM model to predict the drying shrinkage of basalt fiber-reinforced coal gangue ceramsite concrete (BFRCGCC) was proposed. The investigation may offer valuable technical references for engineering applications of the CGCC.

2. Experiments

2.1. Materials

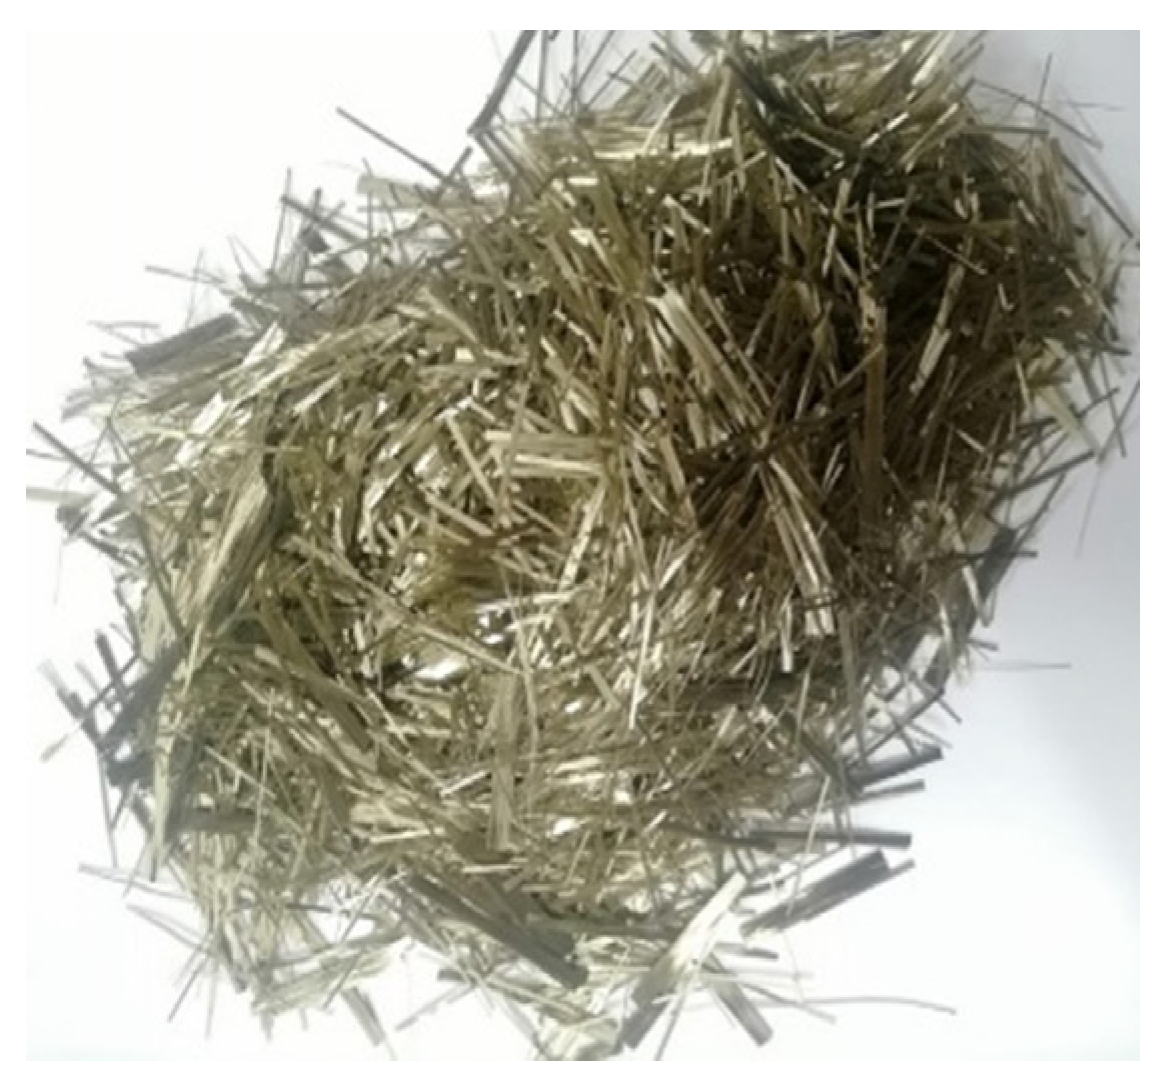
The basic mix proportion of the CGCC is listed in Table 1, and the water to cement ratios were set as 0.40 and 0.36, respectively. The binder was Portland cement (P·O42.5); the properties of the cement are shown in Table 2. Coal gangue ceramsite with a particle size of 5–20 mm was adopted as the coarse aggregate, as shown in Figure 1, and the properties of the coal gangue ceramsite are listed in Table 3. The fine aggregates were natural river sand with a particle size of 0–5 mm. The basalt fiber was introduced as shown in Figure 2. Through existing investigations and a preliminary test by our group, the fiber dosage for the CGCC was set as 0%, 0.1%, 0.2%, and 0.3% by volume, respectively. The physical properties of the basalt fiber are listed in Table 4. Eight groups of samples were designed as shown in Table 5.

2.2. Test Method

2.2.1. Compressive Strength Test

Compressive strength testing was performed in accordance with the Chinese standard [20], additionally referencing the relevant clauses of International Standard ISO 1920-4 [21] and the EN 12390 series [22,23,24,25], using 100 mm cube specimens. All the samples were cured for 28 days in a controlled chamber at a temperature of 20 ± 2 °C and a relative humidity of 95%. The test was performed using a servo-controlled testing machine with a loading rate maintained at 0.6 MPa/s. The compressive strength value was obtained by Equation (1) and multiplied by a reduction factor of 0.95. The compressive strength was taken as the average of three specimens in each group.
f c c = F / A
where fcc is compressive strength of concrete (MPa); F is peak load of specimens (N); A is bearing area of specimens (mm2).

2.2.2. Internal Humidity Test

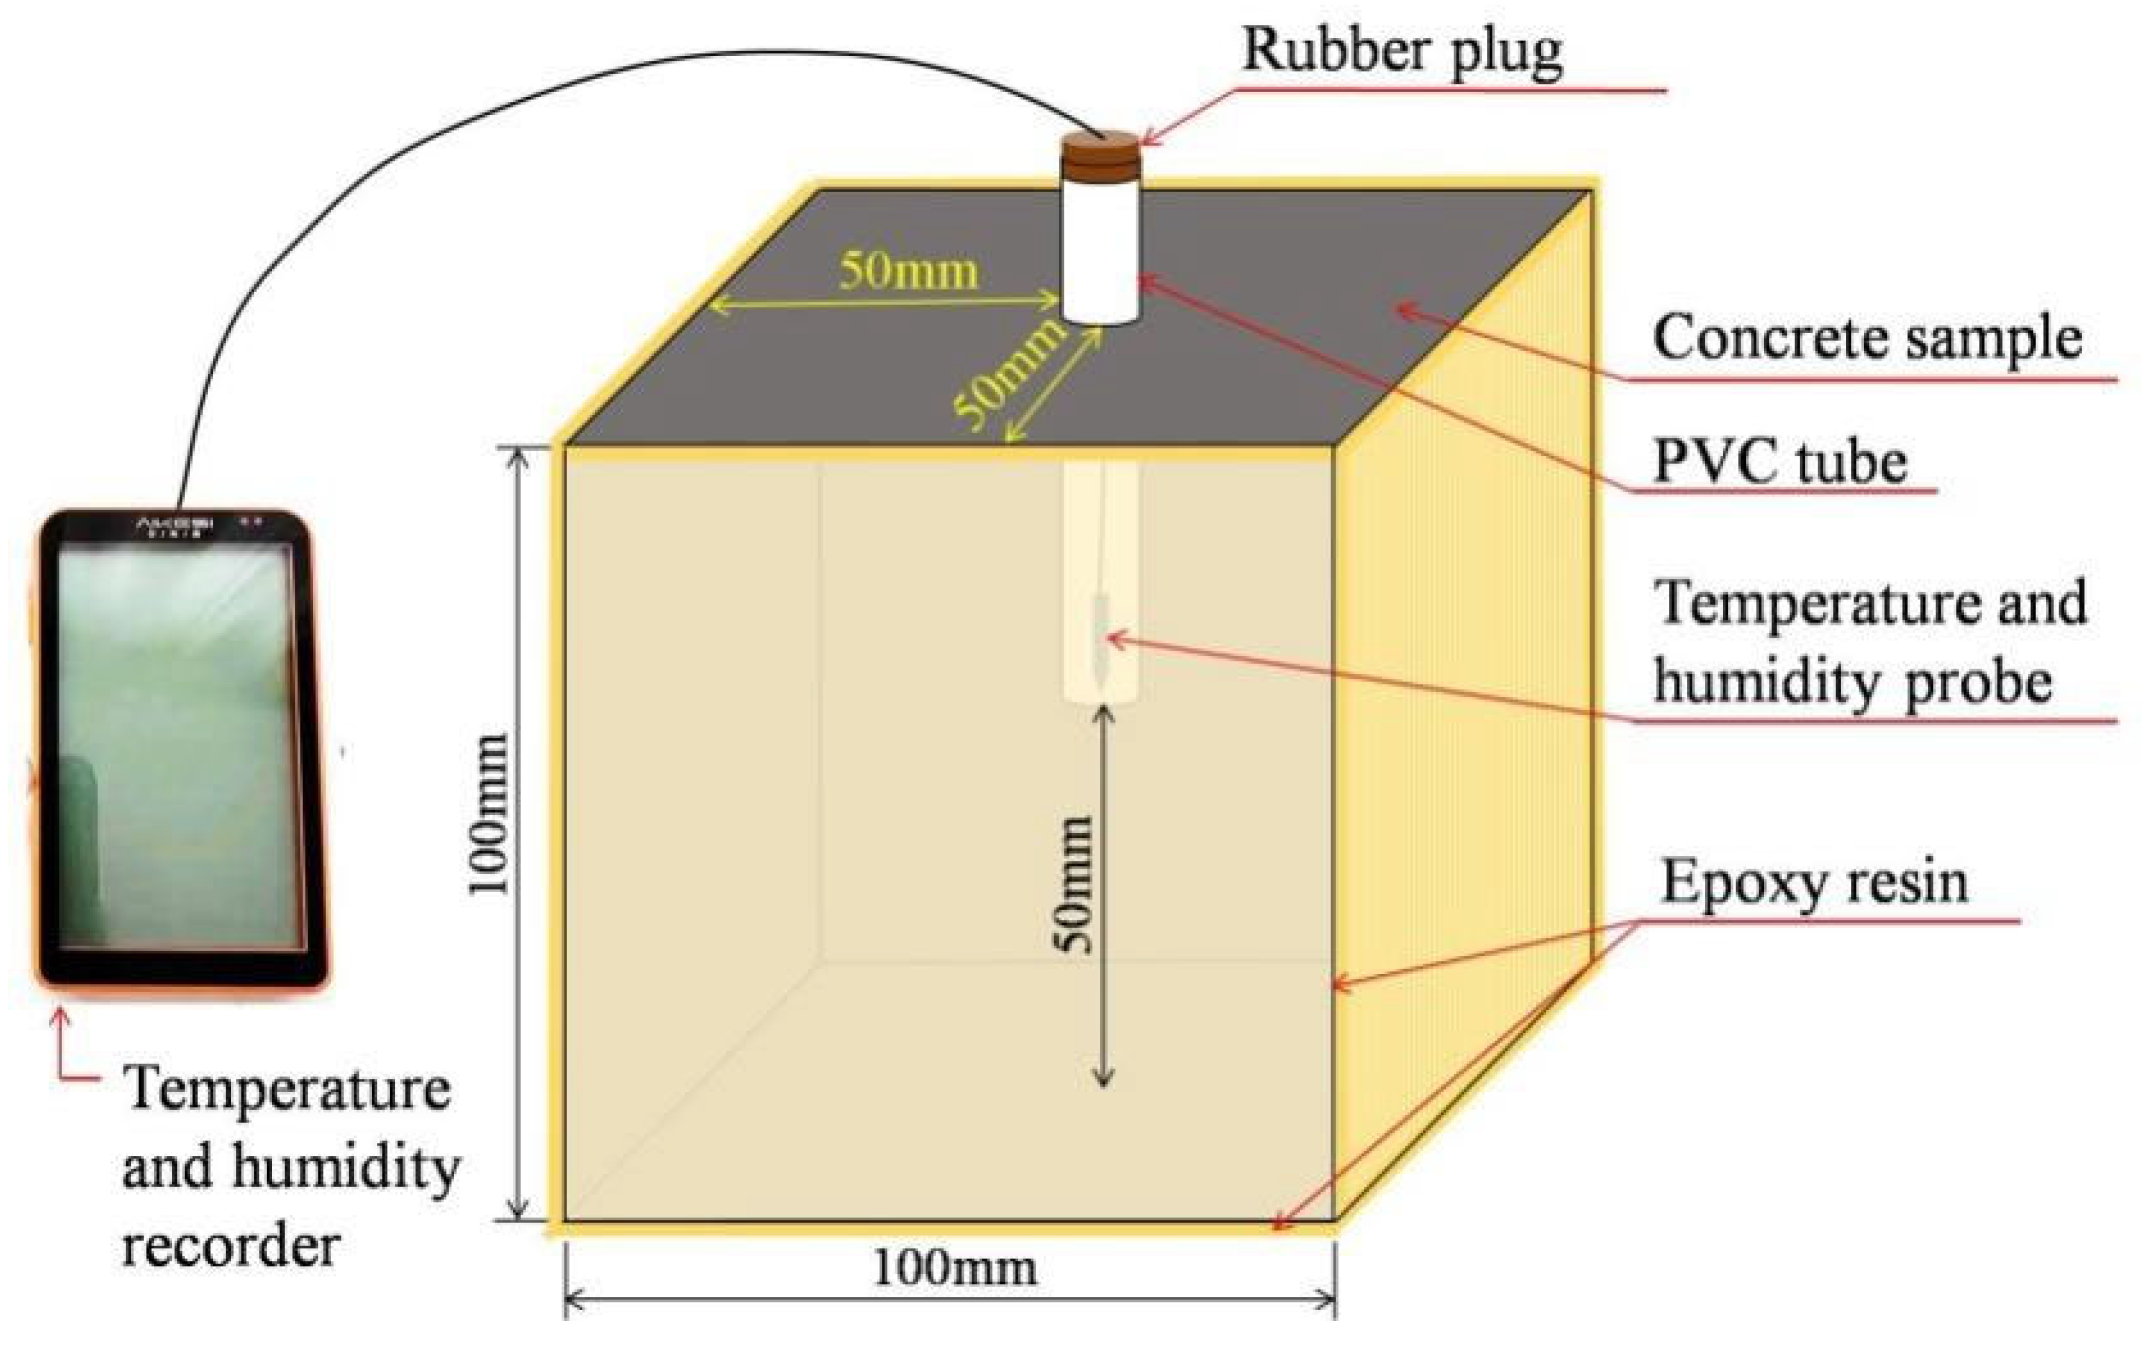
The IH of concrete was measured with reference to Method C (Internal Relative Humidity Method) specified in EN 13578:2003 [26]. A PVC pipe was inserted into the center of a freshly cast 100 mm concrete cube with a penetration depth of 50 mm [27,28]. A steel rod was inserted into the PVC pipe, ensuring tight contact with the inner wall to prevent slurry ingress [29]. After the samples were initially consolidated, the steel rod was slowly withdrawn, and the PVC pipe opening was immediately sealed with a rubber plug. All cubic specimens were then wrapped with plastic film to prevent moisture loss. Chindaprasirt et al. [30] and Jin et al.’s [31] studies demonstrated that external moisture and Cl can be effectively prevented from penetrating the interior by applying epoxy resin to the surface of concrete specimens. After demolding, the remaining five faces of the samples were sealed with an epoxy resin layer to ensure one-dimensional moisture diffusion within the matrix [32,33].
During the initial stage of the experiment, the temperature and humidity sensors were inserted into the PVC tubes, and the pipe openings were sealed with a flexible rubber plug. All the specimens were then transferred to a curing chamber maintained at 20 ± 2 °C with 60 ± 5% relative humidity. The IH of the sample was recorded continuously for 90 days. The arrangement of the measuring device is presented in Figure 3.

2.2.3. Drying Shrinkage Test

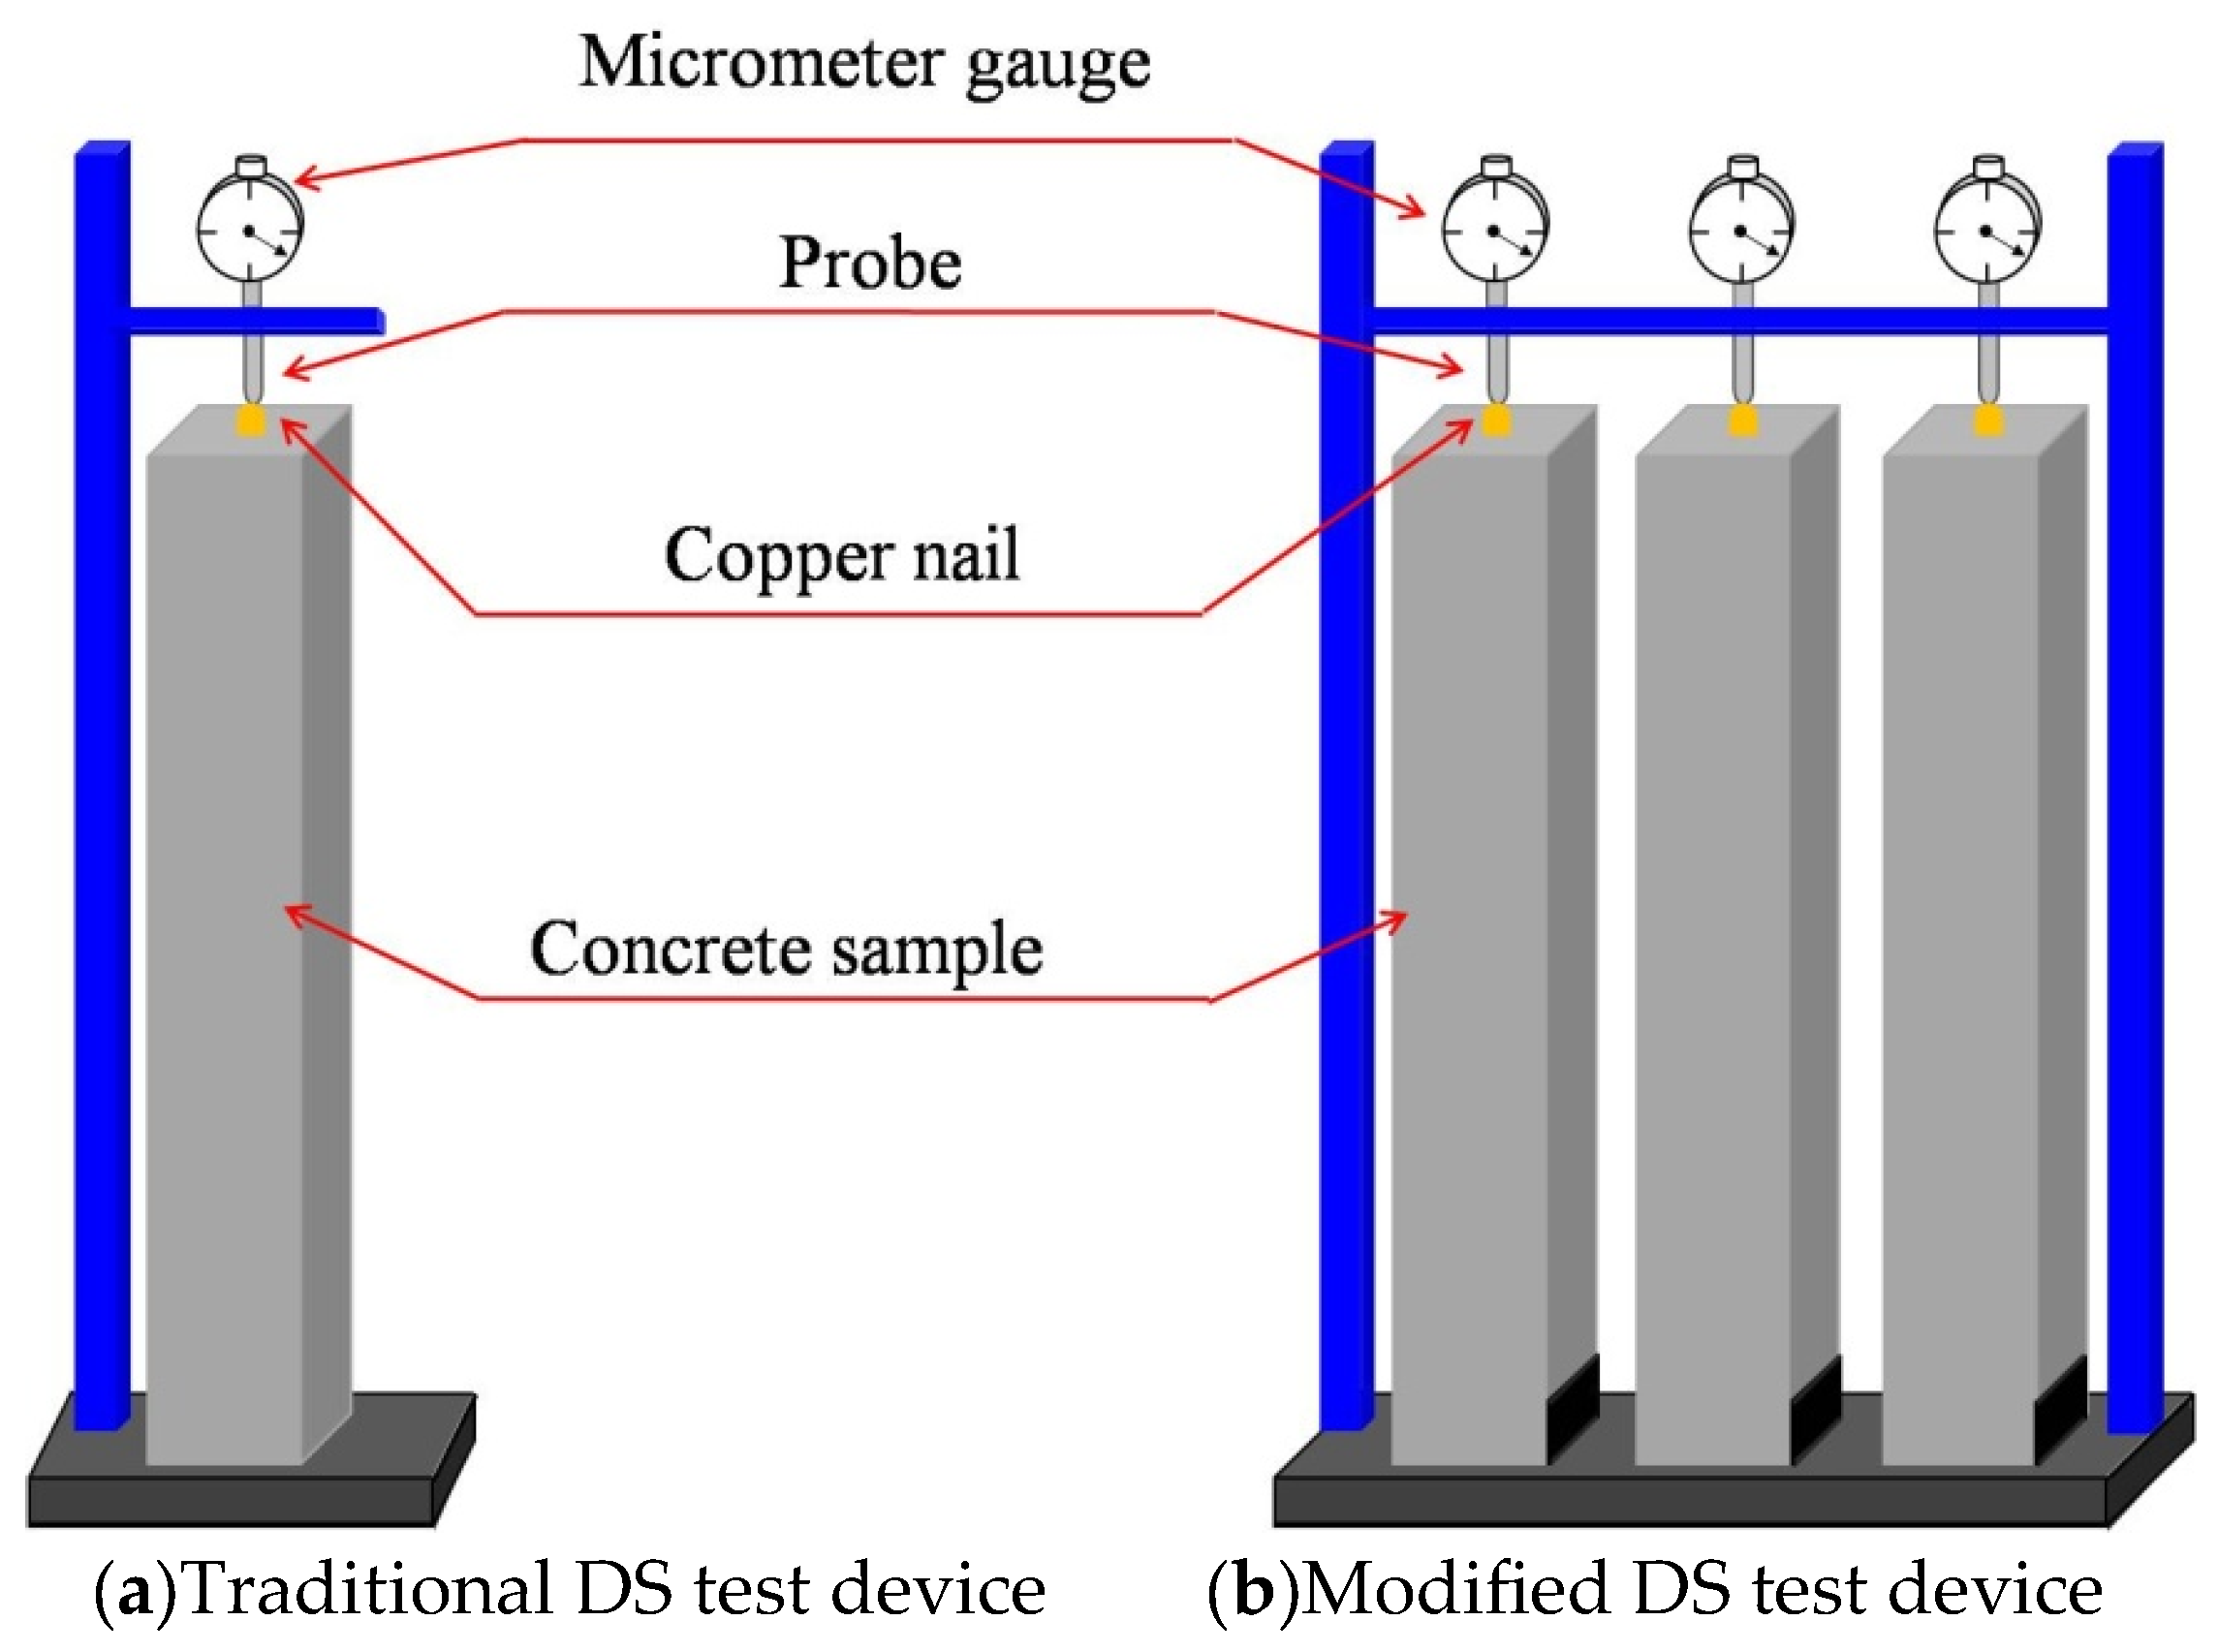
The drying shrinkage test was conducted primarily in accordance with the Chinese standard [34], with reference to the curing and testing methods specified in EN 12390 [35]. Three prismatic specimens (100 mm × 100 mm × 515 mm) were fabricated for each mixture. The specimens were demolded after 24 h, and then transferred to a standard curing chamber maintained at 20 ± 2 °C and 95% relative humidity. At a curing time of 3 d, the prismatic specimens were placed in the modified DS test device. Both the traditional test device recommended by the standard [34] and the modified DS test devices are illustrated in Figure 4a and Figure 4b, respectively. Compared with the traditional DS test device, the improved device demonstrated the following advantages: (1) Three specimens from each group can be simultaneously mounted on the same device, facilitating observation and data recording while enabling intuitive comparison of value variations across groups. (2) The enhanced design ensures greater stability, eliminating errors induced by device vibration or environmental interference. (3) Limit plates installed on the base can effectively prevent the oscillation of the samples.
All the prismatic specimens were transferred to a curing room with a temperature of 20 ± 2 °C and relative humidity of 60 ± 5% for the DS test. The micrometer gauge readings were recorded periodically throughout the 90-day test period. The DS of the samples was determined by Equation (2) [34].
ε st = ( L 0 L t ) / L b
where εst is the DS of the sample corresponding to the curing time of t d; L0 is the initial length of the sample (mm); Lt is the length of the sample at the age of t d (mm); Lb is the measurement distance of the sample (mm).

2.2.4. Electrical Resistivity Test

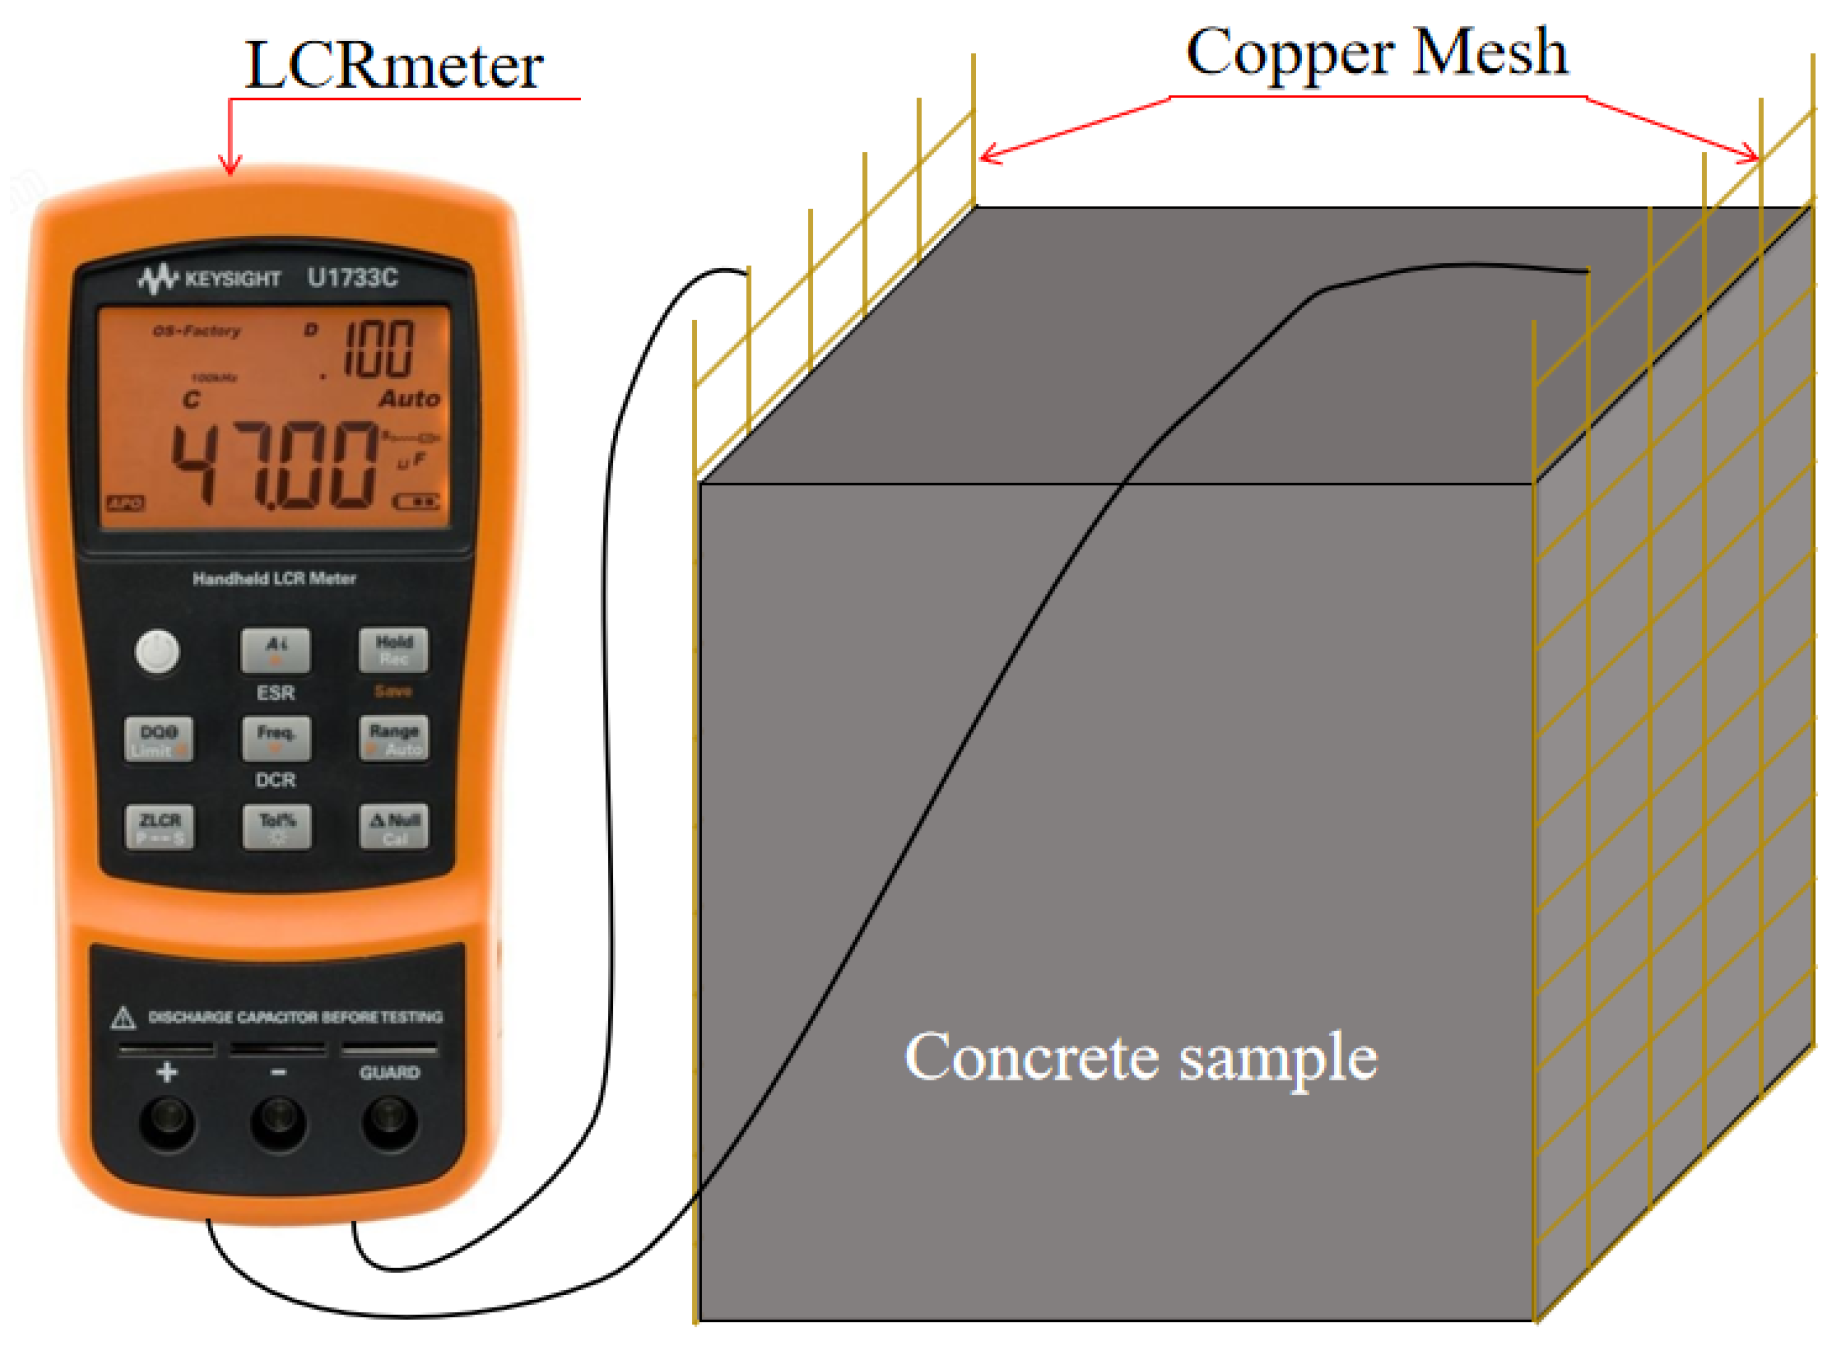
Cubic specimens (100 mm × 100 mm × 100 mm) were used for the ER test. Several researchers measured the ER of the concrete by embedding copper mesh in samples [36,37]. Following the method, copper mesh (100 mm × 120 mm) was introduced to the two opposing mold surfaces before pouring the sample. The ER of the matrix was measured using the LCR meter as shown in Figure 5. The ER of the samples can be calculated by Equation (3). The mean value of the three samples serves as the ER value of the group.
ρ = R S / L
where ρ is the ER (Ω·m); R is the resistance (Ω); S is the specimen’s cross-sectional area (mm2); L is the distance of the two copper meshes (mm).

3. Results and Discussion

3.1. Compressive Strength

The 28-day compressive strength of specimens with different basalt fiber dosages is shown in Table 6. To evaluate the effect of fiber dosage on compressive strength of the CGCC, the variation and 95% confidence interval of the compressive strength are also listed in the table.
From Table 6, it can be seen that for the samples with a water–cement ratio of 0.40, the compressive strength of the BFRCGCC1-0 is 37.3 MPa; compared with BFRCGCC1-0, the compressive strength of the BFRCGCC1-1, BFRCGCC1-2, and BFRCGCC1-3 decreased by 1.6%, 4.0%, and 5.4%, respectively. Similar outcomes were also reported by Niu et al. [38] and Kizilkanat et al. [39]; the variation in the values between the mixtures is relatively small. The phenomenon indicated that the basalt fiber with low fiber dosage demonstrated a negligible effect on the compressive strength of the concrete. This is possibly because the basalt fiber, belonging to high modulus fiber, at a low volume fraction, was unable to form a load-bearing skeleton within the matrix, thus failing to enhance the compressive strength [40]. Similar findings had been reported in previous investigations regarding the compressive strength of concrete with other types of fiber [41,42,43].

3.2. Internal Humidity

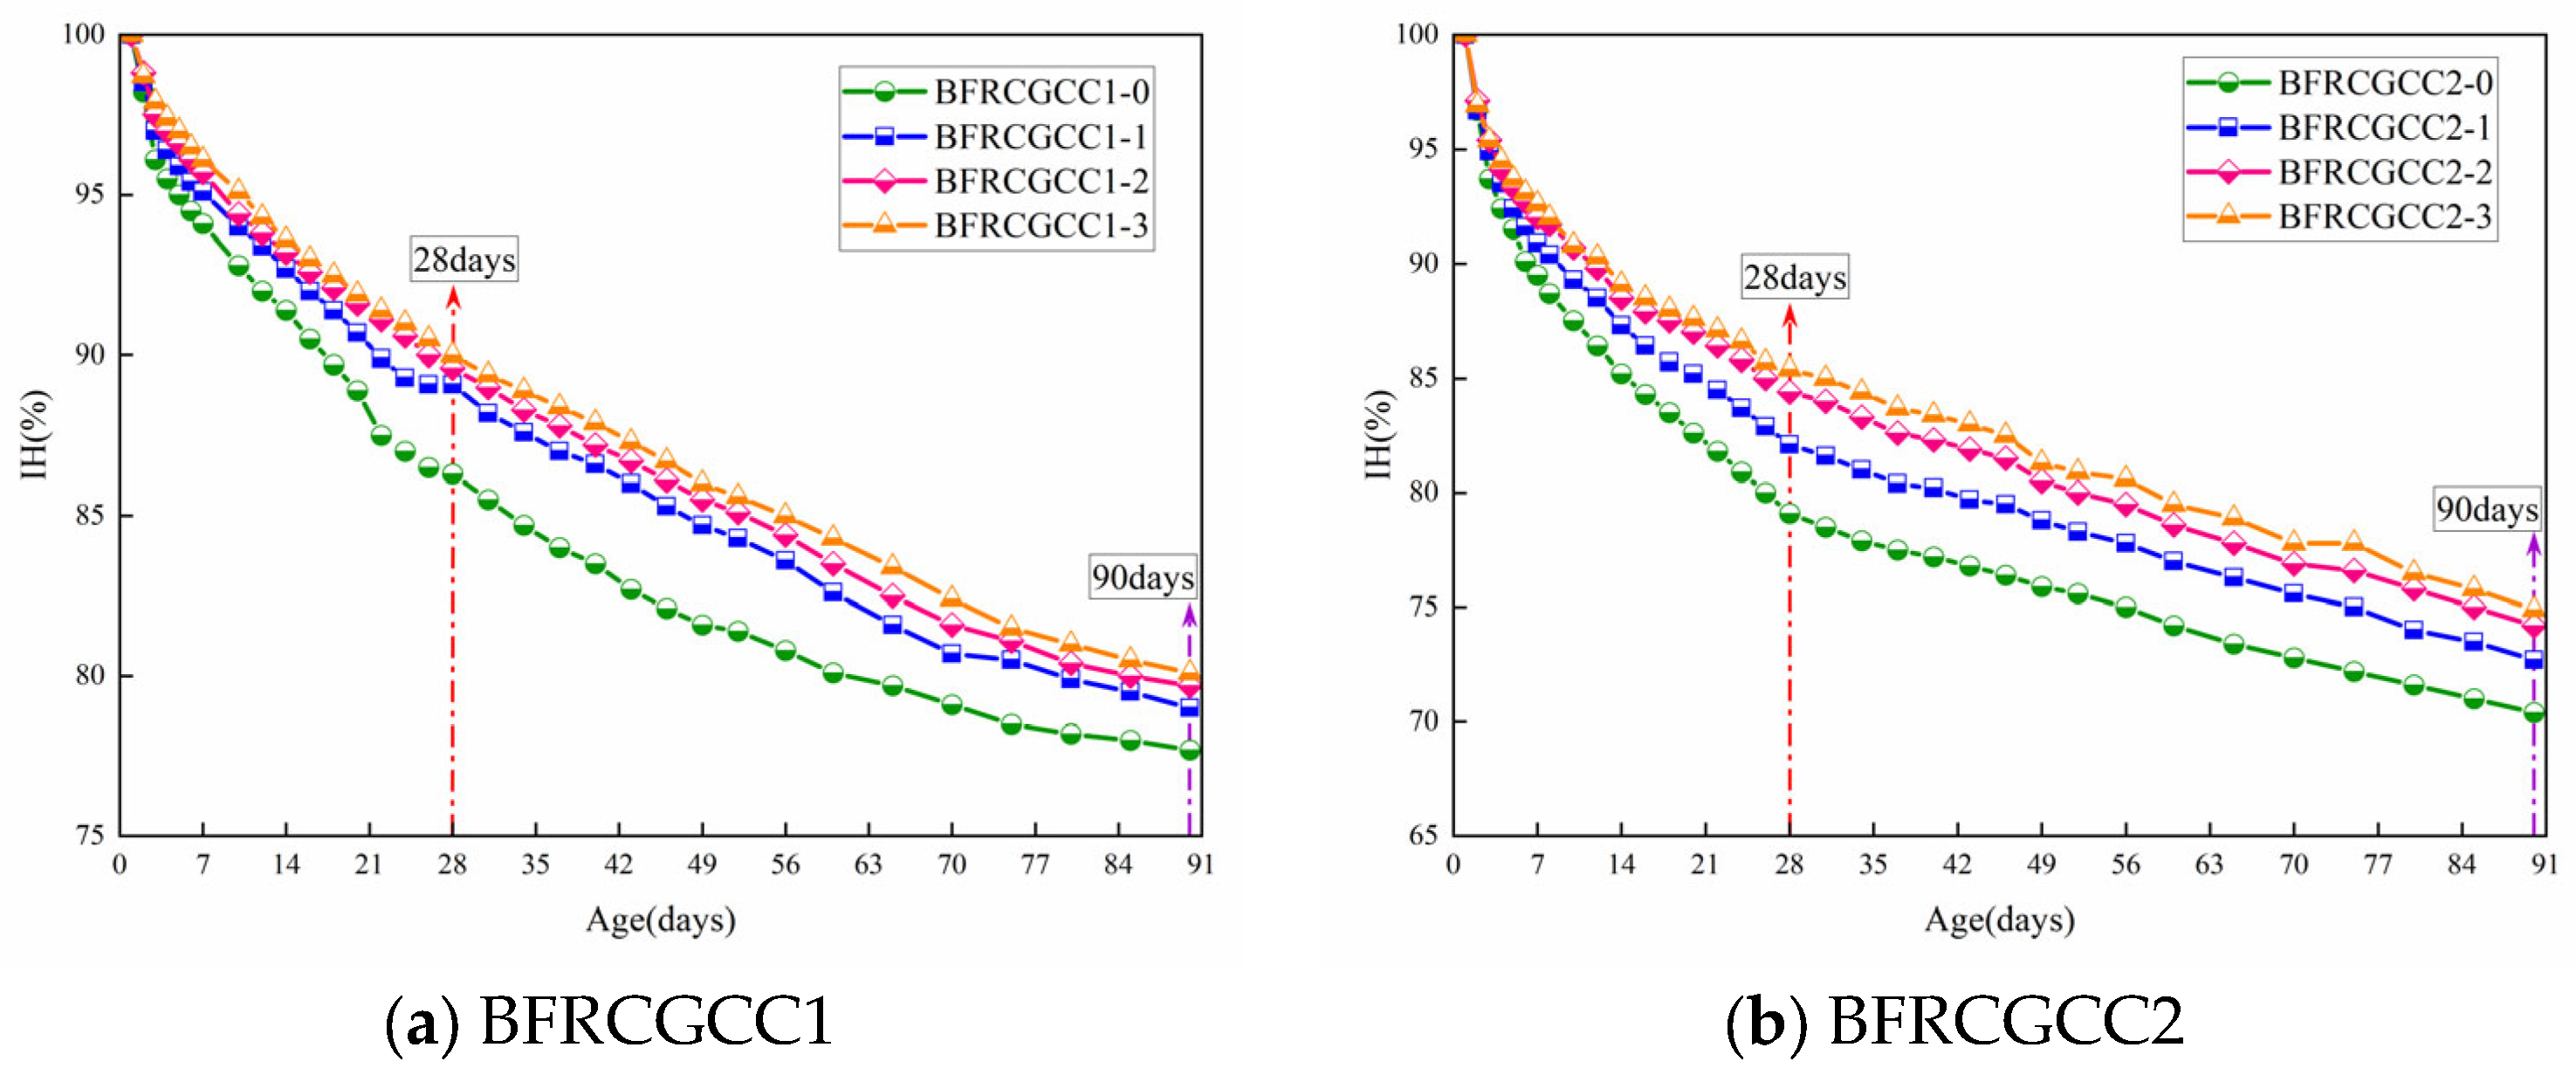
The variations in the IH of different samples with age are presented in Figure 6.
From Figure 6, we can see that with the increment of the age, the IH of the matrix showed a gradual downward trend. The matrix’s IH progressively improved with higher fiber dosage at equivalent curing durations. For example, at the age of 28 d, compared with BFRCGCC1-0, the IH of BFRCGCC1-1, BFRCGCC1-2, and BFRCGCC1-3 increased by 3.2%, 3.8% and 4.3%, respectively. The reason may be a three-dimensional network formed by fibers, which effectively suppresses microcrack development and increases the tortuosity of moisture migration paths, thereby controlling the reduction in IH [44,45,46]. Additionally, the IH of the matrix was significantly affected by the water–cement ratio. Take the specimens with 0.1% fiber dosage as an example: at the ages of 28 d and 90 d, compared with the IH of BFRCGCC1-1, the values of BFRCGCC2-1 decrease by 9.1% and 8.0%, respectively. It may be attributed to the hydration-induced water consumption within the matrix, and the comparatively lower water–cement ratio in BFRCGCC2 made a contribution to the pronounced reduction in the IH value of the matrix [47].
In order to intuitively observe the alteration of the IH of the samples with age, Equation (4) was introduced to process the IH of the specimens [48].
D R = R H t ¯ R H t 1 ¯ / t
where DR is the IH decay rate of the specimen (%/d); R H t ¯ , R H t 1 ¯ are the IH of the specimen at time t and (t − 1), respectively (%); Δt is the temporal interval between time points t and (t − 1) (d).
The IH decay rate of the samples can be obtained according to Equation (4); the results are presented in Figure 7.
From Figure 7, it can be seen that the decay rate of the IH of the BFRCGCC was large at the initial stage (0–14 d), and gradually decreased with the increment of age, and the decay rate approached 0.1% at the age of 90 d. At the same age, the IH decay rate decreased progressively with higher fiber dosage, indicating an inhibitory effect of basalt fiber on IH variation. The reasons may be that at the early stage, the cement hydration process consumed a large amount of water, the process resulted in a large decay rate of the IH [28]; as the concrete aged, its water content decreased significantly while the increasing matrix strength impeded evaporation, leading to a noticeable reduction in the IH decay rate [49].

3.3. Drying Shrinkage

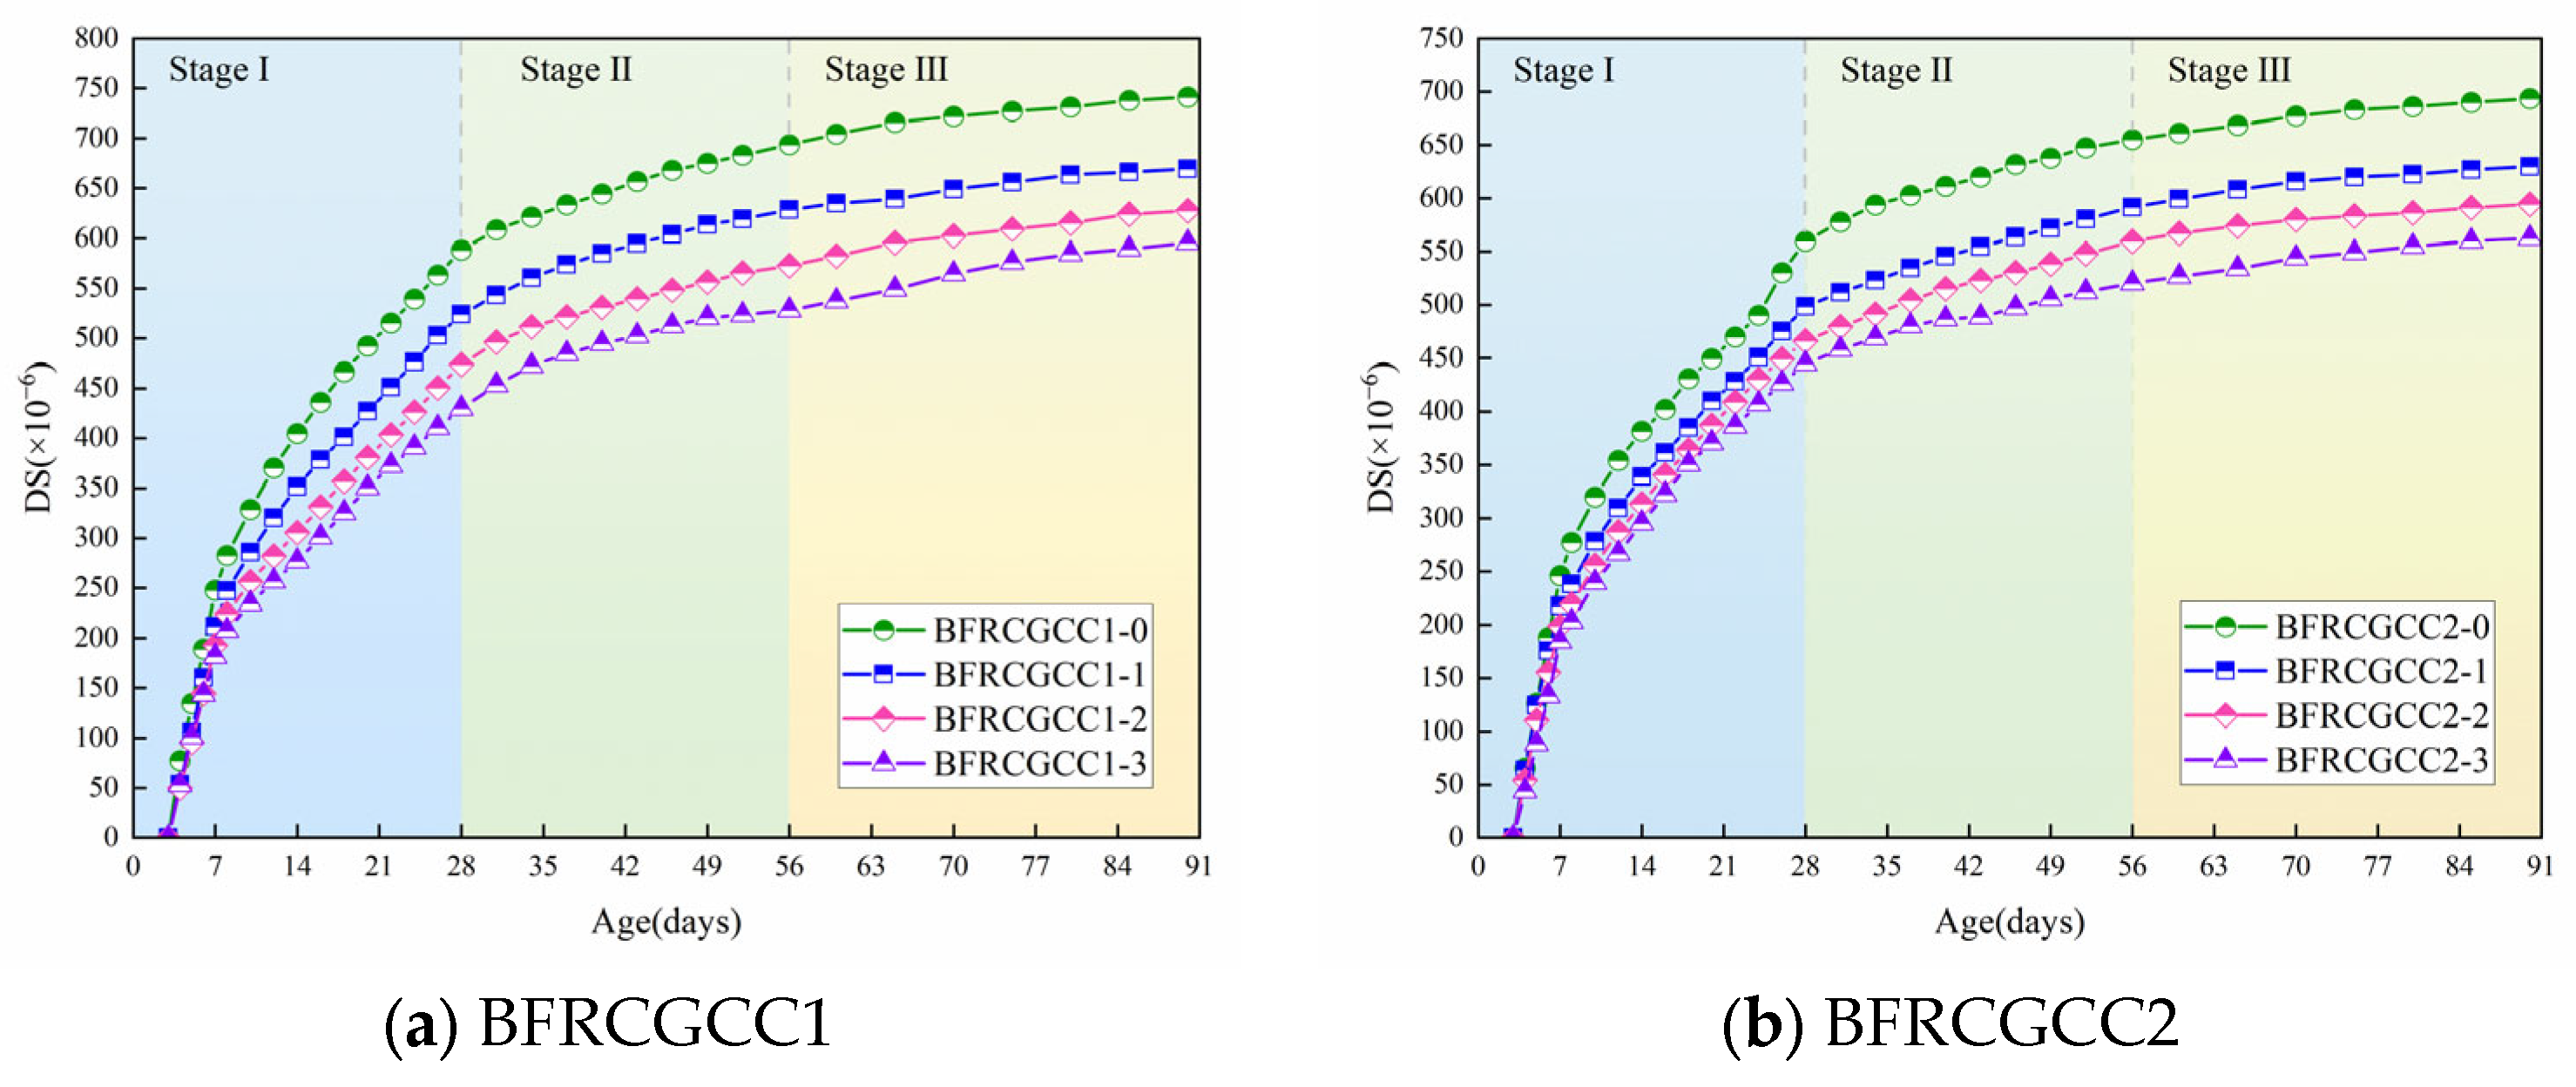
The variation in the DS of different samples with age is demonstrated in Figure 8.
From Figure 8, it can be seen that the DS of BFRCGCC increased rapidly at the early times and gradually slowed down in the later ages. The development of DS can be divided into three stages: Stage I (rapid growth phase), Stage II (relatively slow growth phase), and Stage III (slow growth phase). Take BFRCGCC1-1 as an example: the DS of the matrix was 523.75 × 10⁻⁶ at the age of 28 d and the average growth rate was 20.95 × 10⁻⁶/d (Stage I); during the age of 28–56 d, the DS of the specimens was 104.73 × 10⁻⁶ and the average growth rate decreased to 3.74 × 10⁻⁶/d (Stage II); during the age of 56–90 d, the value of the DS was only 41.04 × 10⁻⁶ and the average growth rate was only 1.21 × 10⁻⁶/d (Stage III).
The incorporation of basalt fibers can significantly affect the DS of the CGCC. Take the values of 28 d, 56 d, and 90 d as an example: to verify the impact of fiber reinforcement on DS of CGCC, the variation in DS was given (the values of CGCC without fiber reinforcement set as 1.0), as presented in Figure 9.
From Figure 9, we can see that the values of the DS of the matrix decreased with the increment of fiber dosage. Fiber incorporation leads to improvement in the tensile strength of the concrete matrix, which helps to physically limit shrinkage [48]. The shrinkage-induced interfacial stress at the fiber–matrix interface was transferred through the interconnected fiber network, enabling effective stress distribution and resulting in reduced matrix shrinkage deformation [50,51]. Additionally, the fibers formed an irregular spatial structure inside the matrix [52]; the fibers condensed and hardened with the surrounding grout, forming a barrier in the pores. In this way, the maximum pore size may be effectively reduced [44,53], and the number of harmful voids was further reduced, thereby the DS of CGCC was reduced significantly [54].

3.4. Electrical Resistivity

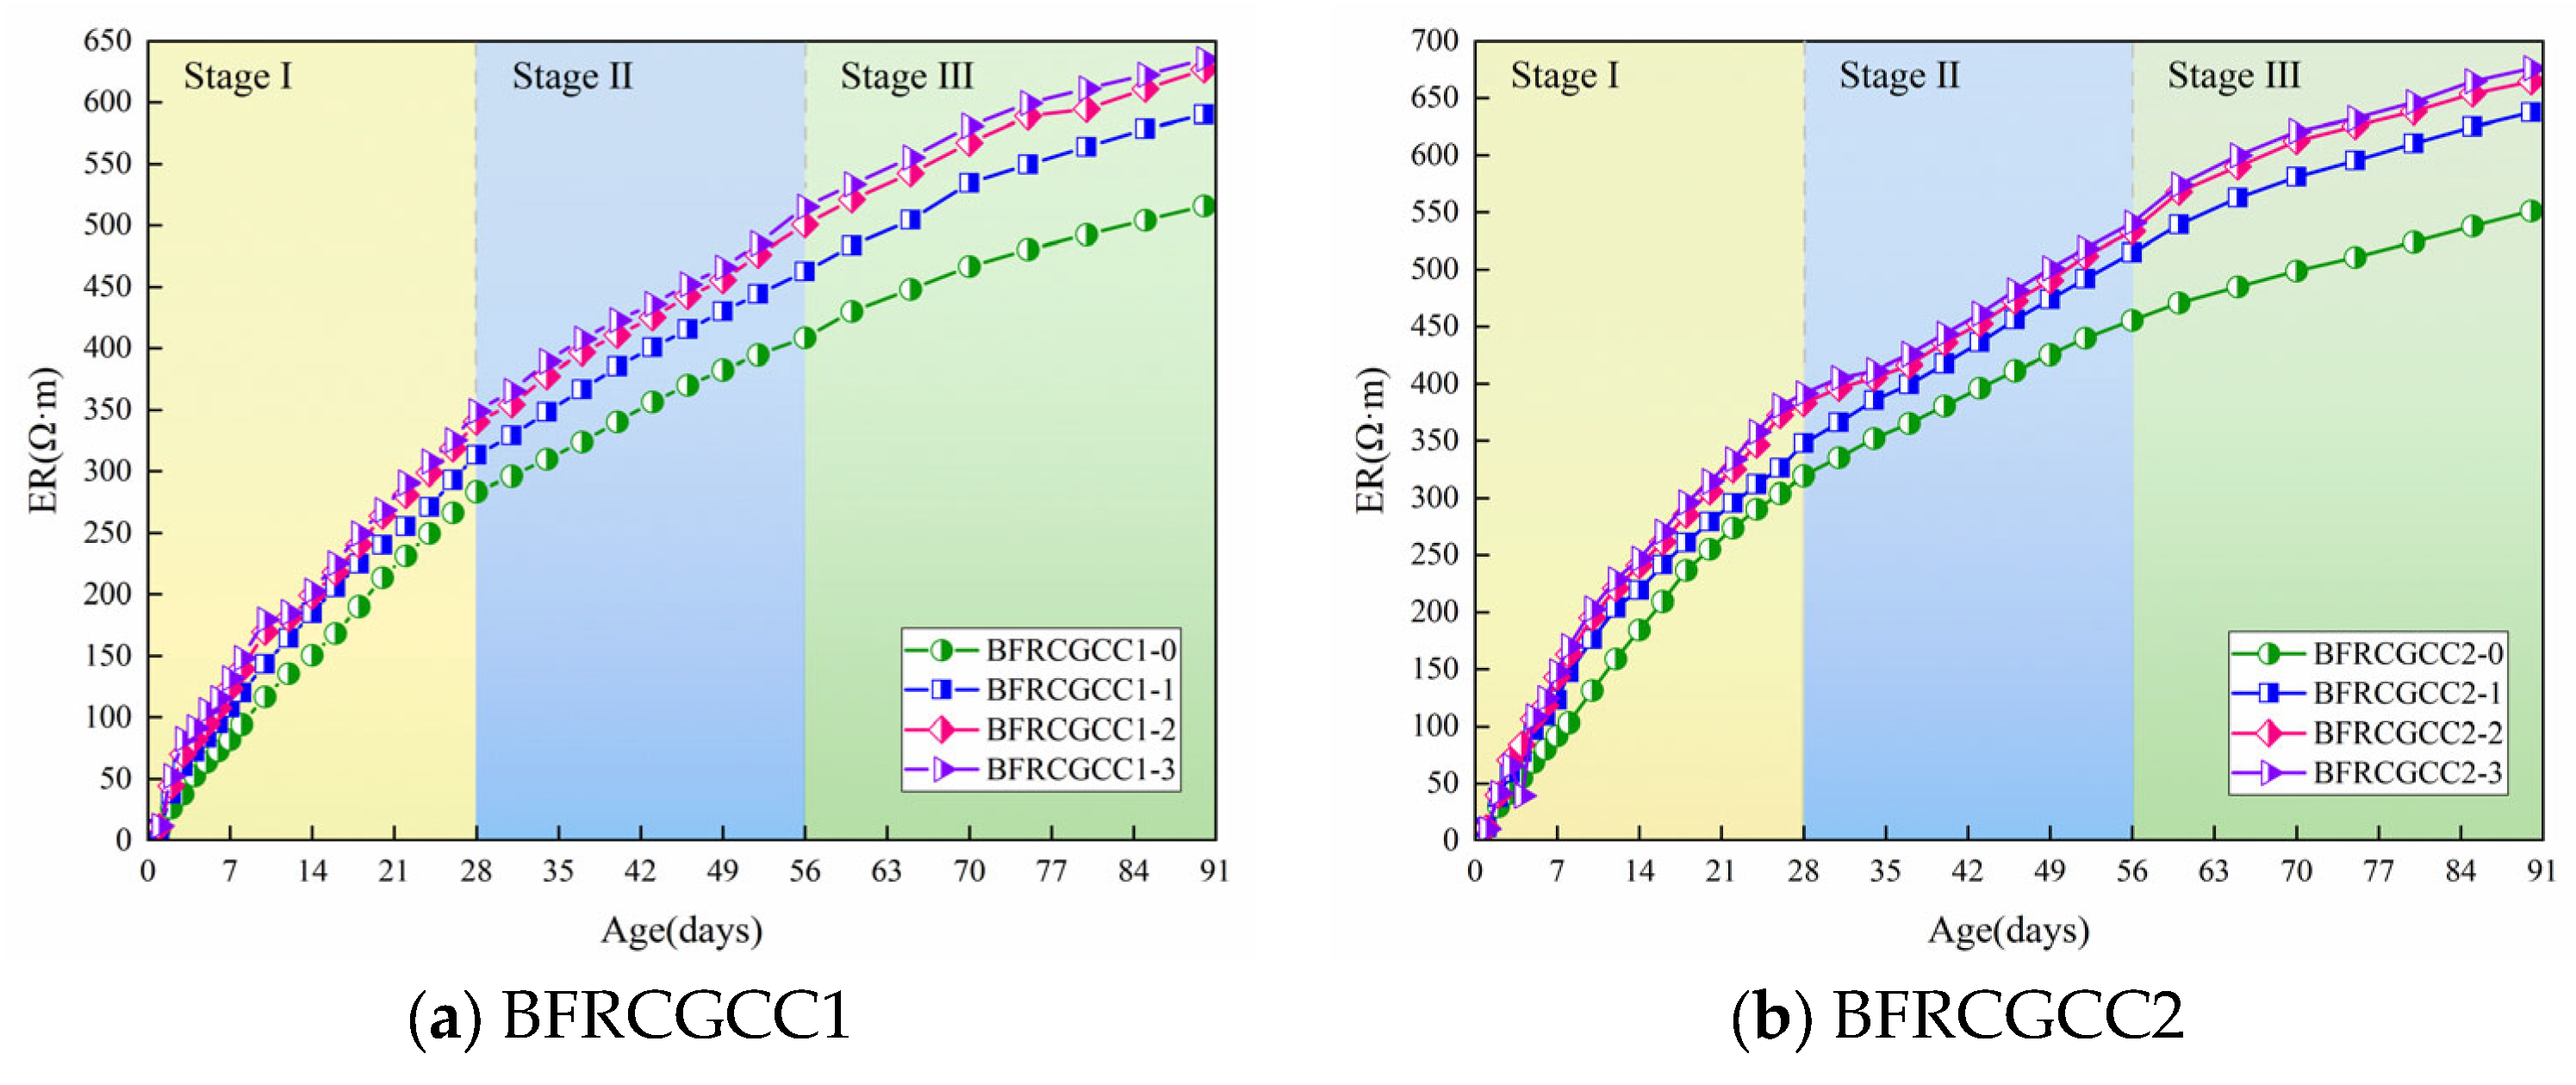
The ER of CGCC under varying basalt fiber incorporation levels is demonstrated in Figure 10.
From Figure 10, at the initial stage, the ER increased rapidly, and then the growth rate gradually slowed down. Take the BFRCGCC1-0 as an example: 0~28 d, the average growth rate was 10.13 Ω·m/d (Stage I); 28~56 d, the average growth rate was 4.46 Ω·m/d (Stage II); 56~90 d, the average growth rate was only 3.16 Ω·m/d (Stage III). The reason may be abundant free water in the fresh CGCC mixture; the grout with rich liquid-phase conductive ions had a large degree of freedom, resulting in a very low initial ER [55,56]. The hydration of the cement, coupled with moisture evaporation, drove rapid internal water depletion within the specimens, and then the strength of the matrix progressively enhanced as hydration products accumulated, and the flow ability of the liquid-phase conductive ions was decreased, and the ER was enhanced gradually [57,58,59].
As evidenced by the data, the ER of CGCC progressively diminished, corresponding to the rise in water–cement ratio. Compared with BFRCGCC1-0, the ER of BFRCGCC2-0 increased by 12.64%. An increment of water–cement ratio caused more continuous capillaries to appear in the cement paste, thereby reducing the ER [60]. The ER of CGCC exhibited a progressive enhancement with higher fiber dosage. This phenomenon may be attributed to that with the addition of the fibers, on the one hand, the non-conductive phase in the matrix increased; on the other hand, a higher fiber dosage reduces the number of harmful pores and increases the compactness of the concrete matrix, thereby enhancing the ER of the matrix [61].

4. Prediction Models

4.1. Prediction Model for Internal Humidity

A model of the relationship between IH and age of concrete without fiber is presented in Equation (5) [29].
H t , 0 = 100 a t b
where H(t,0) is the IH of the matrix (%), 0 means the matrix without any fiber reinforcement; t is the test age (d); a, b are the parameters obtained by regression analysis.
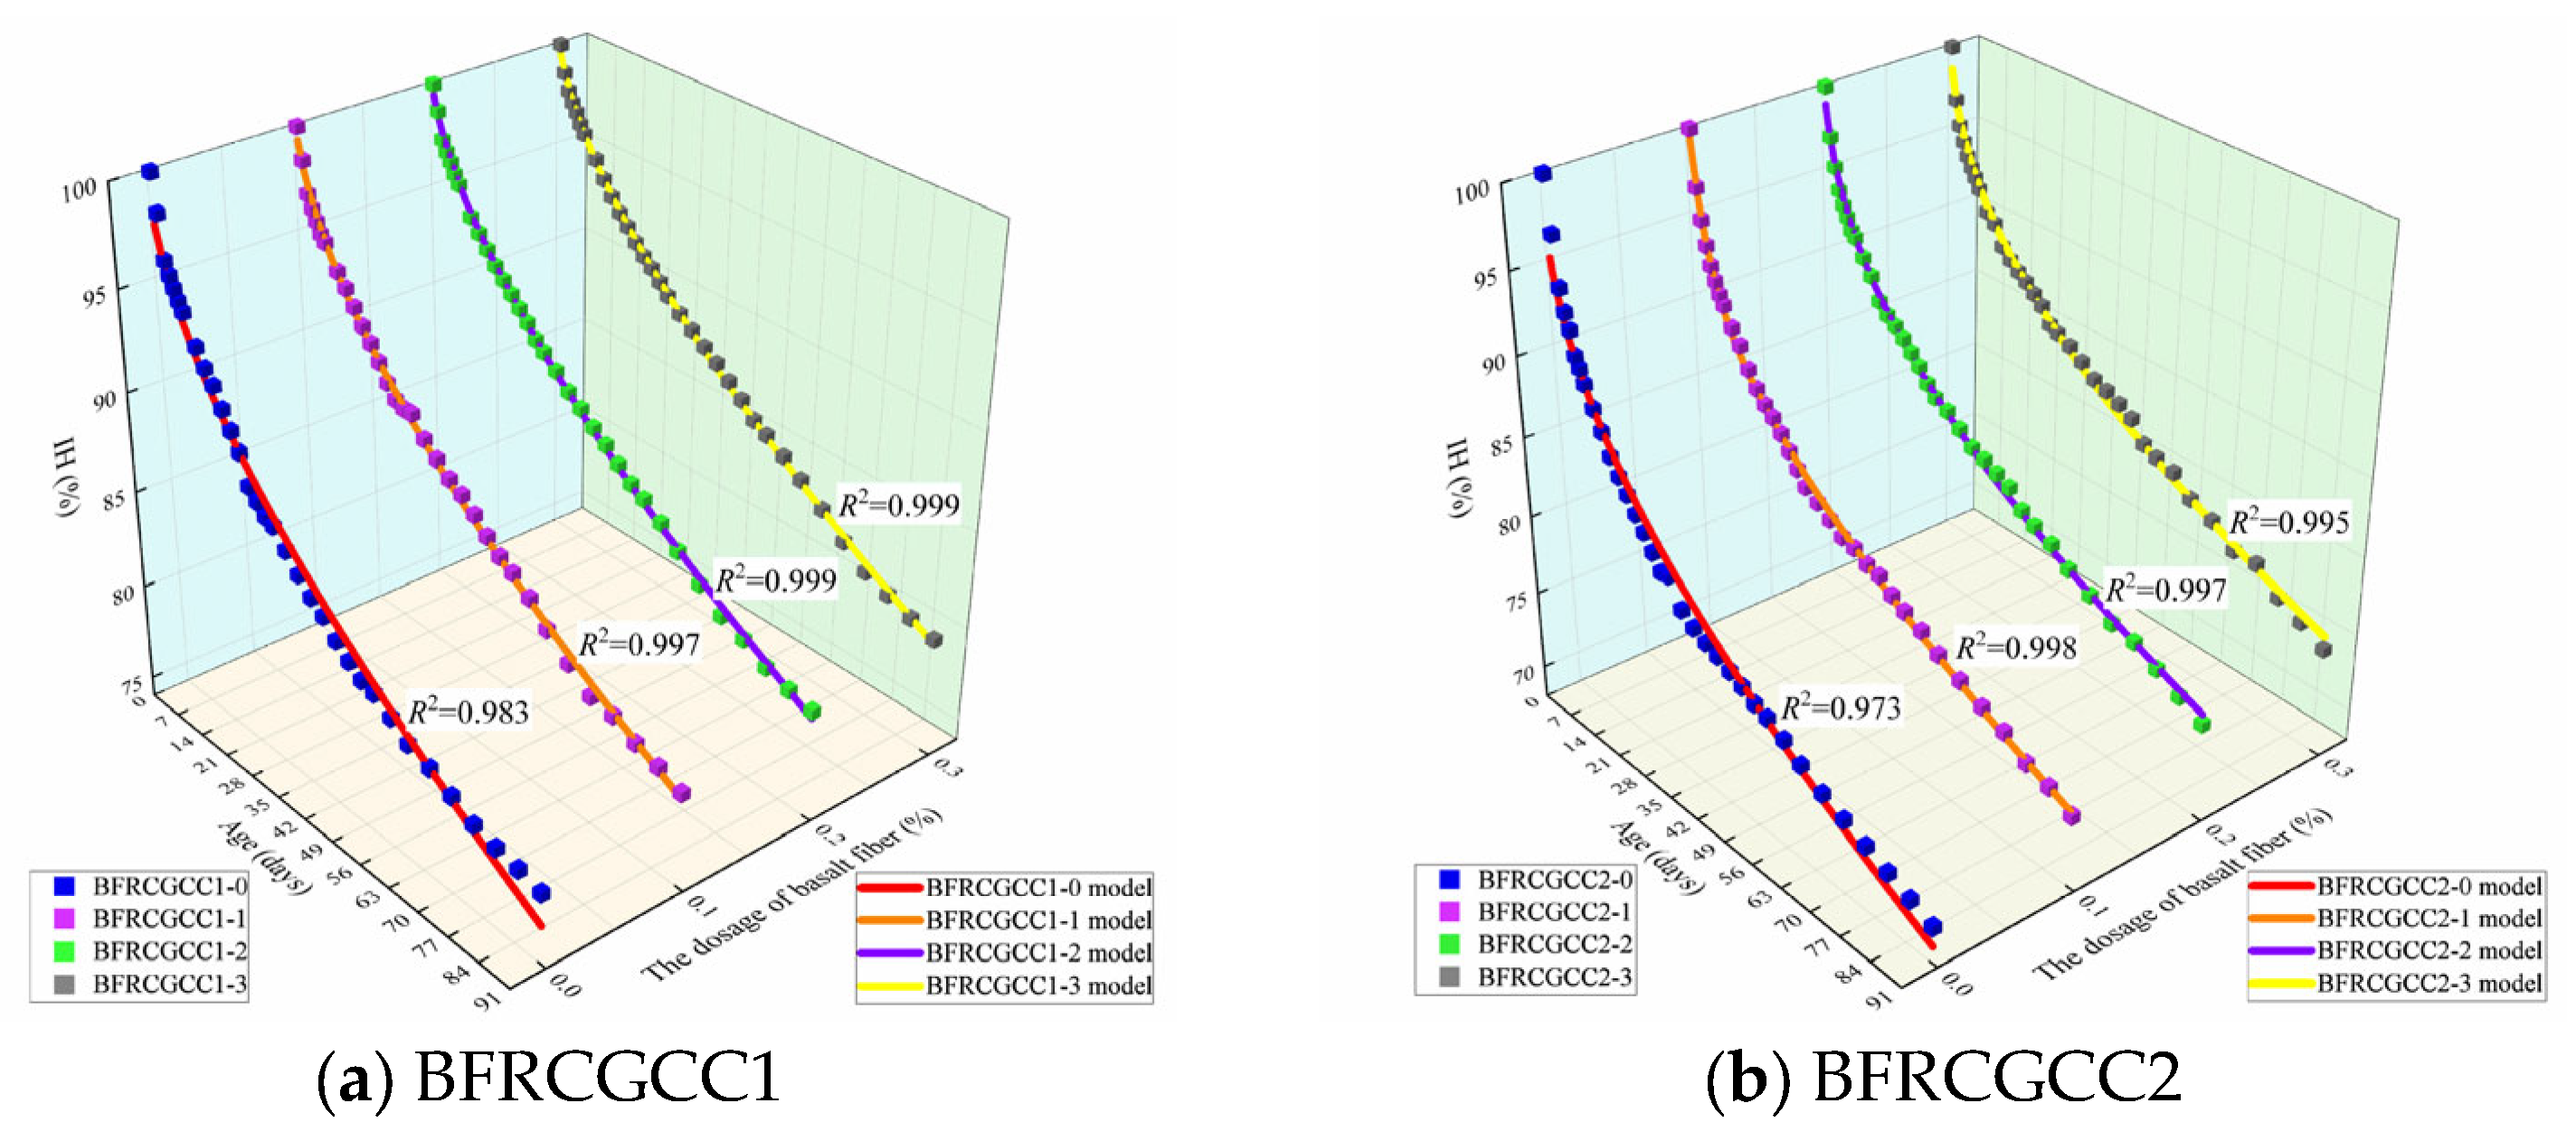
The variations in the IH of BFRCGCC1-0 and BFRCGCC2-0 with age may be verified by this model, and the regression analysis results have been tabulated in Table 7.
From Table 7, we can see that the values of R2 of the specimens are larger than 0.950, which means that the IH of coal gangue ceramsite concrete can be determined using Equation (5). The variation in the IH with the increase in fiber dosage is illustrated in Figure 11.
From Figure 11, it can be seen that the relationship between the IH of the matrix and the fiber dosage was nonlinear. The influence of the fiber dosage on the variation in the IH of the concrete can be considered by Equation (6) [28]:
H t , ω = K t ω + H t , 0
where H(t, ω) is the IH of CGCC with different basalt fiber dosage (%); Kt is the time impact coefficient; ω is the fiber dosage (kg/m3).
The IH of the samples corresponding to the 3 d, 7 d, 14 d, 28 d, 56 d, and 90 d were adopted, and the values of Kt can be obtained through the nonlinear fitting, and the results are listed in Table 8.
From Table 8, we can see that the values of R2 of eight groups were larger than 0.900, and only four groups of the R2 values were between 0.900 and 0.850. This validated that the fiber influence on the IH of the matrix followed the relationship indicated by Equation (6).
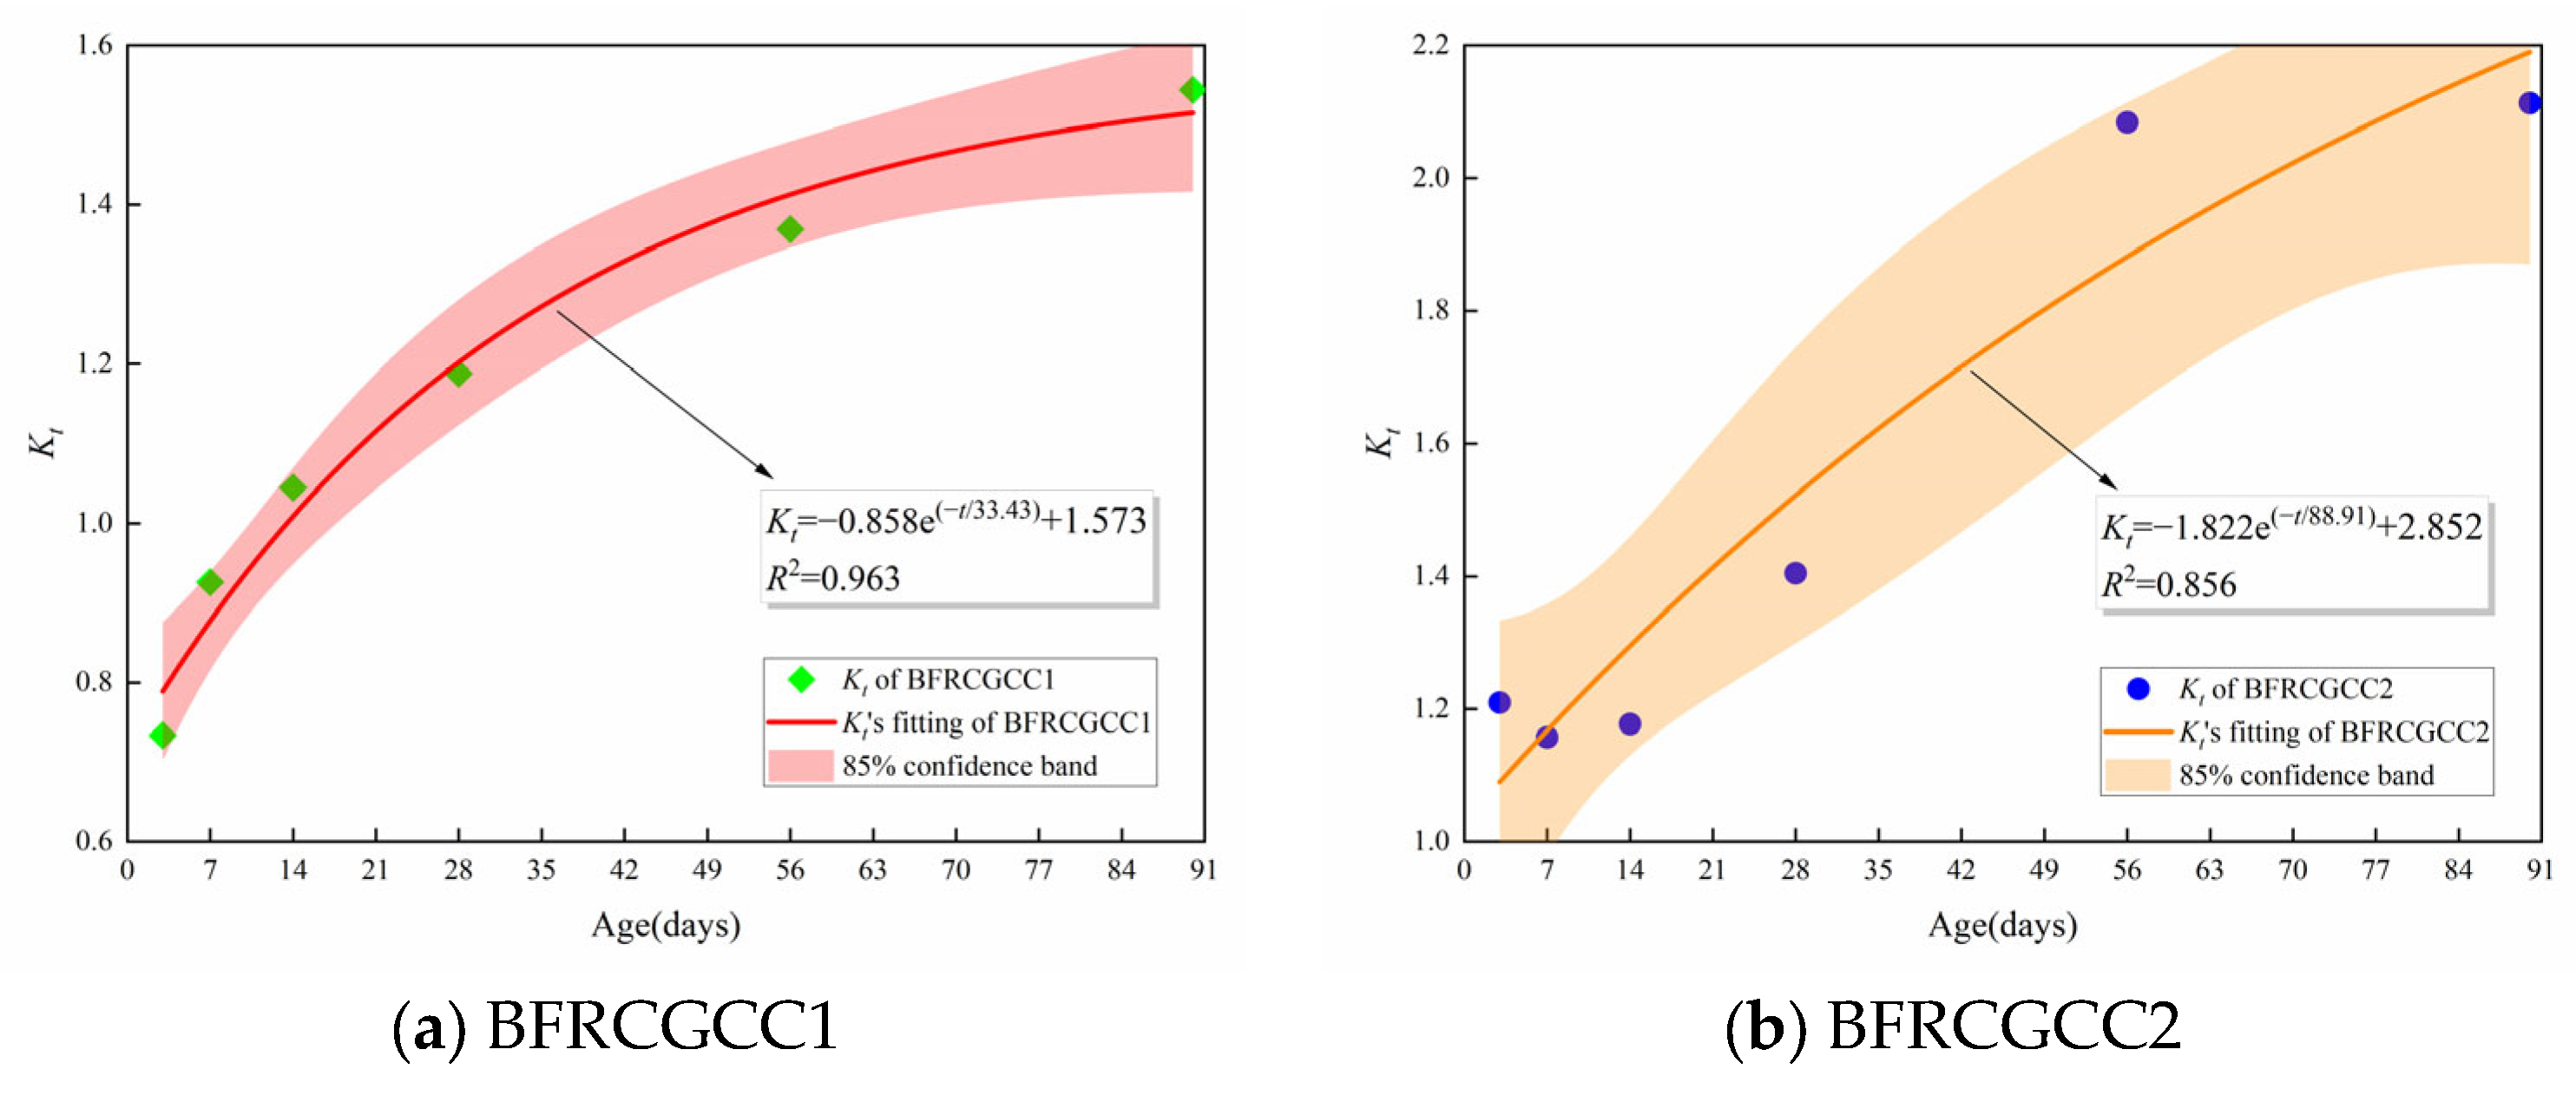
The correlation between the time influence coefficient Kt and age for CGCC specimens with varying water–cement ratios is shown in Figure 12.
From Figure 12, it can be seen that the value of Kt increased with the increment of age. The phenomenon proved that basalt fiber addition can effectively slow down the reduction in the IH values of the matrix. The time influence coefficient Kt reflected the effect of the IH attenuation trend with age. The correlation between Kt and curing duration can be described by Equation (7):
K t = α × e x p ( t / β ) + γ
where α, β, and γ are the parameters obtained by regression analysis.
Substituting Equation (7) into Equation (6), the equation regarding the fiber influence can be obtained as presented in Equation (8):
H t , ω = ω α × e x p ( t / β ) + γ + H t , 0
The prediction values and the test values of the IH of BFRCGCC are presented in Figure 13, and the prediction results of RMSE and MAPE are displayed in Table 9.
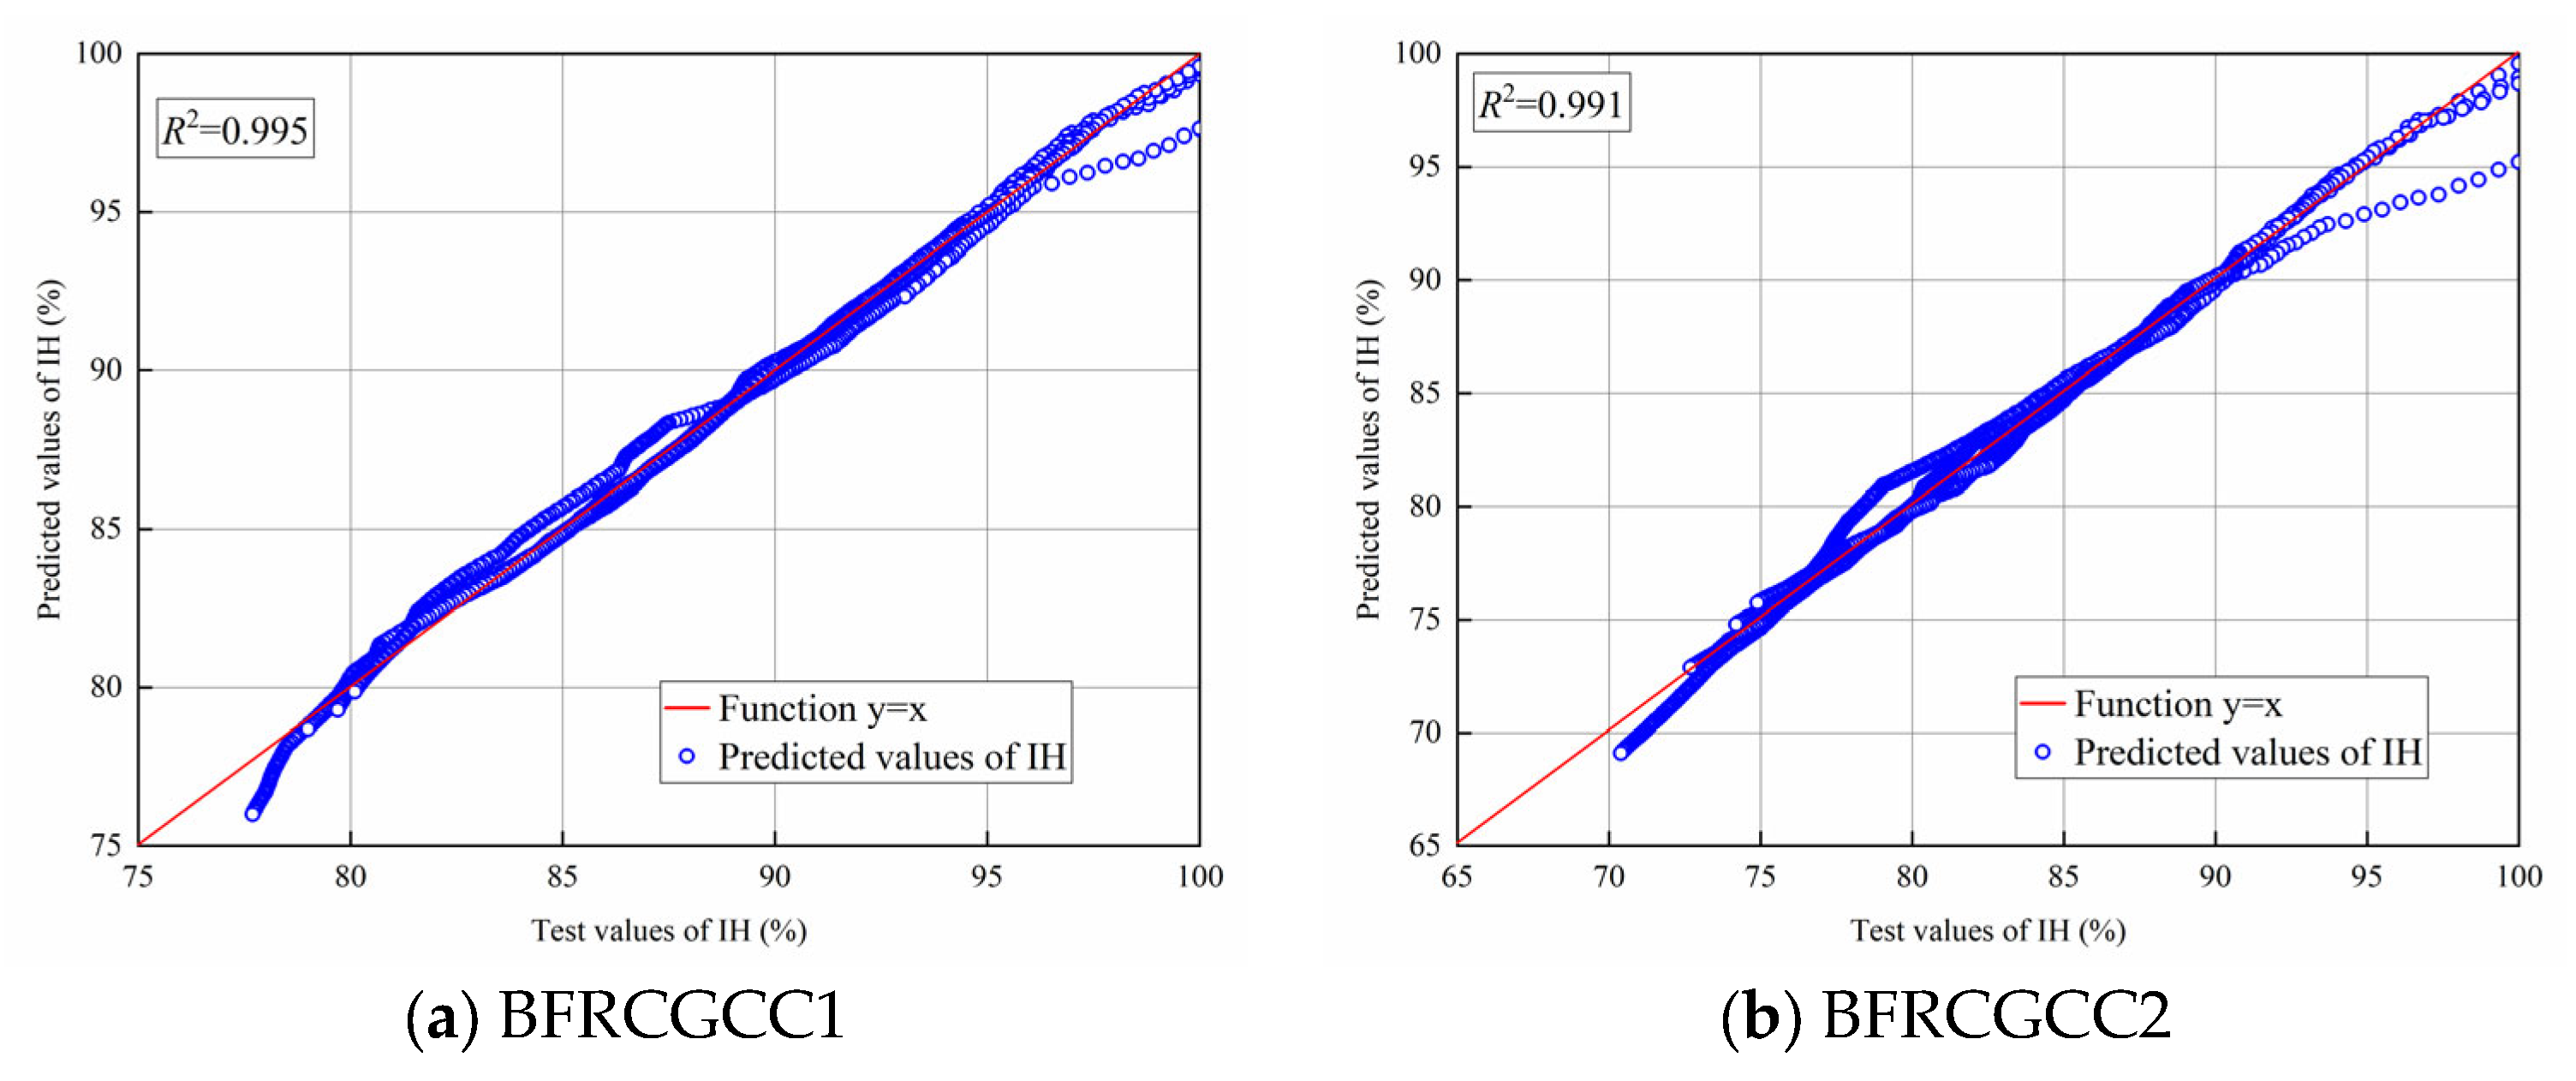
The data from Figure 13 and Table 9 illustrated that there was a strong correlation between the predicted values and experimental values. Further analysis of correlations was performed through linear regression. The comparison between the test results and the predicted values is presented in Figure 14.
From Figure 14, we can see that the correlations between the test values and predicted values were larger than 0.990. The revised prediction model can be effectively employed to verify the variation in the IH of the BFRCGCC.

4.2. Prediction Model for Drying Shrinkage

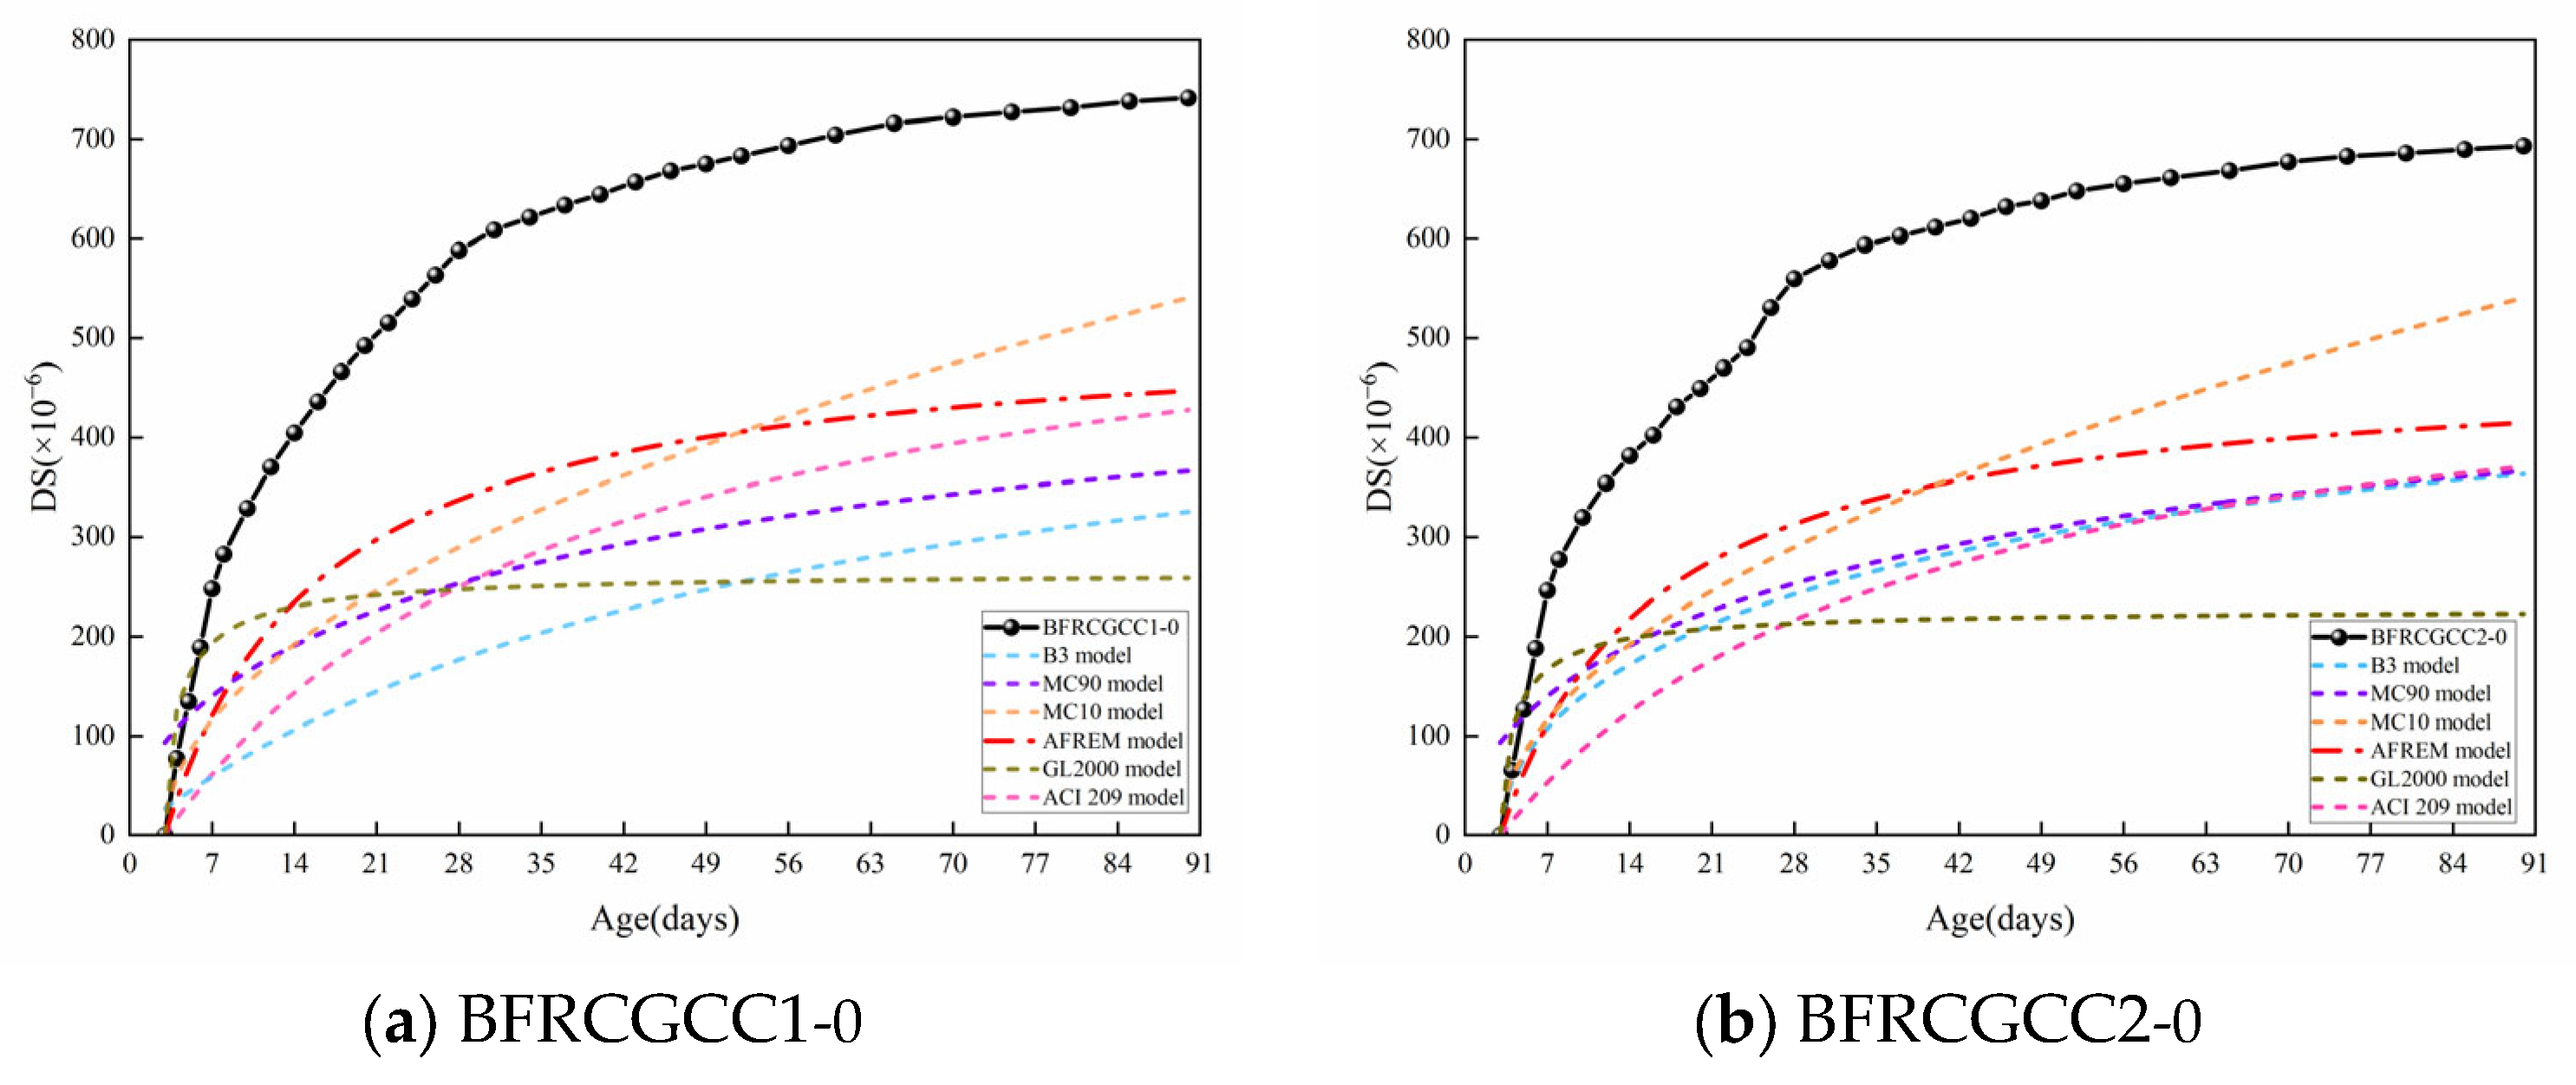
Several predictive models have been established to estimate the DS of conventional aggregate concrete, such as the B3 model, CEB-FIP model (Model Code 90, Model Code 2010), AFREM model, ACI209.2R model, and GL2000 model [62,63,64,65,66]. Take the DS of the BFRCGCC1-0 and BFRCGCC2-0 as examples. The comparison between the predicted values by the models and the test values is shown in Figure 15. Existing studies had shown that the size of the test block reflected the moisture transport rate within concrete, serving as a critical element influencing shrinkage development [67]. Unlike conventional concrete, CGCC exhibits moisture migration both within the matrix and from the aggregates to the matrix. This dual moisture transfer makes the specimen size effect particularly critical in developing its DS prediction models. As mentioned in reference [68], the AFREM model considered the size of the components and the influence of age development on DS. Among the models, the AFREM model was frequently introduced to verify the DS of the concrete with recycled aggregates and lightweight aggregates [69,70,71].
The expression of the AFREM model [68]:
ε ds t , t s = β ds t , t s ε ds 0
β ds t , t s = ( t t s ) / β d s h 2 + ( t t s )
β ds = 0.007 0.021   with   silicon   fume   additon without   silicon   fume   additon
ε ds 0 = K f cm × A f cm , R H ambient × B × 1 0 6
K f cm = 18 30 0.21 f cm   f cm 57   MPa f cm > 57   MPa
A f cm , R H ambient = 72 e x p ( 0.046 f c m ) + 75 R H ambient
where εds(t, ts) is the DS of the matrix; βds (t, ts) is the development coefficient of DS over time; εds0 is the final DS; t is the age at the moment considered; ts is the age at the beginning of DS; h is the cross-section size of the sample, h = Ac/u, Ac means the cross-sectional area of the samples, u means the perimeter of the cross-section; K(fcm) is a coefficient depending on the strength and humidity diffusion rate of the matrix; A(fcm, RHambient) is the autogenously shrinkage due to the hydration; fcm is the strength of the concrete; RHambient is the relative humidity of the environment; B is the coefficient regarding to the effect of fly ash and slag.
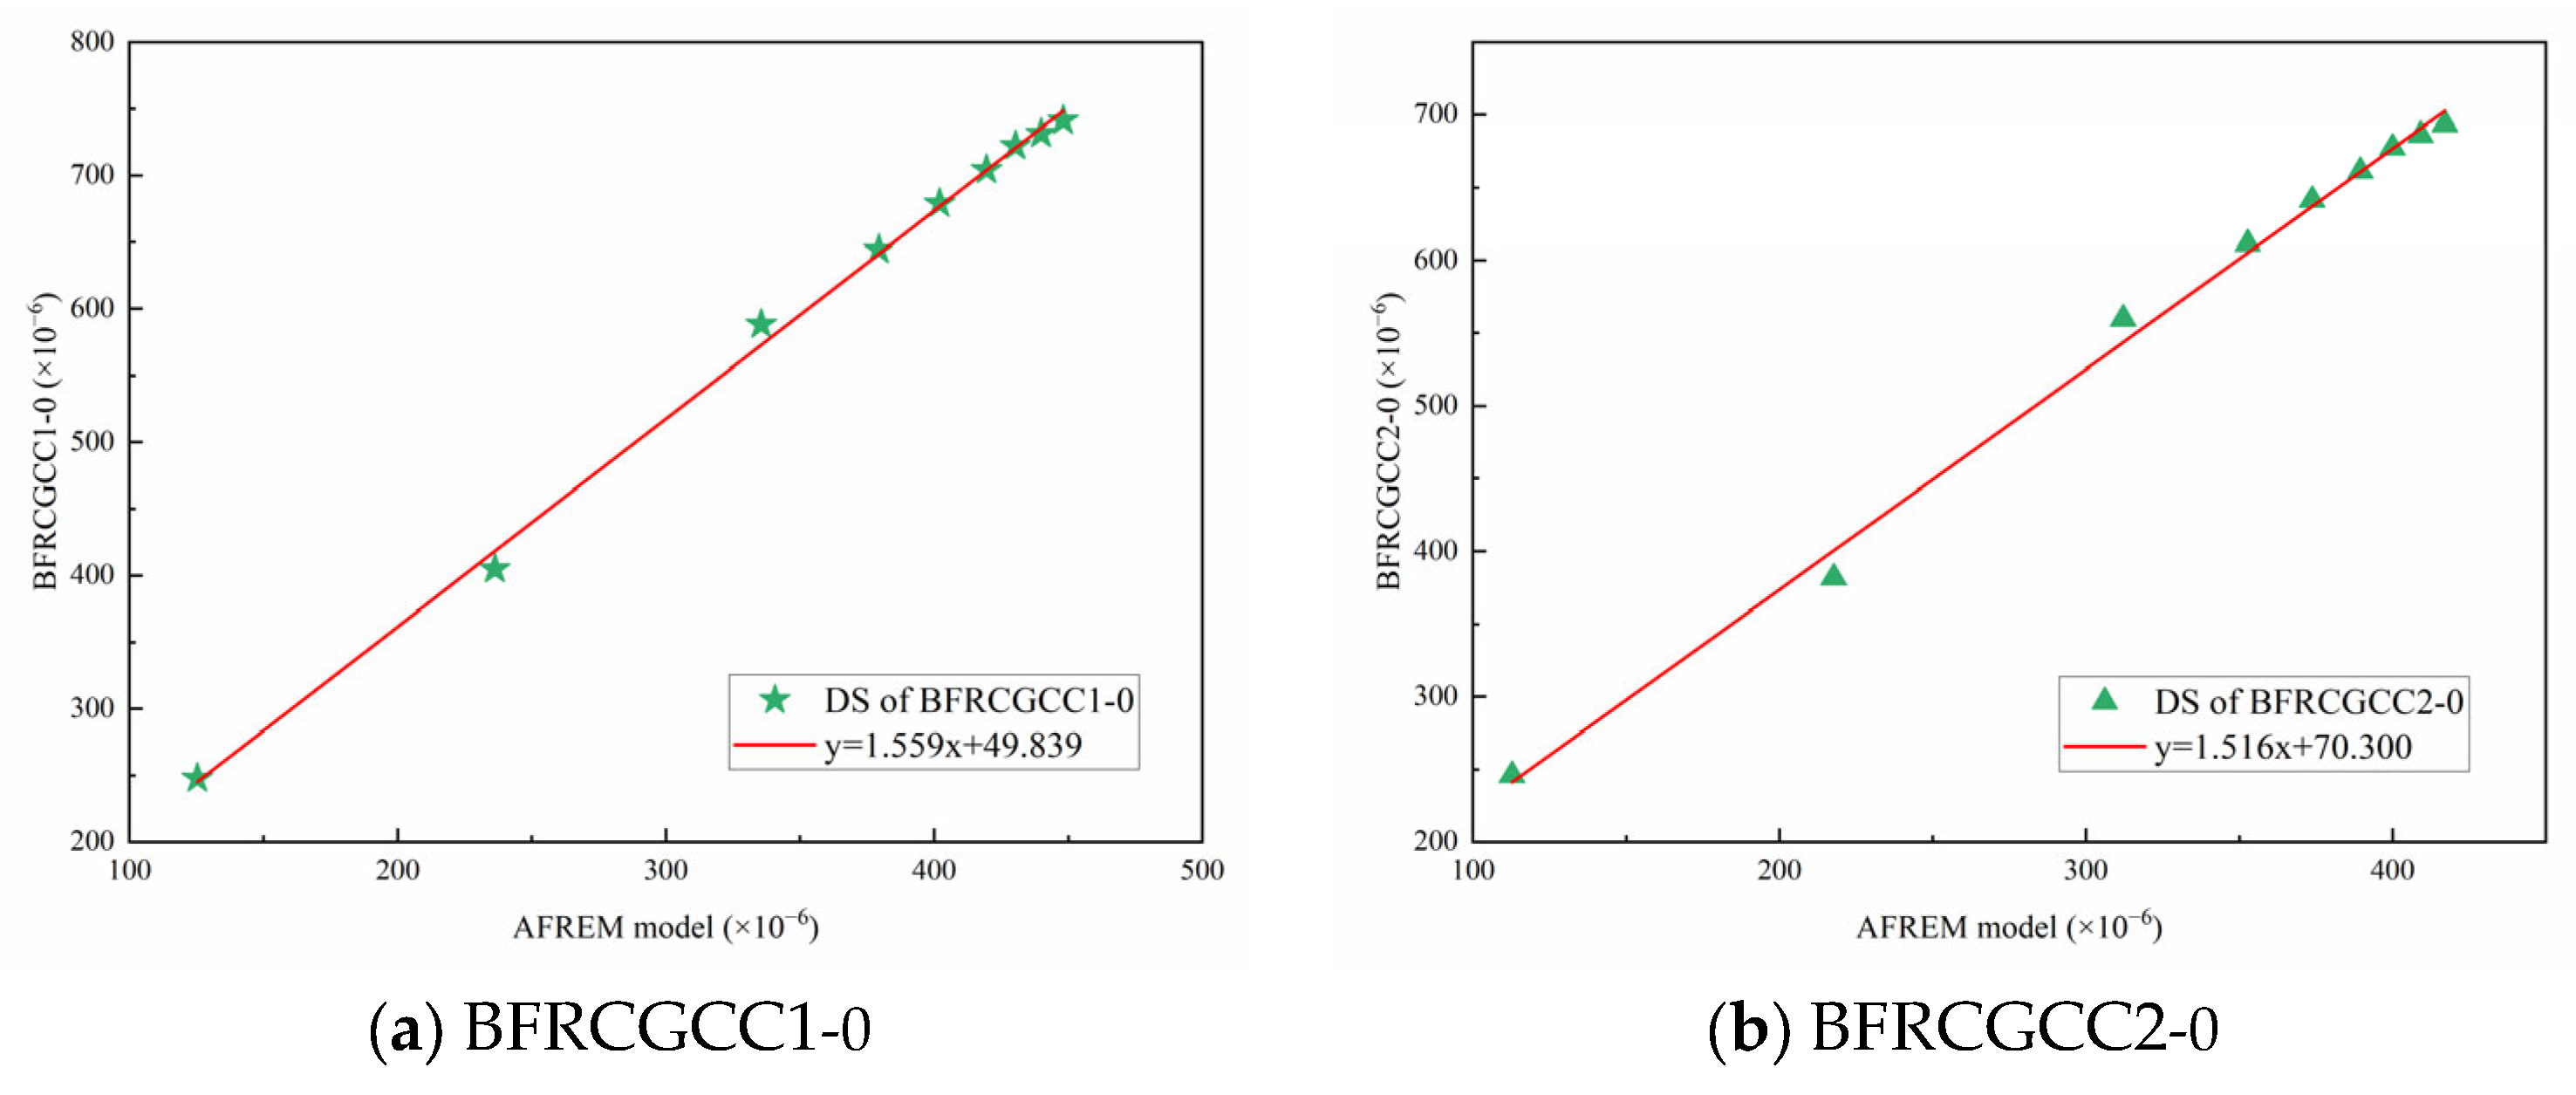
From Figure 15, we can see that all the predicted values were smaller than the experimental values. The existing predictive models for the traditional aggregates concrete cannot be directly applied to the CGCC. Through the predicted results, the variation in the values predicted by the AFREM model was similar to the variation in the test values. The relationship between the test values and predicted DS values of 7, 14, 28, 40, 50, 60, 70, 80, and 90 d is presented in Figure 16.
From Figure 16, it can be seen that there was a linear correlation between experimental and predicted values of DS; therefore, the AFREM model was adopted, and a magnification correction factor MCG was introduced to modify the model. The improved AFREM model was presented in Equation (15). The comparison of the test values and the predicted values by the revised model was also presented in Figure 17.
ε ds 0 = M CG × K f cm × A f cm , R H ambient × 1 0 6
where MCG is the coefficient of coal gangue ceramsite.
From Figure 17, we can see that the R2 values of the two types of specimens were 0.974; this means that the revised AFREM model can be used to predict the DS of the CGCC.
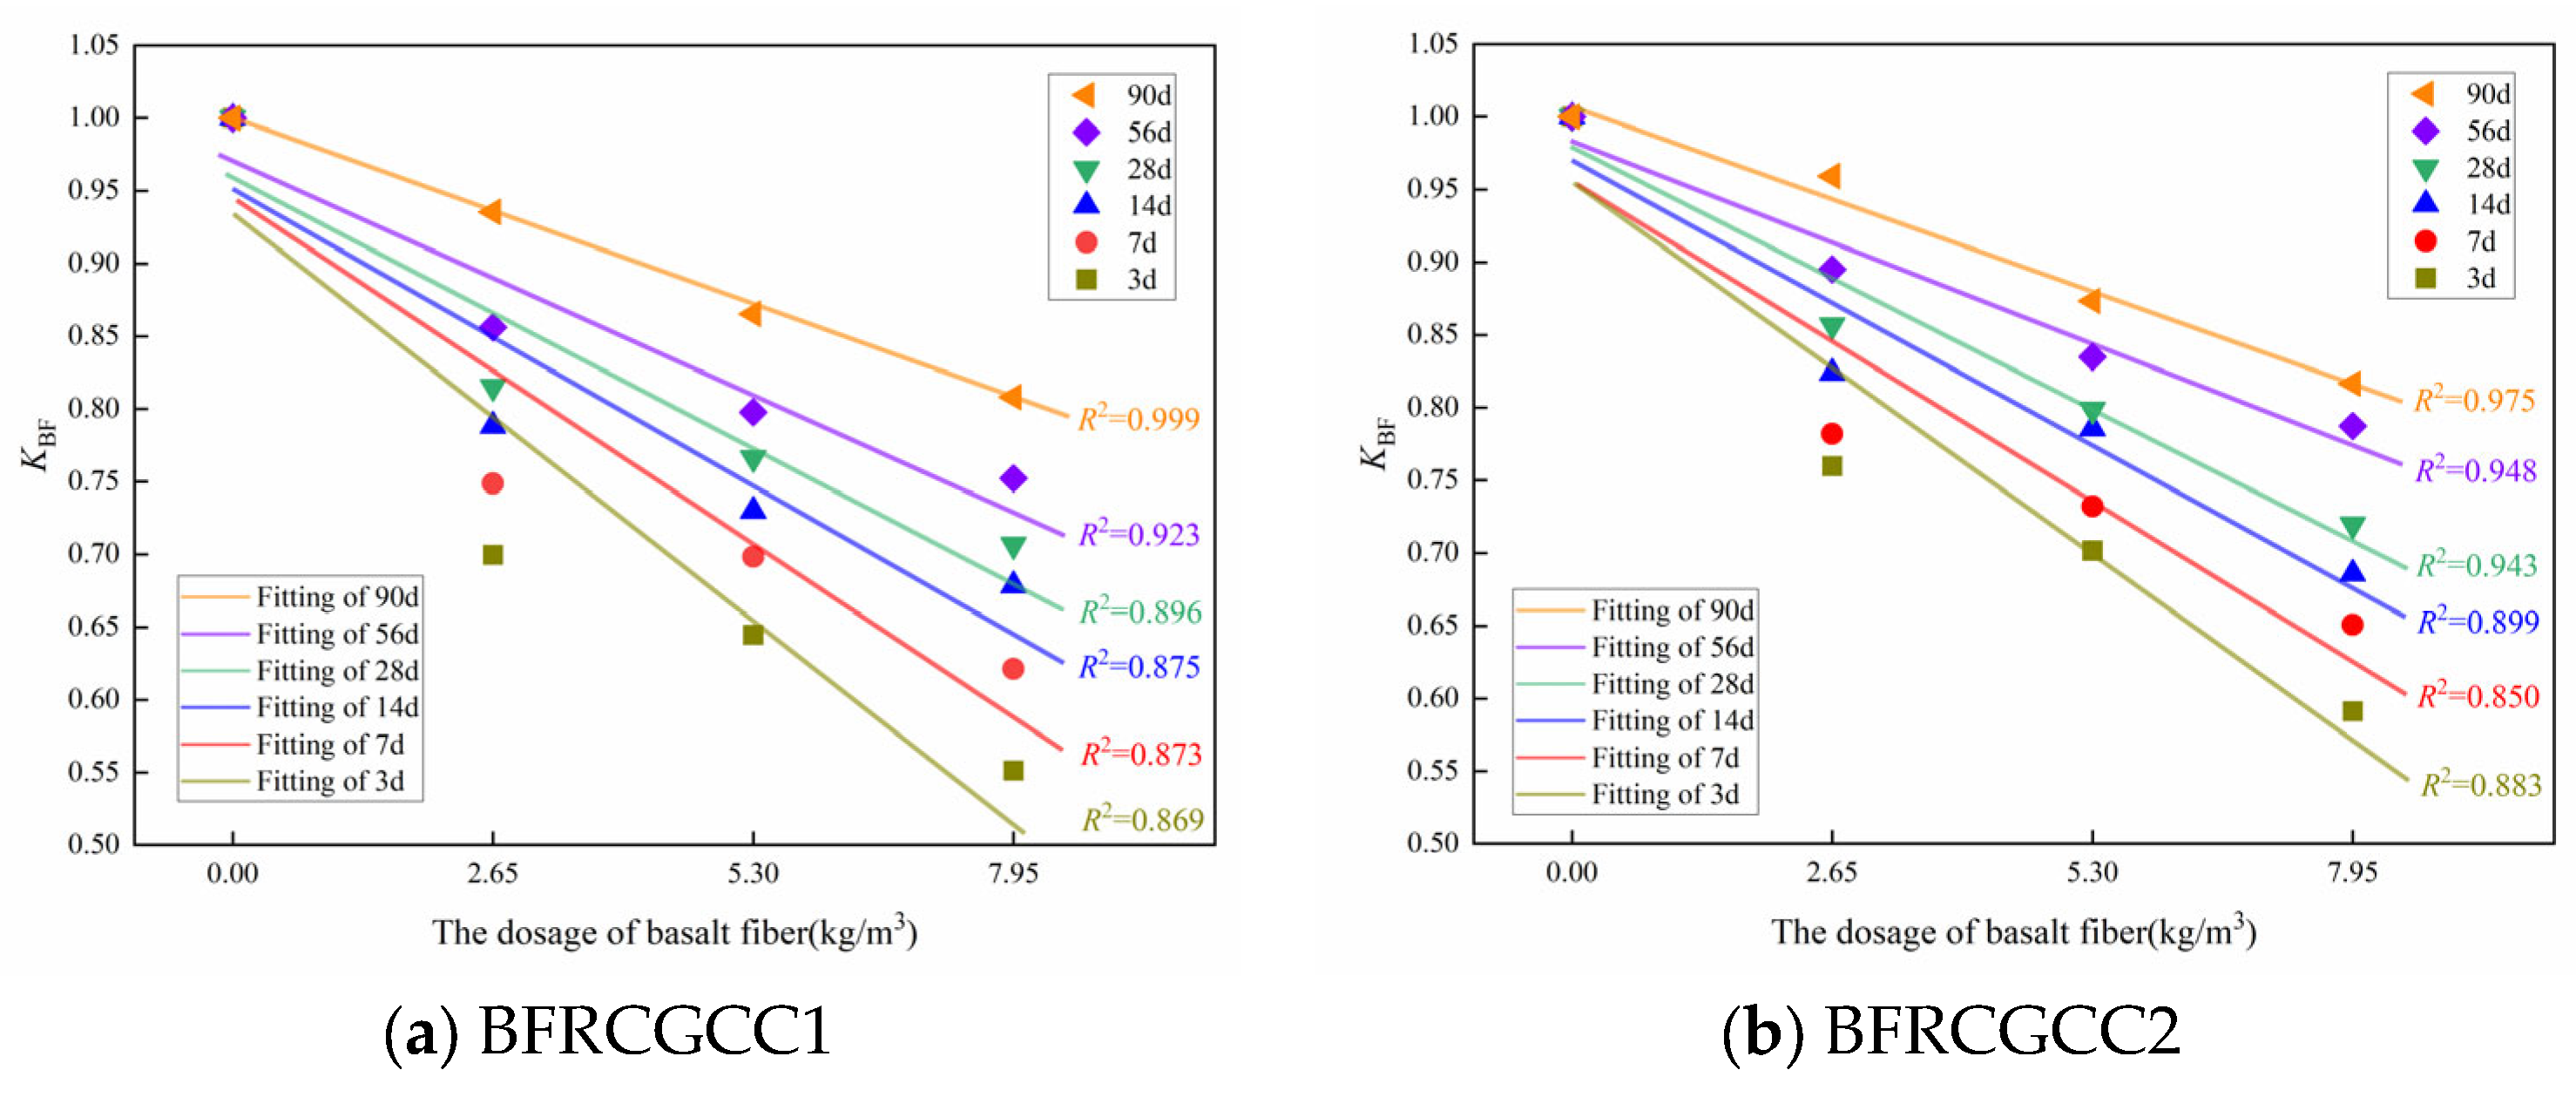
The DS of the CGCC was reduced with the basalt fiber addition. Therefore, an impact factor KBF was introduced to Equation (15) [72]. The relationship between the impact factor KBF and the basalt fiber dosage is presented in Figure 18.
From Figure 18, we can see that KBF decreased with the increment of age and fiber dosage, and a linear relationship was adopted:
K BF = λ t ω + P t
where λt is the coefficient of basalt fiber dosage; ω is the fiber dosage; Pt is the coefficient of age.
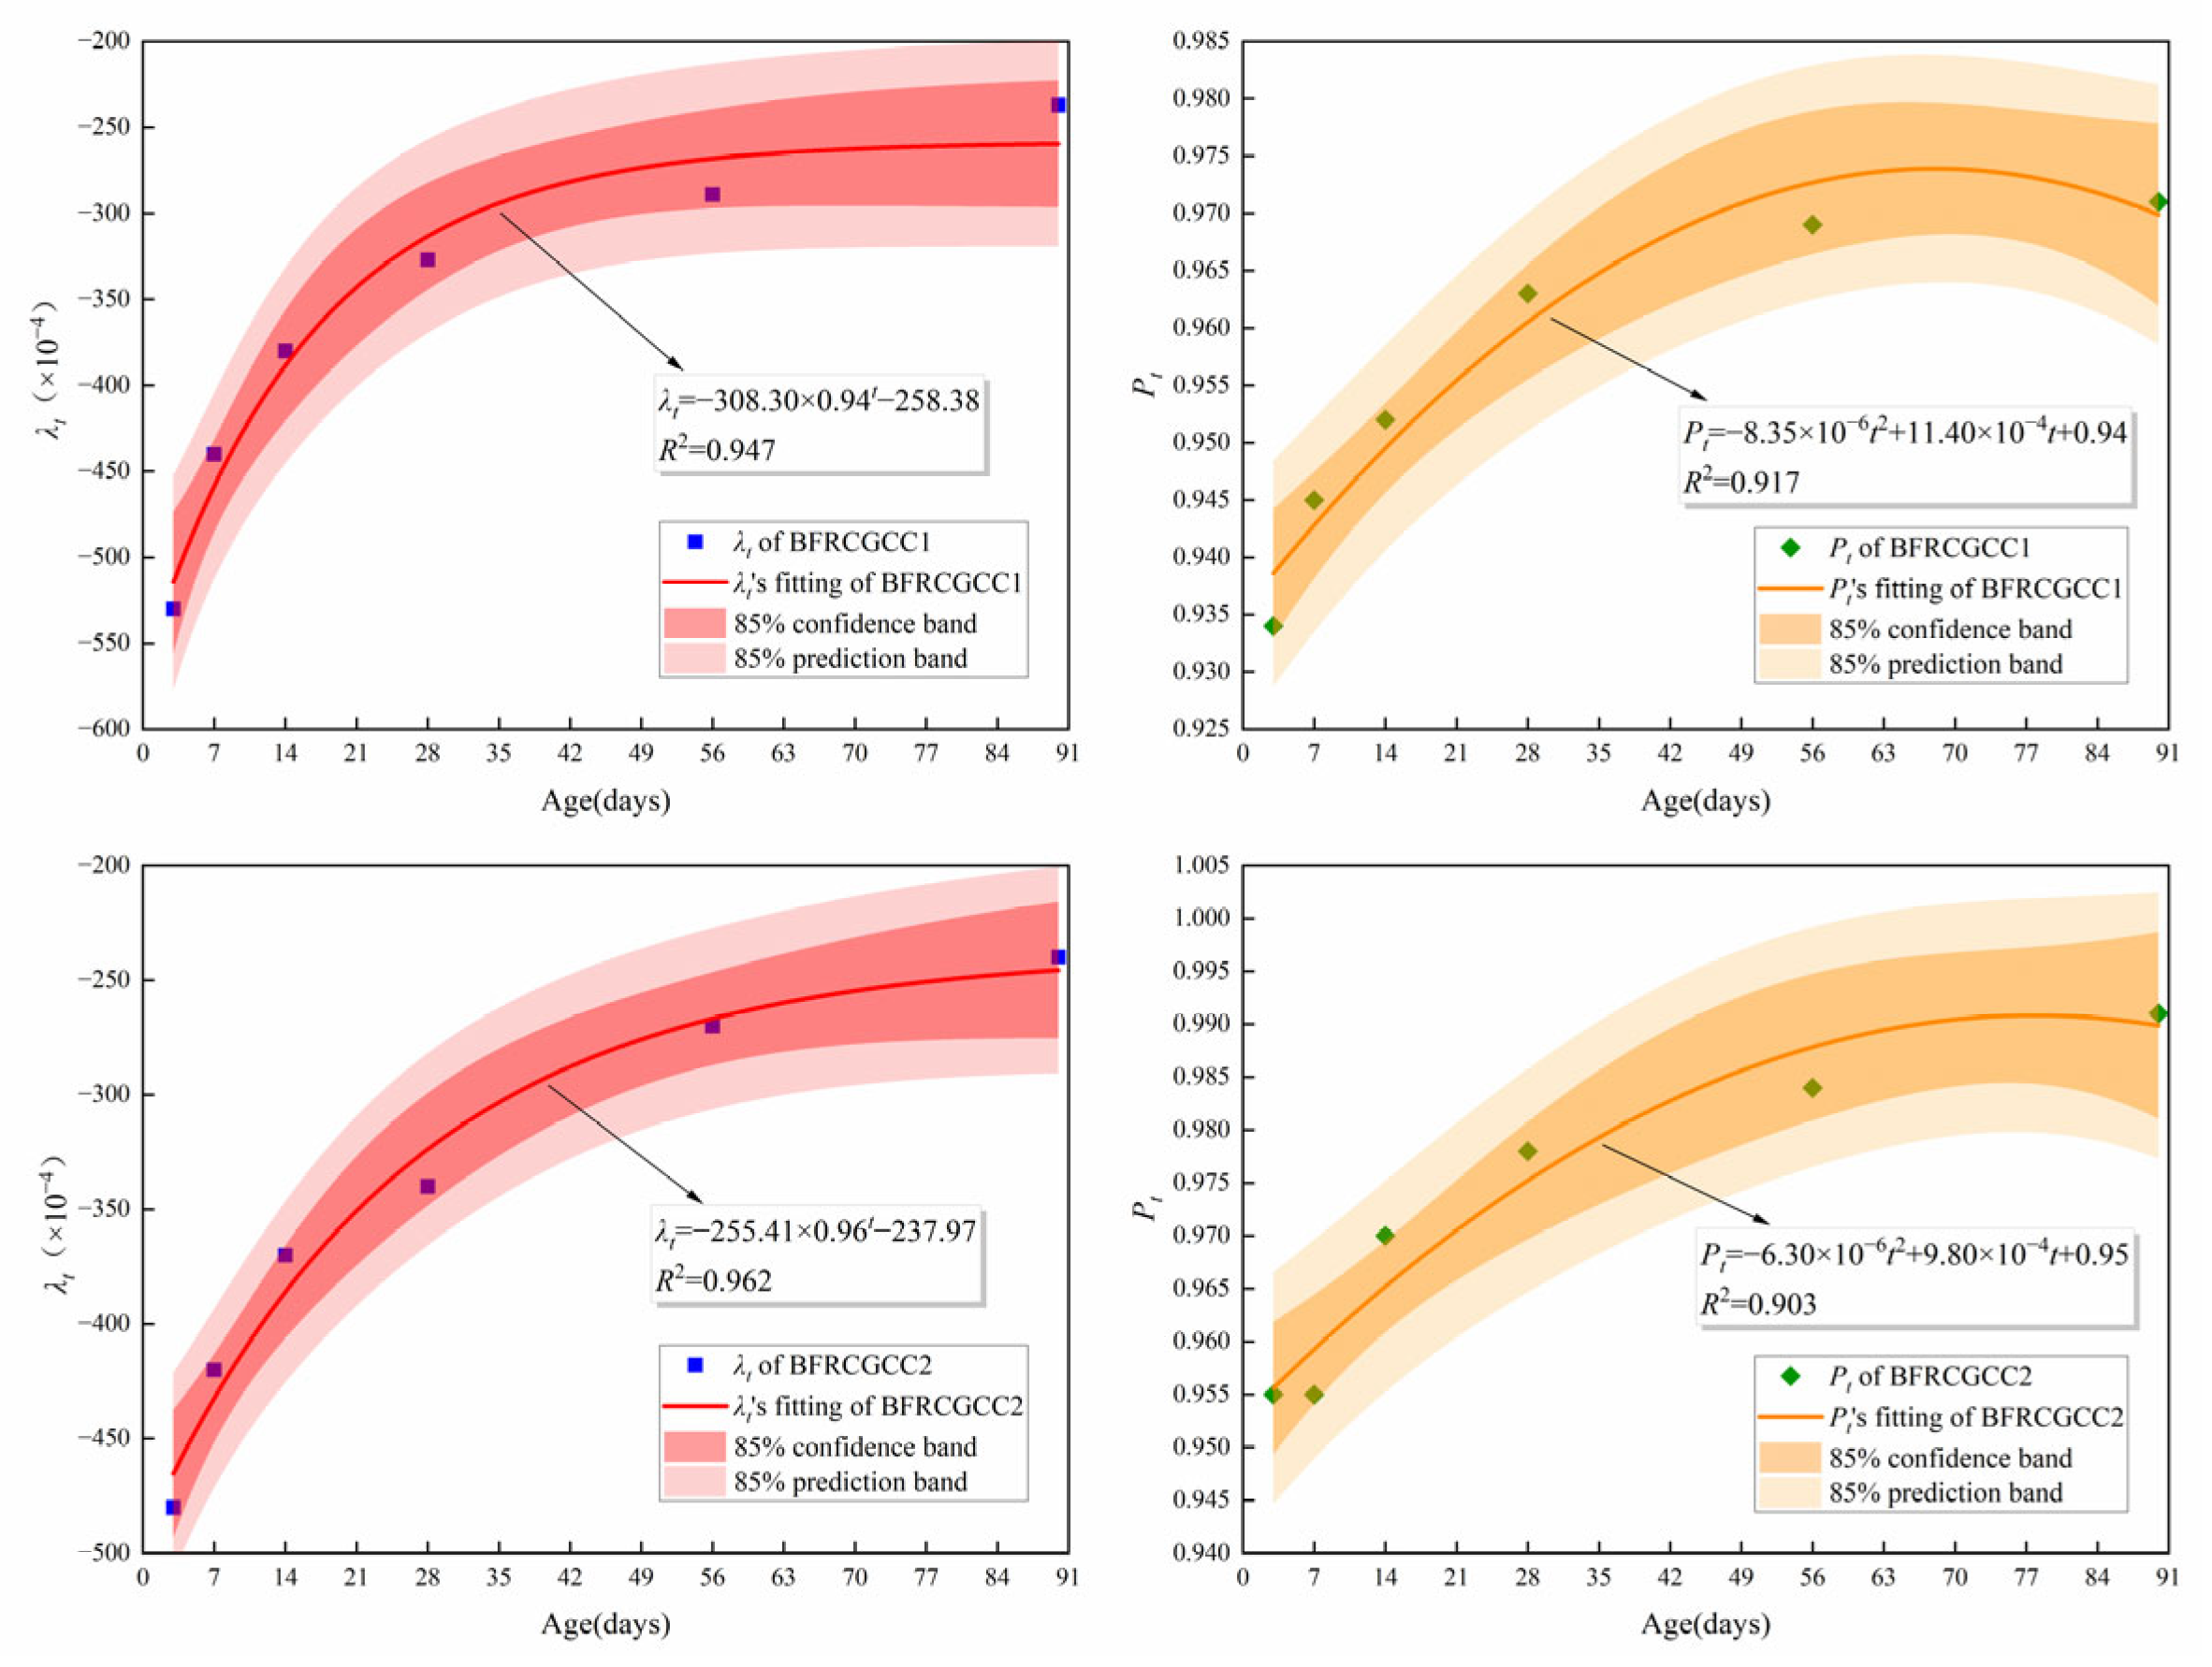
Based on Figure 18, the values of the λt and Pt can be obtained regarding the ages of 3 d, 7 d, 14 d, 28 d, 56 d, and 90 d. The results were listed in Table 10. The variation in the λt and Pt with age can be gained by fitting, and the results are presented in Figure 19.
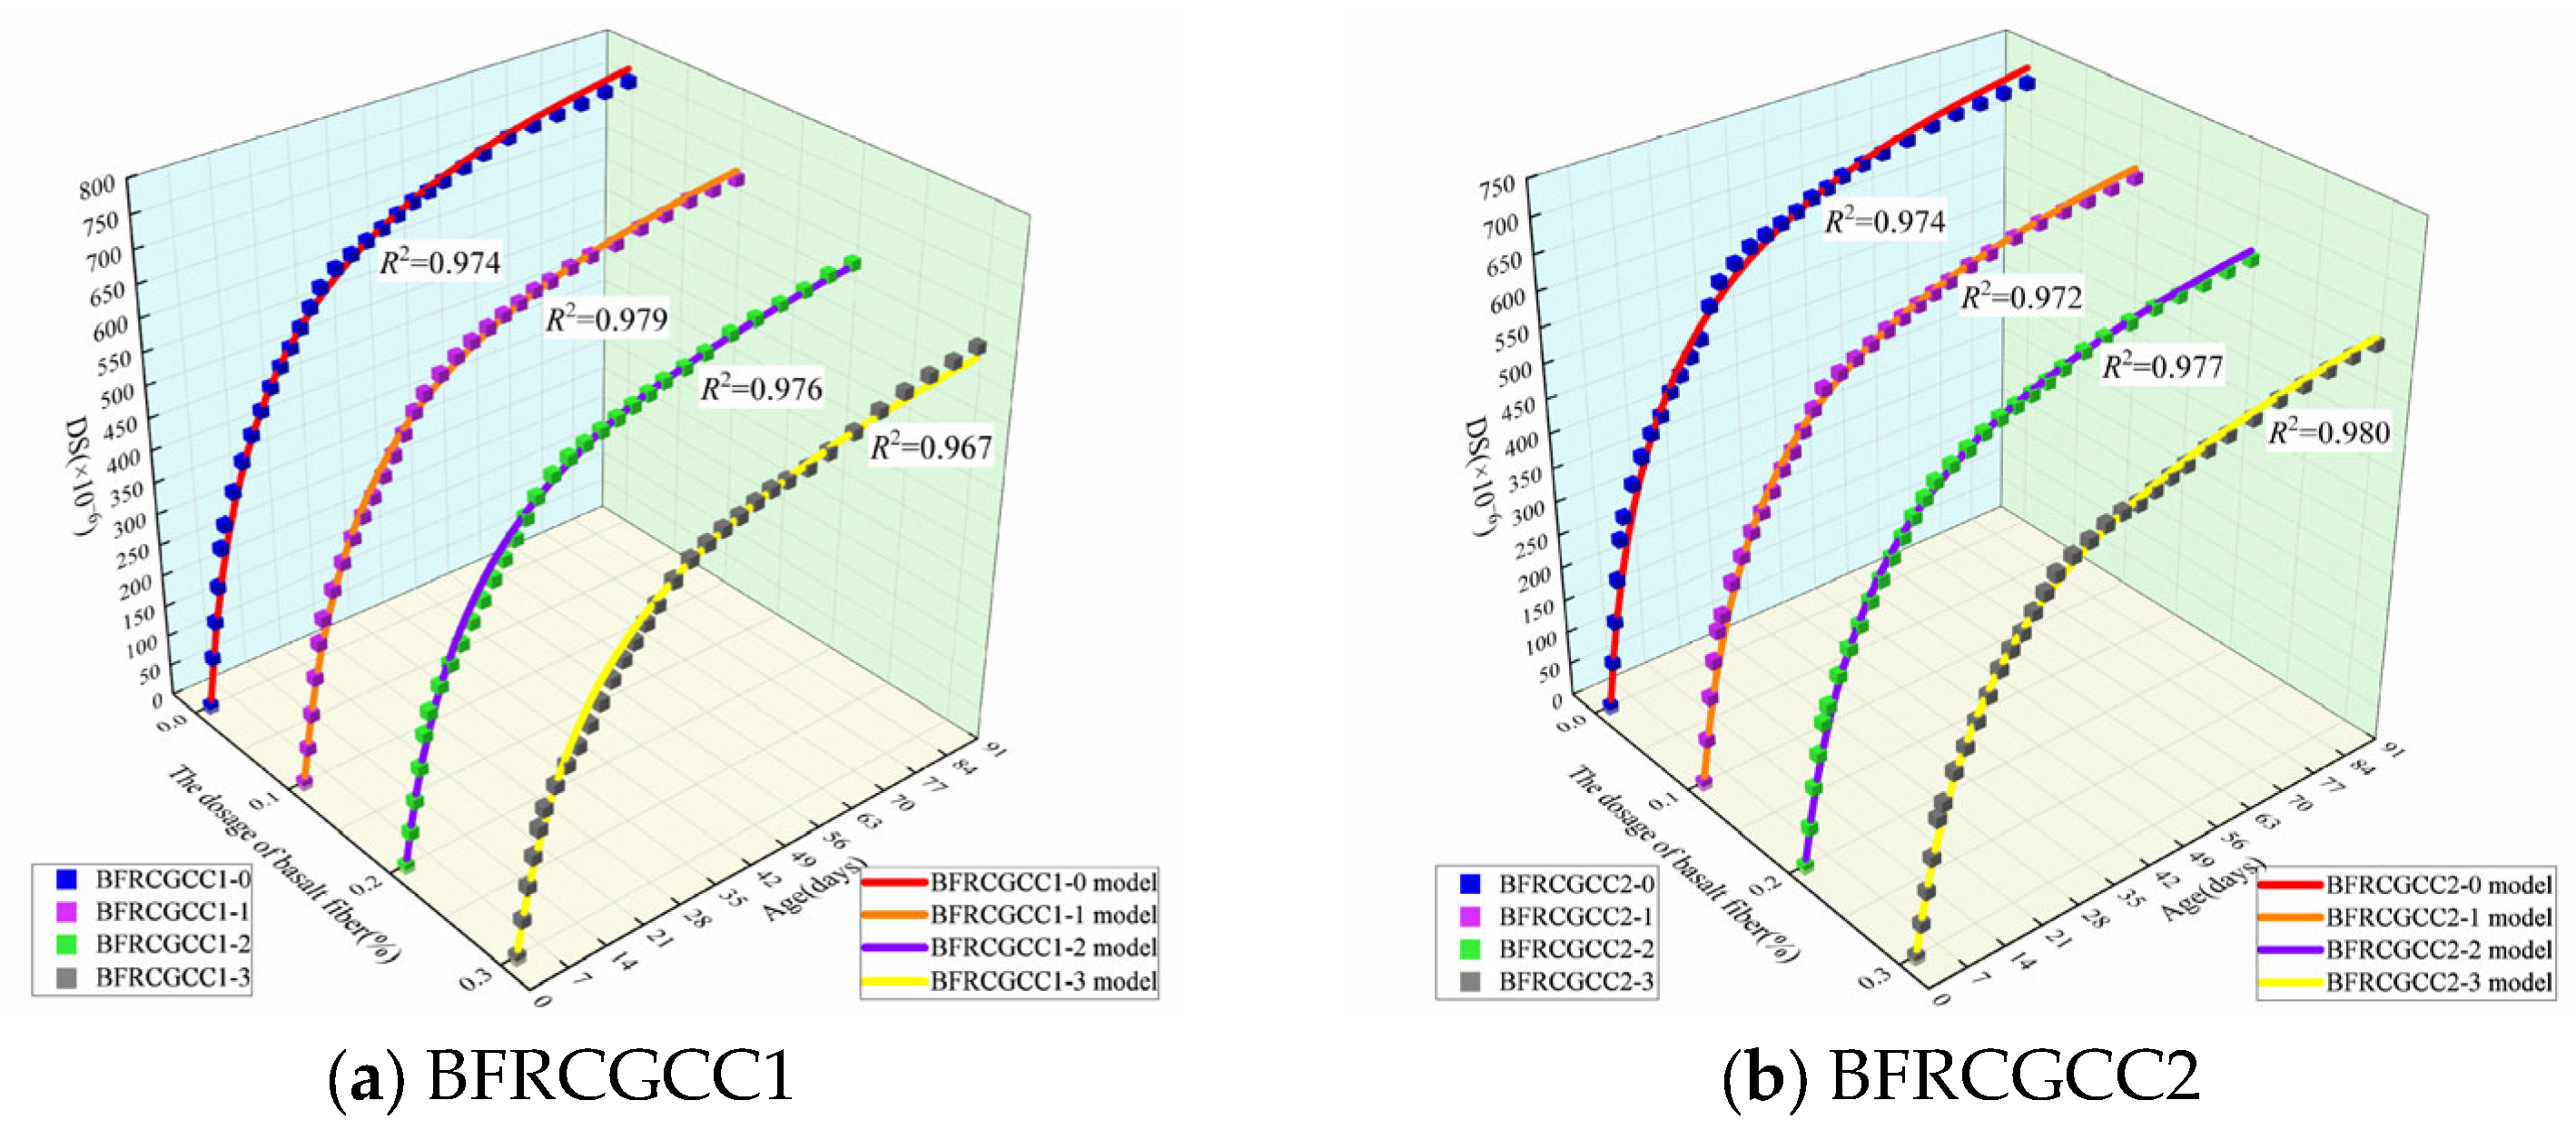
Figure 20 presents the comparison between experimental measurements and prediction values by the revised AFREM model of DS of the BFRCGCC.
To systematically analyze the prediction performance, indicators such as RMSE, NRMSE, and MAPE were also calculated; the NRMSE was the normalized RMSE and calculated according to Equation (17). The results were displayed in Table 11.
NRMSE = RMSE / ( y m a x y m i n )
The results indicated that there is a good agreement between the predicted values by the revised AFREM model and experimental measurements. The revised AFREM model demonstrated that the DS of BFRCGCC decreased with the increment of basalt fiber dosage.
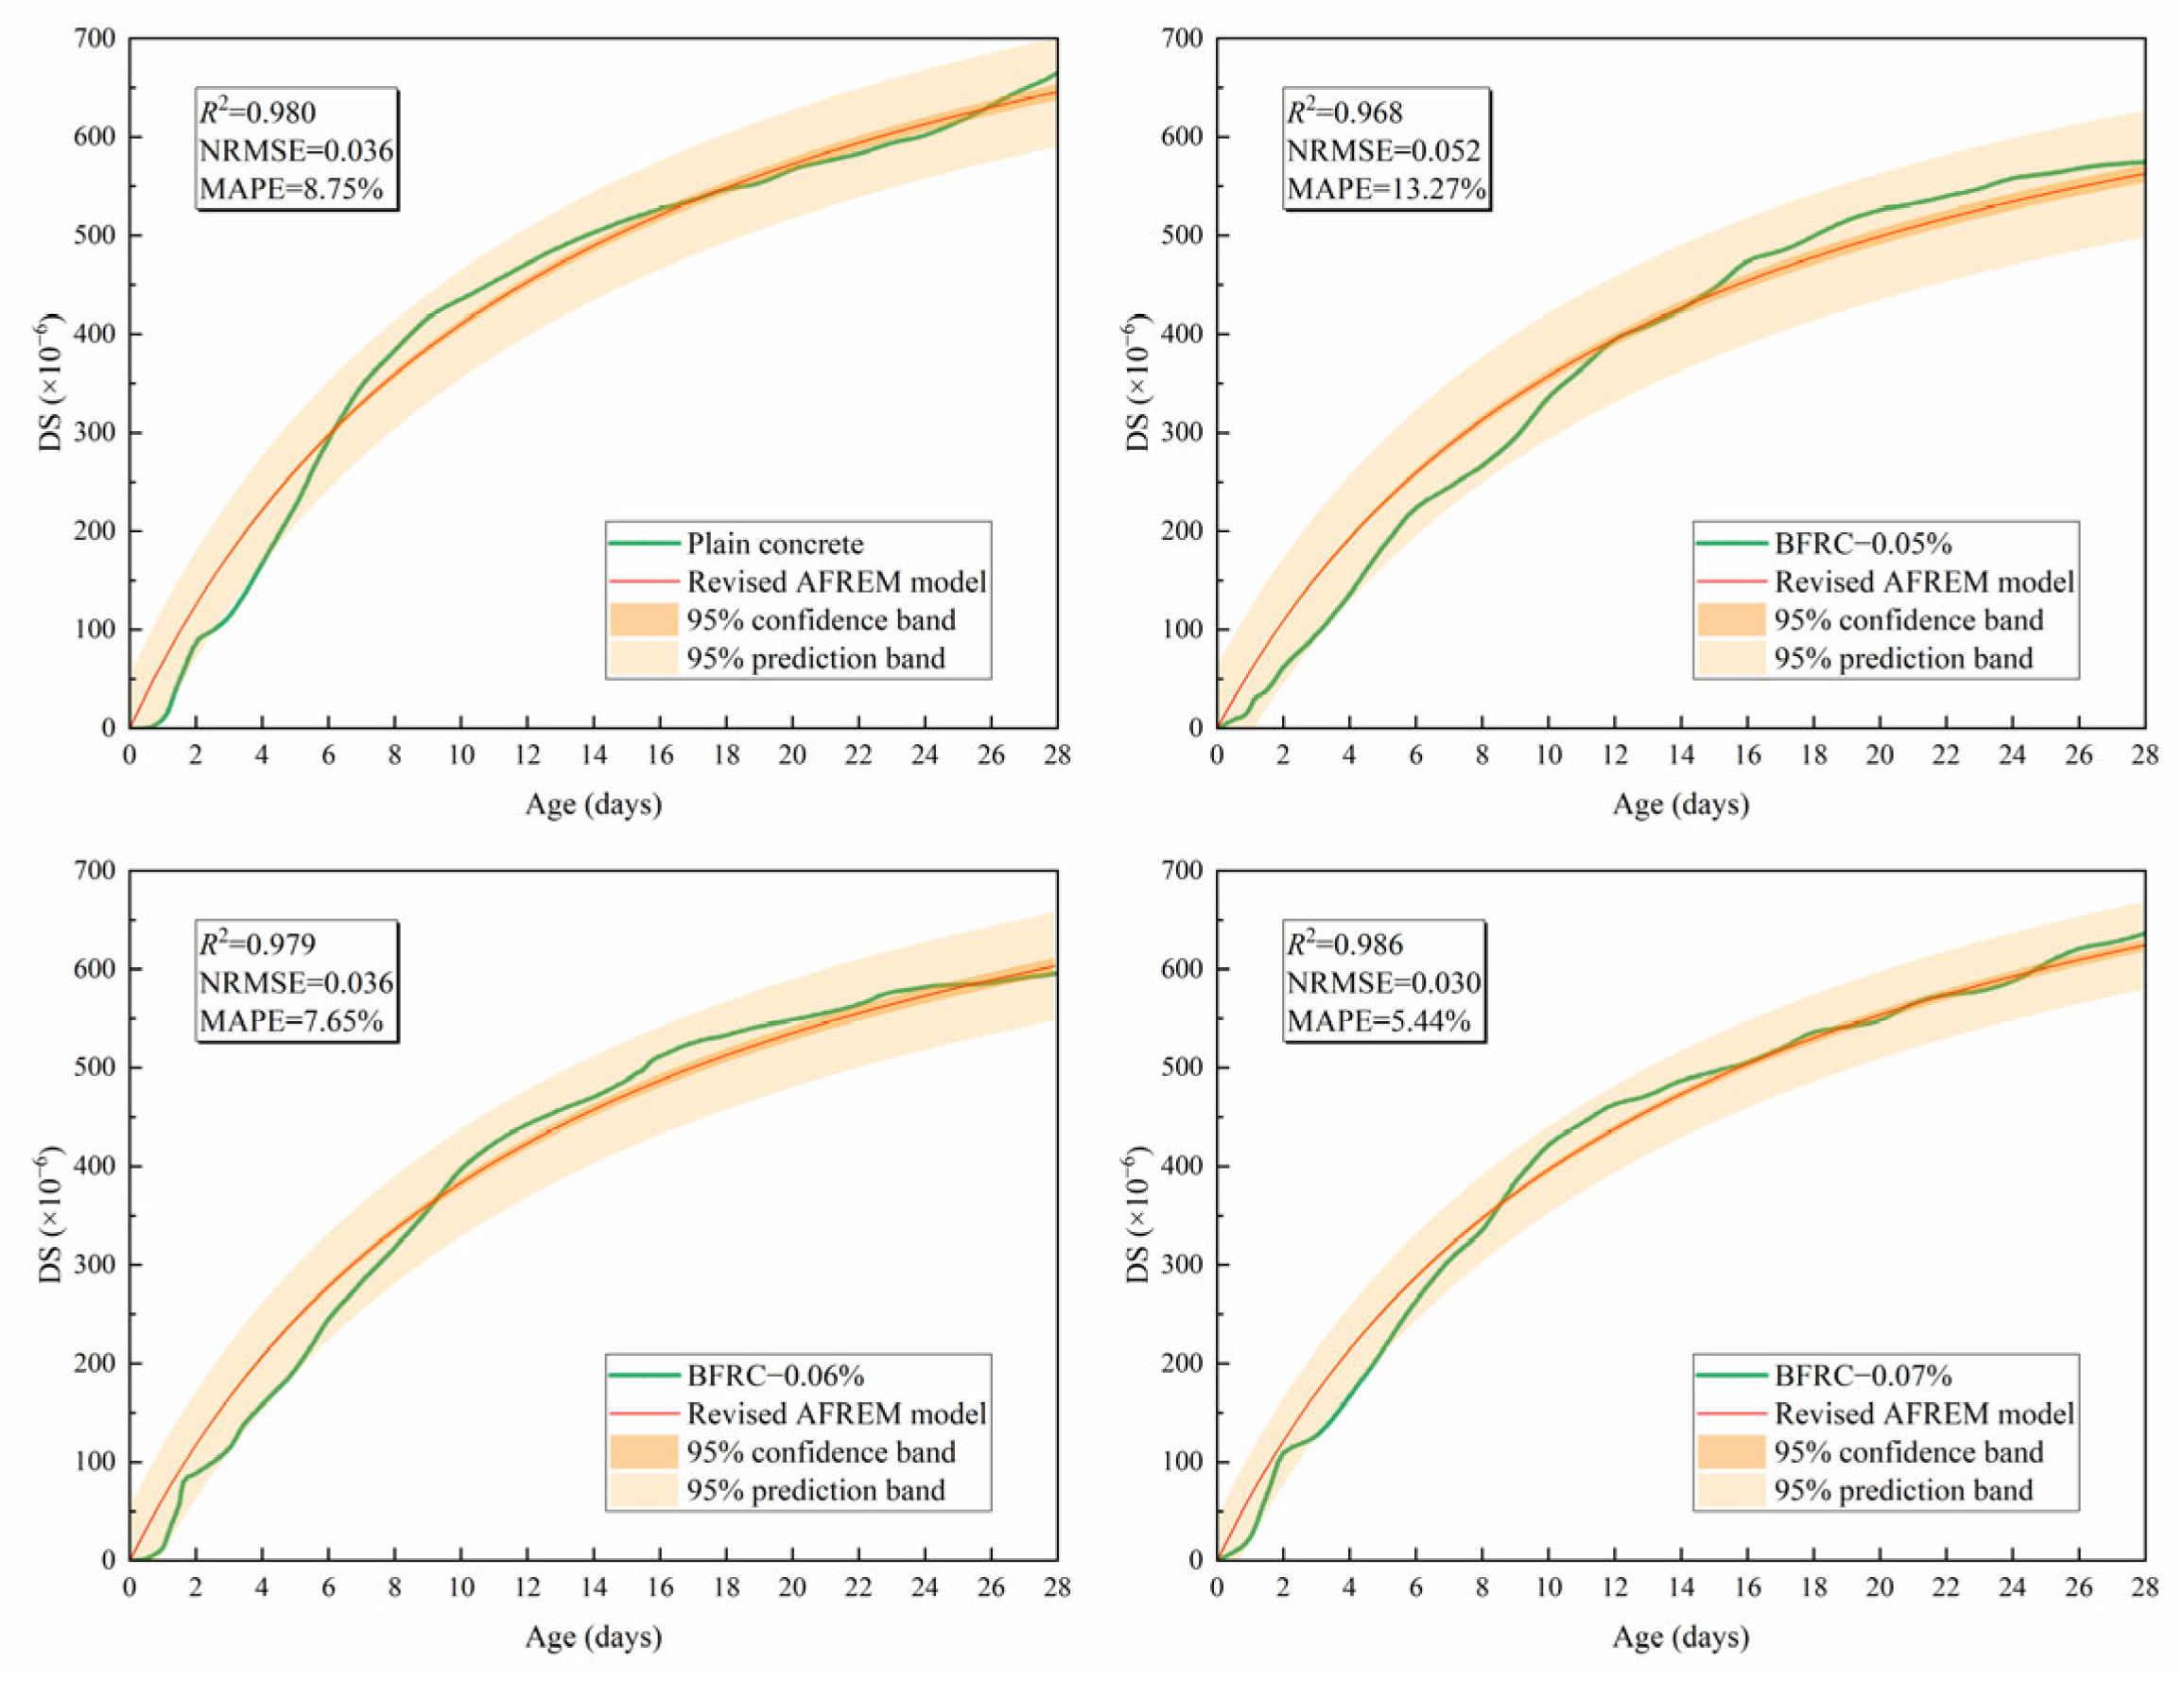
Whether the revised AFREM model can accurately predict the DS in other tests remains to be verified. Li et al. [50] investigated the effect of basalt fiber dosage (0%, 0.05%, 0.06%, 0.07%) on DS of BFRC. The four specimen groups were designated as plain concrete, BFRC−0.05%, BFRC−0.06%, and BFRC−0.07%, respectively. Figure 21 presents the comparison between predictions from the revised AFREM model and experimental results from Li’s investigation; the findings confirm the feasibility of the revised AFREM model for DS prediction of concrete.

4.3. Prediction Model for Electrical Resistivity

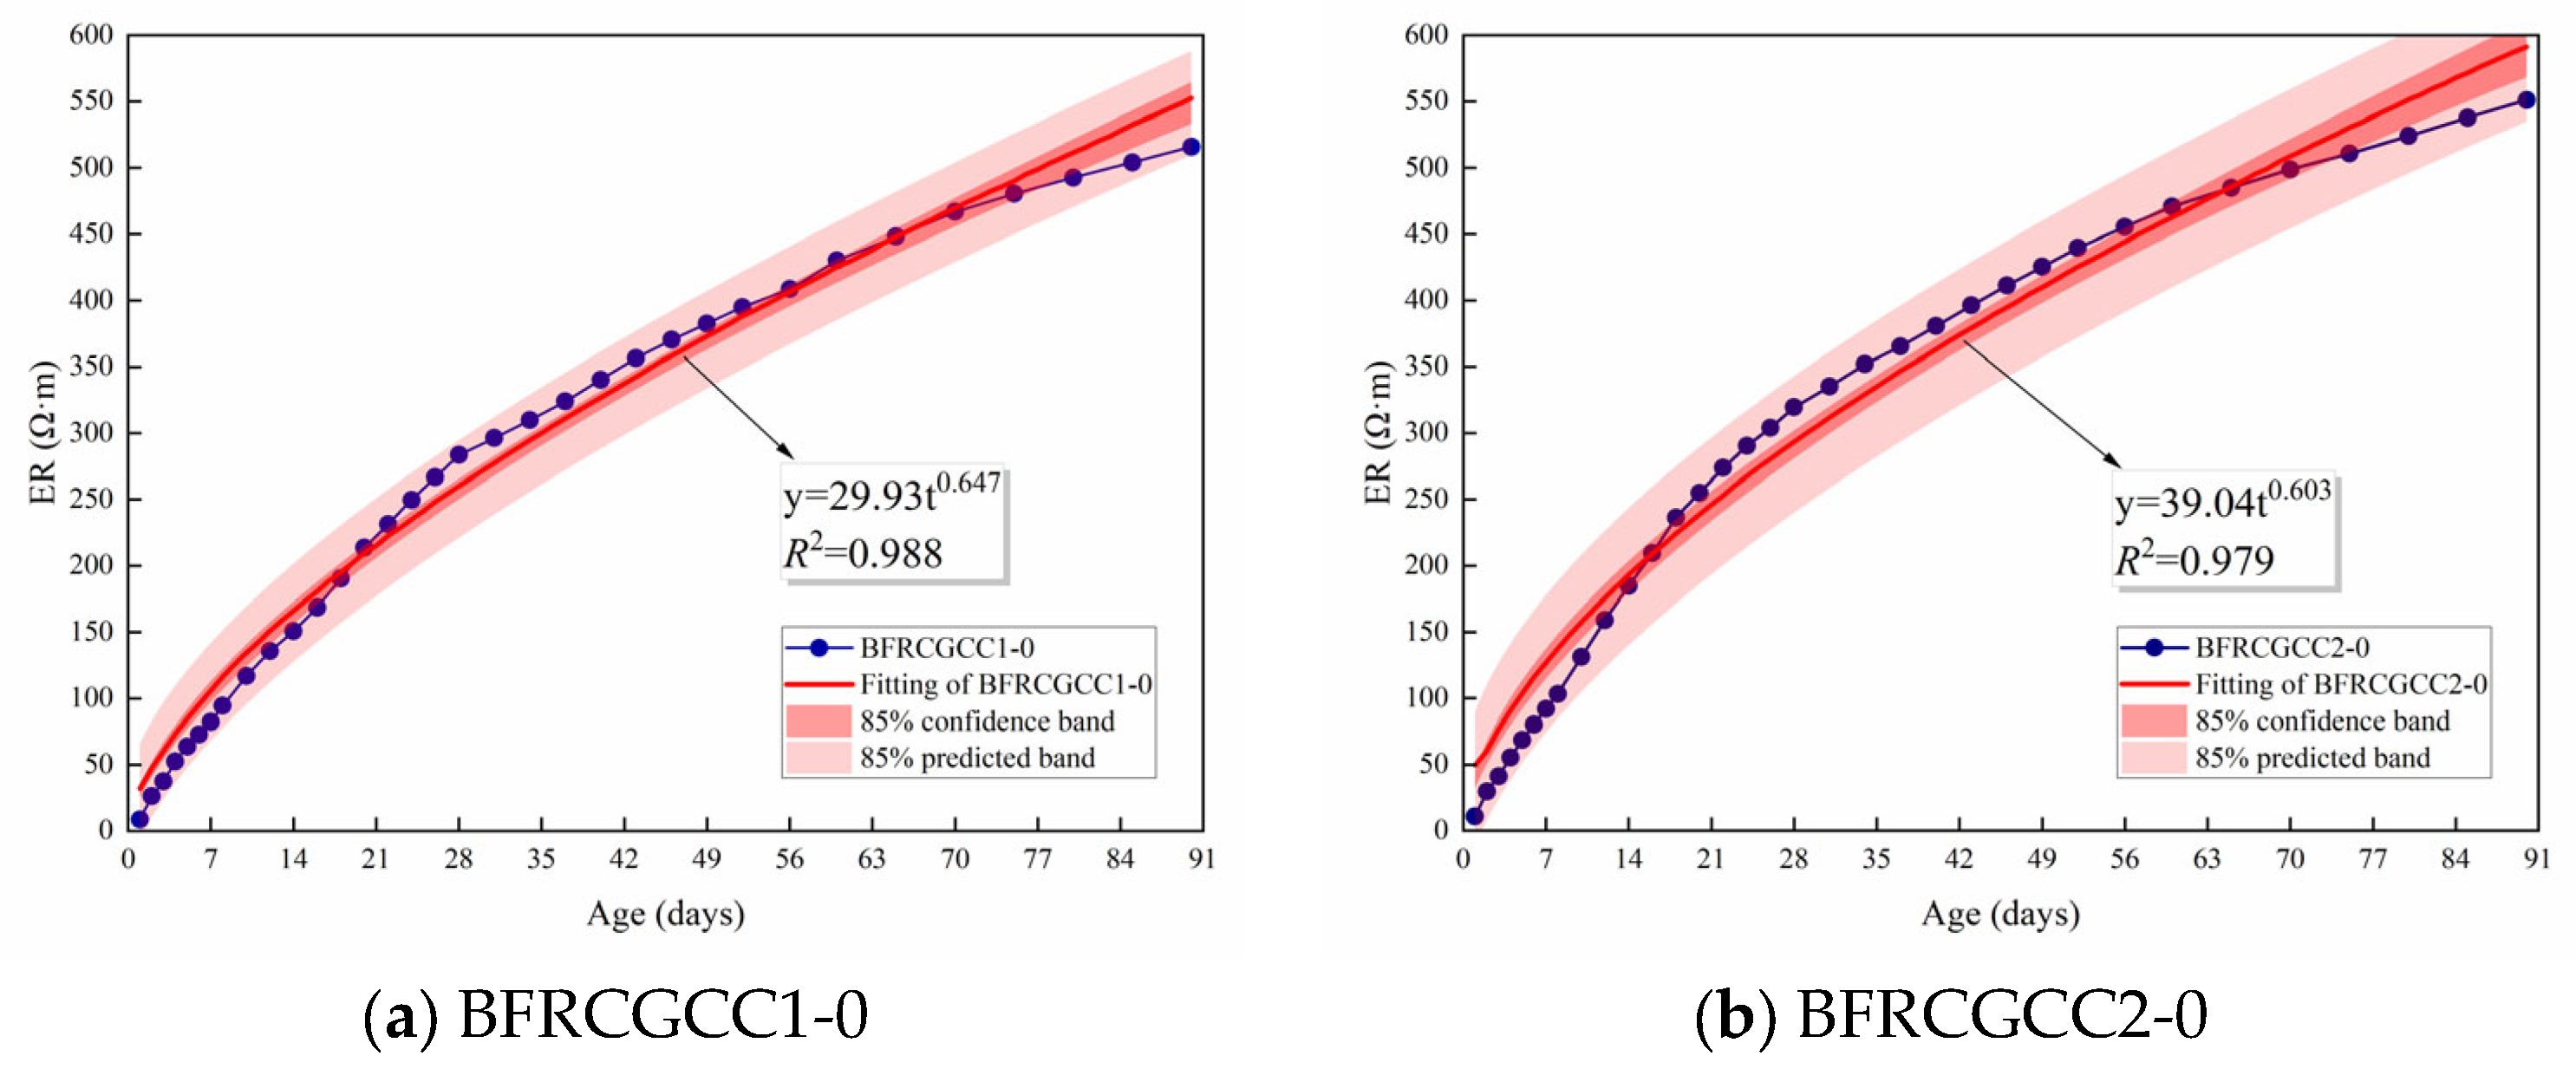
In order to quantitatively analyze the relationship between the basalt fiber dosage and the ER increment of CGCC, the relationship between the ER of CGCC without fiber reinforcement and the age was verified first. Figure 22 presents the fitting outcomes. Equation (18) describes the evolution of ER with age.
ρ t , 0 = m t n
where m and n are the coefficients.
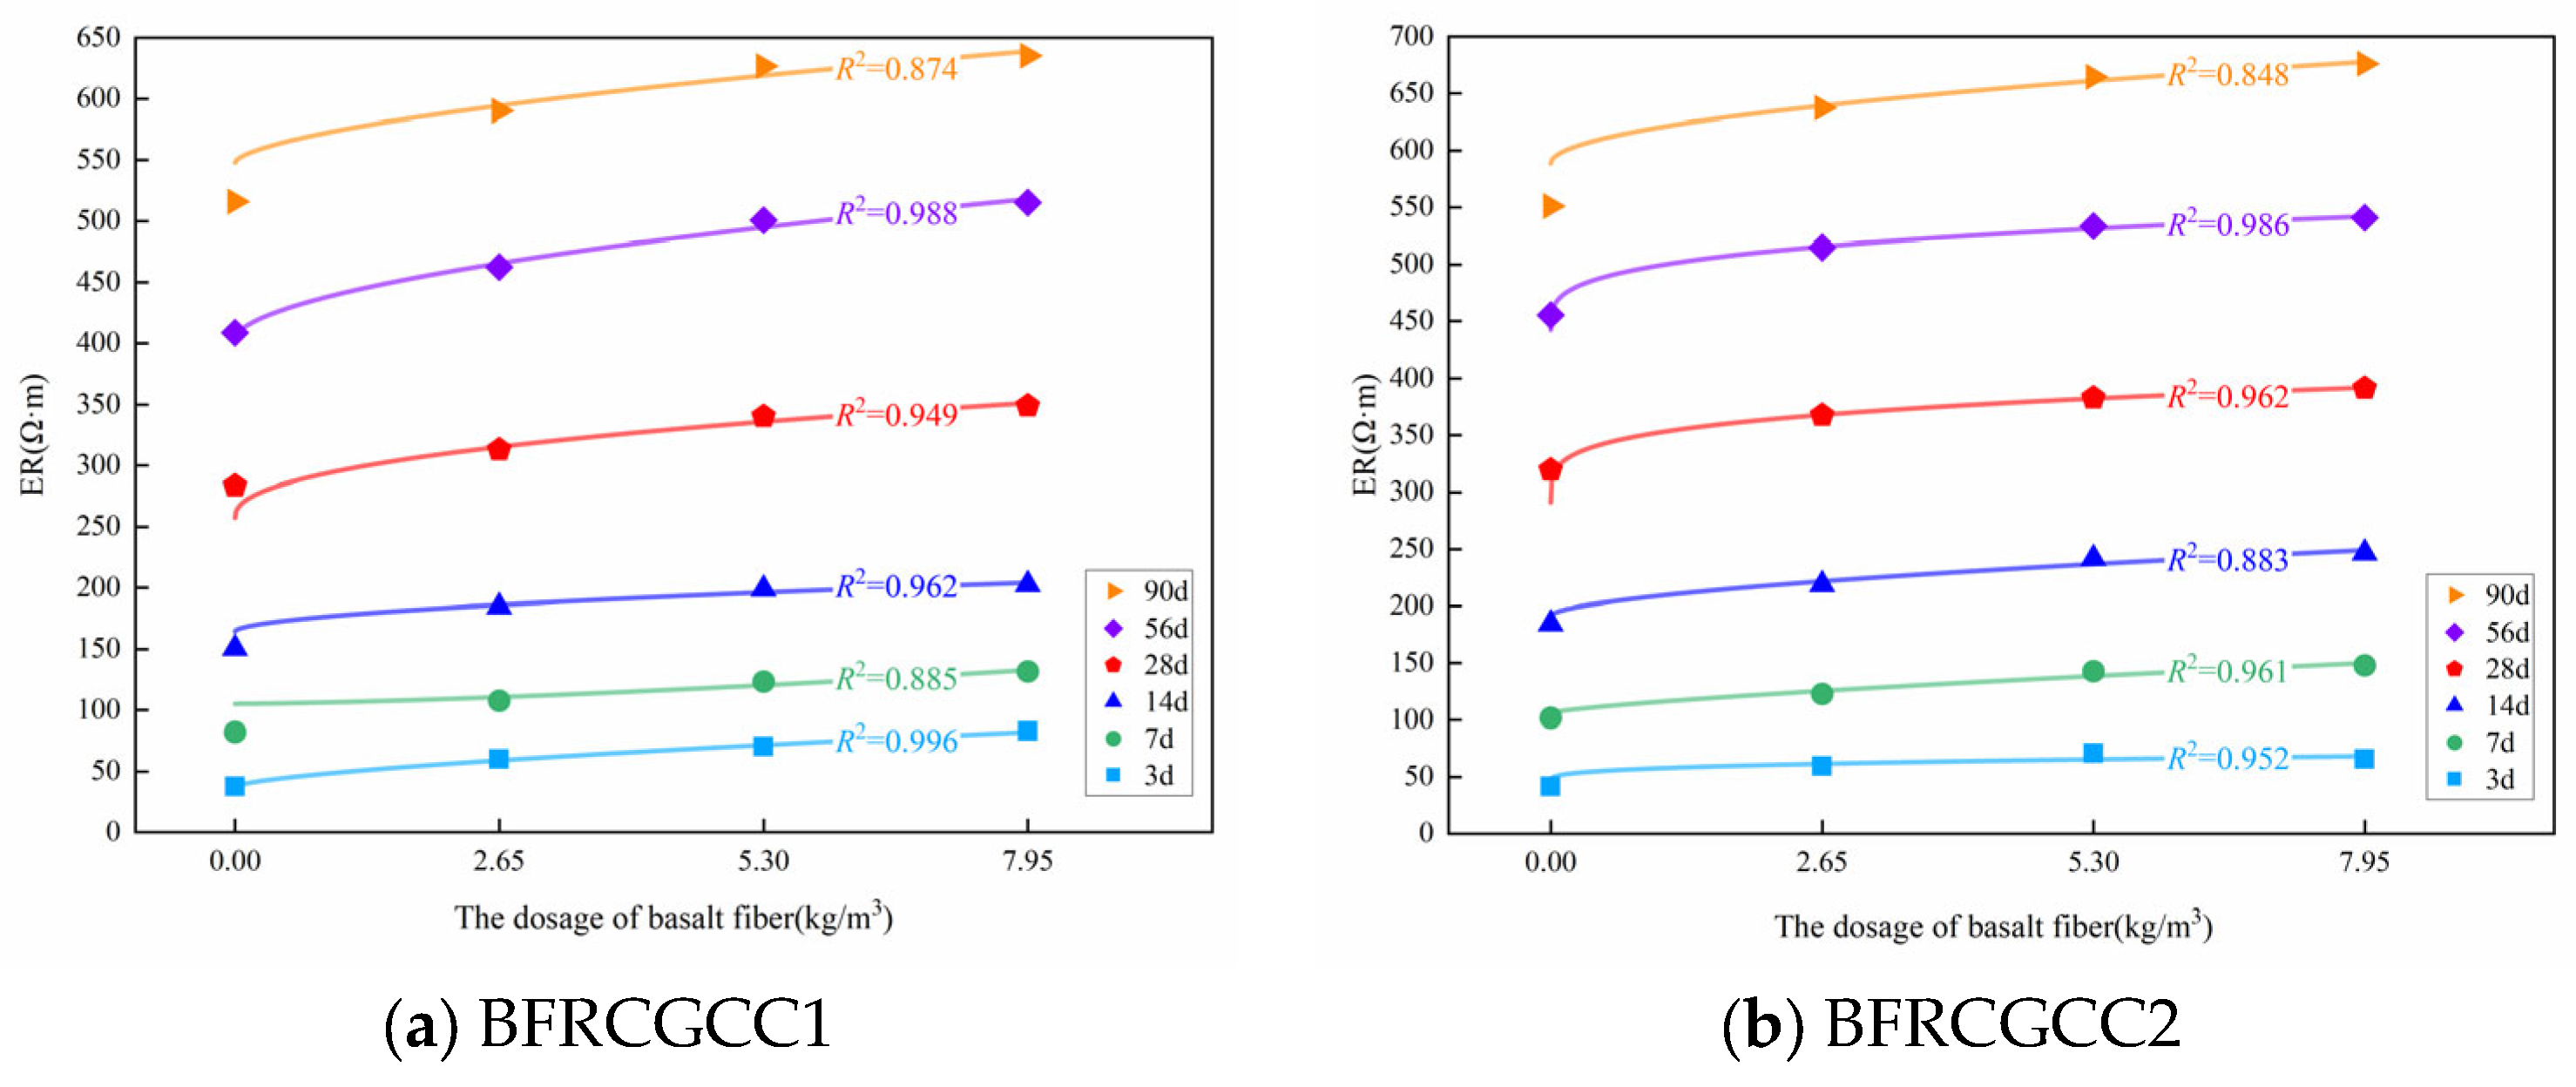
The variation in the ER of the matrix with age could be described by the exponential function. Figure 23 presents the variation in the ER with the fiber dosage.
Based on Figure 23, it can be seen that the ER increased with the basalt fiber dosage. The increment in the dosage showed a nonlinear law, which can be expressed by Equation (19).
ρ t , ω = R ta ω R tb + ρ t , 0
where ρ(t, ω) means the ER of the basalt fiber-reinforced matrix; ω means the fiber dosage; Rta and Rtb are the coefficients; ρ(t, 0) means the ER of the matrix without fiber reinforcement.
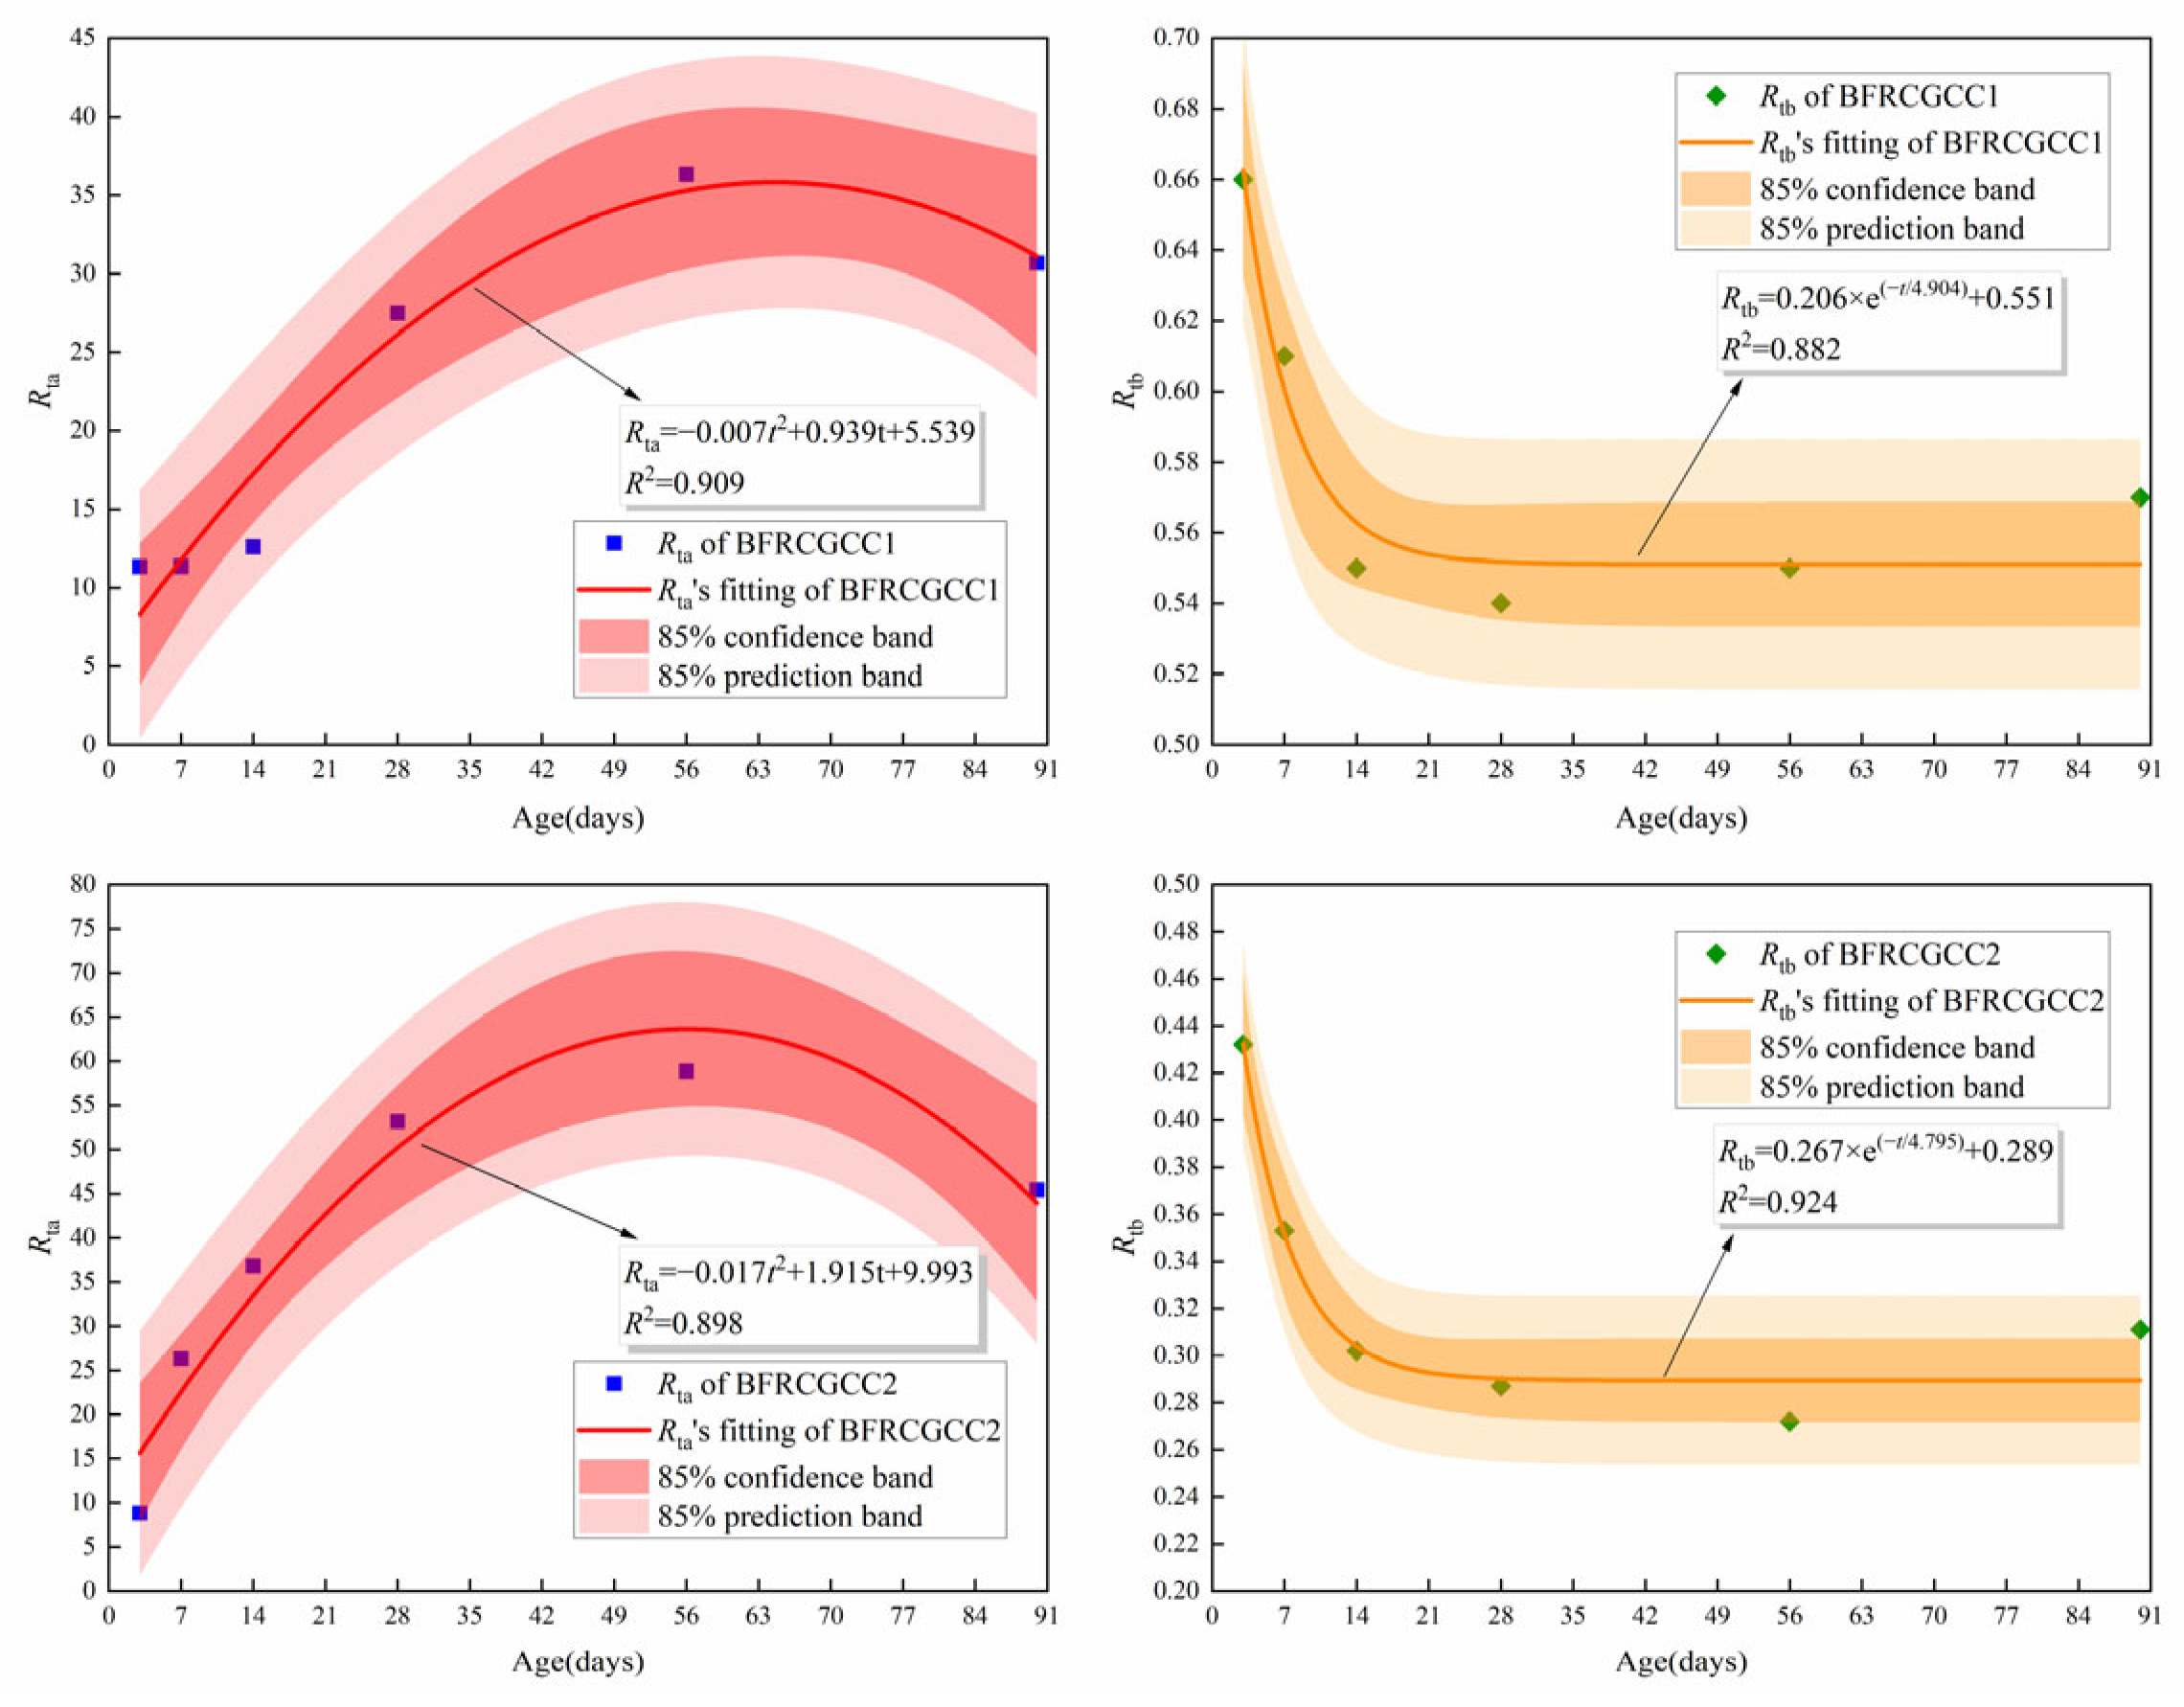
The test values corresponding to 3 d, 7 d, 14 d, 28 d, 56 d, and 90 d were selected, and the values of Rta and Rtb can be obtained by the regression analysis, and the results are listed in Table 12. Based on Table 12, the variation in the coefficients Rta and Rtb over time can be obtained, and the results are presented in Figure 24.
From Figure 24, it can be seen that the coefficient Rta increased with age before 56 d, and then started to decrease. The coefficient Rtb decreased with age before 14 d and then became stable. This phenomenon also reflected that the basalt fiber incorporation may contribute to the enhancement in the ER of CGCC to a certain extent, while this effect gradually weakened in the later stage.
The prediction model of ER for BFRCGCC was as follows:
ρ t , ω = a t 2 + b t + c ω k + λ × e x p ( t / v ) + m t n
where a, b, c, k, λ, v, m, and n are the coefficients.
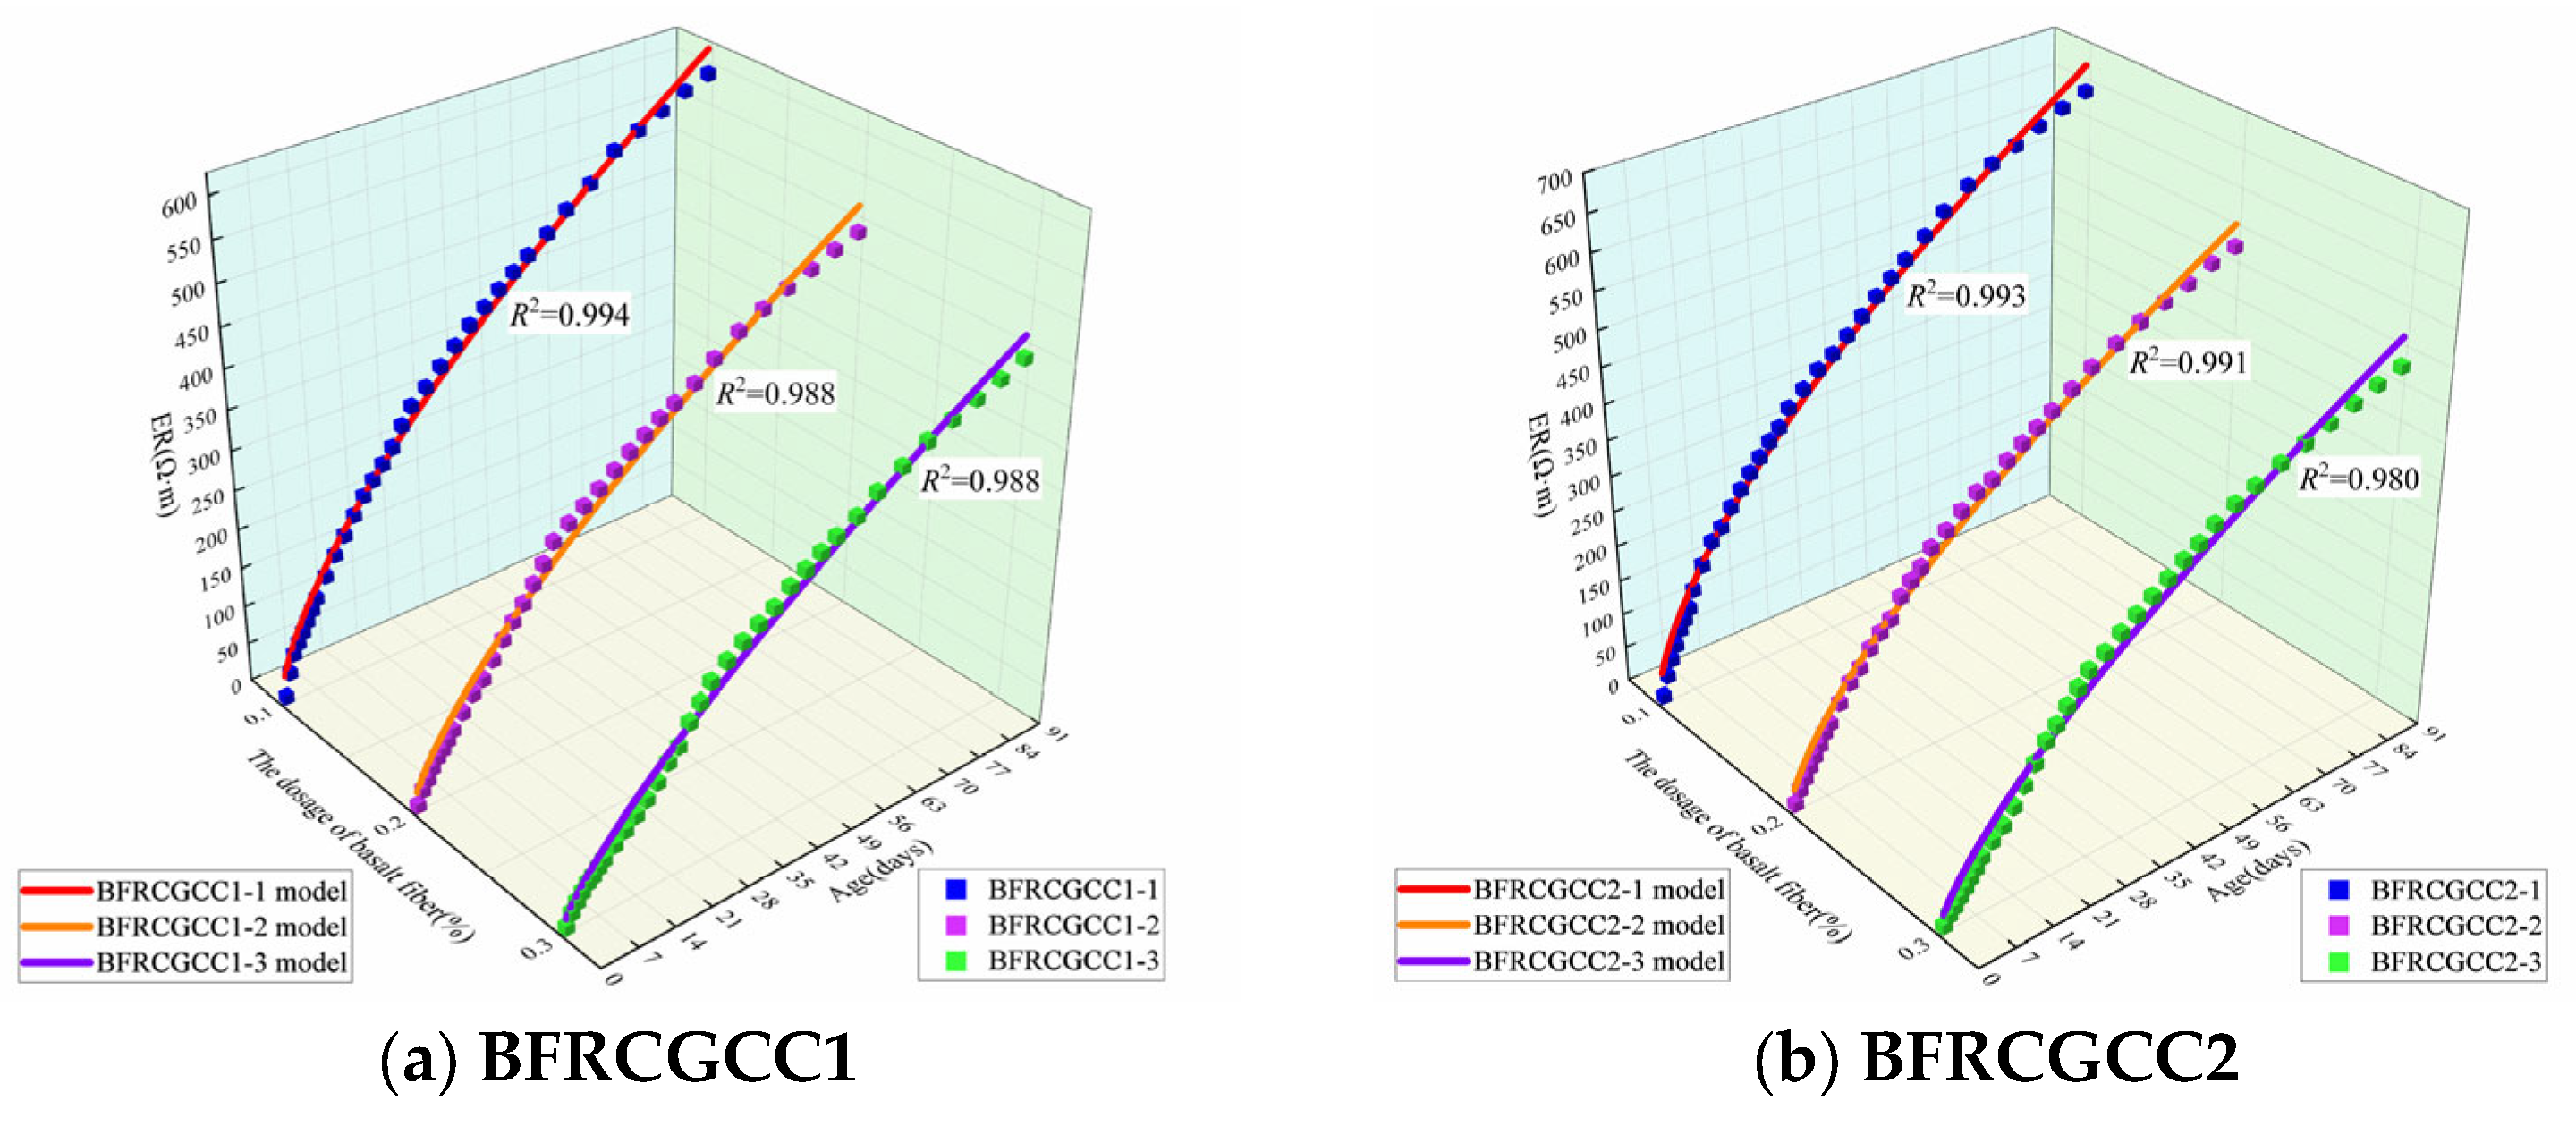
A comparative analysis of the predicted values and the test values of the ER of the matrix was presented in Figure 25.
Based on Figure 25 and Table 13, we can see that all the correlation coefficients are above 0.980, and the values of NRMSE are less than 0.05, and the values of MAPE are less than 3.00%. These mean that the predicted values of the ER of the specimens were consistent with the measured values, and the predicted models were feasible.

4.4. Relationship Between the IH and DS

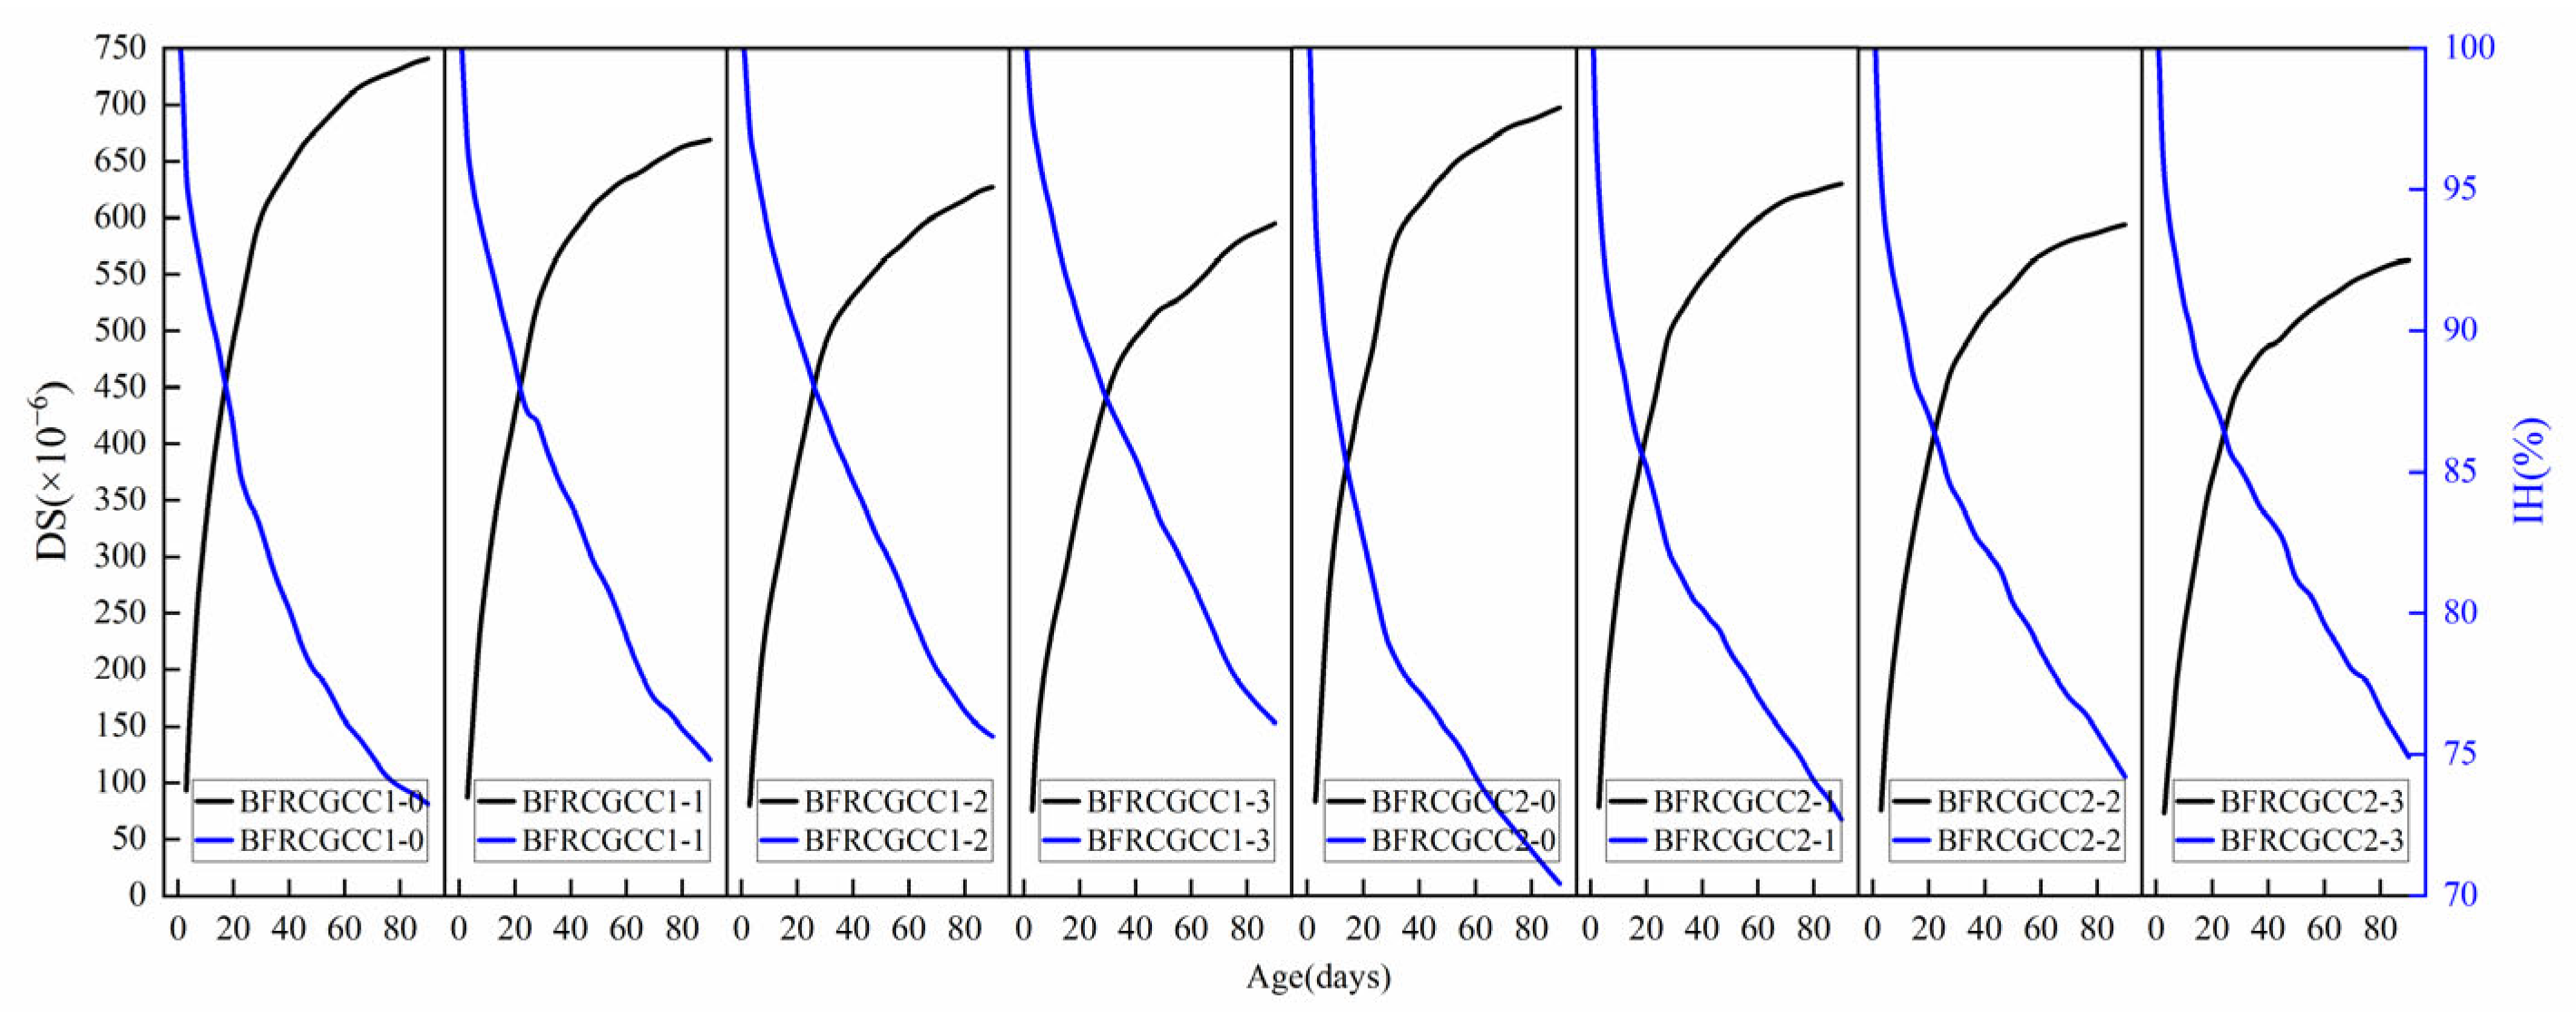
To elucidate the correlation between IH and DS in BFRCGCC, Figure 26 presents a comparative analysis of the test values.
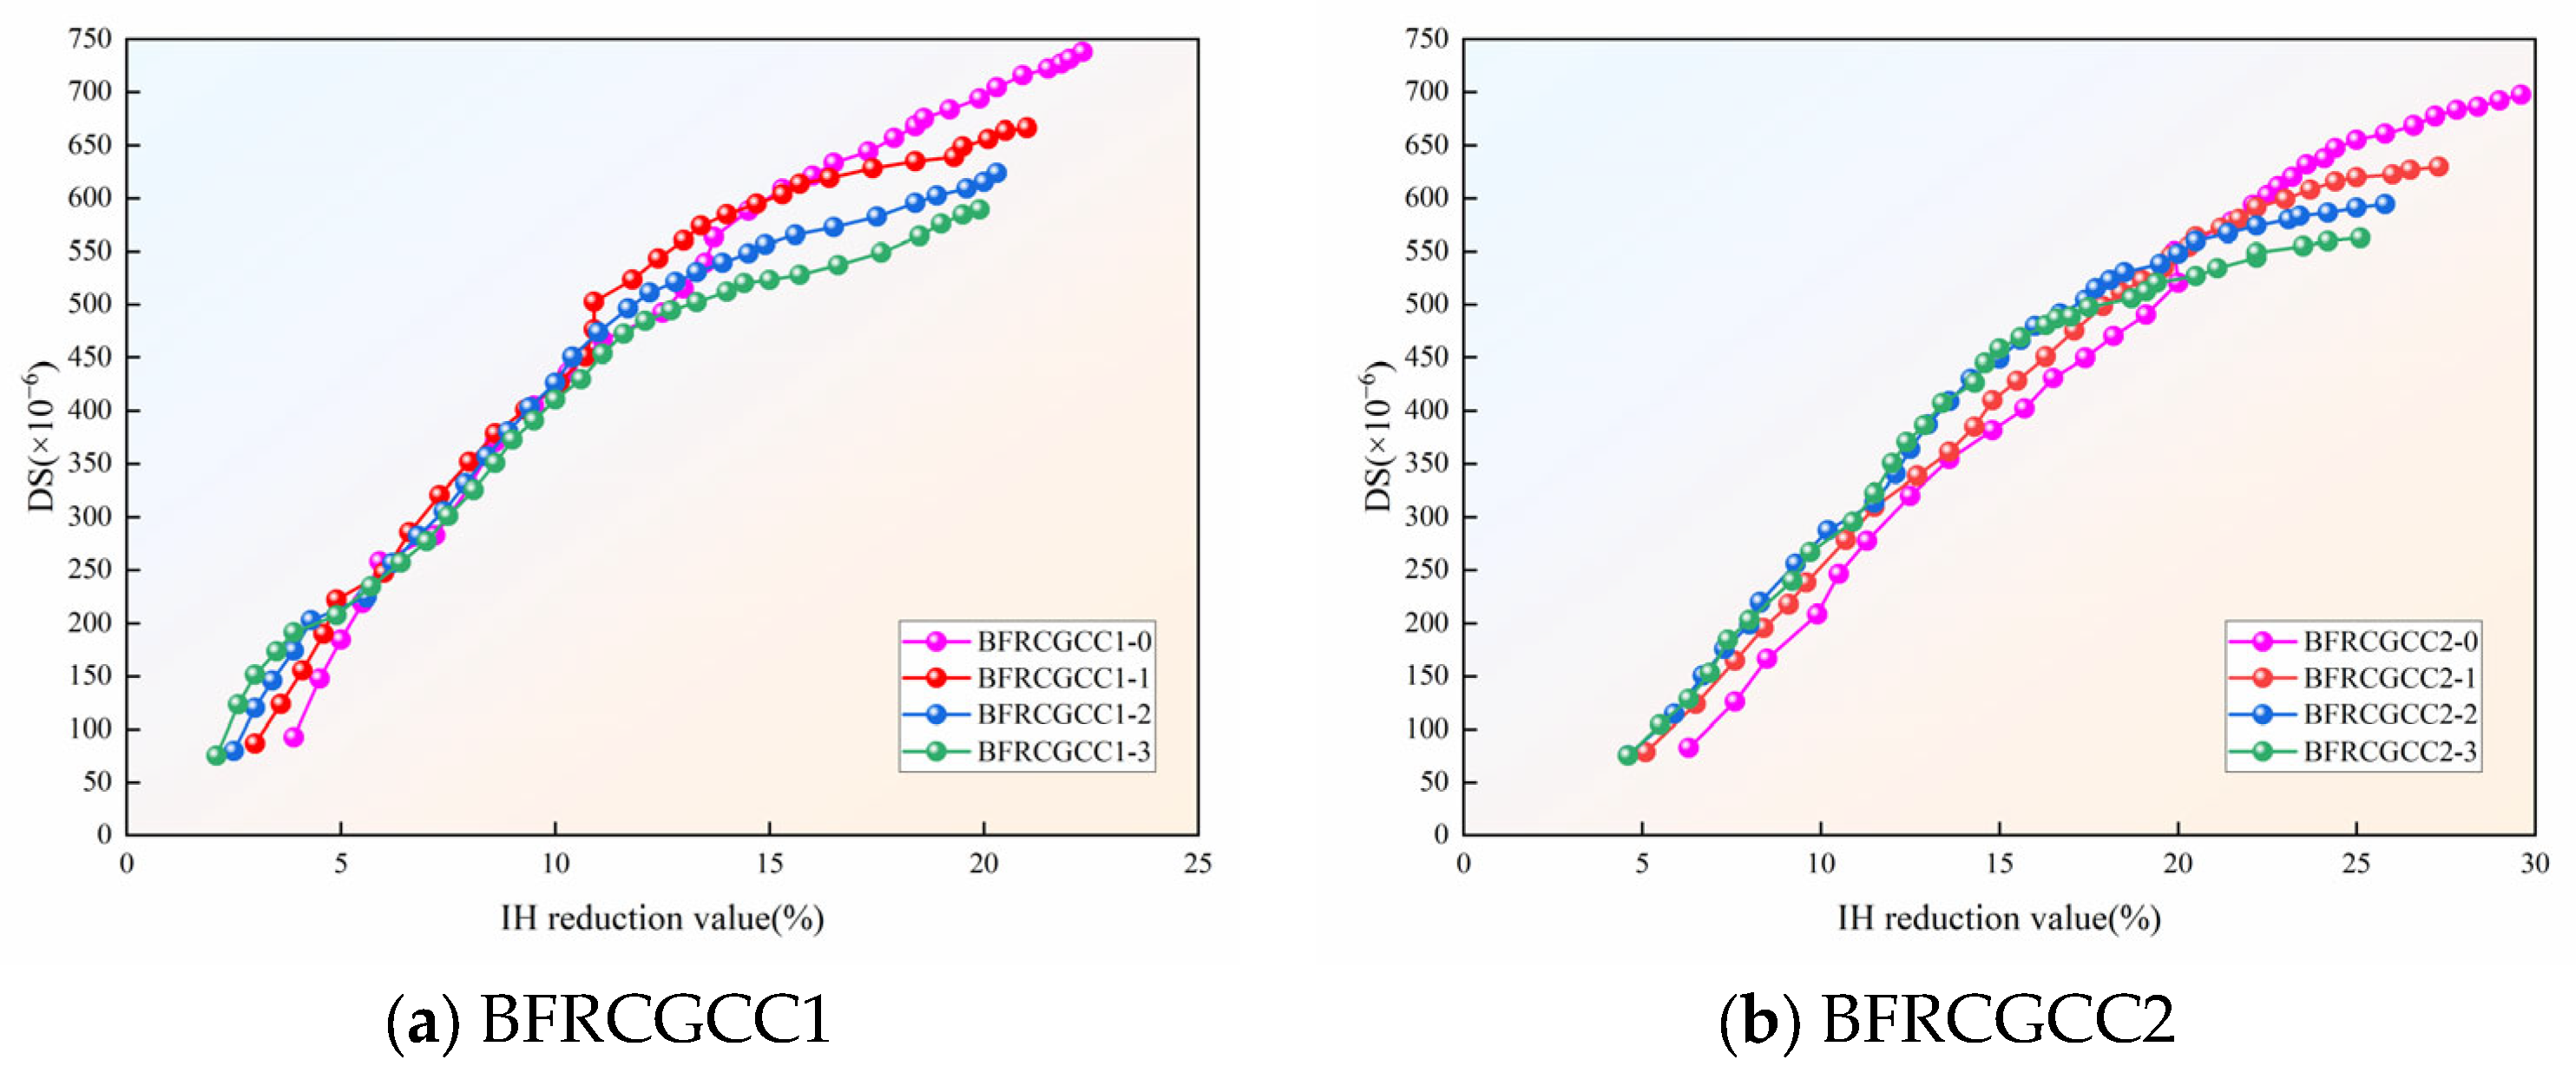
From Figure 26, we can see that the IH of the specimens decreased with age, and the DS of the matrix gradually increased with age, and the two indices were negatively correlated. Studies have shown that there is a nice correlation between the IH reduction and the DS of the concrete [73]. The relationship between the IH reduction and DS of CGCC with different basalt fiber dosages is presented in Figure 27.
The relationship between the IH reduction and DS can be expressed using the following Equation.
ε DS = A 1 + B 1 ln Δ H + C 1
where A1, B1, and C1 are the coefficients; ΔH is the reduction in the IH.
The regression results were listed in Table 14.
Based on Table 14, we can see that all the values of the R2 were larger than 0.970; the results indicated a significant linear correlation between IH reduction and DS of the samples.

4.5. Relationship Between the ER and DS

To elucidate the correlation between ER and DS, a comparative analysis of matrix DS and ER variations was conducted, and the results are presented in Figure 28.
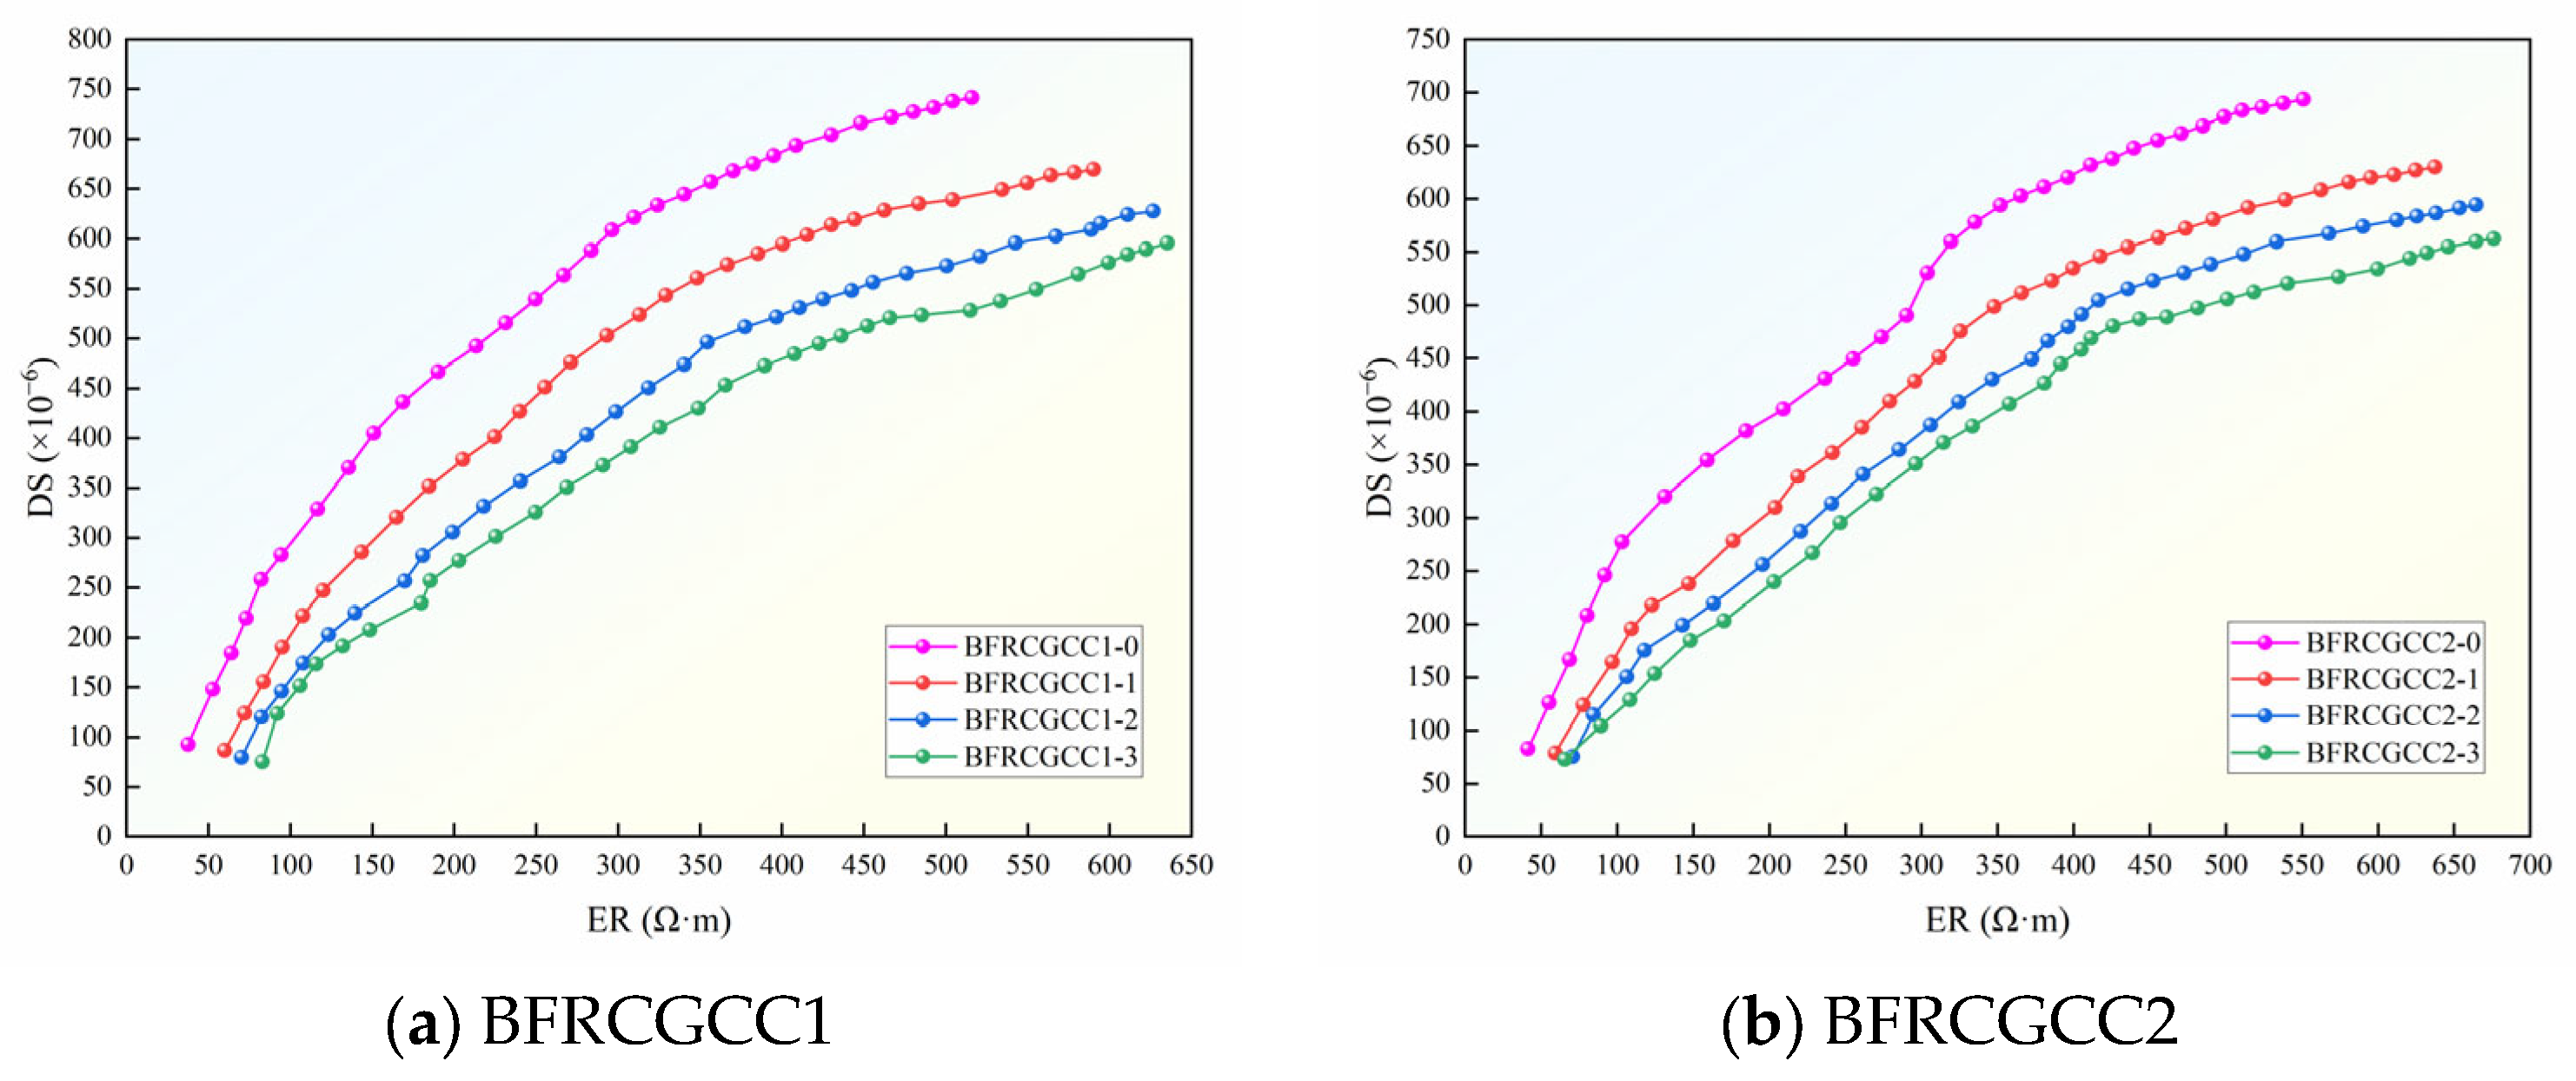
Based on Figure 28, it can be seen that the ER and DS of the BFRCGCC gradually increased with age, and the two indices were positively correlated, as presented in Figure 29.
With ER as the abscissa and DS as the ordinate, the experimental results were fitted, and the relationship can be expressed by the following Equation.
ε DS = A 2 + B 2 ln ρ + C 2
where A2, B2, and C2 are the coefficients.
Based on Table 15, we can see that the values of R2 of all the specimens were above 0.950; the DS of the matrix exhibited a significant logarithmic change relationship with the change in ER of the matrix.

4.6. Comparison of Measured Values with Those of Portland Cement Concrete

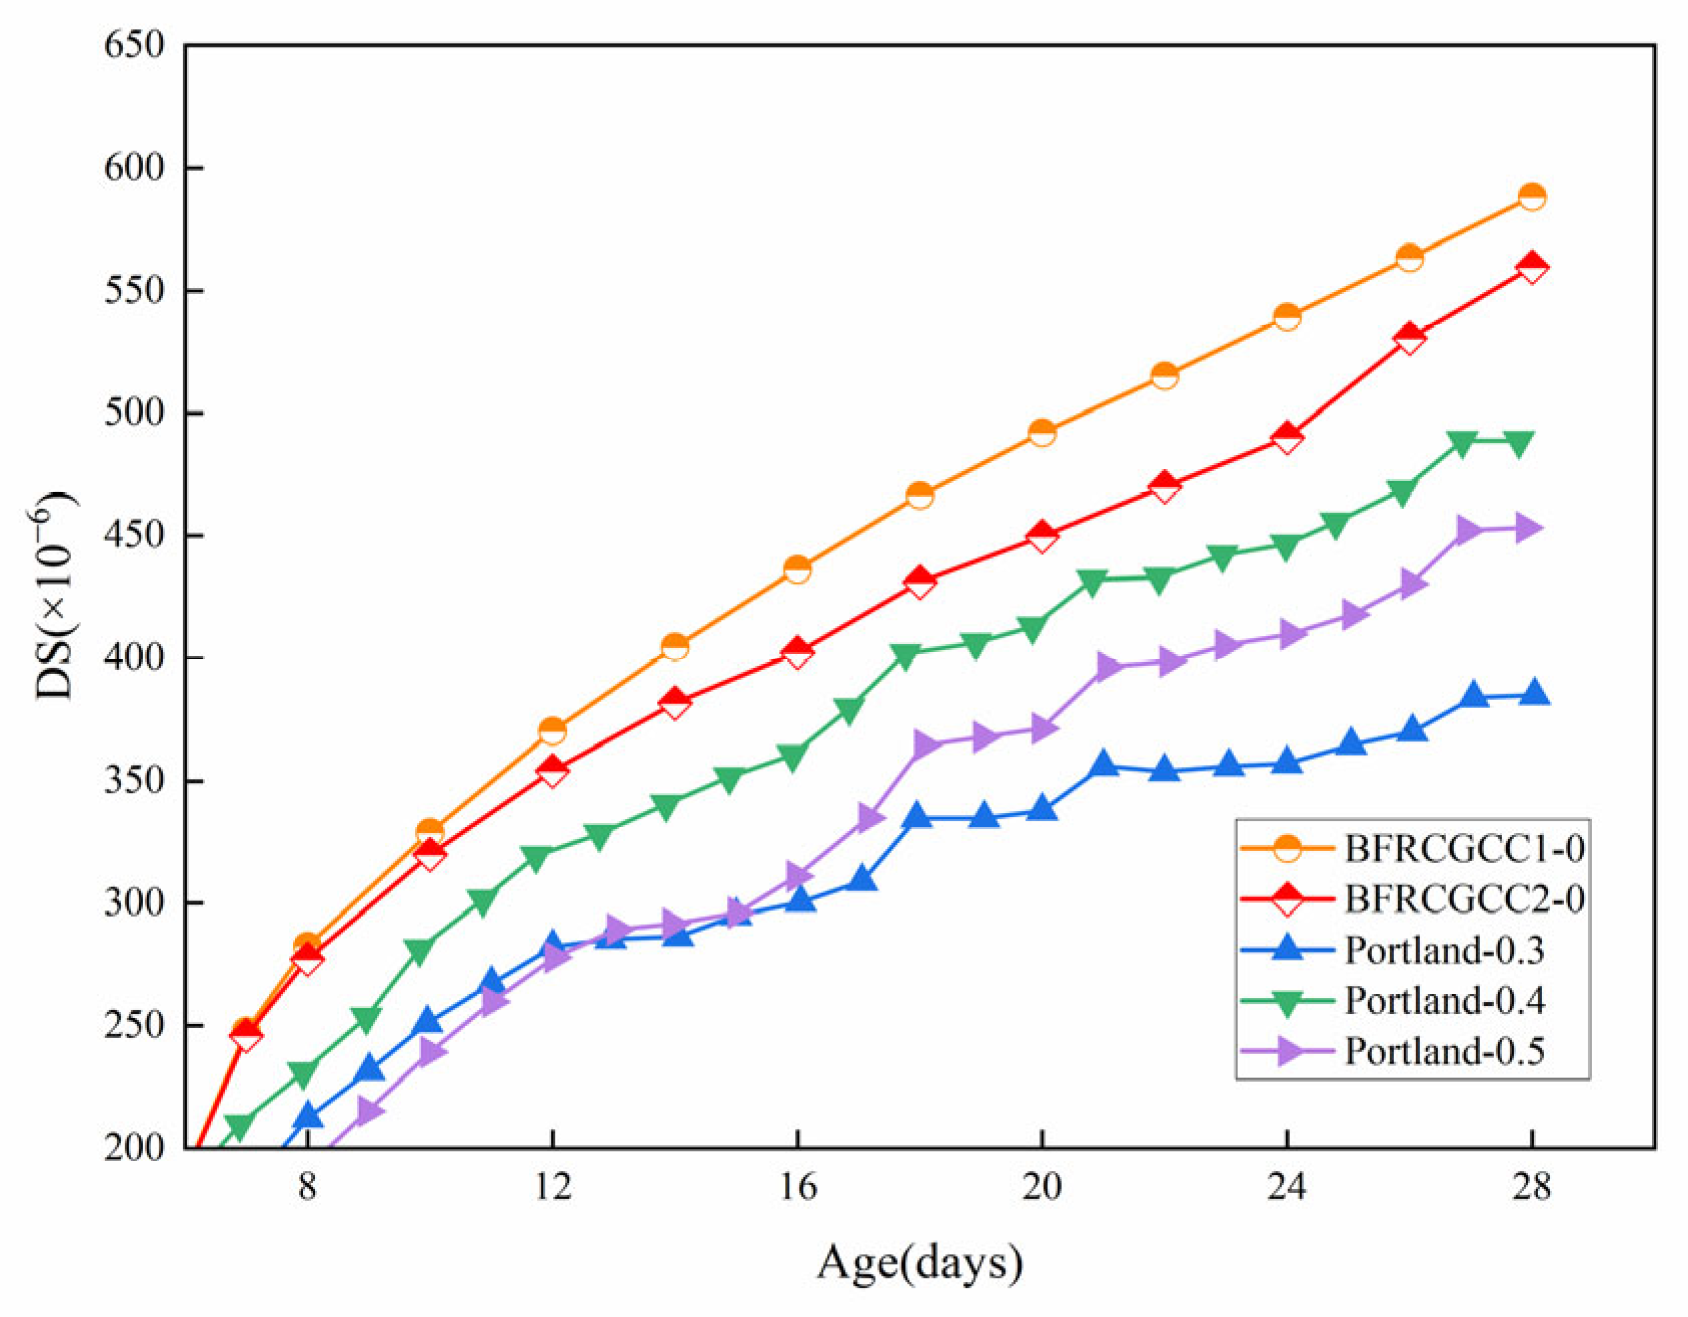
The results of this study indicate that CGCC exhibits significantly higher drying shrinkage than ordinary Portland cement concrete (OPC). As shown in Figure 30, the 28-day drying shrinkage values of BFRCGCC1-0 and BFRCGCC2-0 both exceeded 550 × 10−6, while the OPC shrinkage values reported in Reference [74] under similar mix proportions and curing conditions ranged between 380~500 × 10−6.
The rigid restraint effect of aggregate is the primary factor responsible for the difference in shrinkage. In ordinary concrete, the dense, high-elastic-modulus crushed-stone aggregate provides strong physical restraint to the matrix, effectively inhibiting its shrinkage deformation. However, the coal gangue ceramsite used in this study has a relatively low elastic modulus, resulting in a much weaker restraining effect on the shrinkage of the surrounding matrix compared to conventional aggregate, which ultimately leads to greater macroscopic shrinkage deformation.

5. Conclusions

Through experimental and analytical investigation, the conclusions can be summarized as follows:
  • The addition of basalt fiber affects the internal humidity and electrical resistivity of CGCC; both the internal humidity and the electrical resistivity increased with the increment of fiber dosage.
  • CGCC exhibits rapid drying shrinkage development during the initial stage, followed by progressive stabilization in the subsequent stage. It was found that a basalt fiber dosage of 0.3% was optimal, reducing the 90 d drying shrinkage by 20.67%.
  • Variations in the internal humidity and electrical resistivity of the concrete serve as indicators for the drying shrinkage of the matrix. The internal humidity and the electrical resistivity may be introduced to verify the drying shrinkage of BFRCGCC.
  • The improved AFREM model’s predicted values of drying shrinkage are consistent with the test values, providing an effective tool for predicting drying shrinkage of the BFRCGCC. The findings can serve as a theoretical basis for shrinkage control and structural design of CGCC, offering significant technical guidance for engineering applications.
Future research will focus on the following: (1) Extending the testing period to evaluate the long-term drying shrinkage behavior of BFRCGCC and further investigate durability indicators such as crack resistance, freeze–thaw resistance, and carbonation resistance, thereby providing more reliable data to support its large-scale engineering application. (2) Exploring the synergistic effects of other fiber types (e.g., polypropylene fiber, steel fiber) or the combination of basalt fiber with other materials (e.g., admixtures, nanomaterials) on the performance of CGCC, aiming to identify superior modification strategies.

Author Contributions

Writing—review and editing, S.L., S.W. and D.L.; Writing—original draft, X.R.; Methodology, S.L. and D.L.; Project administration, S.L. and D.L.; Investigation, X.R., S.W. and D.L.; Formal analysis, X.R.; Data curation, X.R. and S.W. All authors have read and agreed to the published version of the manuscript.

Funding

The research was funded by the Scientific Research Fund of Liaoning Provincial Education Department (Grant number JYTMS20230817).

Data Availability Statement

Data will be made available upon request.

Conflicts of Interest

The authors declare no conflict of interest.

References

  1. Karimaei, M.; Dabbaghi, F.; Sadeghi-Nik, A.; Dehestani, M. Mechanical performance of green concrete produced with un-treated coal waste aggregates. Constr. Build. Mater. 2020, 233, 117264. [Google Scholar] [CrossRef]
  2. Liu, M.; Yao, P.; Zhao, Z.-W.; Li, D.; Wang, J.-L. Experimental and numerical studies on mechanical behavior of coal gangue concrete filled round-ended steel tube stub columns under double local compression. Structures 2025, 74, 108640. [Google Scholar] [CrossRef]
  3. Ashfaq, M.; Heeralal, M.; Moghal, A.A.B. Characterization studies on coal gangue for sustainable geotechnics. Innov. Infrastruct. Solutions 2020, 5, 15. [Google Scholar] [CrossRef]
  4. Querol, X.; Izquierdo, M.; Monfort, E.; Alvarez, E.; Font, O.; Moreno, T.; Alastuey, A.; Zhuang, X.; Lu, W.; Wang, Y. Environmental characterization of burnt coal gangue banks at Yangquan, Shanxi Province, China. Int. J. Coal Geol. 2008, 75, 93–104. [Google Scholar] [CrossRef]
  5. Gao, S.; Zhao, G.; Guo, L.; Zhou, L.; Yuan, K. Utilization of coal gangue as coarse aggregates in structural concrete. Constr. Build. Mater. 2021, 268, 121212. [Google Scholar] [CrossRef]
  6. He, Y.; Li, G.; Li, H.; Lü, L.; He, L. Ceramsite containing iron oxide and its use as functional aggregate in microwave absorbing cement-based materials. J. Wuhan Univ. Technol. Sci. Ed. 2018, 33, 133–138. [Google Scholar] [CrossRef]
  7. Ghone, M.O.; Long, G.; Yang, K.; Ma, X.; Islam, N. Toughness improvement of low strength ceramsite lightweight concrete by polypropylene fiber and recycled rubber particle. Constr. Build. Mater. 2024, 422, 135716. [Google Scholar] [CrossRef]
  8. Ma, S.; Tan, S.; Pan, Y.; Gu, Y. Experimental study on fiber-reinforced ceramsite concrete composite wall panel and correction of seismic damage model. Structures 2024, 59, 105805. [Google Scholar] [CrossRef]
  9. Pettmann, M.; Beaucour, A.-L.; Eslami, J.; Tysmans, T.; Aggelis, D.G.; Noumowe, A. A comprehensive study of damage mechanisms in very lightweight aggregates concretes submitted to high temperatures. Constr. Build. Mater. 2023, 404, 133251. [Google Scholar] [CrossRef]
  10. Palamarchuk, A.; Yudaev, P.; Chistyakov, E. Polymer Concretes Based on Various Resins: Modern Research and Modeling of Mechanical Properties. J. Compos. Sci. 2024, 8, 503. [Google Scholar] [CrossRef]
  11. Li, M.; Wang, Y.; Ren, J.; Zhao, H.; Zhuang, S.; Wang, J. Evaluation and prediction of fatigue life for ceramsite lightweight concrete considering the effects of ceramsite aggregate size and content. Case Stud. Constr. Mater. 2024, 21, e03613. [Google Scholar] [CrossRef]
  12. Ma, H.; Zhu, H.; Wu, C.; Fan, J.; Yang, S.; Hang, Z. Effect of shrinkage reducing admixture on drying shrinkage and durability of alkali-activated coal gangue-slag material. Constr. Build. Mater. 2021, 270, 121372. [Google Scholar] [CrossRef]
  13. Zhang, J.; Victor, C.L. Influences of Fibers on Drying Shrinkage of Fiber-Reinforced Cementitious Composite. J. Eng. Mech. 2001, 127, 37–44. [Google Scholar] [CrossRef]
  14. Afroughsabet, V.; Teng, S. Experiments on drying shrinkage and creep of high performance hybrid-fiber-reinforced concrete. Cem. Concr. Compos. 2020, 106, 103481. [Google Scholar] [CrossRef]
  15. Yousefieh, N.; Joshaghani, A.; Hajibandeh, E.; Shekarchi, M. Influence of fibers on drying shrinkage in restrained concrete. Constr. Build. Mater. 2017, 148, 833–845. [Google Scholar] [CrossRef]
  16. Jiang, C.; Fan, K.; Wu, F.; Chen, D. Experimental study on the mechanical properties and microstructure of chopped basalt fibre reinforced concrete. Mater. Des. 2014, 58, 187–193. [Google Scholar] [CrossRef]
  17. Katkhuda, H.; Shatarat, N. Improving the mechanical properties of recycled concrete aggregate using chopped basalt fibers and acid treatment. Constr. Build. Mater. 2017, 140, 328–335. [Google Scholar] [CrossRef]
  18. Elshazli, M.T.; Ramirez, K.; Ibrahim, A.; Badran, M. Mechanical, Durability and Corrosion Properties of Basalt Fiber Concrete. Fibers 2022, 10, 10. [Google Scholar] [CrossRef]
  19. Ramesh, B.; Eswari, S. Mechanical behaviour of basalt fibre reinforced concrete: An experimental study. Mater. Today Proc. 2021, 43, 2317–2322. [Google Scholar] [CrossRef]
  20. GB/T 50081-2019; Ministry of Housing and Urban Rural Development of the People’s Republic of China. Standard for Test Methods of Concrete Physical and Mechanical Properties. China State Engineering and Construction Press: Beijing, China, 2019. (In Chinese)
  21. ISO 1920-4:2005; Testing of Concrete—Part 4: Strength of Hardened Concrete. ISO: Geneva, Switzerland, 2005.
  22. EN 12390-1:2012; Testing Hardened Concrete—Part 1: Shape, Dimensions and other Requirements for Specimens and Moulds. CEN: Brussels, Belgium, 2012.
  23. EN 12390-2:2019; Testing Hardened Concrete—Part 2: Making and Curing Specimens for Strength Tests. CEN: Brussels, Belgium, 2019.
  24. EN 12390-3:2019; Testing Hardened Concrete—Part 3: Compressive Strength of Test Specimens. CEN: Brussels, Belgium, 2019.
  25. EN 12390-4:2019; Testing Hardened Concrete—Part 4: Compressive Strength—Specification for Testing Machines. CEN: Brussels, Belgium, 2019.
  26. EN 13578:2003; Testing of Concrete in Structures-Determination of Moisture Condition. CEN: Brussels, Belgium, 2003.
  27. Shen, D.; Liu, C.; Wang, M.; Jin, X.; Tang, H. Prediction model for internal relative humidity in early-age concrete under different curing humidity conditions. Constr. Build. Mater. 2020, 265, 119987. [Google Scholar] [CrossRef]
  28. Shen, D.; Wang, T.; Chen, Y.; Wang, M.; Jiang, G. Effect of internal curing with super absorbent polymers on the relative humidity of early-age concrete. Constr. Build. Mater. 2015, 99, 246–253. [Google Scholar] [CrossRef]
  29. Jiayu, H.; Yuanzhen, L.; Zhaoxu, W.; Xiaowei, D. Prediction model of internal humidity and drying shrinkage of recycled aggregate thermal insulation concrete. Acta Mater. Compos. Sin. 2022, 39, 4788–4800. (In Chinese) [Google Scholar]
  30. Chindaprasirt, P.; Rukzon, S.; Sirivivatnanon, V. Effect of carbon dioxide on chloride penetration and chloride ion diffusion coefficient of blended Portland cement mortar. Constr. Build. Mater. 2008, 22, 1701–1707. [Google Scholar] [CrossRef]
  31. Jin, M.; Jiang, L.; Zhu, Q. Monitoring chloride ion penetration in concrete with different mineral admixtures based on embedded chloride ion selective electrodes. Constr. Build. Mater. 2017, 143, 1–15. [Google Scholar] [CrossRef]
  32. Jiang, Z.; Sun, Z.; Wang, P. Internal relative humidity distribution in high-performance cement paste due to moisture diffusion and self-desiccation. Cem. Concr. Res. 2006, 36, 320–325. [Google Scholar] [CrossRef]
  33. Zhou, J.; Chen, X.; Zhang, J.; Wang, Y. Internal relative humidity distribution in concrete considering self-desiccation at early ages. Int. J. Phys. Sci. 2011, 6, 1604–1610. [Google Scholar]
  34. GB/T 50082-2024; Ministry of Housing and Urban Rural Development of the People’s Republic of China. Standard for Test Methods of Long-Term Performance and Durability of Concrete. China State Engineering and Construction Press: Beijing, China, 2024. (In Chinese)
  35. EN 12390-16:2019; Testing Hardened Concrete—Part 16: Determination of the Shrinkage of Concrete. CEN: Brussels, Belgium, 2019.
  36. Chu, H.-Y.; Chen, J.-K. The experimental study on the correlation of resistivity and damage for conductive concrete. Cem. Concr. Compos. 2016, 67, 12–19. [Google Scholar] [CrossRef]
  37. Han, B.; Guan, X.; Ou, J. Electrode design, measuring method and data acquisition system of carbon fiber cement paste piezoresistive sensors. Sensors Actuators A Phys. 2007, 135, 360–369. [Google Scholar] [CrossRef]
  38. Niu, D.; Su, L.; Luo, Y.; Huang, D.; Luo, D. Experimental study on mechanical properties and durability of basalt fiber reinforced coral aggregate concrete. Constr. Build. Mater. 2020, 237, 117628. [Google Scholar] [CrossRef]
  39. Kizilkanat, A.B.; Kabay, N.; Akyüncü, V.; Chowdhury, S.; Akça, A.H. Mechanical properties and fracture behavior of basalt and glass fiber reinforced concrete: An experimental study. Constr. Build. Mater. 2015, 100, 218–224. [Google Scholar] [CrossRef]
  40. Wang, D.; Ju, Y.; Shen, H.; Xu, L. Mechanical properties of high performance concrete reinforced with basalt fiber and polypropylene fiber. Constr. Build. Mater. 2019, 197, 464–473. [Google Scholar] [CrossRef]
  41. Bentur, A.; Mindess, S. Fibre Reinforced Cementitious Composites; CRC Press: Boca Raton, FL, USA, 2006. [Google Scholar]
  42. Ding, Y.; Zhang, Y.; Thomas, A. The investigation on strength and flexural toughness of fibre cocktail reinforced self-compacting high performance concrete. Constr. Build. Mater. 2009, 23, 448–452. [Google Scholar] [CrossRef]
  43. Naaman, A.E. Fiber Reinforced Cement and Concrete Composites; Techno Press: Sarasota, FL, USA, 2018. [Google Scholar]
  44. Li, J.; Zha, W.; Lv, W.; Xu, T.; Wang, B.; Wang, B. Mechanical properties and sulfate resistance of basalt fiber-reinforced alkali-activated fly ash-slag-based coal gangue pervious concrete. Case Stud. Constr. Mater. 2024, 21, e03961. [Google Scholar] [CrossRef]
  45. Plagué, T.; Desmettre, C.; Charron, J.-P. Influence of fiber type and fiber orientation on cracking and permeability of reinforced concrete under tensile loading. Cem. Concr. Res. 2017, 94, 59–70. [Google Scholar] [CrossRef]
  46. Hsie, M.; Tu, C.; Song, P. Mechanical properties of polypropylene hybrid fiber-reinforced concrete. Mater. Sci. Eng. A 2008, 494, 153–157. [Google Scholar] [CrossRef]
  47. Wu, D.; Cai, S.-J. Coupled effect of cement hydration and temperature on hydraulic behavior of cemented tailings backfill. J. Central South Univ. 2015, 22, 1956–1964. [Google Scholar] [CrossRef]
  48. Shen, D.; Wang, M.; Chen, Y.; Wang, T.; Zhang, J. Prediction model for relative humidity of early-age internally cured concrete with pre-wetted lightweight aggregates. Constr. Build. Mater. 2017, 144, 717–727. [Google Scholar] [CrossRef]
  49. Li, Z.; Lara, M.A.P.; Bolander, J. Restraining effects of fibers during non-uniform drying of cement composites. Cem. Concr. Res. 2006, 36, 1643–1652. [Google Scholar] [CrossRef]
  50. Li, Y.; Shen, A.; Wu, H. Fractal Dimension of Basalt Fiber Reinforced Concrete (BFRC) and Its Correlations to Pore Structure, Strength and Shrinkage. Materials 2020, 13, 3238. [Google Scholar] [CrossRef]
  51. Mastali, M.; Kinnunen, P.; Isomoisio, H.; Karhu, M.; Illikainen, M. Mechanical and acoustic properties of fiber-reinforced alkali-activated slag foam concretes containing lightweight structural aggregates. Constr. Build. Mater. 2018, 187, 371–381. [Google Scholar] [CrossRef]
  52. Deng, G.; Guo, R.; Ma, L.; Long, Z.; Xu, F.; Yin, C.; Xu, X. Study on dynamic mechanical properties and microstructure of basalt fiber reinforced coral sand cement composite. Constr. Build. Mater. 2024, 425, 136024. [Google Scholar] [CrossRef]
  53. Yang, W.; Tang, Z.; Wu, W.; Zhang, K.; Yuan, J.; Li, H.; Feng, Z. Effect of different fibers on impermeability of steam cured recycled concrete. Constr. Build. Mater. 2022, 328, 127063. [Google Scholar] [CrossRef]
  54. Li, Y.; Zhang, J.; He, Y.; Huang, G.; Li, J.; Niu, Z.; Gao, B. A review on durability of basalt fiber reinforced concrete. Compos. Sci. Technol. 2022, 225, 109519. [Google Scholar] [CrossRef]
  55. Liao, Y.; Wei, X.; Li, G. Early hydration of calcium sulfoaluminate cement through electrical resistivity measurement and microstructure investigations. Constr. Build. Mater. 2011, 25, 1572–1579. [Google Scholar] [CrossRef]
  56. Xiao, L.; Li, Z. Early-age hydration of fresh concrete monitored by non-contact electrical resistivity measurement. Cem. Concr. Res. 2008, 38, 312–319. [Google Scholar] [CrossRef]
  57. Lee, N.K.; Tafesse, M.; Lee, H.K.; Alemu, A.S.; Kim, S.W.; Kim, H.-K. Electrical resistivity stability of CNT/cement composites after further hydration: A simple evaluation with an accelerated method. Constr. Build. Mater. 2022, 317, 125830. [Google Scholar] [CrossRef]
  58. Peng, Y.; Gong, F.; Wang, Z.; Zhao, Y.; Jin, W.; Meng, T.; Maekawa, K. Experimental study on time-dependent DC resistivity of cement-based material considering microstructure and ion concentration. Constr. Build. Mater. 2022, 363, 129830. [Google Scholar] [CrossRef]
  59. Yousuf, F.; Xiaosheng, W. Early strength development and hydration of cement pastes at different temperatures or with superplasticiser characterised by electrical resistivity. Case Stud. Constr. Mater. 2022, 16, e00911. [Google Scholar] [CrossRef]
  60. Su, J.; Yang, C.; Wu, W.; Huang, R. Effect of moisture content on concrete resistivity measurement. J. Chin. Inst. Eng. 2002, 25, 117–122. [Google Scholar] [CrossRef]
  61. Sun, Z.; Niu, D.; Zhang, L.; Zhang, J. Resistivity model of basalt-polypropylene fiber reinforced concrete. J. Funct. Mater. 2021, 52, 12190–12195. (In Chinese) [Google Scholar] [CrossRef]
  62. Bazant, Z.P.; Baweja, S. Creep and Shrinkage Prediction Model for Analysis and Design of Concrete Structures: Model B3-Short Form. SP-194: The Adam Neville Symposium: Creep and Shrinkage-Structural Design Effects. ACI Spec. Publ. 2000, 194, 85–100. [Google Scholar]
  63. Gardner, N.J.; Lockman, M. Design provisions for drying shrinkage and creep of normal-strength concrete. Mater. J. 2001, 98, 159–167. [Google Scholar]
  64. Comite Euro-International du Beton. CEB-FIP Model Code 1990. Bull. D’Information 1993, 42, 43–50. [Google Scholar]
  65. Walraven, J.C.; Bigaj-van Vliet, A. The 2010 fib Model Code for Structural Concrete: A new approach to structural engineering. Struct. Concr. 2011, 12, 139–147. [Google Scholar] [CrossRef]
  66. Zhang, H.; Xiao, J.; Tang, Y.; Duan, Z.; Poon, C.-S. Long-term shrinkage and mechanical properties of fully recycled aggregate concrete: Testing and modelling. Cem. Concr. Compos. 2022, 130, 104527. [Google Scholar] [CrossRef]
  67. Bryant, A.H.; Vadhanavikkit, C. Creep, shrinkage-size, and age at loading effects. Mater. J. 1987, 84, 117–123. [Google Scholar]
  68. Leroy, R. The AFREM code type model for creep and shrinkag of high-performance concrete. In Proceedings of the 4th International Symposium on Utilization of High-Strength/High-Performance Concrete, Paris, France, 29–31 May 1996; pp. 387–389. [Google Scholar]
  69. Huang, Y.; Fu, J.; Wang, R.; Rao, R.; Ma, N. Experimental study on creep behavior of high-strength concrete filled steel tubular (HSCFST) columns. Case Stud. Constr. Mater. 2023, 20, e02690. [Google Scholar] [CrossRef]
  70. Wang, Y.; Geng, Y.; Ranzi, G.; Zhang, S. Time-dependent behaviour of expansive concrete-filled steel tubular columns. J. Constr. Steel Res. 2011, 67, 471–483. [Google Scholar] [CrossRef]
  71. Yoo, D.-Y.; Kim, S.; Kim, M.-J. Comparative shrinkage behavior of ultra-high-performance fiber-reinforced concrete under ambient and heat curing conditions. Constr. Build. Mater. 2018, 162, 406–419. [Google Scholar] [CrossRef]
  72. Lv, Z.; Liu, C.; Zhu, C.; Bai, G.; Qi, H. Experimental Study on a Prediction Model of the Shrinkage and Creep of Recycled Aggregate Concrete. Appl. Sci. 2019, 9, 4322. [Google Scholar] [CrossRef]
  73. Zhang, J.; Dongwei, H.; Wei, S. Experimental study on the relationship between shrinkage and interior humidity of concrete at early age. Mag. Concr. Res. 2010, 62, 191–199. [Google Scholar] [CrossRef]
  74. Yang, Y.Z.; Li, M.G.; Deng, H.W.; Liu, Q. Effects of Temperature on Drying Shrinkage of Concrete. Appl. Mech. Mater. 2014, 584–586, 1176–1181. [Google Scholar] [CrossRef]
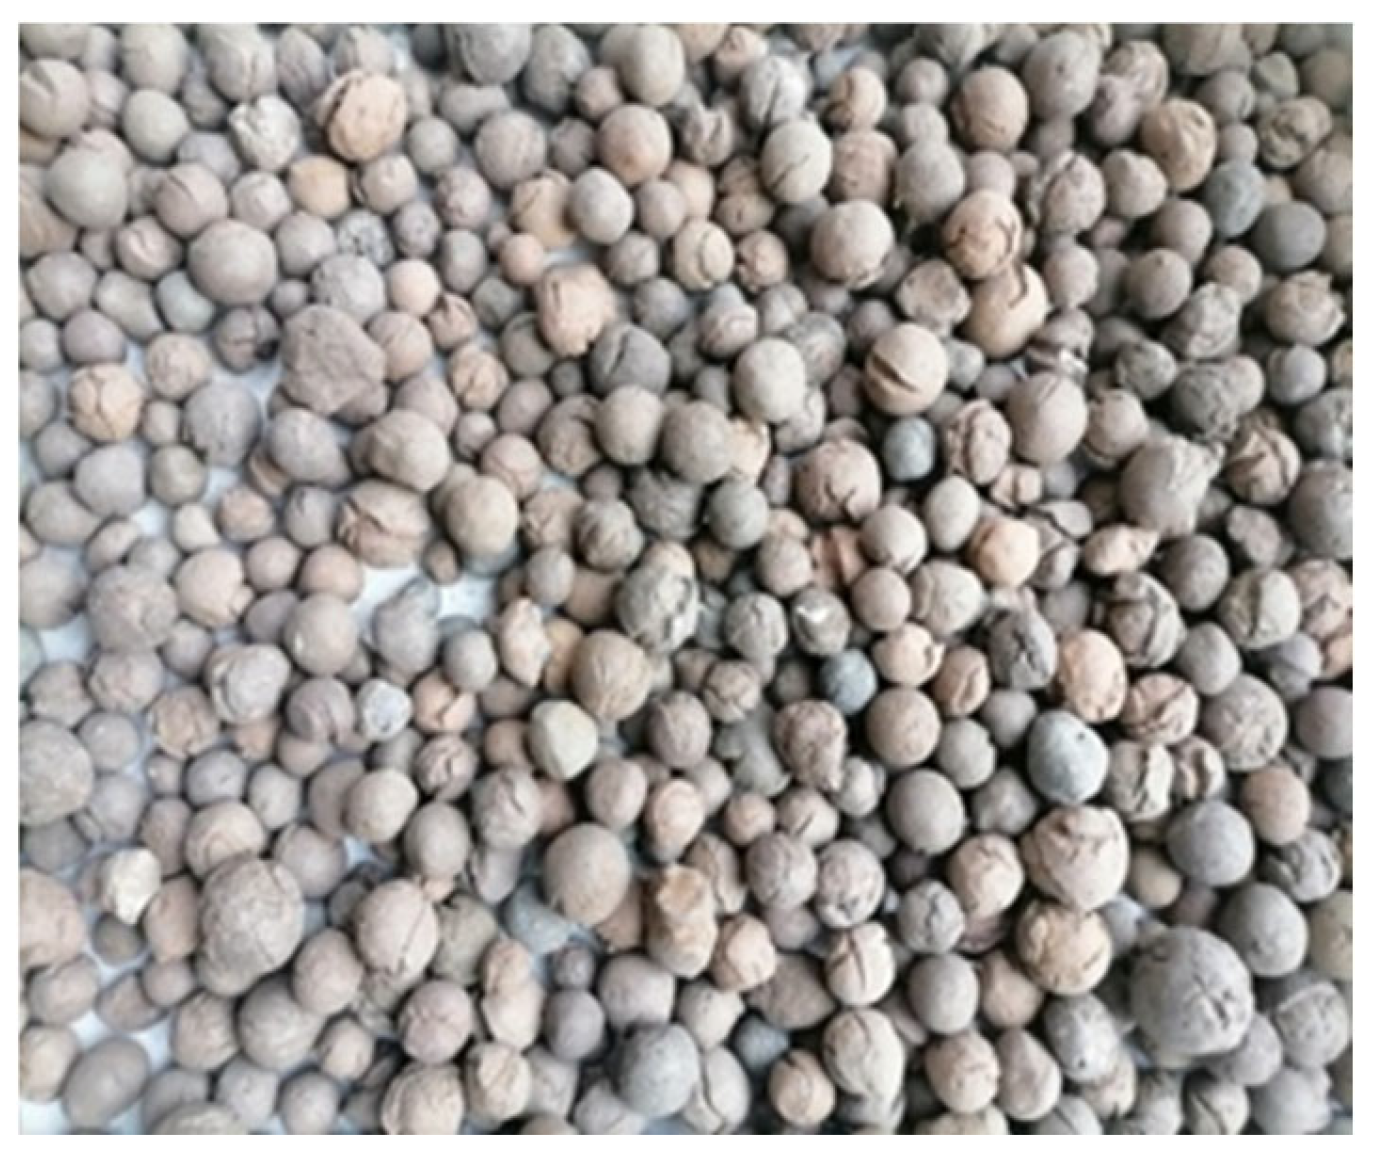
Figure 1. Coal gangue ceramsite.
Materials 18 04627 g001
Figure 2. Basalt fiber.
Materials 18 04627 g002
Figure 3. The arrangement of the measuring device for the IH test.
Materials 18 04627 g003
Figure 4. Comparison of the DS test device.
Materials 18 04627 g004
Figure 5. Specimens for ER testing.
Materials 18 04627 g005
Figure 6. Variation of the IH of BFRCGCC.
Materials 18 04627 g006
Figure 7. Decay rate of the IH of BFRCGCC.
Materials 18 04627 g007
Figure 8. DS of the BFRCGCC.
Materials 18 04627 g008
Figure 9. Variation in the DS of BFRCGCC.
Materials 18 04627 g009
Figure 10. Variation in the ER of BFRCGCC.
Materials 18 04627 g010
Figure 11. Relationship between IH and fiber dosage at different curing ages.
Materials 18 04627 g011
Figure 12. Relationship between Kt and curing age.
Materials 18 04627 g012
Figure 13. Comparison between experimental values and predicted values of the IH of the samples.
Materials 18 04627 g013
Figure 14. Comparison between experimental and calculated values.
Materials 18 04627 g014
Figure 15. Comparison between the predicted values and test values of DS of the samples.
Materials 18 04627 g015
Figure 16. Relationship between test and predicted values of DS.
Materials 18 04627 g016
Figure 17. Comparison between the test values and the predicted values by the revised AFREM model.
Materials 18 04627 g017
Figure 18. Relationship between KBF and fiber dosage at different curing ages.
Materials 18 04627 g018
Figure 19. Fitting results of λt and Pt.
Materials 18 04627 g019
Figure 20. Comparison between experimental values and predicted values of DS.
Materials 18 04627 g020
Figure 21. Comparison between the revised AFREM model and Li’s experimental values.
Materials 18 04627 g021
Figure 22. Fitting results of ER of CGCC.
Materials 18 04627 g022
Figure 23. Relationship between ER and fiber dosage at different curing ages.
Materials 18 04627 g023
Figure 24. Fitting results of Rta and Rtb.
Materials 18 04627 g024
Figure 25. Comparison between experimental values and predicted values of ER.
Materials 18 04627 g025
Figure 26. The variations in DS and IH with curing ages.
Materials 18 04627 g026
Figure 27. Relationship between the DS and IH reduction in the samples.
Materials 18 04627 g027
Figure 28. The variation of ER and DS with curing ages.
Materials 18 04627 g028
Figure 29. Relationship between ER and DS.
Materials 18 04627 g029
Figure 30. Comparison of measured values with those of Portland cement concrete.
Materials 18 04627 g030
Table 1. The basic mix proportion of CGCC (kg/m3).
TypesCementWaterSandCoal Gangue CeramsiteWater Reducer
CGCC13801526536413.8
CGCC24501626236584.5
Table 2. The properties of cement.
TypeDensity/
(kg/m3)
Specific Surface Area/
(m2/kg)
Particle Size Distribution/μmStandard Consistency Water Consumption/%Condensation Time/MinCompressive Strength/MPa
D10D50D90Initial CondensationFinal Condensation3 Days28 Days
P·O42.530103432.7216.8857.4226.118124027.951.8
Table 3. The properties of coal gangue ceramsite.
Bulk Density/(kg/m3)Apparent Density/(kg/m3)Cylinder Compressive Strength/MPaMud Content/%Water Absorption Rate/%
84413216.2<0.18.4
Table 4. Physical properties of the basalt fiber.
Length/mmDiameter/μmDensity/(kg/m3)Modulus of Elasticity/GPaTensile Strength/MPaUltimate Elongation/%
357~15265010042002~3
Table 5. Summary of the types of specimens.
TypesFiber Dosage
BFRCGCC1BFRCGCC1-00
BFRCGCC1-10.1%
BFRCGCC1-20.2%
BFRCGCC1-30.3%
BFRCGCC2BFRCGCC2-00
BFRCGCC2-10.1%
BFRCGCC2-20.2%
BFRCGCC2-30.3%
Note: for the types of BFRCGCCX-Y, X means the water–cement ratio of the matrix, 1—water–cement ratio 0.40, 2—water–cement ratio 0.36; Y means the CGCC with basalt fiber dosage of 0.Y%.
Table 6. Compressive strength of the specimens with different fiber dosages.
TypesCompressive Strength
/MPa
Variation/%95% Confidence Interval/MPa
BFRCGCC1-037.3--34.8~37.7
BFRCGCC1-136.7−1.6
BFRCGCC1-235.8−4.0
BFRCGCC1-335.3−5.4
BFRCGCC2-051.2--49.4~51.3
BFRCGCC2-150.4−1.6
BFRCGCC2-250.1−2.1
BFRCGCC2-349.8−2.7
Table 7. Regression analysis results of the IH of the CGCC without any reinforcement.
TypesabR2
BFRCGCC1-02.380.510.982
BFRCGCC2-04.810.410.971
Table 8. Fitting results of Kt.
TypesParameterAge/d
3714285690
BFRCGCC1Kt0.7340.9261.0451.1881.3691.544
R20.9560.9260.9390.9590.9920.899
BFRCGCC2Kt1.211.1581.1781.4052.0842.113
R20.8890.9770.9600.8640.9890.861
Table 9. Results of RMSE and MAPE of the samples.
TypesBFRCGCC1-0BFRCGCC1-1BFRCGCC1-2BFRCGCC1-3BFRCGCC2-0BFRCGCC2-1BFRCGCC2-2BFRCGCC2-3
RMSE0.8340.2930.2090.1650.8970.3160.3480.429
MAPE0.79%0.28%0.19%0.14%0.93%0.31%0.31%0.39%
Table 10. Values of the λt and Pt.
TypesCoefficientsAge/d
3714285690
BFRCGCC1λt−530.44−441.25−378.93−327.04−289.92−237.43
Pt0.9340.9450.9520.9630.9690.971
R20.9160.9260.9410.9270.9820.947
BFRCGCC2λt−482.24−418.88−370.09−340.46−268.54−241.15
Pt0.9550.9550.9700.9780.9840.991
R20.9050.9270.9500.9640.9490.961
Table 11. Results of the RMSE, NRMSE, and MAPE.
TypesBFRCGCC1-0BFRCGCC1-1BFRCGCC1-2BFRCGCC1-3BFRCGCC2-0BFRCGCC2-1BFRCGCC2-2BFRCGCC2-3
RMSE15.433 × 10−611.098 × 10−612.308 × 10−615.111 × 10−619.520 × 10−614.828 × 10−611.165 × 10−69.281 × 10−6
NRMSE0.0200.0160.0200.0260.0270.0230.0180.016
MAPE3.78%2.59%2.88%4.50%4.67%4.27%3.29%2.49%
Note: RMSE is Root Mean Square Error, NRMSE is Normalized Root Mean Square Error, MAPE is Mean Absolute Percentage Error.
Table 12. Values of Rta and Rtb of different ages.
TypesCoefficientsAge/d
3714285690
BFRCGCC1Rta11.3411.3512.6127.536.3430.69
Rtb0.660.610.550.540.550.57
R20.9540.7260.8160.8320.9820.811
BFRCGCC2Rta8.8226.3336.8253.1658.8645.42
Rtb0.4320.3530.3020.2870.2720.311
R20.7720.8190.7720.9450.9410.861
Table 13. Results of the RMSE, NRMSE, and MAPE of ER.
TypesBFRCGCC1-1BFRCGCC1-2BFRCGCC1-3BFRCGCC2-1BFRCGCC2-2BFRCGCC2-3
RMSE12.77915.71313.96215.78414.79520.680
NRMSE0.0220.0320.0320.0250.0280.042
MAPE1.50%1.76%1.34%1.71%1.58%2.19%
Table 14. Regression results of the relationship between IH reduction and DS.
TypesA1B1C1R2
BFRCGCC1-0−640.40436.351.550.997
BFRCGCC1-1−380.91349.171.700.986
BFRCGCC1-2−462.85354.412.010.986
BFRCGCC1-3−578.60373.913.720.985
BFRCGCC2-0−1533.07630.836.320.993
BFRCGCC2-1−1103.46511.454.500.992
BFRCGCC2-2−624.39380.871.150.986
BFRCGCC2-3−459.27327.720.390.982
Table 15. Fitting results of the relationship between the DS and ER.
TypesA2B2C2R2
BFRCGCC1-0−1210.3340.1334.890.992
BFRCGCC1-1−1185.85304.9329.340.951
BFRCGCC1-2−1180.7289.6127.030.998
BFRCGCC1-3−906.22244.5125.090.997
BFRCGCC2-0−1611.41360.9671.010.993
BFRCGCC2-1−1452.6321.5355.090.993
BFRCGCC2-2−1188.24280.6140.530.996
BFRCGCC2-3−890.37233.9030.680.999
Disclaimer/Publisher’s Note: The statements, opinions and data contained in all publications are solely those of the individual author(s) and contributor(s) and not of MDPI and/or the editor(s). MDPI and/or the editor(s) disclaim responsibility for any injury to people or property resulting from any ideas, methods, instructions or products referred to in the content.