Article

The Effect of H2O and CO2 on the Adsorption Behavior of H2 and CO on Hematite

1
Jiangxi General Institute of Testing and Certification, Nanchang 330052, China
2
School of Resources & Environment, Nanchang University, Nanchang 330031, China
3
State Key Laboratory of Advanced Metallurgy, University of Science and Technology Beijing, Beijing 100083, China
*
Authors to whom correspondence should be addressed.
These authors contributed equally to this work.
Materials 2025, 18(17), 4175; https://doi.org/10.3390/ma18174175
Submission received: 31 July 2025 / Revised: 25 August 2025 / Accepted: 2 September 2025 / Published: 5 September 2025

Abstract

The adsorption of gas reactant molecules (H2, CO, etc.) to the surface of hematite is the premise of chemical reaction. In order to further promote the basic research on the reaction mechanism of hematite reduction by a H2-CO gas mixture, the adsorption behavior of H2 (or CO) under the conditions of pre-adsorbed H2O (or CO2) was systematically studied by the density functional theory (DFT) combined with reduction experiments. The results indicate that the gas molecules (H2, CO, H2O and CO2) adsorbed on the Fe atom of the Fe2O3 (001) surface rather than the O atom, and the adsorption energy of the Fe2O3-CO adsorption system was relatively minimum (−1.317 eV), indicating that the Fe2O3-CO adsorption system was more stable. In addition, the adsorption energy of the H2 molecule adsorbed to the Fe2O3-H2O adsorption system was −0.132 eV, which was smaller than that of the H2 molecule directly adsorbed to Fe2O3 (−0.013 eV), indicating that the H2O molecule pre-adsorption was beneficial to the H2 molecule adsorption. Compared with the H2O molecule, the CO2 molecule had relatively less influence on the adsorption and subsequent behavior of CO with Fe2O3. From the experiment analysis results, on the whole, CO2 had a greater impact on the gas diffusion, while H2O had a greater impact on the interfacial chemical reaction (gas adsorption), which was consistent with the DFT calculation results.

1. Introduction

The iron industry is a globally important and fundamental industry, and the energy utilization structure of its production process poses a serious challenge to the environment [1]. The energy resource of the mainstream blast furnace–basic oxygen furnace (BF-BOF) route for ironmaking relies mostly on fossil fuel such as furnace coke and pulverized coal (mainly carbonaceous energy) [2,3]. The combustion of fossil fuel provides high-temperature heat and reducing agents, which is inevitably accompanied with huge CO2 (carbon dioxide) emissions [4,5,6]. Excessive emissions of the greenhouse gas CO2 have exacerbated global climate change, ocean acidification and other systemic environmental crises. As a result, the promotion of carbon-reducing transformation of the iron industry has become an urgent imperative [7]. Currently, it is difficult to completely replace blast furnaces for ironmaking. Therefore, the use of a H2-CO (hydrogen–carbon monoxide) gas mixture as a reducing agent to replace part of furnace coke for ironmaking is regarded as an important technology due to its significant reduction of direct CO2 emissions [8,9].
Understanding the reaction behavior and mechanism of the iron ore reduction by a H2-CO gas mixture is crucial for establishing a fundamental scientific basis for a green and efficient ironmaking industry [10,11]. Turkdogan et al. [12] observed that when reducing low-porosity hematite samples including synthetic oxides with a H2-CO gas mixture, there was no significant difference in the reduction process of different samples, and relevant studies [13,14,15] emphasized that partial alkaline oxides can enhance the reduction efficiency of iron oxides by increasing pellet porosity and changing the reaction path at a high temperature. Lyu et al. [16], using a thermo-gravimetric analyzer (800–1100 °C, 30%vol H2, 20 sccm), identified temperature as critical for improving the final reduction degree of the solid sample, and Zakeri et al. [17] confirmed that increasing H2 content in a H2-CO gas mixture would rapidly accelerate the reduction rate. In terms of the reduction mechanism, Jozwiak et al. [18,19] established that the reduction of hematite to iron was not a one-step reduction process. Hammam et al. [20] investigated the H2-based reduction process of compacts prepared from iron oxide using a thermo-gravimetric analyzer combined with a fitting model at 700–1100 °C, in which the results showed that the initial stage of the reduction process was governed by the chemical reaction kinetics, transitioning to gaseous diffusion control in the latter stage. Spreiter et al. [21] also concluded that the rate-controlling step in the iron ore reduction process would change with the change in experimental conditions and processes. In addition, Guo et al. [15,22] deduced from the reduction of iron oxide by H2 that the reduction process possessed the dissociation and adsorption of H2 on vacant sites on the iron oxide surface accompanied by the formation of hydroxide ions due to the release of oxygen from the lattice and eventually generated water molecules, and found that the FeO-Fe step was the rate-controlling step in the reduction reaction. Current research achievements primarily focus on the macroscopic scale of iron oxide reduction, while relatively few studies have been conducted at the microscopic scale (molecular) [23,24], indicating that the basic research on the molecular scale needs to be further strengthened.
At the molecular level, the chemical reaction between a H2-CO gas mixture and hematite can be roughly divided into three stages: gas adsorption, interface reaction and gas desorption. Crucially, the adsorption of gas reactant molecules (H2, CO, etc.) to the surface of hematite is the premise of the chemical reaction. Because of the advantage of density functional theory (DFT) in analyzing the adsorption behavior of a gas molecule on a surface [25,26], DFT calculations have been used to explore the adsorption behavior of a single gas molecule on the surface of iron oxide [27,28]. However, when H2 (or CO) reacts with hematite, H2O (or CO2) will be generated, and the generated H2O (or CO2) may continue to adsorb to the reaction active sites on the hematite surface to affect the reaction [23,29,30,31]. The effect of the reaction product re-adsorption situation has been relatively less studied. Therefore, in this paper, the adsorption behavior of H2 (or CO) under the conditions of pre-adsorbed H2O (or CO2) were systematically studied and combined with hematite reduction experiments to further advance the basic research on the reaction mechanism of hematite reduction by a H2-CO gas mixture, enabling the wider application of hydrogen-containing energy in the ironmaking process and promoting the development of the ironmaking industry towards a greener and more sustainable direction.

2. Method and Experiment

2.1. Computational Details

This study was based on the first-principles calculation method of the DFT and was completed by using the Cambridge serial total energy package (CASTEP) module in the Materials Studio calculation software (MS2016, BIOVIA, Vélizy-Villacoublay, France) [32]. The electron exchange and correlation energy were calculated by the Perdew–Burke–Ernzerhof (PBE) functional of the general gradient approximation (GGA) [33,34]. The Monkhorst–Pack method [35] was used to determine the value of the k-point in the Brillouin zone. The pseudopotential used in the calculation was the ultrasoft pseudopotential proposed by Vanderbilt [36]. All computations were performed in reciprocal space at 0 K, with structural optimizations implemented via the Broyden–Fletcher–Goldfarb–Shanno (BFGS) algorithm [37]. In addition, the effects of zero-point energy and dispersion correction on gas adsorption energy were neglected in the calculation process if no new chemical bonds were formed in the complex system [38,39,40,41].
The convergence test was carried out for the set of the k-point mesh density and plane-wave cutoff energy of the DFT calculations. According to the test results, the value of the k-point mesh in the bulk-phase calculation was set to 2 × 2 × 2, the value of the k-point mesh in the surface adsorption calculation was set to 2 × 2 × 1 and the plane-wave cutoff energy was set to 500 eV. In the calculation process, the convergence criterion of energy was set to 1.0 × 10⁻⁵ eV/atom, the convergence criterion of maximum force was fixed at 0.03 eV/Å, the convergence criterion of maximum pressure was established at 0.05 GPa, the convergence criterion of maximum displacement was defined as 0.001 Å and the value of Fermi-level smearing was applied at 0.2 eV. The adsorption energy of the given adsorption system is defined as the difference between the total energy of the adsorption system after structural relaxation and the total energy of each substance before adsorption, as shown in Equation (1), in which the larger absolute value of the adsorption energy is the more stable structure of the post-adsorption system.
E ads   =   E a d s o r p t i o n   s y s t e m     E a d s o r p t i o n   s u b s t a n c e     E a d s o r p t i o n   g a s
where E ads represents the adsorption energy E a d s o r p t i o n   s y s t e m , E a d s o r p t i o n   s u b s t a n c e and E a d s o r p t i o n   g a s are the total energy of the adsorption system after structural relaxation, the total energy of the adsorbed substance before adsorption and the total energy of the gas before adsorption, respectively.
The space group of hematite (Fe2O3) is R-3C, which is a rhombohedron unit cell structure, and its bulk structure is shown in Figure 1a. According to existing relevant research [42,43,44,45], the Fe2O3 (001) surface is the low-index surface with relatively good stability and is selected as a typical research object. Therefore, in this paper, the fully relaxed Fe2O3 unit cell was cleaved to generate the initial Fe2O3 (001) surface structure for research. Subsequently, a (2 × 2 × 1) supercell model of the Fe2O3 (001) surface was constructed and a 12 Å vacuum layer was set in the Z-axis direction and relaxed again for the system. The results after relaxation are shown in Figure 1b.

2.2. Experiment Procedure

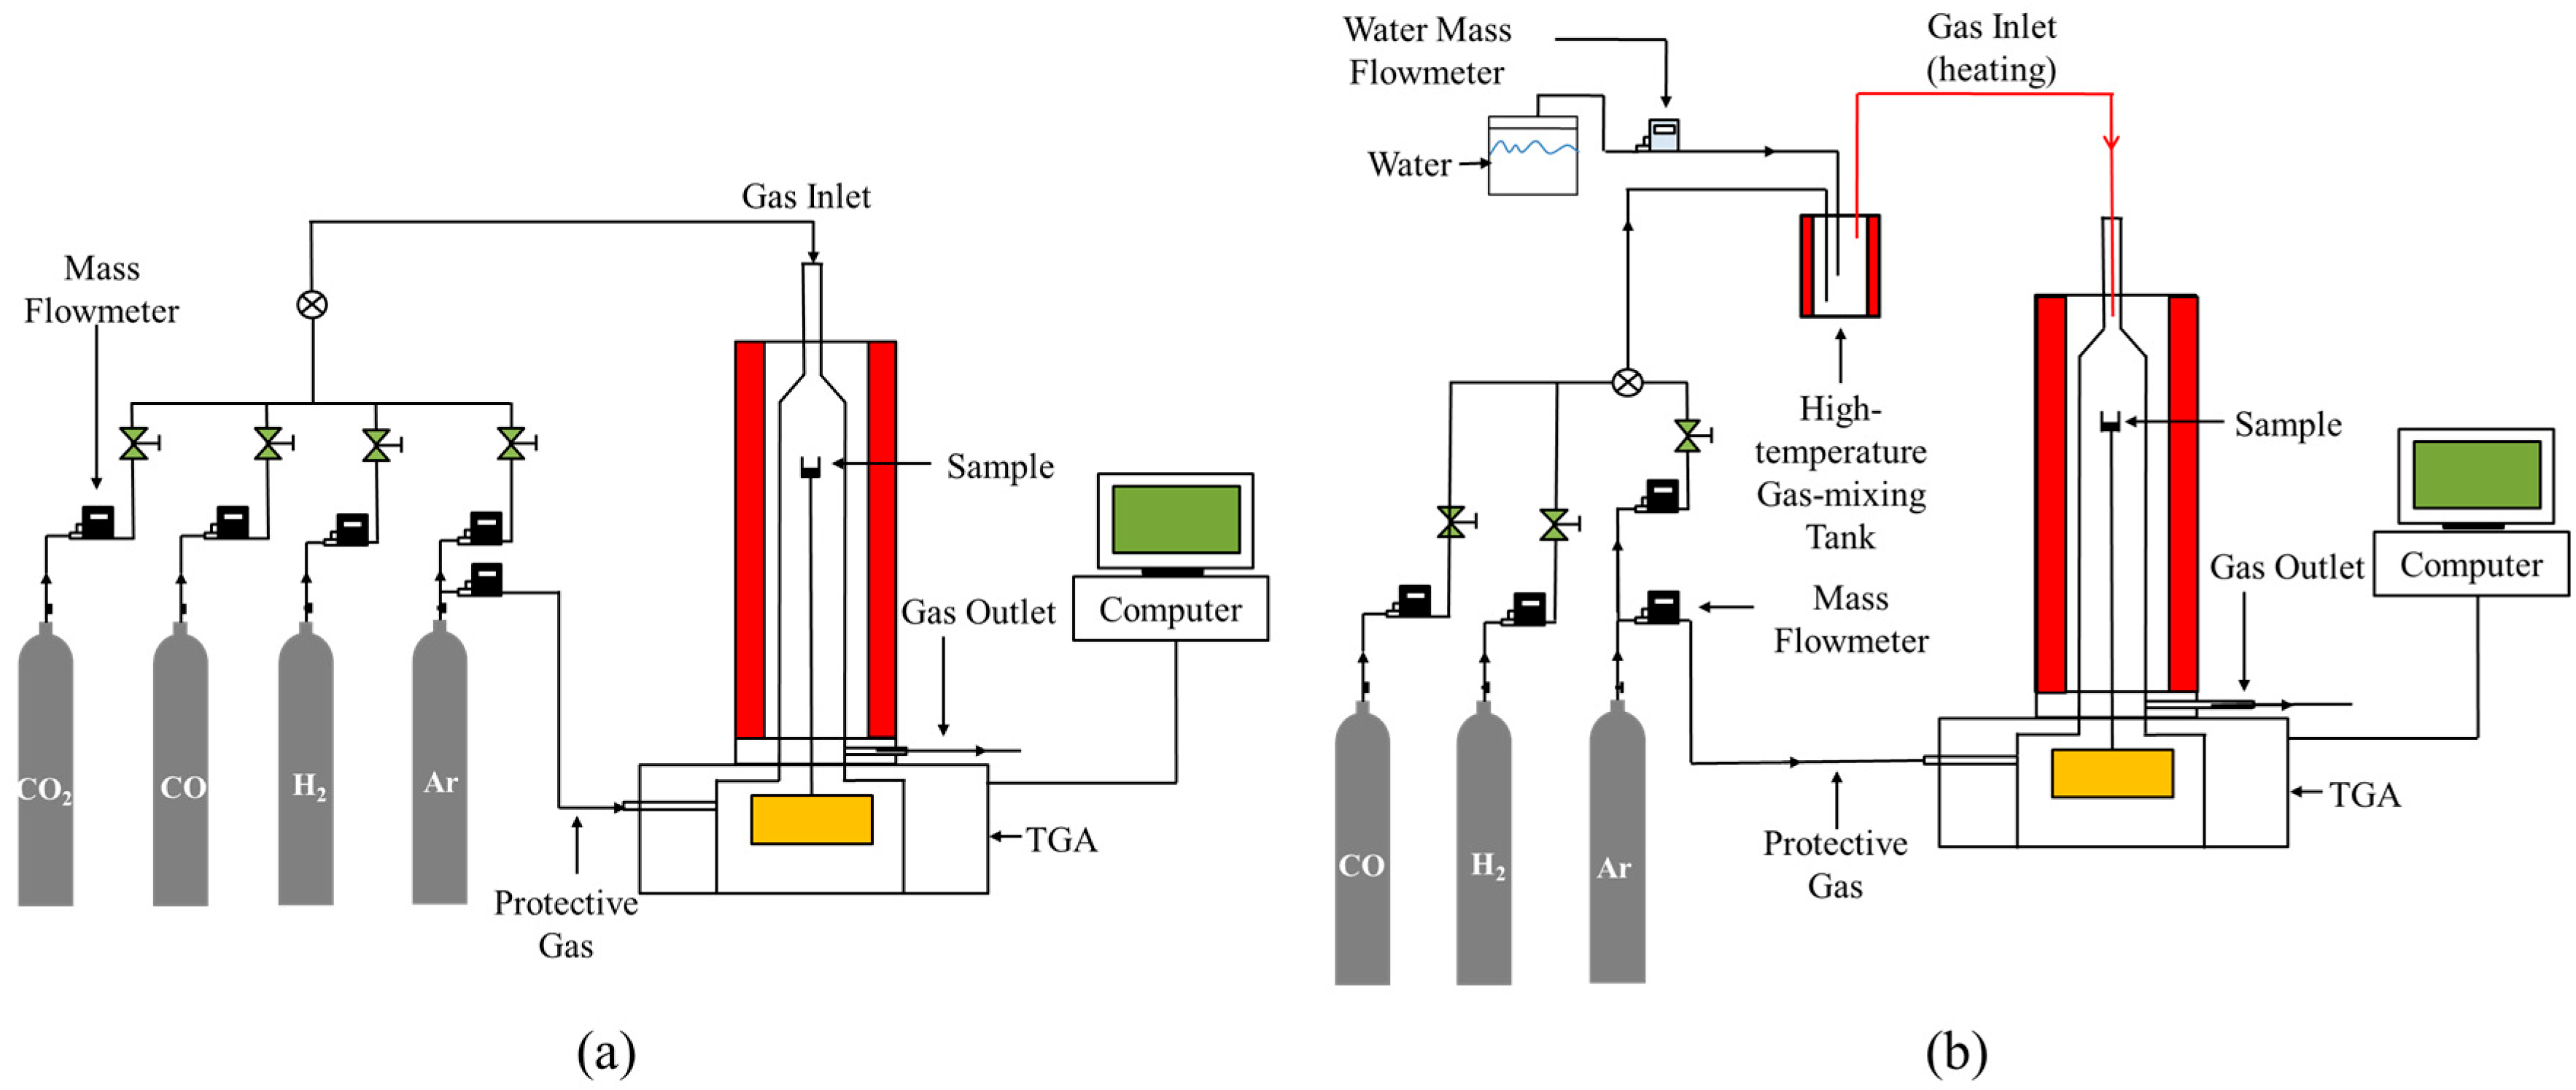
Figure 2 presents the schematic diagram of the experimental setup. An amount of 100 mg of calcining reagent-grade Fe2O3 powder was loaded into an alumina crucible (inner diameter: 16 mm) and placed in a thermo-gravimetric analyzer (TGA, HCT-4, Henven, Beijing, China). The Ar (argon, PRAXAIR, Beijing, China) gas was introduced into the TGA to completely remove the air, and the temperature was increased from room temperature to the target temperature at a rate of 20 K/min under continuous Ar gas protection. The Ar gas was switched to the gas reactant to start the reduction reaction when the temperature was stable for 10 min. After the reaction was completed, the gas reactant was switched to Ar gas again, and then the sample was cooled to room temperature under the protection of Ar gas. The gases of H2 (99.999%), Ar (99.999%), CO (99.99%) and CO2 (99.99%) (PRAXAIR, Beijing, China) used in the experiment were controlled by a gas mass flowmeter (Alicat, AZ, USA, accuracy: 0.5%), and the water vapor part of the gas reactant was controlled by an appliance provided by Bronkhorst (Gelderland, The Netherland, accuracy: 0.4%). Table 1 shows the experimental conditions employed in this study, and the trend of experimental conditions is shown in Figure 3.

3. Results and Discussion

3.1. DFT Calculation

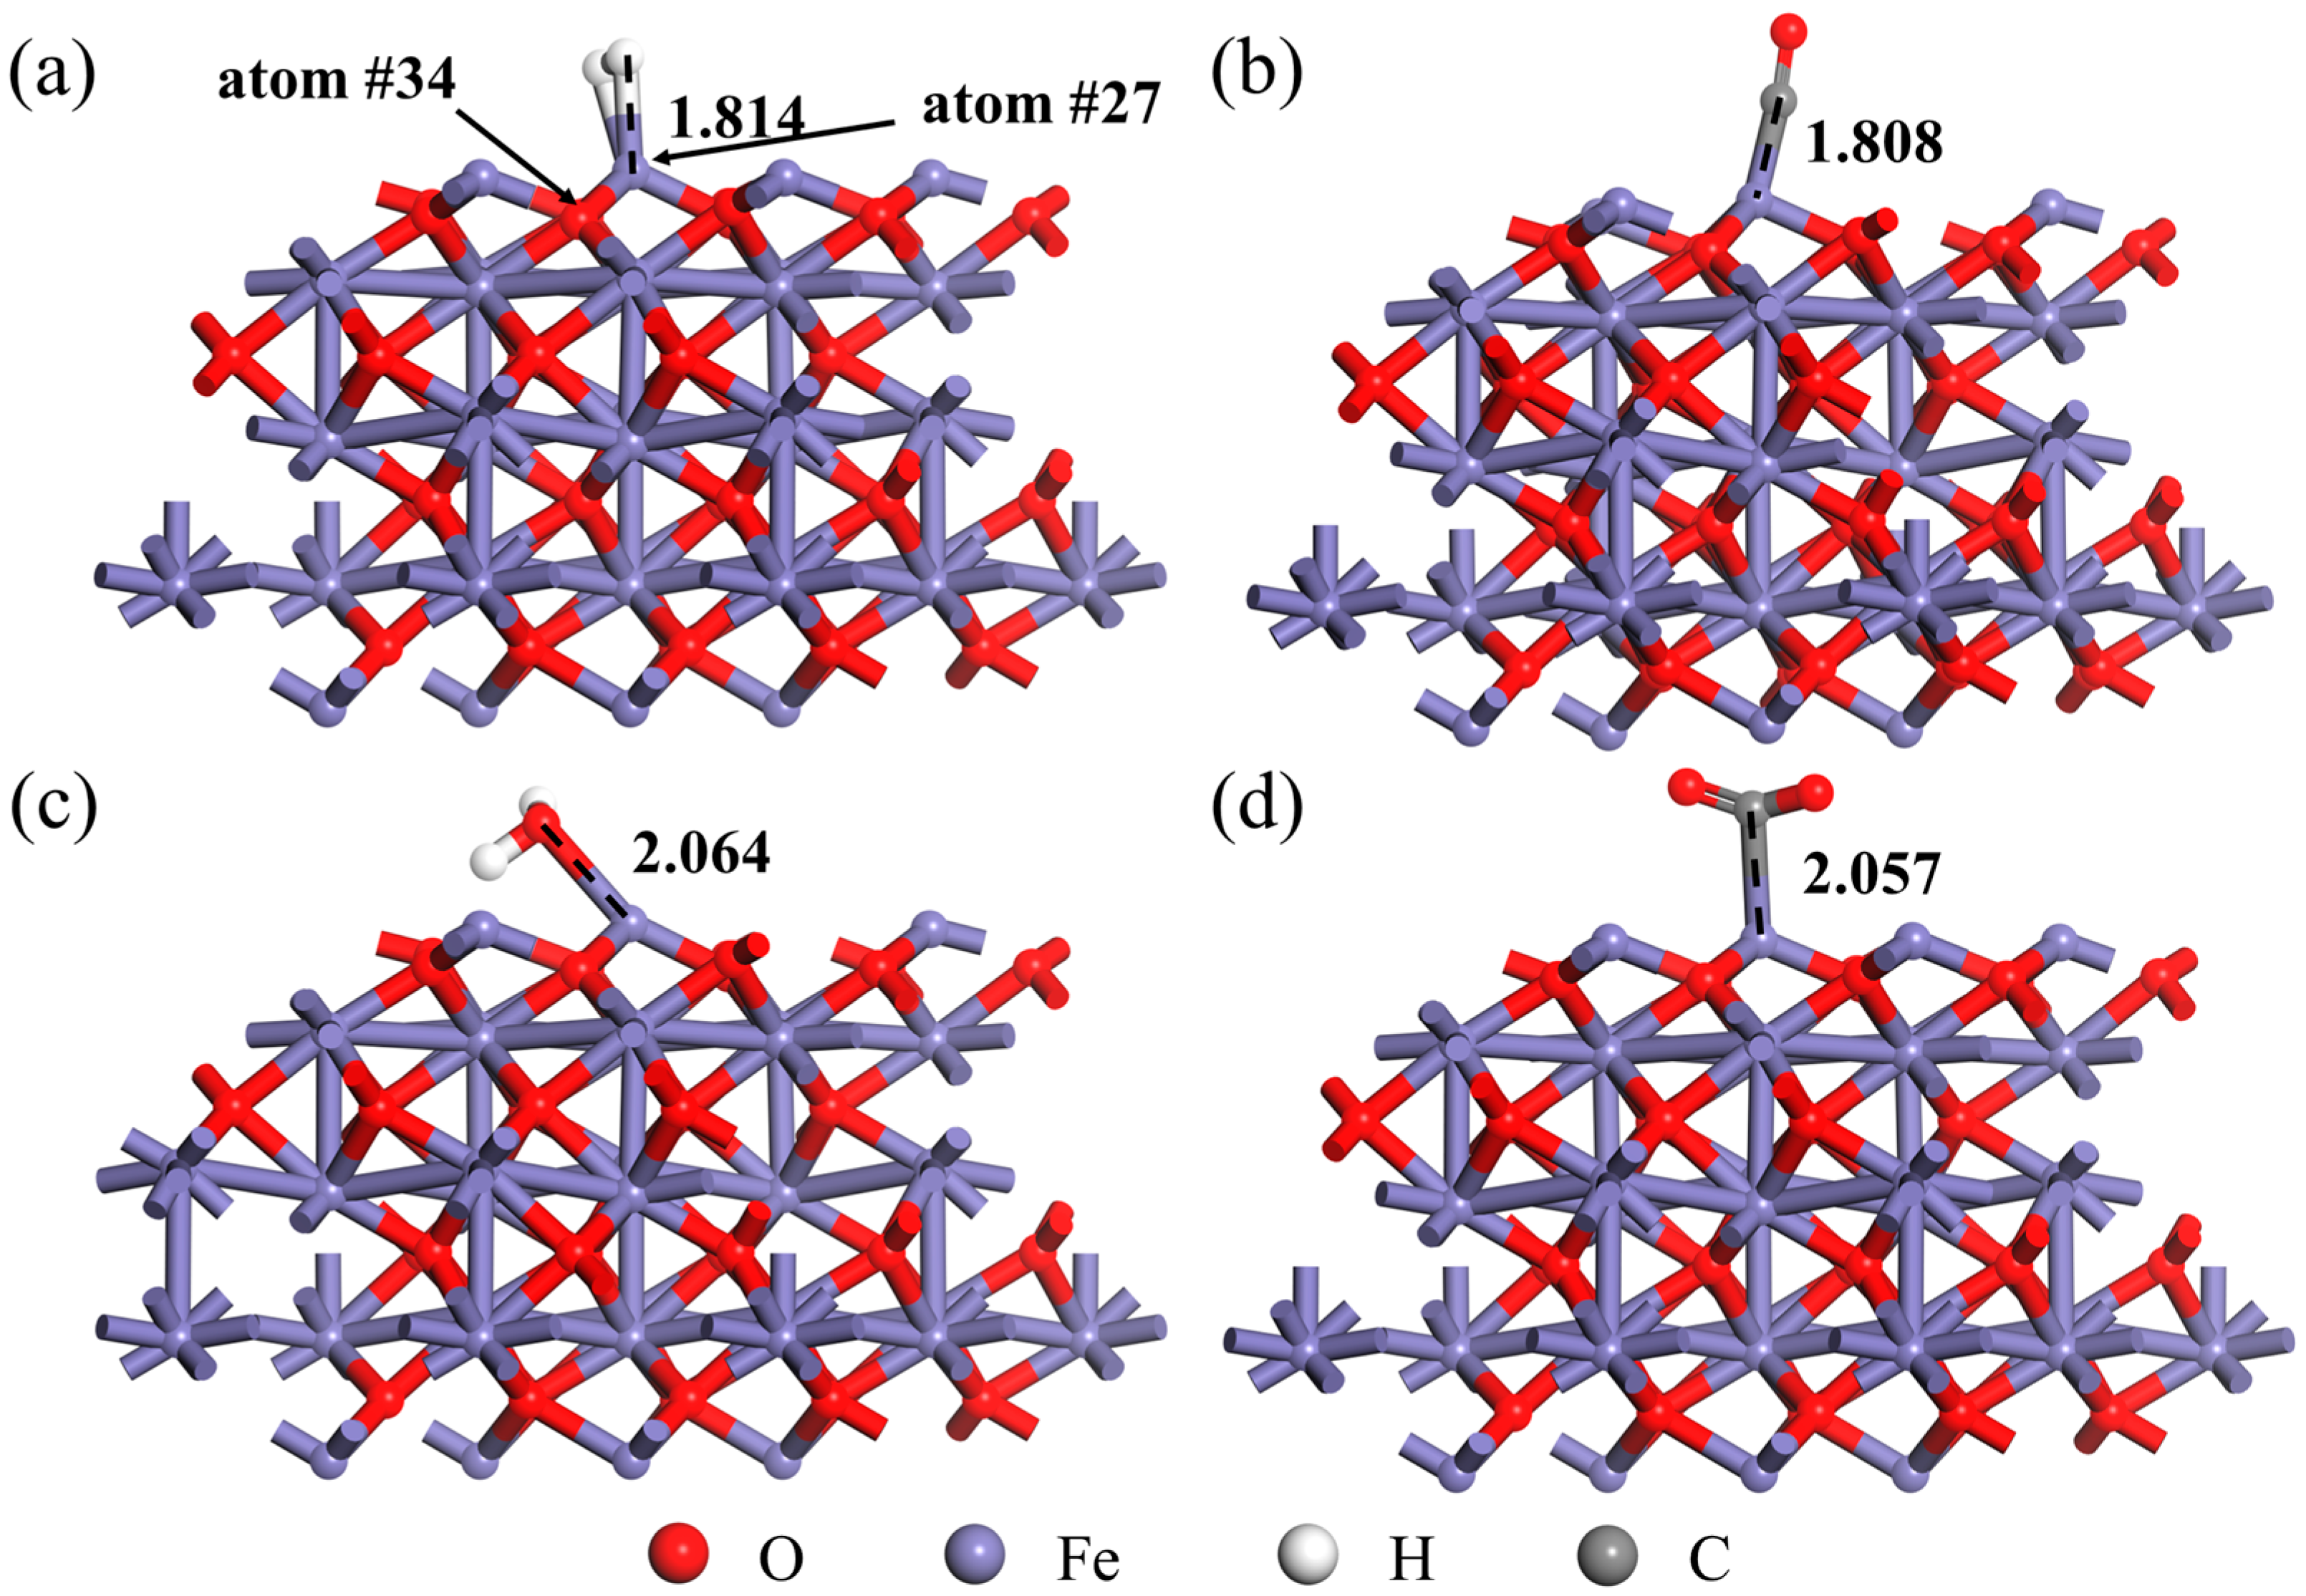
The relaxed H2, CO, H2O and CO2 molecules were positioned on the Fe2O3 (001) surface, respectively. The initial structure of the H2, CO, H2O and CO2 molecules’ adsorption on the Fe2O3 (001) surface is shown in Figure S1 (Supplementary Materials). The structure optimization was conducted by the CASTEP module of Materials Studio to obtain the stable adsorption systems, as shown in Figure 4. The situation without a stable adsorption structure is not discussed in this study. The existence of bonds between atoms in the figure does not necessarily mean that chemical bonds have been formed but rather for the convenience of displaying the distance between atoms (collectively referred to as bond length for descriptive convenience). As can be seen from Figure 4, both H atoms of the H2 molecule would adsorb on the Fe-top site of the Fe2O3 (001) surface (the Fe atom number in the adsorption system was 27, and the position is shown in Figure 4) where the Fe-H bond length (dFe-H) is 1.814 Å. As evidenced in Figure 4b–d, it can be found that the CO, H2O and CO2 molecules all adsorbed on the Fe atom (atom #27). In the Fe2O3-CO adsorption system, the C atom in CO molecule was adsorbed to the Fe site, and the Fe-C bond length was 1.808 Å. In the Fe2O3-H2O adsorption system, the O atom rather than the H atom in the H2O molecule was adsorbed to the Fe site, and the Fe-O bond length was 2.064 Å. In the Fe2O3-CO2 adsorption system, the C atom in the CO2 molecule was adsorbed to the Fe site, and the Fe-C bond length was 2.057Å. By comparing the bond length between the atom in the adsorbed gas molecule and the adsorption site, it can be found that the distance between H2O and CO2 from the Fe2O3 (001) surface was greater than that between H2 and CO, but the bond length between the two adsorption atoms in different adsorption systems did not necessarily represent the stability of adsorption.
A negative value of adsorption energy for the adsorption system indicates that the energy of the adsorption system is reduced during the adsorption process. The smaller adsorption energy (the larger absolute value) indicates that the system structure is more stable after adsorption according to the second law of thermodynamics. Therefore, to obtain the stability order of each adsorption system structure in thermodynamics, the adsorption energy of each adsorption system was obtained according to Equation (1), as shown in Table 2. From Table 2, the adsorption energy of the Fe2O3-CO adsorption system was −1.317 eV, while the adsorption energy of the Fe2O3-H2 adsorption system was −0.013 eV, which confirmed that the Fe2O3-CO adsorption system resided in a lower energy state than the Fe2O3-H2 adsorption system, indicating that the Fe2O3-CO adsorption system was more stable than the Fe2O3-H2 adsorption system. Similarly, the adsorption energy of the Fe2O3-H2O adsorption system was −0.702 eV, indicating that its adsorption stability was also higher than that of the Fe2O3-H2 adsorption system.
In order to explore the effect of H2, CO, H2O and CO2 adsorption on the Fe2O3 (001) surface, the net charge and Fe-O bond of the Fe atom adsorbed by these gas molecules on the Fe2O3 (001) surface were further analyzed. The Fe atom adsorbed by the gas molecule also bonded with the three adjacent O atoms at the same time. Only one of the Fe-O bonds was selected for analysis (the O atom number in the adsorption system was 34), as the other two Fe-O bonds were consistent with the same trend. The specific parameters are shown in Table 3.
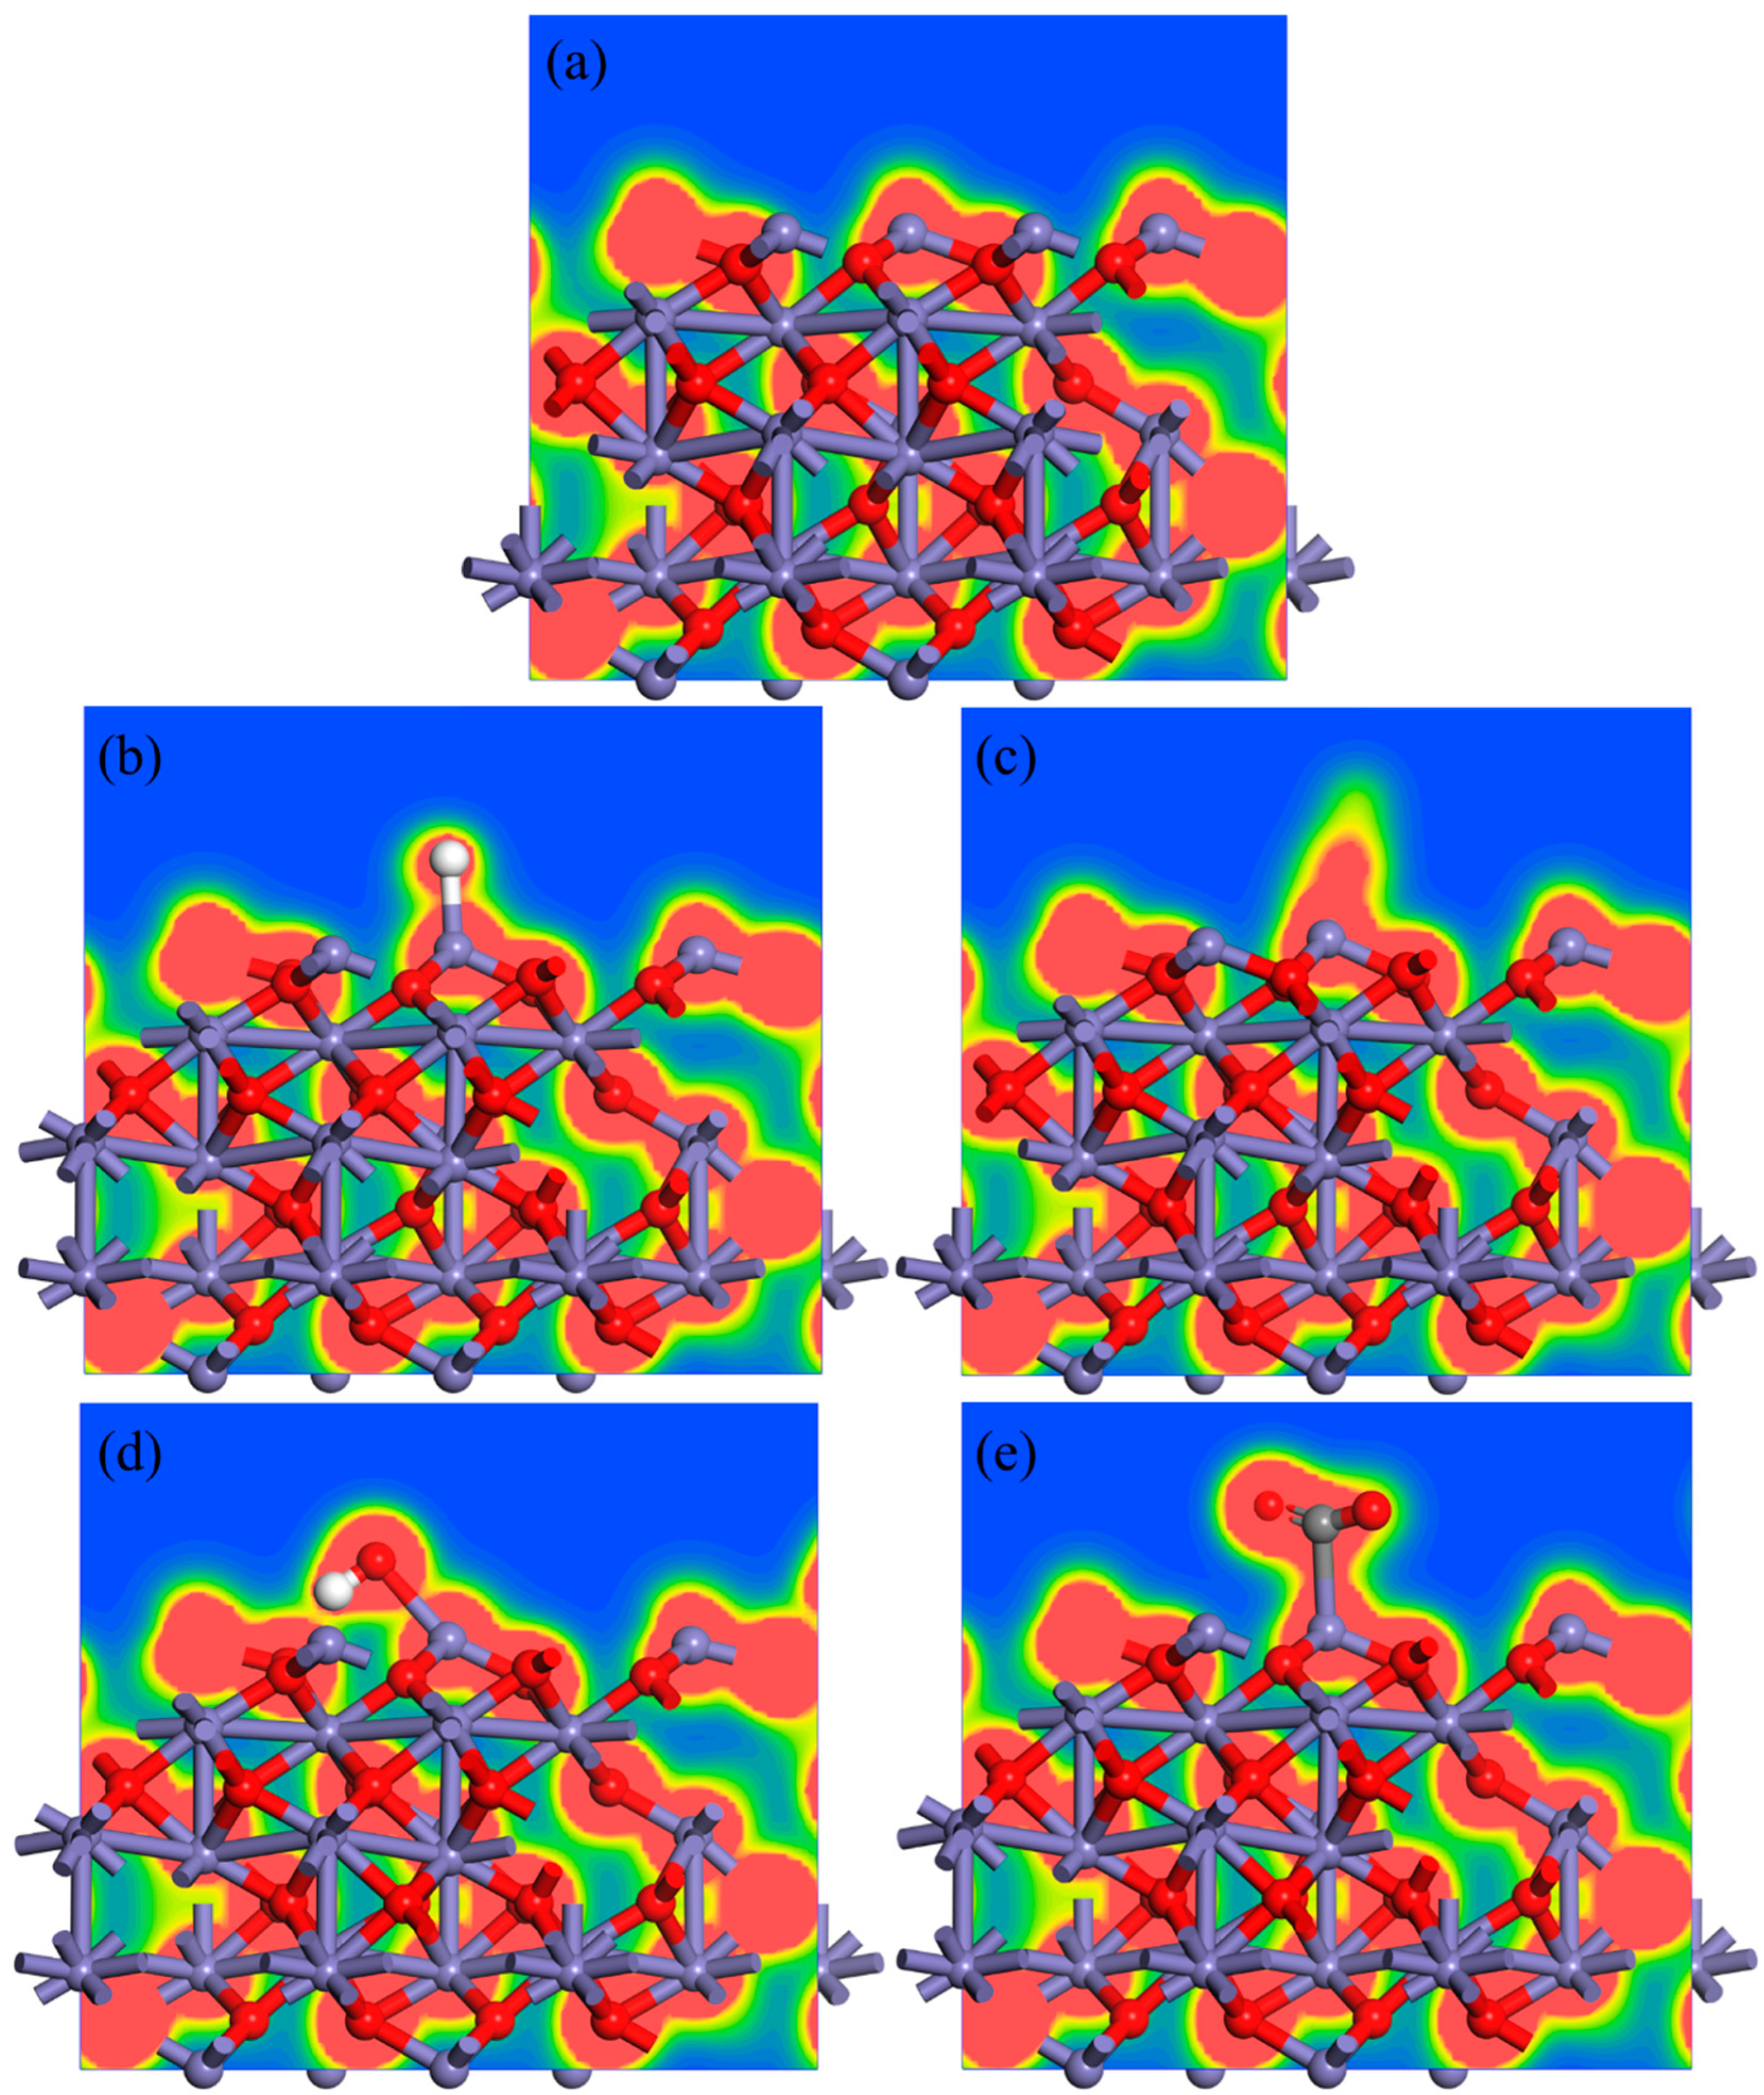
It can be found from Table 3 that the bond length of the Fe-O bond was 1.716 Å when the Fe2O3 (001) surface did not adsorb the gas molecule, and once the gas molecule was adsorbed to the Fe atom site, the bond length of the Fe-O bond became longer, which means that the Fe atom moved away from the O atom after the adsorption of the gas molecule. In this study, the bond length of the Fe-O bond after the adsorption of the CO molecule was 1.772 Å, which is the longest. The bond length of the Fe-O bond was 1.758 Å when the adsorbed gas molecule was the H2O molecule, which was also longer than the Fe-O bond length of 1.746 Å when adsorbing the H2 and CO2 molecules. By analyzing the bond order of the Fe-O bond, it can be found that although the bond length of the Fe-O bond was the longest in the Fe2O3-CO adsorption system, the bond order of the Fe-O bond was 0.52, and the bond strength was only lower than that of the Fe-O bond without the gas molecule adsorbing. The bond order of the Fe-O bond in the Fe2O3-H2 adsorption system decreased to 0.49, indicating that the Fe-O bond was weaker than the Fe-O bond in the Fe2O3-CO adsorption system. The results indicate that H2 was stronger than CO in breaking the Fe-O bond in Fe2O3 during gas adsorption. In addition, the bond order of the Fe-O bond in the Fe2O3-H2O adsorption system was the smallest, which means that this was the lowest bond strength of Fe-O bond. As a result, H2O had the greatest influence on the Fe-O bond, while H2O could not continue to react with Fe2O3 due to its chemical property. It was found that when the H2, CO, H2O and CO2 molecules were adsorbed to the Fe atom on the Fe2O3 (001) surface, their electrons were attracted by the Fe atom and therefore increased the net charge of the Fe atom. When the adsorbed gas molecule was the H2 molecule, the net charge of the Fe atom increased from 0.75e to 0.95e. The CO molecule increased the net charge of the Fe atom to 0.76e, indicating that the attraction of the H2 molecule to electrons was greater than that of the CO molecule. The charge density diagram, as shown in Figure 5, can also indirectly confirm this result.
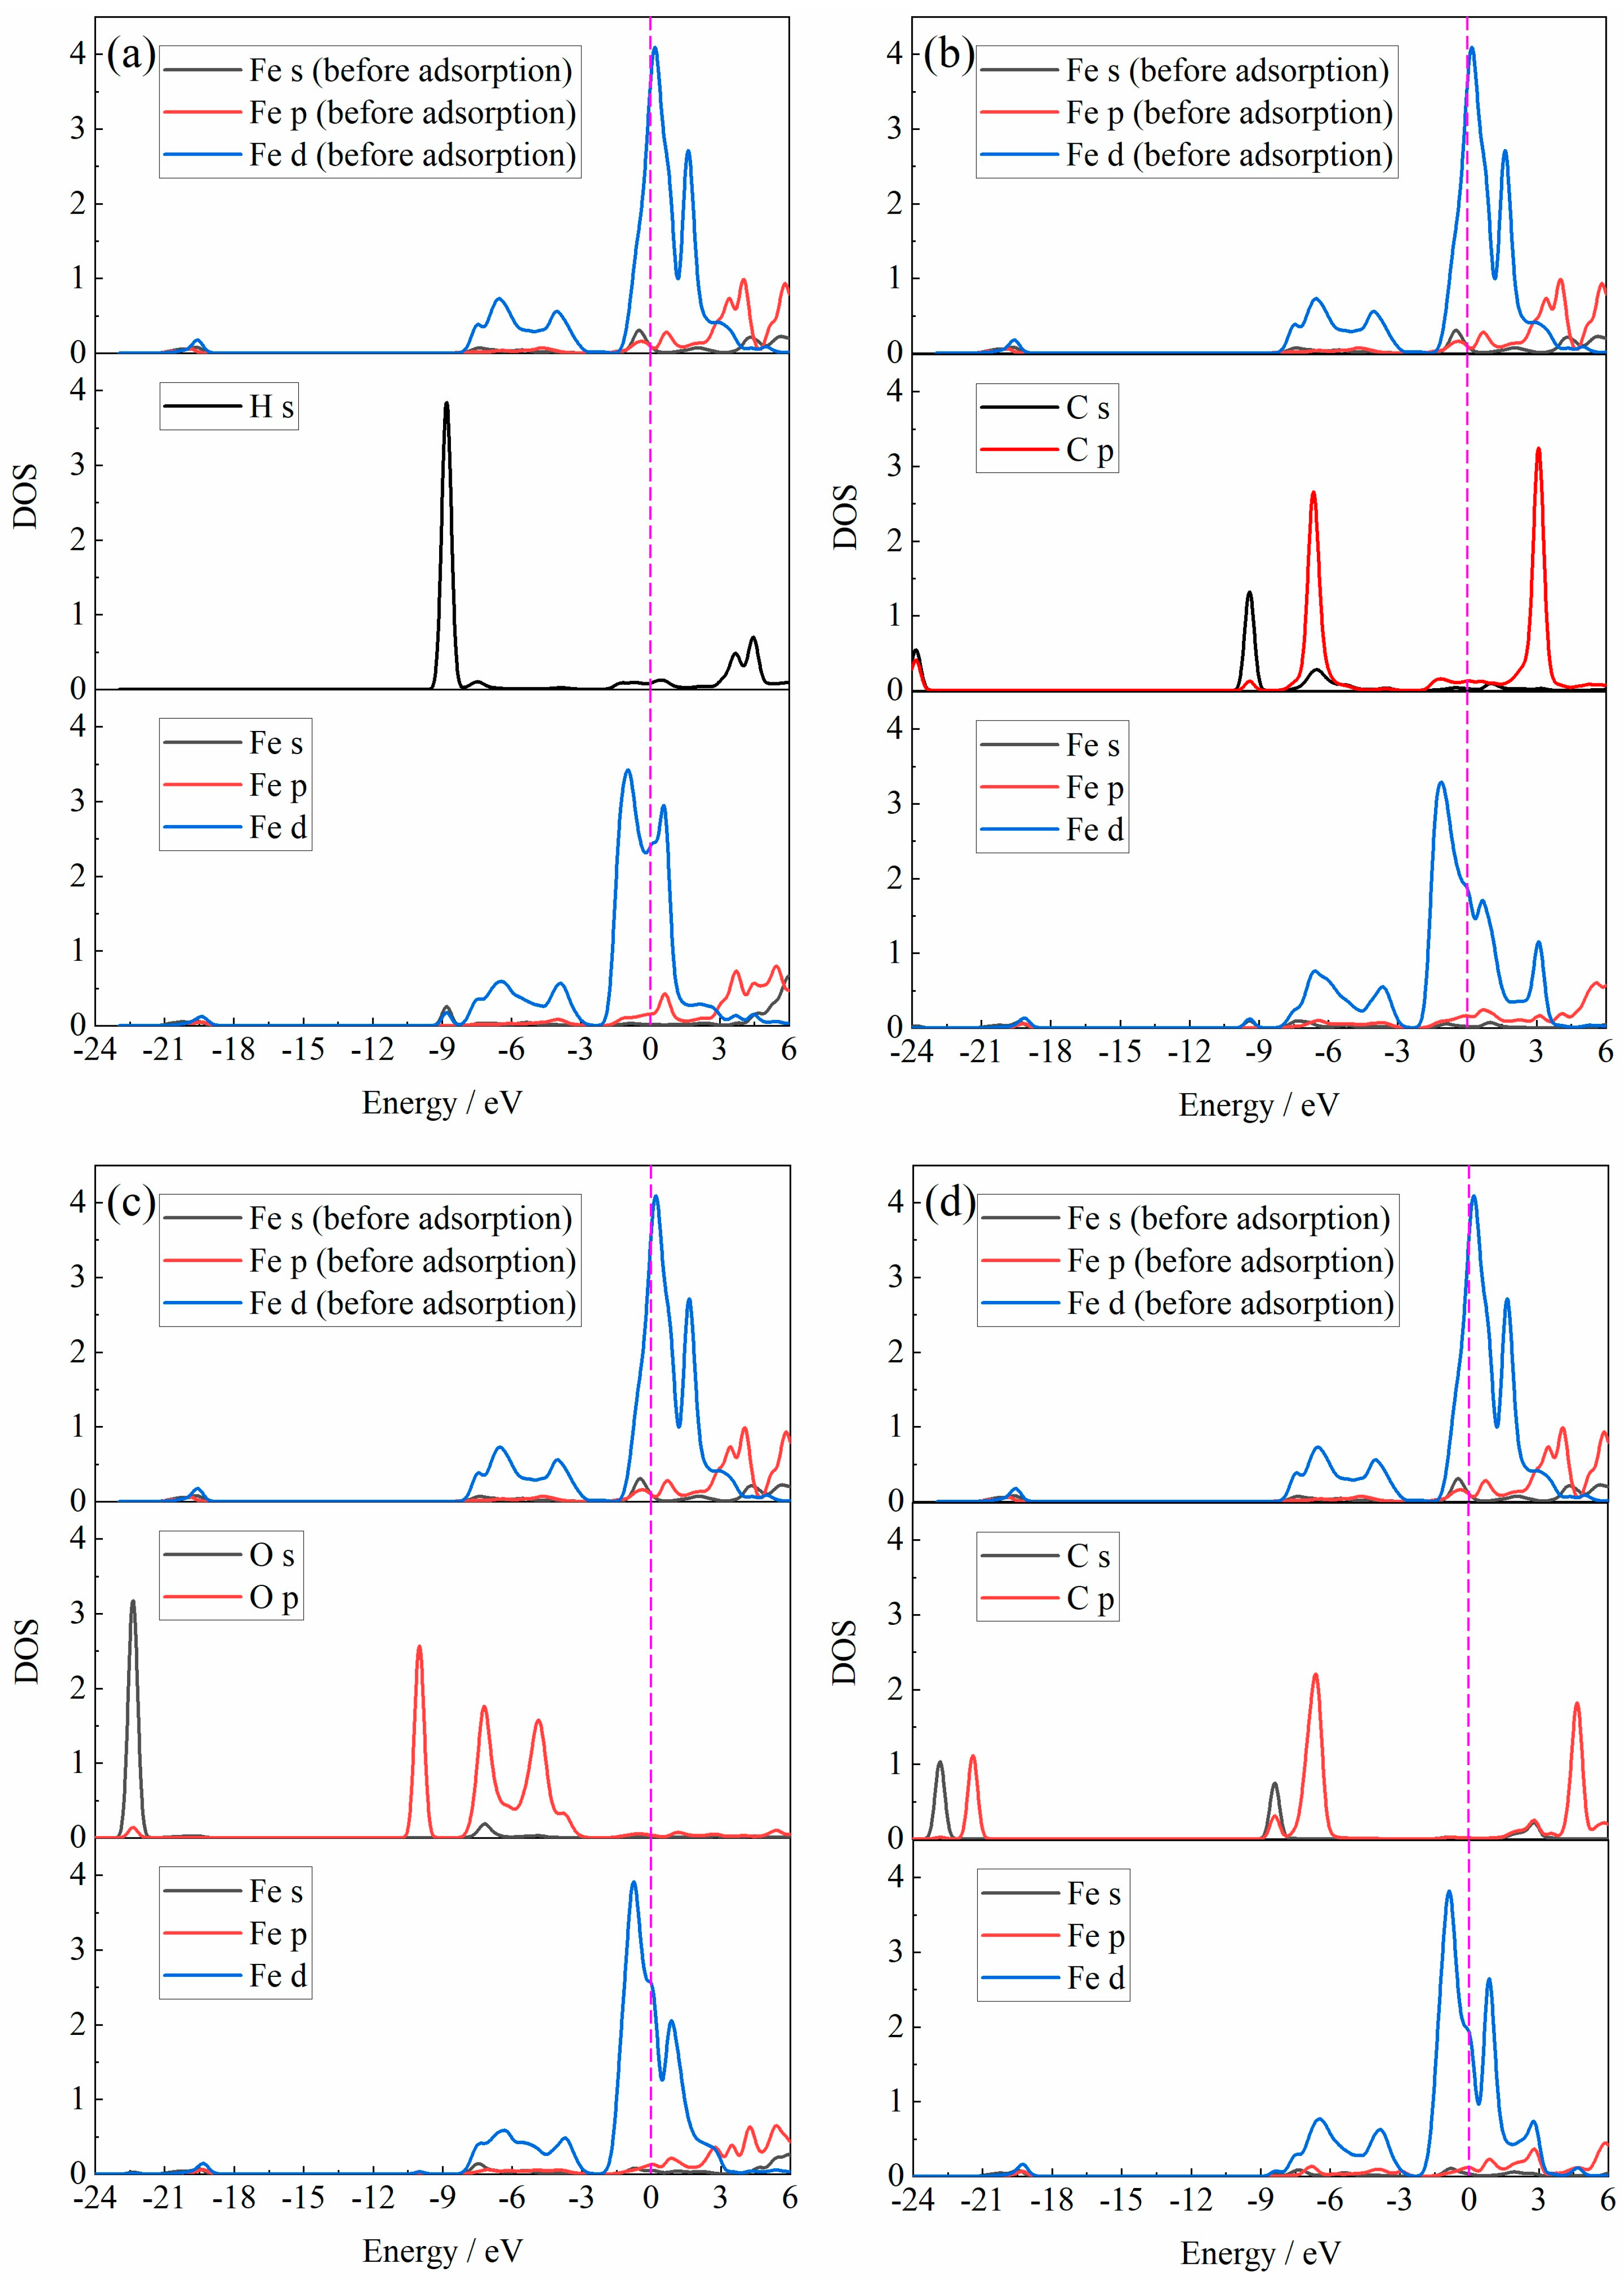
The bonding mechanism of the adsorption of the H2, CO, H2O and CO2 gas molecules on the Fe2O3 (001) surface was further investigated by calculating the density of states (DOS) of the adsorbed atom in the gas molecule and the adsorbed Fe atom on the Fe2O3 (001) surface, respectively, and the results of the calculation of the DOS are shown in Figure 6.
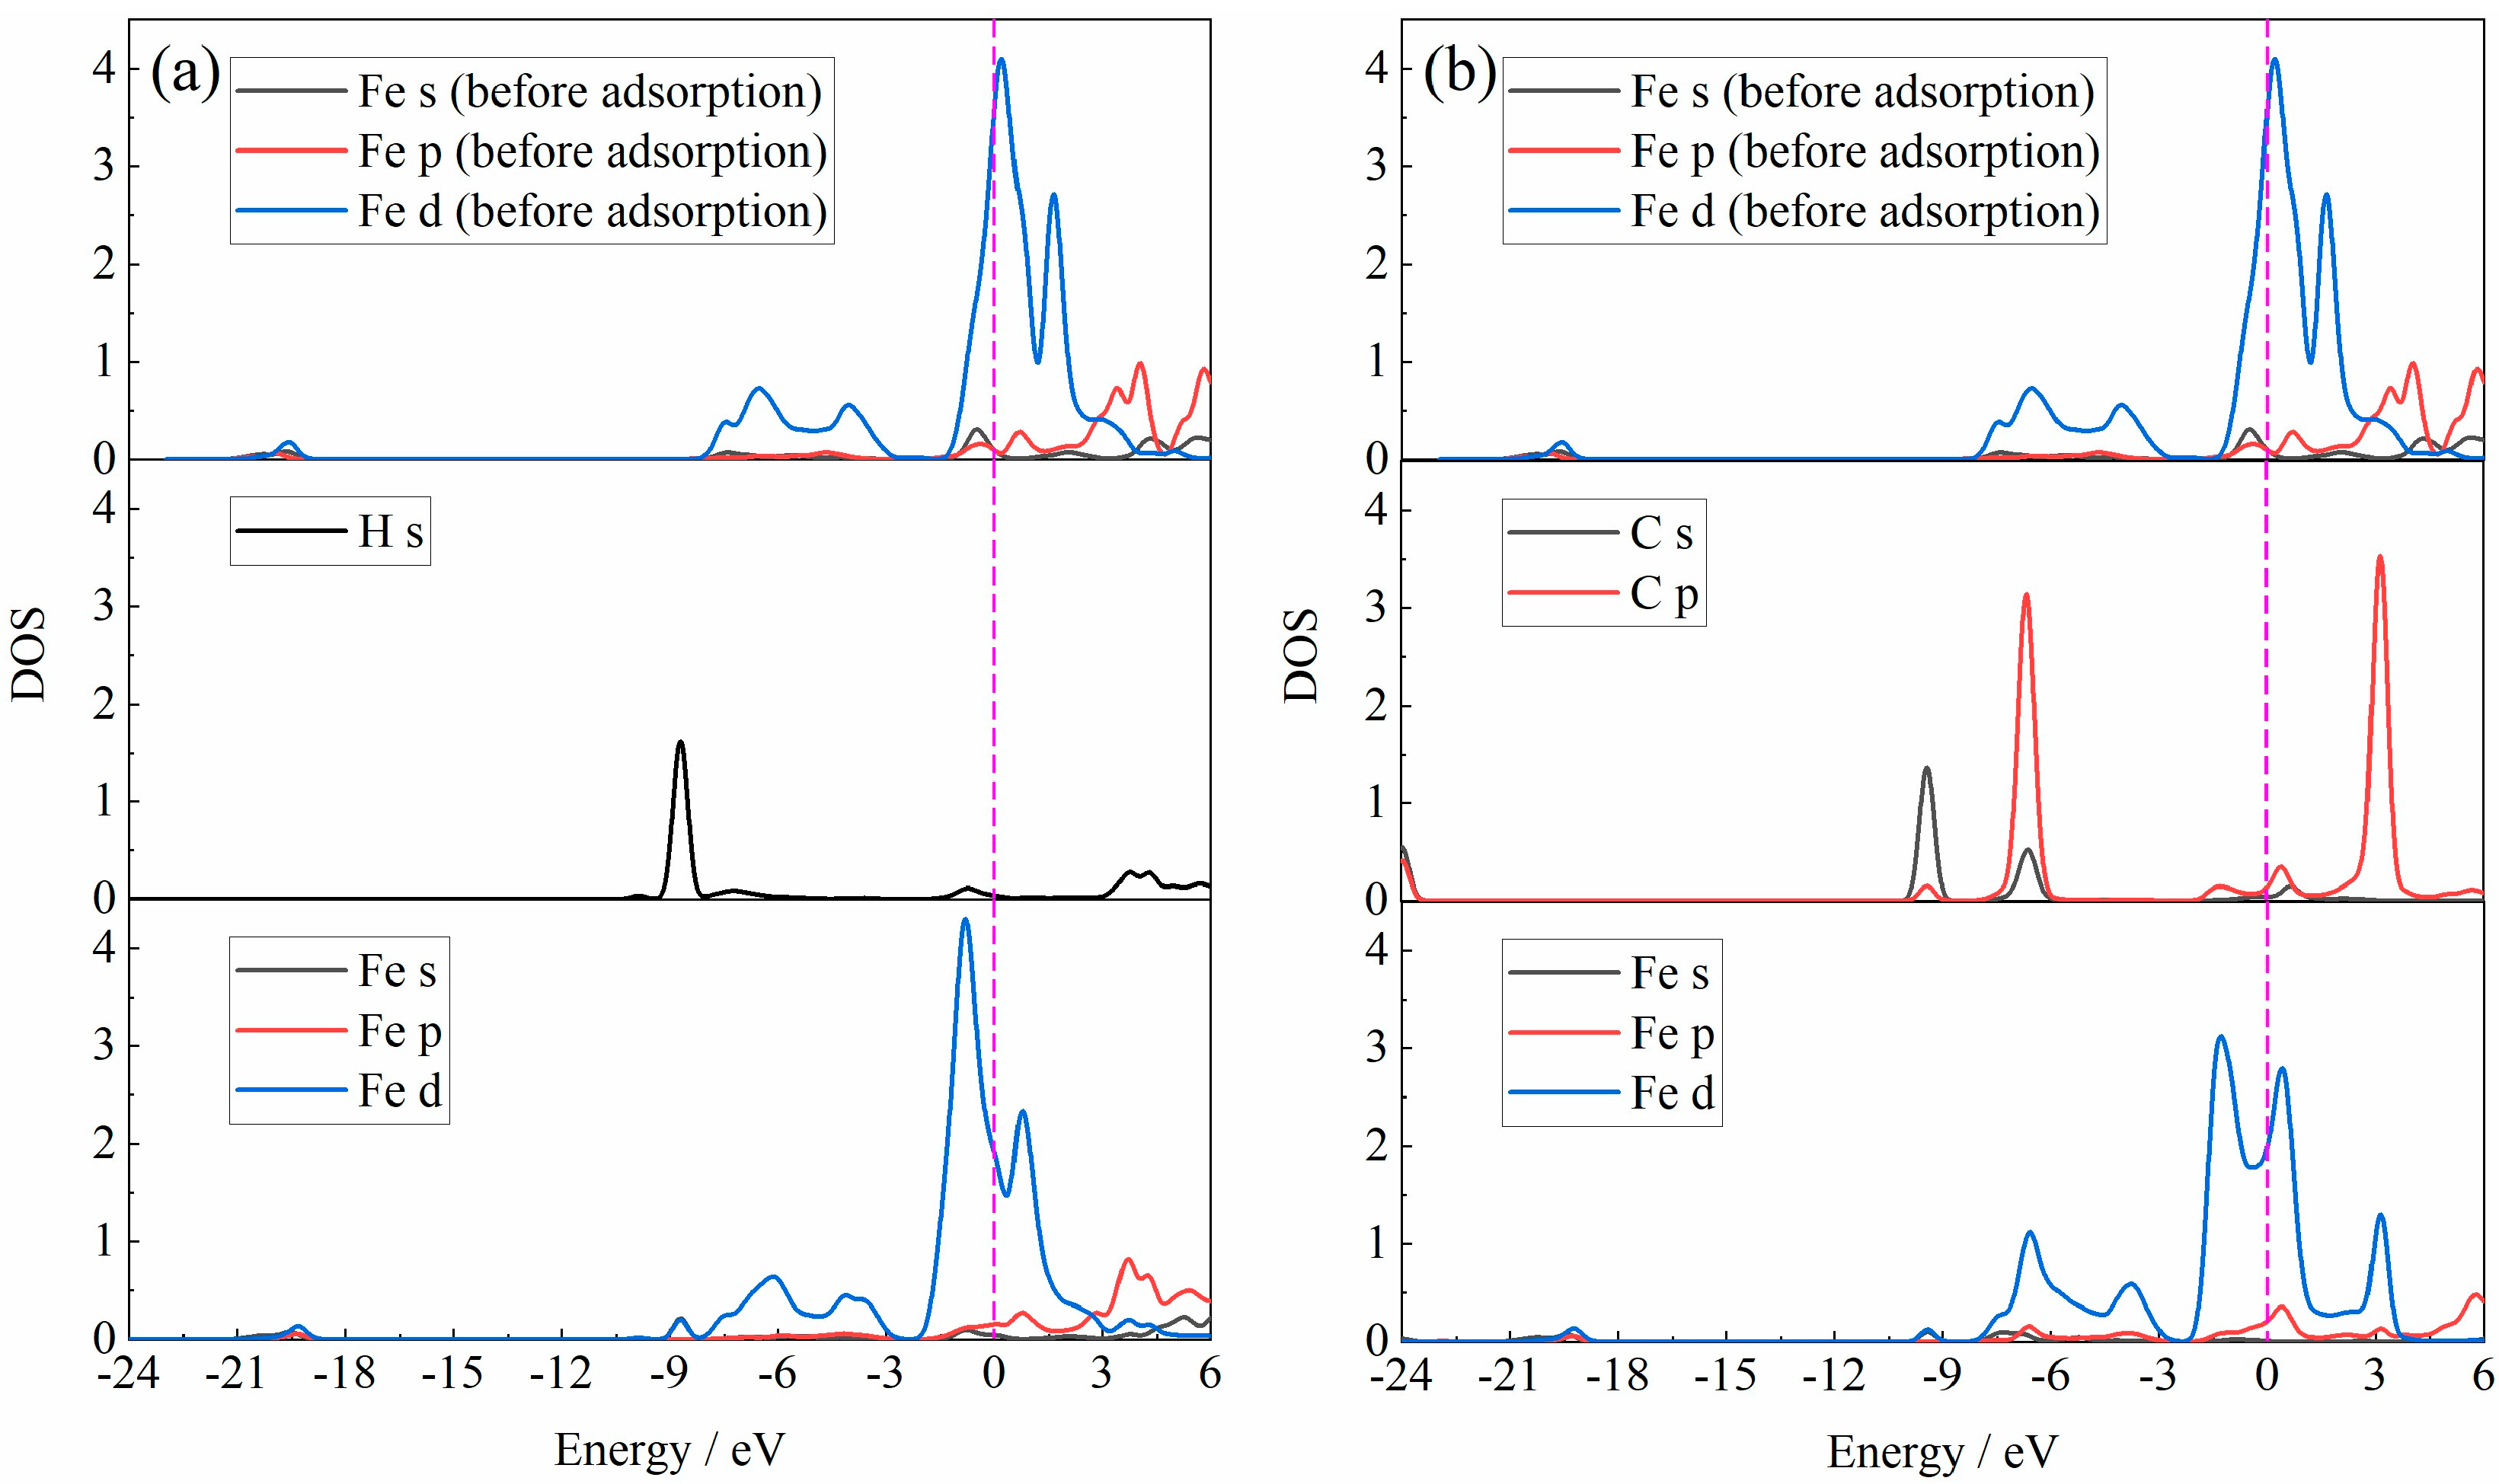
From Figure 6, it is observed that when the H2 molecule was adsorbed onto the Fe2O3 (001) surface, the s-orbital of the H atom had a resonance peak with the s-orbital and d-orbital of the Fe atom at an energy of −8.8 eV, forming a covalent bond. When the CO molecule was adsorbed onto the Fe2O3 (001) surface, the C atom in the CO molecule adsorbed and bonded with the Fe atom. The s-orbital and p-orbital of the C atom formed a resonance peak with the s-orbital and d-orbital of the Fe atom at an energy of −9.3 eV. There was also an electronic interaction between the s-orbital and p-orbital of the C atom and the d-orbital of the Fe atom at an energy of −6.6 eV, the resonance of which was more obvious due to the higher DOS of the C atom and Fe atom. When the adsorption gas molecules were H2O and CO2, the DOS of the s-orbital and p-orbital of the Fe atom was relatively less obvious than that of the DOS under the adsorption conditions of the H2 and CO molecules. The resonance orbital of the Fe atom with the O atom and the C atom was basically the d-orbital.
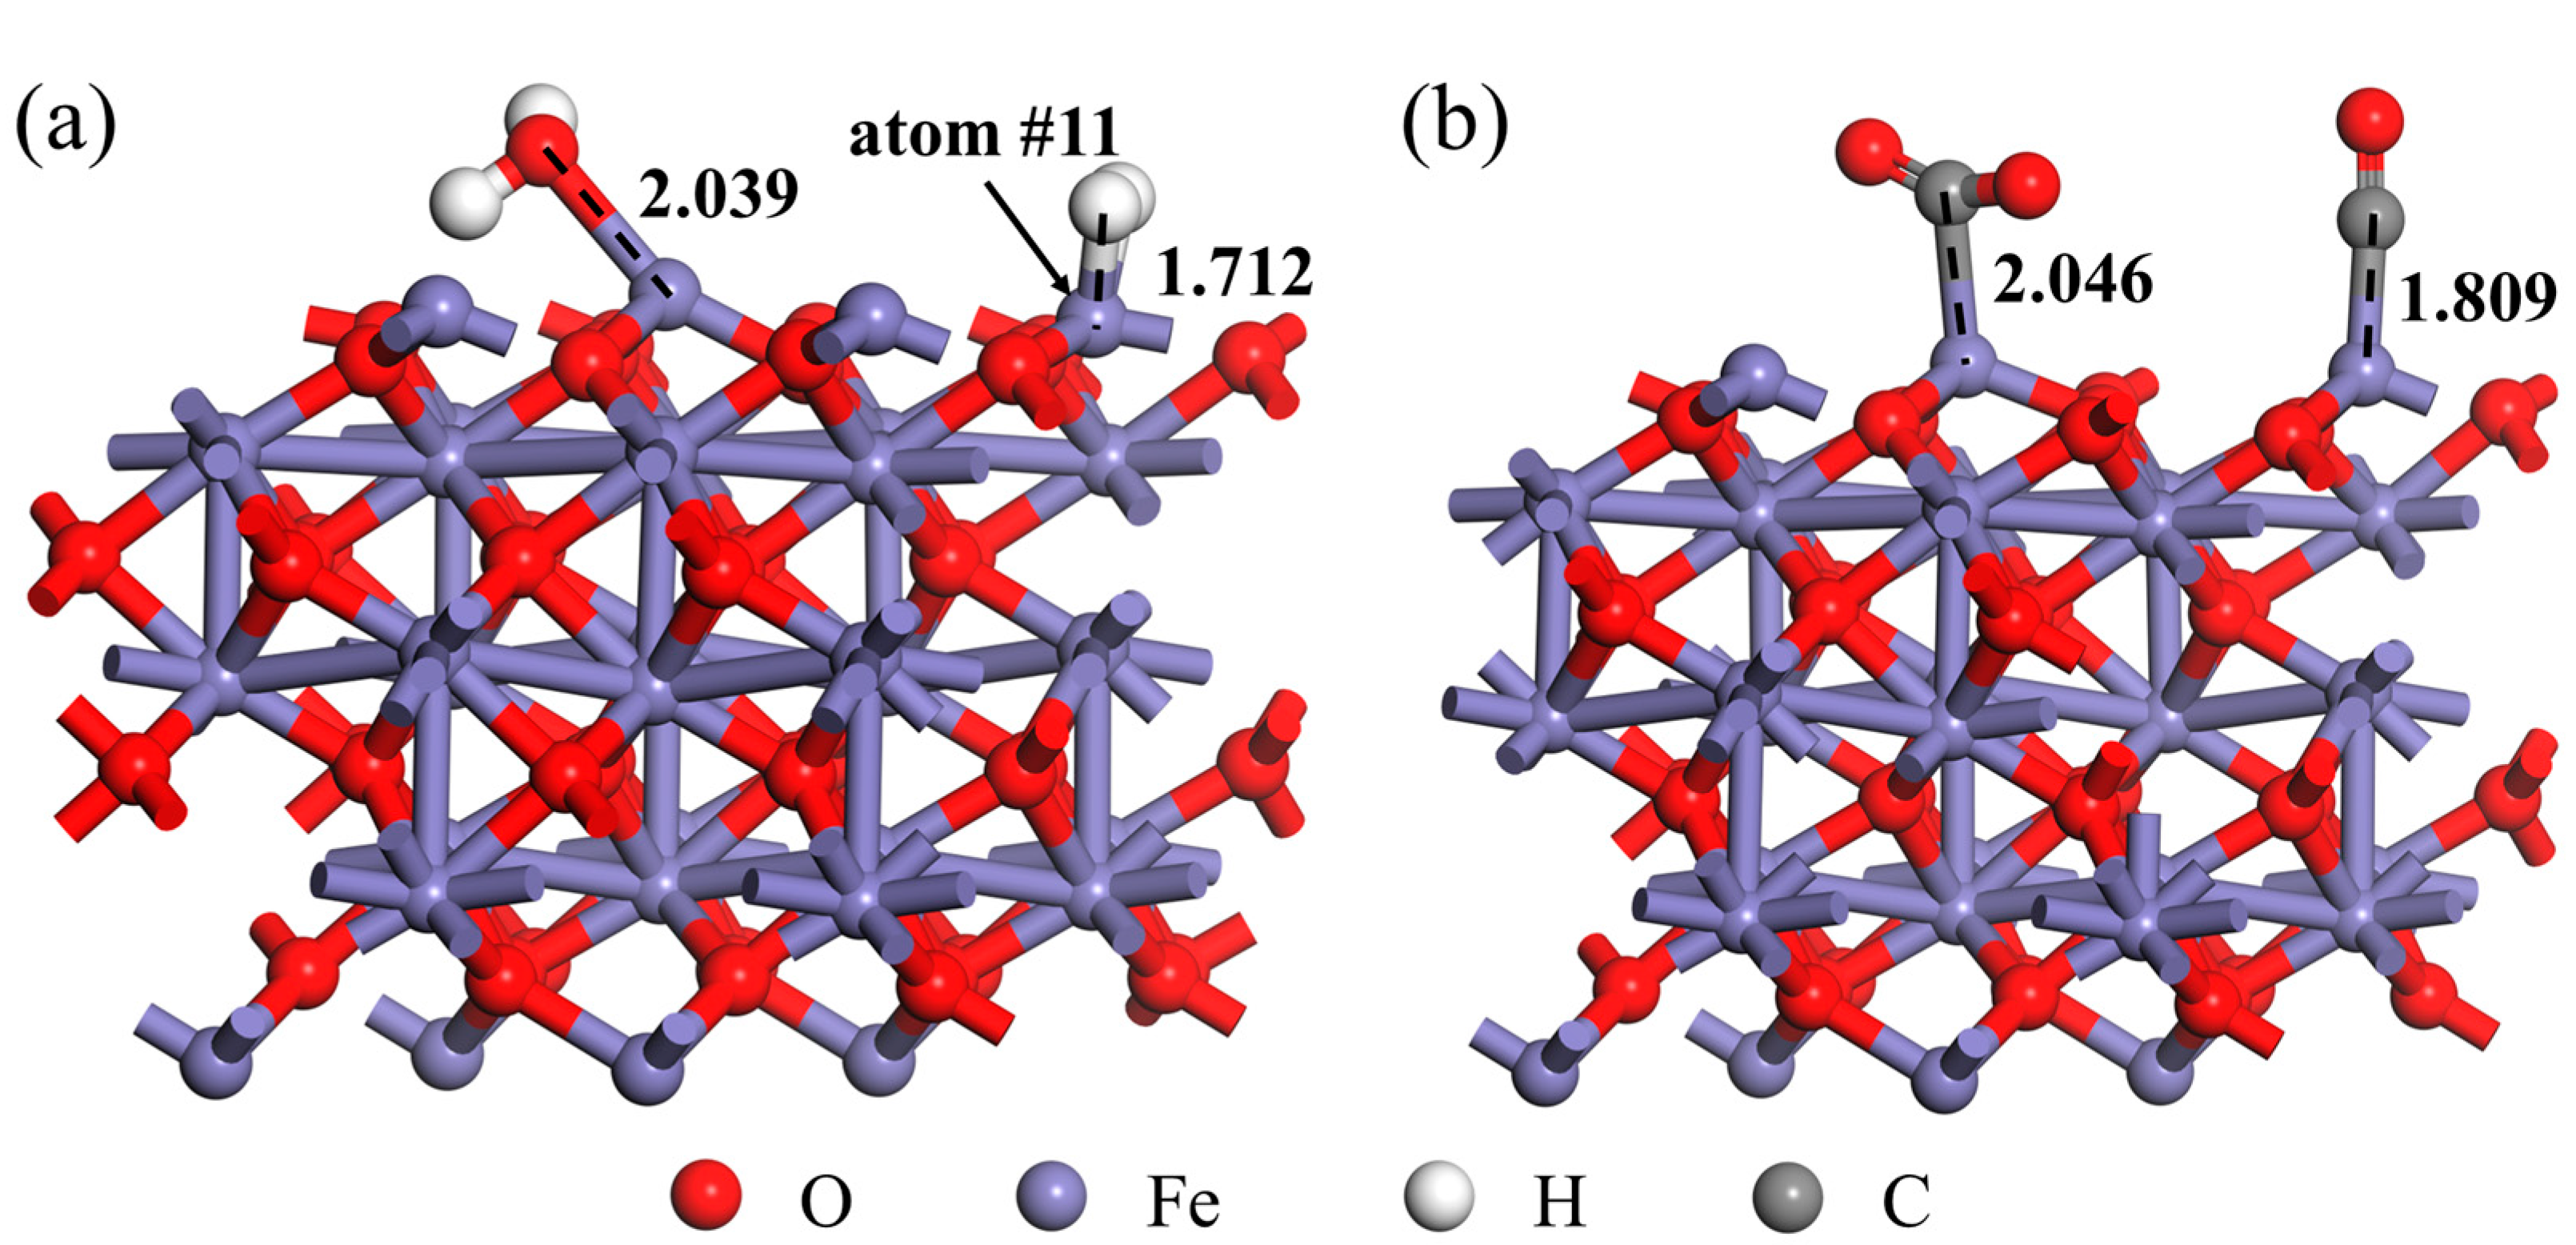
When the interfacial chemical reaction between H2 (or CO) and Fe2O3 occurs and generates H2O (or CO2), the adsorption of the product H2O (or CO2) on the Fe2O3 surface will affect the subsequent H2 (or CO) adsorption behavior. To better investigate this effect, based on the established Fe2O3-H2O adsorption system or Fe2O3-CO2 adsorption system, a H2 or CO molecule was further introduced into the adsorption system for co-adsorption, respectively. The initial structure of the Fe2O3-H2O-H2 and Fe2O3-CO2-CO system is shown in Figure S2 (Supplementary Material). The adsorption site was the equivalent Fe atom on the Fe2O3 (001) surface that was adsorbed by the H2 or CO described in the previous section, as shown in Figure 7.
It can be found from Figure 7 that the H2 molecule was stably adsorbed on the Fe2O3- H2O adsorption system. The distance (dFe-H) between the adsorbed Fe atom (the Fe atom number in the adsorption system was 11) and the adsorbed H atom on the Fe2O3 (001) surface was 1.712 Å (as shown in Table 4), which was smaller than the dFe-H (value of 1.814 Å) when the H2 molecule was adsorbed on the Fe2O3 (001) surface without pre-adsorption of the H2O molecule. This result indicates that when the H2O molecule was adsorbed on the Fe2O3, the H2 molecule tended to be closer to the Fe2O3 surface. In addition, when the CO molecule was adsorbed on the Fe2O3-CO2 adsorption system, the distance between the adsorbed atoms (dFe-C value of 1.809 Å) was only slightly larger than the distance between the CO molecule directly adsorbed on the Fe2O3 (001) surface (dFe-C value of 1.808 Å), which indicates that CO2 had relatively little effect on the dFe-C.
The adsorption energy of the H2 molecule adsorbed to the Fe2O3-H2O adsorption system was −0.132 eV, which was smaller than that of the H2 molecule directly adsorbed to Fe2O3 (−0.013 eV), indicating that the H2O molecule pre-adsorption was beneficial to the H2 molecule adsorption. However, on the whole, due to the presence of H2O molecules already absorbed on some active sites in the Fe2O3, this would affect the further reduction behavior of Fe2O3 by H2. The adsorption energy of the CO molecule adsorbed to the Fe2O3-CO2 adsorption system was −1.203 eV, which was larger than that of CO molecule directly adsorbed to Fe2O3 (−1.317 eV). Considering the adsorption energy alone, it could be found that the stability of the Fe2O3-CO adsorption system that formed when the CO molecule directly adsorbed to Fe2O3 was relatively stronger. Therefore, compared with the H2O molecule, CO2 had relatively less influence on the subsequent reduction behavior of CO with Fe2O3.
The DOS for the adsorption atoms in the Fe2O3-H2O-H2 adsorption system and the Fe2O3-CO2-CO adsorption system are shown in Figure 8. Compared with Figure 6, this figured reveals that the pre-adsorption of H2O or CO2 had a minor effect on the DOS of the Fe atom at the adsorption site. The peak shape of the DOS of the Fe atom was basically similar, and the orbital resonance between the Fe and H or C atom was basically d-orbital.

3.2. Reduction Experiment

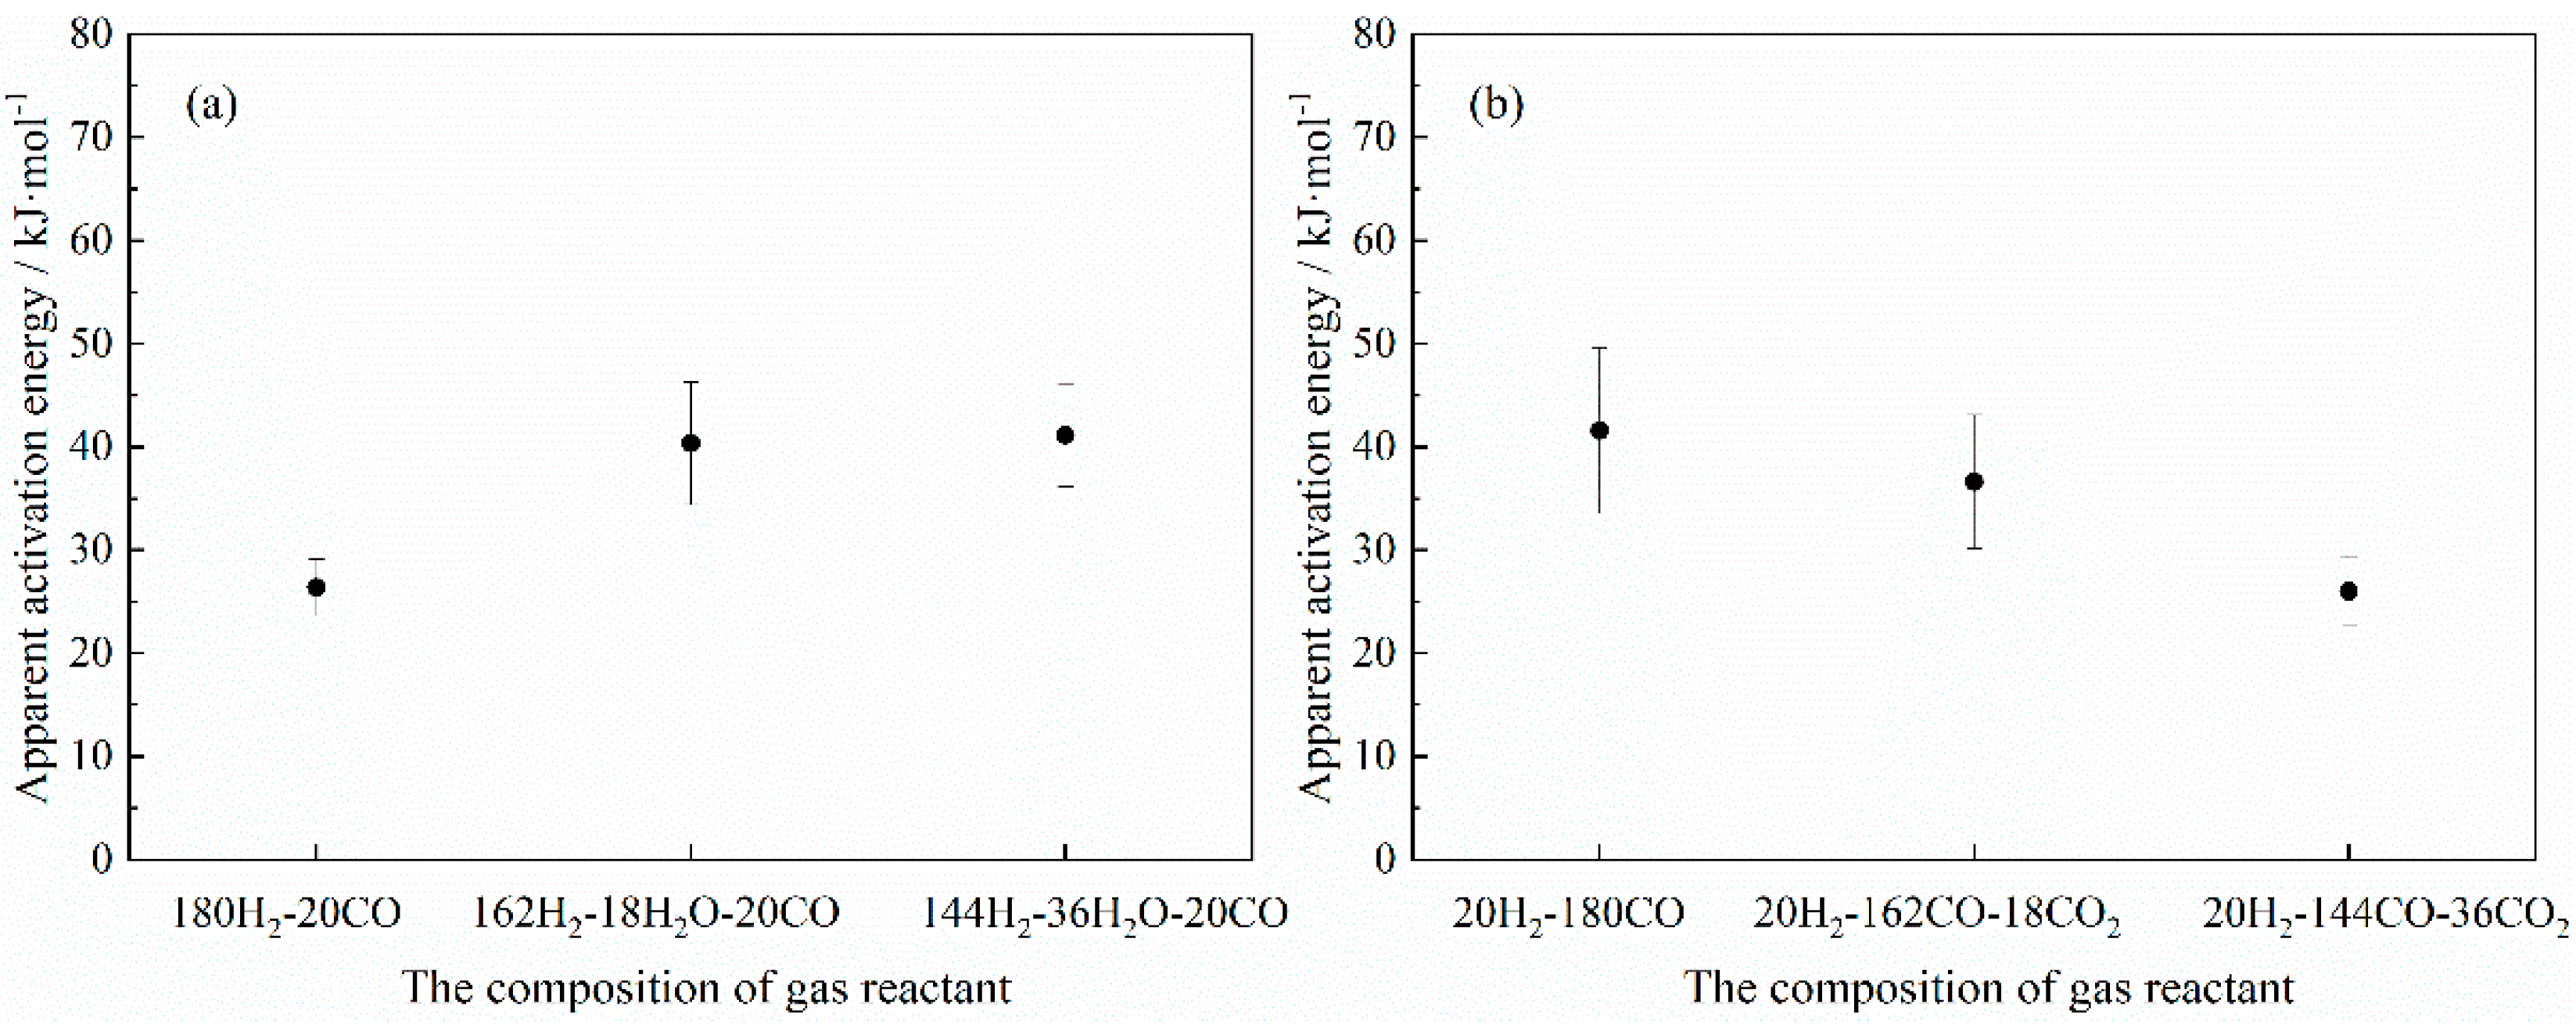
The adsorption of a gas reactant on the solid reactant surface is a prerequisite for the occurrence of a gas–solid chemical reaction. The unreacted gas components in the gas mixture mainly interfere with the reaction process by affecting the diffusion or adsorption (subsequent interfacial chemical reaction) of the gas reactant. The possible rate-controlling step of the reaction (gas diffusion, interfacial chemical reaction, etc.) can be indirectly inferred from the apparent activation energy of the reaction, as shown in Table 5. In this study, the apparent activation energy for the reactions between hematite and the gas mixture was derived using the Arrhenius Equation based on previously established research and analysis methods [31,46], as shown in Figure 9.
From Figure 9a, it could be observed that the apparent activation energy of the reaction was basically around 26 kJ/mol when the H2-CO gas mixture was not mixed with H2O. Referring to the empirical relationship between the apparent activation energy and the reaction, it could be found that the possible rate-controlling step of the reaction at this time was a combined gas diffusion and interfacial chemical reaction biased towards the gas diffusion. With the addition of H2O in the H2-CO gas mixture, the apparent activation energy of the reaction increased with its content, and the possible rate-controlling step changed to a combined gas diffusion and interfacial chemical reaction biased towards the interfacial chemical reaction, which meant that the addition of H2O mainly influenced the occurrence of the interfacial chemical reaction. In addition, it was noteworthy that this implied that the addition of H2O had a relatively greater impact on the interfacial chemical reaction rather than not affecting the diffusion ability of the H2-CO gas mixture. However, as the CO2 content in the gas mixture increased, the apparent activation energy of the reaction presented a decreasing trend. When the content of CO2 was 20%, the apparent activation energy was decreased to 25.98 kJ/mol, and with reference to Table 5, it could be found that the possible rate-controlling step changed from a combined gas diffusion and interfacial chemical reaction biased towards the interfacial chemical reaction to a combined gas diffusion and interfacial chemical reaction biased towards gas diffusion. Therefore, comparing the effects of H2O and CO2 on the apparent activation energy of the reaction, it can be seen that the effects of H2O and CO2 on the possible rate-controlling step of the reaction were different.
According to the analysis results of the apparent activation energy of the reaction, on the whole, CO2 had a greater impact on the gas diffusion, while H2O had a greater impact on the interfacial chemical reaction (gas adsorption). Moreover, from the adsorption behavior results of the gas molecules (H2, CO, H2O and CO2) on the hematite surface, the adsorption energy of the Fe2O3-CO adsorption system was −1.317 eV, which was smaller than the adsorption energy of the Fe2O3-CO2 adsorption system (−0.076 eV), indicating that the Fe2O3-CO adsorption system was more stable than the Fe2O3-CO2 adsorption system. On the other hand, the adsorption energy of the Fe2O3-H2O adsorption system was −0.702 eV, indicating that its adsorption stability was also higher than that of the Fe2O3-H2 adsorption system (adsorption energy value of −0.013 eV). This suggested that in the case of competitive adsorption on the hematite surface, the H2O molecule would have a relatively large impact on the adsorption of the H2 molecule. In addition, under the conditions of pre-adsorbed H2O (or CO2), it was found that the stability of the Fe2O3-CO adsorption system formed when the CO molecule directly adsorbed to Fe2O3 was relatively stronger, and compared with the H2O molecule, CO2 had relatively less influence on the subsequent reduction behavior of CO with Fe2O3, which was consistent with the analysis results of the apparent activation energy of the reaction.

4. Conclusions

This study systematically investigates the adsorption behaviors of gas molecules (H2, CO, H2O and CO2) on hematite surface, integrated with reduction experiment results, yielding the following conclusions:
(1)
The gas molecules (H2, CO, H2O and CO2) all adsorbed on the Fe atom of the Fe2O3 (001) surface rather than the O atom. In addition, the adsorption energy of the Fe2O3-CO adsorption system was −1.317 eV, which was smaller than the adsorption energy of the Fe2O3-H2 adsorption system (−0.013 eV), indicating that the Fe2O3-CO adsorption system was more stable than the Fe2O3-H2 adsorption system. And the adsorption energy of the Fe2O3-H2O adsorption system was −0.702 eV, indicating that its adsorption stability was also higher than that of the Fe2O3-H2 adsorption system.
(2)
The H2O molecule pre-adsorption was beneficial to the H2 molecule adsorption, but the H2O molecule pre-adsorption affected the further reduction behavior of Fe2O3 by H2. However, the adsorption energy of the CO molecule adsorbed to the Fe2O3-CO2 adsorption system was larger than that of the CO molecule directly adsorbed to Fe2O3, indicating that the stability of the Fe2O3-CO adsorption system was relatively stronger. Considering the adsorption energy alone, compared with the H2O molecule, CO2 had relatively less influence on the subsequent reduction behavior of CO with Fe2O3.
(3)
With the addition of H2O in the H2-CO gas mixture, the apparent activation energy of the reduction reaction increased with its content, which meant that the addition of H2O mainly influenced the occurrence of the interfacial chemical reaction. However, the apparent activation energy presented a decreasing trend as the CO2 content in the H2-CO gas mixture increased, suggesting that the possible rate-controlling step changed to a combined gas diffusion and interfacial chemical reaction biased towards gas diffusion. Therefore, on the whole, CO2 had a greater impact on the gas diffusion, while H2O had a greater impact on the interfacial chemical reaction (gas adsorption), which was consistent with the DFT calculation results.

Supplementary Materials

The following supporting information can be downloaded at https://www.mdpi.com/article/10.3390/ma18174175/s1, Figure S1: The initial structure of the (a) Fe2O3-H2, (b) Fe2O3-CO, (c) Fe2O3-H2O and (d) Fe2O3-CO2 systems. Figure S2: The initial structure of (a) Fe2O3-H2O-H2 and (b) Fe2O3-CO2-CO.

Author Contributions

Conceptualization, K.C.; Methodology, Y.X.; Validation and Review and Editing, J.L. and J.C.; Experimenting and Writing, X.M. and B.Z.; Resources and Project Administration, H.D. and Q.Z. All authors have read and agreed to the published version of the manuscript.

Funding

This research was funded by the Jiangxi General Institute of Testing and Certification, grant number 72410000306.

Data Availability Statement

The original contributions presented in this study are included in the article/Supplementary Material. Further inquiries can be directed to the corresponding authors.

Acknowledgments

The authors are very grateful for the additional support (including calculation software) from the State Key Laboratory of Advanced Metallurgy (USTB).

Conflicts of Interest

The authors declare no conflicts of interest.

References

  1. Kim, J.; Sovacool, B.K.; Bazilian, M.; Griffiths, S.; Lee, J.; Yang, M.; Lee, J. Decarbonizing the iron and steel industry: A systematic review of sociotechnical systems, technological innovations, and policy options. Energy Res. Soc. Sci. 2022, 89, 102565. [Google Scholar] [CrossRef]
  2. World Steel Association. World Steel in Figures 2025. Available online: https://worldsteel.org/data/world-steel-in-figures/world-steel-in-figures-2025/ (accessed on 29 July 2025).
  3. Birat, J.P. Society, Materials, and the Environment: The Case of Steel. Metals 2020, 10, 331. [Google Scholar] [CrossRef]
  4. Raabe, D. The Materials Science behind Sustainable Metals and Alloys. Chem. Rev. 2023, 123, 2436–2608. [Google Scholar] [CrossRef]
  5. Wenceslao, J.; Samane, M. Sustainability in steelmaking. Curr. Opin. Green Sust. 2020, 24, 42–47. [Google Scholar] [CrossRef]
  6. Raabe, D.; Tasan, C.C.; Olivetti, E.A. Strategies for improving the sustainability of structural metals. Nature 2019, 575, 64–74. [Google Scholar] [CrossRef] [PubMed]
  7. Tian, S.; Jiang, J.; Zhang, Z.; Manovic, V. Inherent potential of steelmaking to contribute to decarbonisation targets via industrial carbon capture and storage. Nat. Commun. 2018, 9, 4422. [Google Scholar] [CrossRef]
  8. Wolfinger, T.; Spreitzer, D.; Schenk, J. Analysis of the Usability of Iron Ore Ultra-Fines for Hydrogen-Based Fluidized Bed Direct Reduction—A Review. Materials 2022, 15, 2687. [Google Scholar] [CrossRef]
  9. Heidari, A.; Niknahad, N.; Iljana, M.; Fabritius, T. A Review on the Kinetics of Iron Ore Reduction by Hydrogen. Materials 2021, 14, 7540. [Google Scholar] [CrossRef] [PubMed]
  10. Chen, Y.; Zuo, H. Review of hydrogen-rich ironmaking technology in blast furnace. Ironmak. Steelmak. 2021, 48, 749–768. [Google Scholar] [CrossRef]
  11. Sun, M.; Pang, K.; Barati, M.; Meng, X. Hydrogen-Based Reduction Technologies in Low-Carbon Sustainable Ironmaking and Steelmaking: A Review. J. Sustain. Metall. 2024, 10, 10–25. [Google Scholar] [CrossRef]
  12. Turkdogan, E.T.; Vinters, J.V. Reducibility of iron ore pellets and effect of additions. Can. Metall. Quart. 1973, 12, 9–21. [Google Scholar] [CrossRef]
  13. Yadav, U.S.; Pandey, B.D.; Das, B.K.; Jena, D.N. Influence of magnesia on sintering characteristics of iron ore. Ironmak. Steelmak. 2002, 29, 91–95. [Google Scholar] [CrossRef]
  14. Seth, B.; Ross, H.U. The Effect of Lime on The Reducibility of Iron-Oxide Agglomerates. Can. Metall. Quart. 1963, 2, 15–30. [Google Scholar] [CrossRef]
  15. Salucci, E.; D’Angelo, A.; Russo, V.; Grénman, H.; Saxén, H. Review on the reduction kinetics of iron oxides with hydrogen-rich gas: Experimental investigation and modeling approaches. Ind. Eng. Chem. Res. 2025, 64, 1–35. [Google Scholar] [CrossRef]
  16. Lyu, B.; Wang, G.; Yang, F.; Zuo, H.; Xue, Q.; Wang, J. Kinetic Analysis of Isothermal and Non-Isothermal Reduction of Iron Ore Fines in Hydrogen Atmosphere. Metals 2022, 12, 1754. [Google Scholar] [CrossRef]
  17. Zakeri, A.; Coley, K.S.; Tafaghodi, L. Hydrogen-Based Direct Reduction of Iron Oxides: A Review on the Influence of Impurities. Sustainability 2023, 15, 13047. [Google Scholar] [CrossRef]
  18. Jozwiak, W.K.; Kaczmarek, E.; Maniecki, T.P.; Ignaczak, W.; Maniukiewicz, W. Reduction behavior of iron oxides in hydrogen and carbon monoxide atmospheres. Appl. Catal. A Gen. 2007, 326, 17–27. [Google Scholar] [CrossRef]
  19. Mao, X.; Hu, X.; Fan, Y.; Chou, K. Effect of water vapor on the reduction kinetics of hematite powder by hydrogen-water vapor in different stages. J. Min. Metall. B 2023, 59, 65–76. [Google Scholar] [CrossRef]
  20. Hammam, A.; Nasr, M.I.; Elsadek, M.H. Studies on the Reduction Behavior of Iron Oxide Pellet Fines with Hydrogen Gas: Mechanism and Kinetic Analysis. J. Sustain. Metall. 2023, 9, 1289–1302. [Google Scholar] [CrossRef]
  21. Spreitzer, D.; Schenk, J. Iron Ore Reduction by Hydrogen Using a Laboratory Scale Fluidized Bed Reactor: Kinetic Investigation—Experimental Setup and Method for Determination. Metall. Mater. Trans. B 2019, 50, 2471–2484. [Google Scholar] [CrossRef]
  22. Guo, X.; Sasaki, Y.; Kashiwaya, Y. Microreaction mechanism in reduction of magnetite to wustite. Metall. Mater. Trans. B 2004, 35, 517–522. [Google Scholar] [CrossRef]
  23. Daniel, S.; Johannes, S. Reduction of Iron Oxides with Hydrogen—A Review. Steel Res. Int. 2019, 90, 1900108. [Google Scholar] [CrossRef]
  24. Yu, X.; Li, Y.; Li, Y.W.; Wang, J.; Jiao, H. DFT+U Study of Molecular and Dissociative Water Adsorptions on the Fe3O4(110) Surface. J. Phys. Chem. C 2013, 117, 7648–7655. [Google Scholar] [CrossRef]
  25. Wang, K.; Han, T.; Chen, X.; Rushimisha, I.E. Insights into behavior and mechanism of tetracycline adsorption on virgin and soil-exposed microplastics. J. Hazard. Mater. 2022, 440, 129770. [Google Scholar] [CrossRef]
  26. Wang, Y.; Chen, J.; Wei, X.; Maldonado, A.J.H.; Chen, Z. Unveiling Adsorption Mechanisms of Organic Pollutants onto Carbon Nanomaterials by Density Functional Theory Computations and Linear Free Energy Relationship Modeling. Environ. Sci. Technol. 2017, 51, 11820–11828. [Google Scholar] [CrossRef]
  27. Zhang, J.; Peng, Z.; Zhang, T. Exploring Mechanism of H2 Adsorption on Surfaces of Iron Oxides by Density Functional Theory Calculation. JOM 2025, 77, 144–155. [Google Scholar] [CrossRef]
  28. Wang, Y.; Li, Z. A DFT-based microkinetic theory for Fe2O3 reduction by CO in chemical looping. P. Combust. Inst. 2023, 39, 4447–4455. [Google Scholar] [CrossRef]
  29. Adam, F.; Dupré, B.; Gleitzer, C. The role of water in the low-temperature hydrogen reduction of hematite into iron, and the role of the surface oxygen chemical potential in double reactions. React. Solids 1989, 7, 383–397. [Google Scholar] [CrossRef]
  30. Steffen, R.; Tacke, K.; Pluschkell, W. Grundlagenuntersuchungen zur Umweltfreundlichen Reduktion von Eisenerz mit Wasserstoff oder Wasserstoffreichen Gemischen, 1st ed.; Amt für amtliche Veröffentlichungen der Europäischen Gemeinschaften: Luxembourg, 1998; pp. 56–60. [Google Scholar]
  31. Mao, X. Fundamental Study on the Reaction Behavior of Iron Oxide and H2-CO Mixture Gas. Ph.D. Thesis, University of Science and Technology Beijing, Beijing, China, 2023. [Google Scholar] [CrossRef]
  32. Segall, M.D.; Lindan, P.J.D.; Probert, M.J. First-principles simulation: Ideas, illustrations and the CASTEP code. J. Phys.-Condens. Mat. 2002, 14, 2717–2744. [Google Scholar] [CrossRef]
  33. Wang, Y.; Perdew, J.P.; Chevary, J.A. Exchange potentials in density-functional theory. Phys. Rev. A 1990, 41, 78–86. [Google Scholar] [CrossRef]
  34. Perdew, J.P.; Chevary, J.A.; Vosko, S.H. Atoms, molecules, solids, and surfaces: Applications of the generalized gradient approximation for exchange and correlation. Phys. Rev. B 1992, 46, 6671–6687. [Google Scholar] [CrossRef]
  35. Monkhorst, H.J.; Pack, J.D. Special points for Brillouin-zone integrations. Phys. Rev. B 1976, 13, 5188–5192. [Google Scholar] [CrossRef]
  36. Vanderbilt, D. Soft self-consistent pseudopotentials in a generalized eigenvalue formalism. Phys. Rev. B 1990, 41, 7892. [Google Scholar] [CrossRef]
  37. Fletcher, R. A new approach to variable metric algorithms. Comput. J. 1970, 13, 317–322. [Google Scholar] [CrossRef]
  38. Tian, X.G.; Zhang, Y.; Yang, T.S. First-principles study of H2 dissociative adsorption reactions on WO3 surfaces. Acta Phys. Chim. Sin. 2012, 28, 1063–1069. [Google Scholar] [CrossRef]
  39. Ho, Q.D.; Rauls, E. Cavity size effects on the adsorption of CO2 on pillar[n]arene structures: A density functional theory study. ChemistrySelect 2023, 8, e202302266. [Google Scholar] [CrossRef]
  40. Ho, Q.D.; Rauls, E. Investigations of functional groups effect on CO2 adsorption on pillar[5]arenes using density functional theory calculations. ChemistrySelect 2024, 9, e202401490. [Google Scholar] [CrossRef]
  41. Ho, Q.D.; Rauls, E. Ab initio study: Investigating the adsorption behaviors of polarized greenhouse gas molecules on pillar[5]arenes. Mater. Today Commun. 2023, 36, 106875. [Google Scholar] [CrossRef]
  42. Zhou, X.; Xu, Q.; Lei, W. Origin of tunable photocatalytic selectivity of well-defined α-Fe2O3 nanocrystals. Small 2014, 10, 674–679. [Google Scholar] [CrossRef] [PubMed]
  43. Xu, C.Y. Research on Reduction Behavior of Fluxed Pellets Under Hydrogen-Rich Conditions in Blast Furnace. Ph.D. Thesis, University of Science and Technology Beijing, Beijing, China, 2022. [Google Scholar] [CrossRef]
  44. Han, G.; Chen, X.F.; Zhao, T.X.; Li, C.C.; Weng, X. Effect of alloying element doping on hydrogen adsorption and corrosion behavior of Fe2O3 (001) via high throughput method. Anti-Corros. Methods Mater. 2025, 72, 490–496. [Google Scholar] [CrossRef]
  45. Han, G.; Zhao, T.X.; Chen, X.F.; Li, C.C.; Weng, X. Effect of hydrogen on surface structure of Fe2O3 (001) containing point defects. Anti-Corros. Methods Mater. 2025, 75, 664–671. [Google Scholar] [CrossRef]
  46. Mao, X.; Garg, P.; Hu, X. Kinetic analysis of iron ore powder reaction with hydrogen—Carbon monoxide. Int. J. Miner. Metall. Mater. 2022, 29, 1882–1890. [Google Scholar] [CrossRef]
  47. Nasr, M.I.; Omar, A.A.; Khedr, M.H.; El-Geassy, A.A. Effect of Nickel Oxide Doping on the Kinetics and Mechanism of Iron Oxide Reduction. ISIJ Int. 1995, 35, 1043–1049. [Google Scholar] [CrossRef]
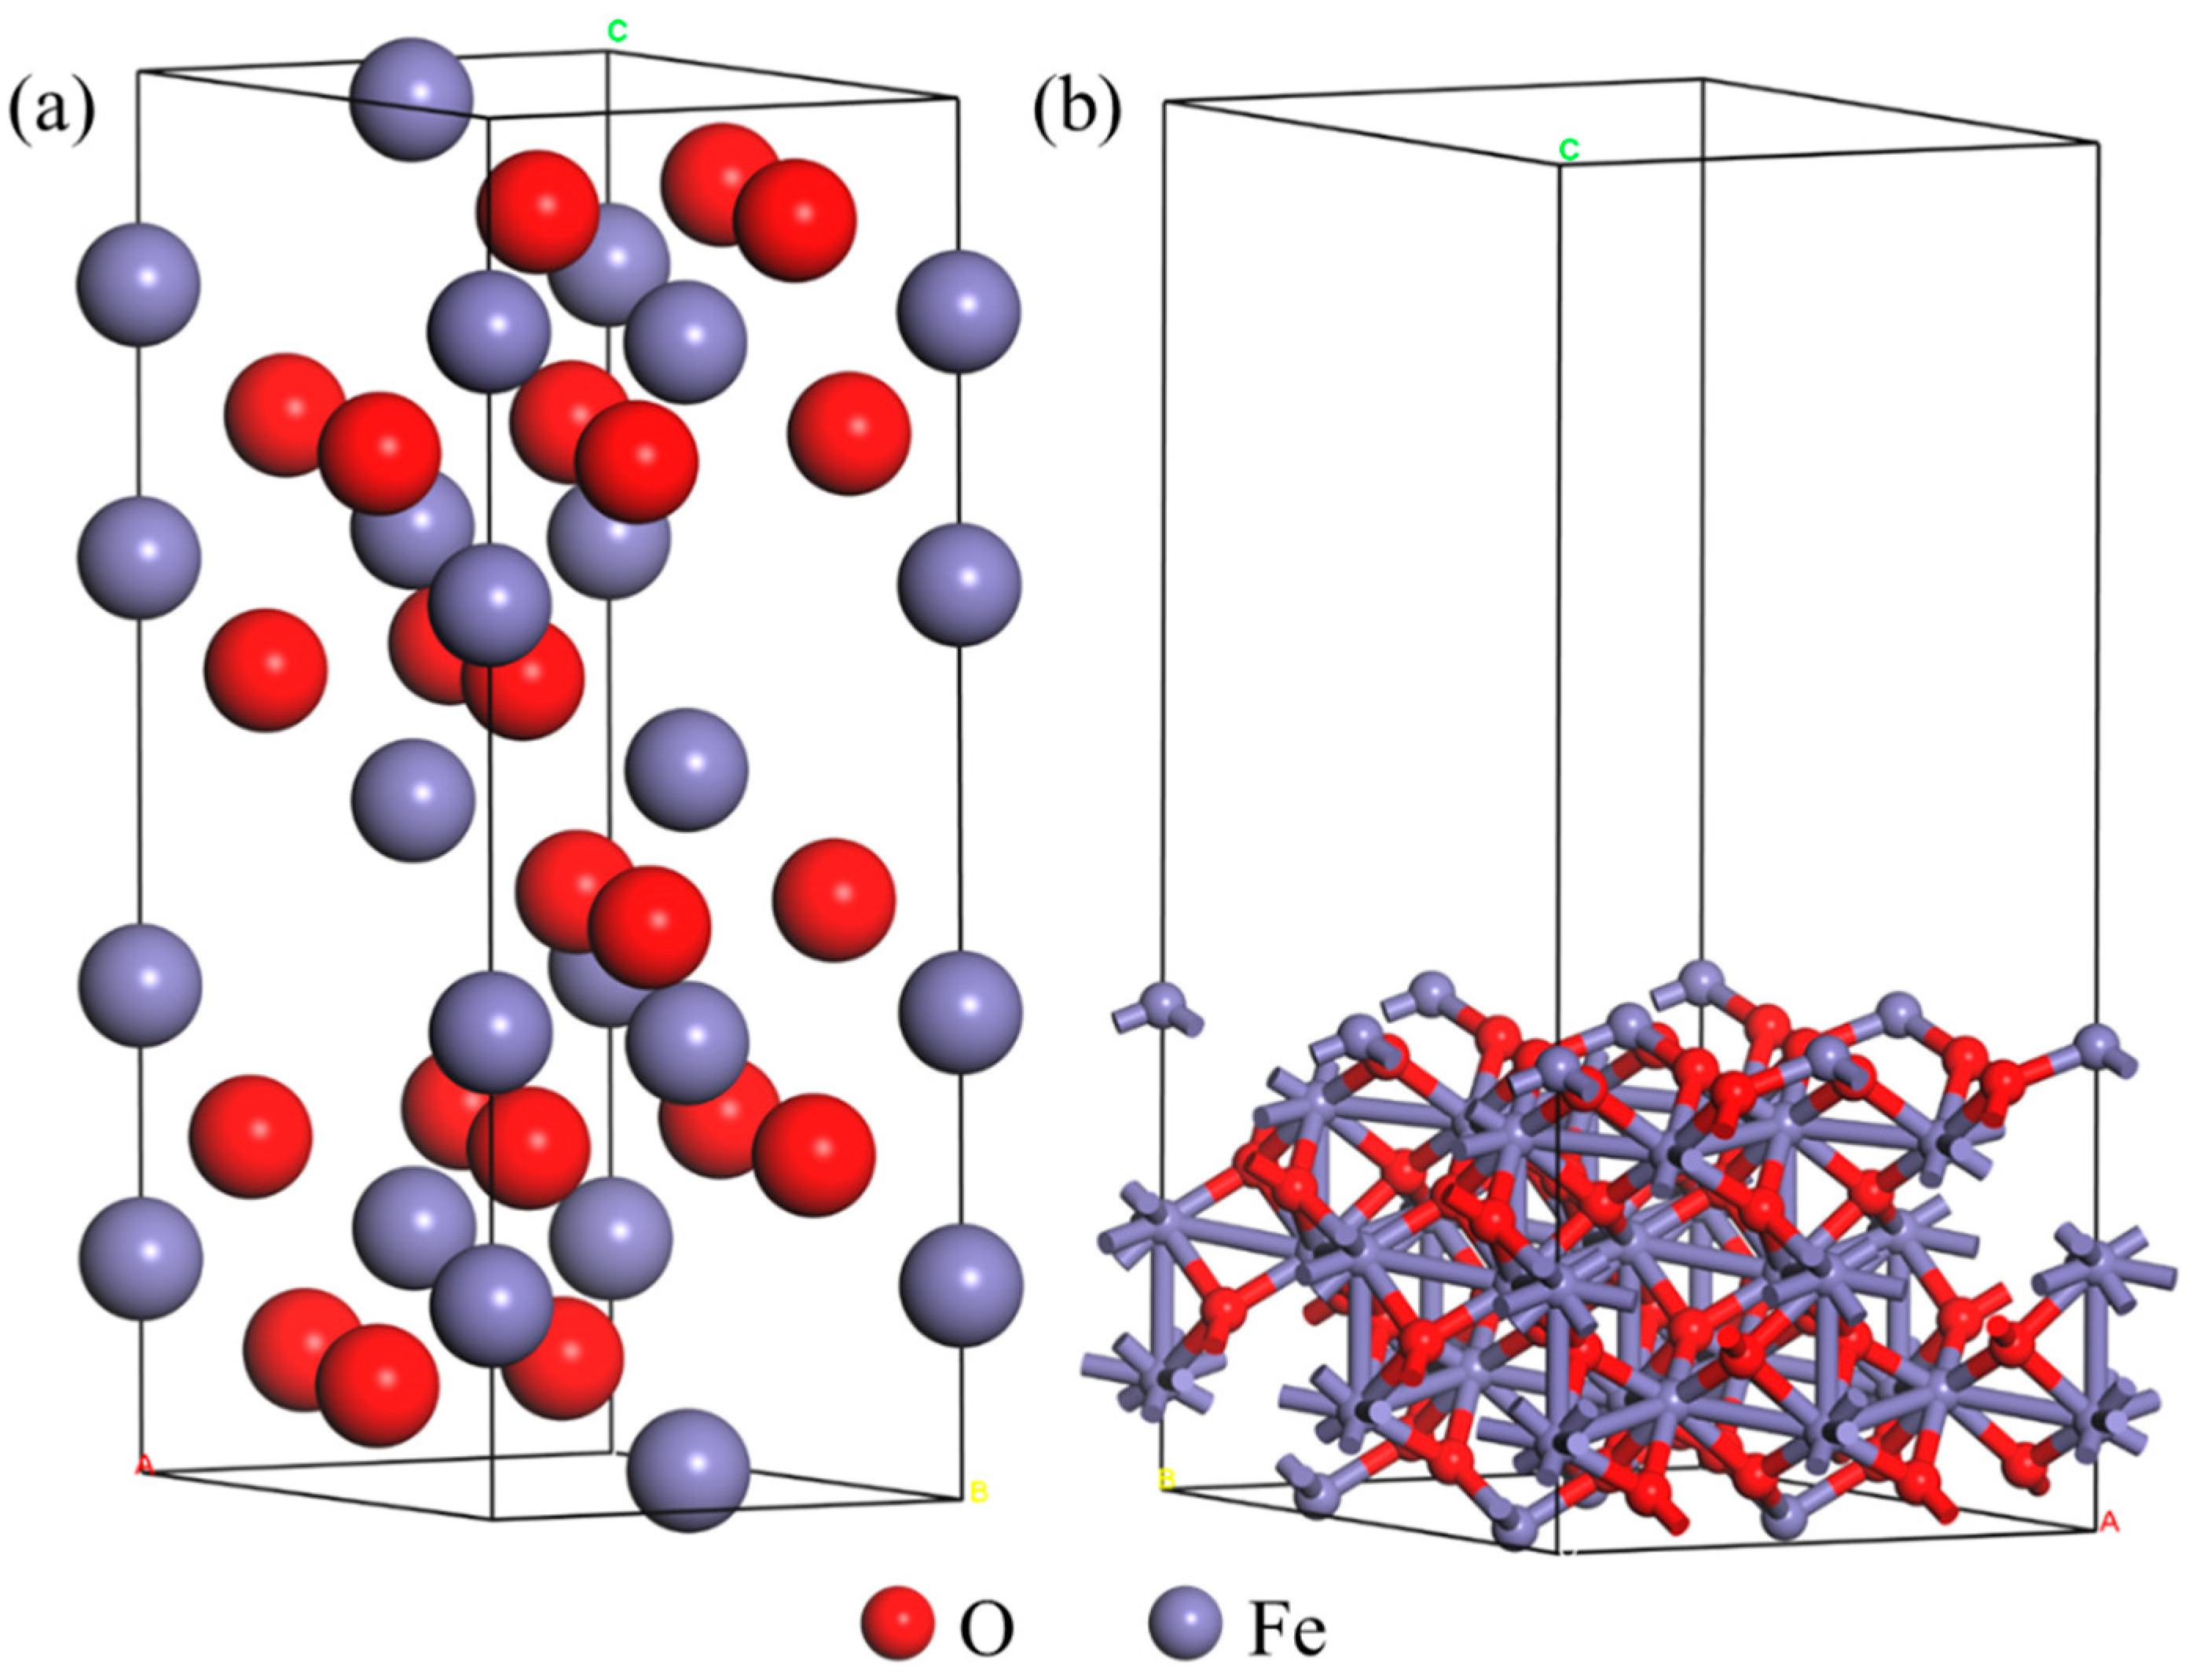
Figure 1. Structure diagram: (a) Fe2O3 crystal structure; (b) Fe2O3 (001) supercell model structure.
Materials 18 04175 g001
Figure 2. The schematic diagram of the experimental setup: (a) H2-CO-CO2; (b) H2-CO-H2O.
Materials 18 04175 g002
Figure 3. The trend of experimental conditions in this study.
Materials 18 04175 g003
Figure 4. Adsorption system: (a) Fe2O3-H2; (b) Fe2O3-CO; (c) Fe2O3-H2O; (d) Fe2O3-CO2.
Materials 18 04175 g004
Figure 5. Charge density diagram of adsorption system: (a) Fe2O3; (b) Fe2O3-H2; (c) Fe2O3-CO; (d) Fe2O3-H2O; (e) Fe2O3-CO2.
Materials 18 04175 g005
Figure 6. The DOS of adsorption atoms in the adsorption system: (a) Fe2O3-H2; (b) Fe2O3-CO; (c) Fe2O3-H2O; (d) Fe2O3-CO2.
Materials 18 04175 g006
Figure 7. Adsorption system: (a) Fe2O3-H2O-H2; (b) Fe2O3-CO2-CO.
Materials 18 04175 g007
Figure 8. The DOS of adsorption atoms in the adsorption system: (a) Fe2O3-H2O-H2; (b) Fe2O3-CO2-CO.
Materials 18 04175 g008
Figure 9. Relation between the composition of the gas reactant and the apparent activation energy: (a) H2-CO-H2O; (b) H2-CO-CO2.
Materials 18 04175 g009
Table 1. Experimental conditions.
H2:(CO + CO2)CO:CO2No.Temperature/KFlow Rate/(mL/min)
H2COCO2
1:910:011023201800
21173201800
31273201800
41373201800
9:1510232016218
611732016218
712732016218
813732016218
8:2910232014436
1011732014436
1112732014436
1213732014436
(H2 + H2O):COH2:H2ONo.Temperature/KFlow Rate/(mL/min)
H2COH2O
9:110:0131023180200
141173180200
151273180200
161373180200
9:11710231622018
1811731622018
1912731622018
2013731622018
8:22110231442036
2211731442036
2312731442036
2413731442036
Table 2. Adsorption energy of adsorption system.
Adsorption SystemFe2O3-H2Fe2O3-COFe2O3-H2OFe2O3-CO2
adsorption energy/eV−0.013−1.317−0.702−0.076
Table 3. Parameters of Fe2O3 after adsorption of gas molecule.
Adsorption SystemFe2O3 (Initial)Fe2O3-H2Fe2O3-COFe2O3-H2OFe2O3-CO2
dFe-adsorption atom-1.8141.8082.0642.057
dFe-O1.7161.7461.7721.7581.746
net charge of Fe/e0.750.950.760.90.96
bond order of Fe-O0.540.490.520.470.5
Table 4. Parameters of adsorption system.
Adsorption SystemFe2O3-H2Fe2O3-H2O-H2Fe2O3-COFe2O3-CO2-CO
dFe-adsorption atom1.8141.7121.8081.809
dFe-O1.7461.7631.7721.772
net charge of Fe/e0.950.930.760.82
bond order of Fe-O0.490.480.520.49
adsorption energy/eV−0.013−0.132−1.317−1.203
Table 5. Relationship between apparent activation energy and possible rate-controlling step and data from Reference [47].
NO.Apparent Activation Energy (kJ/mol)Possible Rate-Controlling Step
18~16Gas diffusion
229~42Combined gas diffusion and interfacial chemical reaction
360~67Interfacial chemical reaction
4>90Solid-state diffusion
Disclaimer/Publisher’s Note: The statements, opinions and data contained in all publications are solely those of the individual author(s) and contributor(s) and not of MDPI and/or the editor(s). MDPI and/or the editor(s) disclaim responsibility for any injury to people or property resulting from any ideas, methods, instructions or products referred to in the content.