Article

Nanostructured Metal Oxide from Metallic Glass for Water Splitting: Effect of Hydrothermal Duration on Structure and Performance

1
Department of Nanotechnology and Advanced Materials Engineering, Sejong University, 209, Neungdong-ro, Gwangjin-gu, Seoul 05006, Republic of Korea
2
Erich Schmid Institute of Materials Science, Austrian Academy of Sciences, Jahnstraße 12, 8700 Leoben, Austria
3
Department of Materials Science Montanuniversität Leoben, Jahnstraße 12, 8700 Leoben, Austria
*
Author to whom correspondence should be addressed.
These authors contribute equally to this work.
Materials 2025, 18(17), 4082; https://doi.org/10.3390/ma18174082 (registering DOI)
Submission received: 13 August 2025 / Revised: 26 August 2025 / Accepted: 28 August 2025 / Published: 31 August 2025
(This article belongs to the Section Metals and Alloys)

Abstract

This study investigates the optimal duration for forming a uniform oxide layer and evaluates its influence on water-splitting performance. We selected a Ti50Cu32Ni15Sn3 amorphous ribbon, which is known to simultaneously form anatase TiO2 and Sn oxide via a single hydrothermal process. Hydrothermal treatments were conducted at 220 °C in 150 mL of distilled water for durations of 3 and 6 h. The process successfully formed nanoscale metal oxides on the alloy surface, with the uniformity of the oxide layer increasing over time. The amorphous phase of the alloy was retained under all conditions. X-ray photoelectron spectroscopy (XPS) analysis confirmed the formation of TiO2 and SnOx, while Cu and Ni remained in their metallic state. Furthermore, we verified the coexistence of these oxides with metallic Ti and Sn. Photoelectrochemical analysis showed that the sample treated for 6 h exhibited the best water-splitting performance, which correlated directly with the most uniform oxide coverage. This time-controlled hydrothermal oxidation method, using only water, presents a promising and efficient approach for developing functional surfaces for electronic and photoelectrochemical applications of metallic glasses (MGs).

1. Introduction

Metallic glasses (MGs), which possess a disordered atomic structure, exhibit outstanding properties such as high strength, large elastic limits, and superior corrosion resistance compared to their crystalline counterparts [1,2,3,4]. The combination of these attributes, including their excellent formability, high electrical conductivity, and corrosion resistance, has led to their application in various fields, such as structural, energy, electronic, and electrochemical engineering [5,6,7,8,9,10,11,12,13]. The exceptional corrosion resistance of MGs [14,15,16,17] is particularly advantageous in the harsh, acidic environments typical of water splitting, offering a pathway to overcome the long-term stability issues faced by conventional photoelectrode materials.
A recent study reported a method where a metallic glass ribbon, without atomic-scale phase separation, serves as a precursor for the in situ formation of multifunctional oxides via a hydrothermal process, enabling its use as a photoelectrode [18]. Unlike conventional photoelectrode fabrication, which often involves depositing metal oxides onto conductive glass, this single-step oxidation process offers a compelling advantage: it simplifies manufacturing while expanding the application potential of MGs.
In this study, we investigated a Ti50Cu32Ni15Sn3 alloy, previously shown to form both anatase TiO2 and Sn oxide on an amorphous ribbon through a single hydrothermal process [18]. The prior study successfully demonstrated the formation of a mixed-oxide nanostructure through a long-duration hydrothermal process of 96 h. In contrast, our work systematically investigates whether a significantly reduced processing time of 3 and 6 h can achieve a similar nanostructure and comparable high photoelectrochemical performance. This approach is critical for developing a more efficient and scalable fabrication method for metallic glass-based photoelectrodes.
A key aspect of obtaining the desired heterostructure, which consists of photo-reactive oxides for water splitting via a simple process, is strategic alloy design and careful selection of constituent elements based on their affinity for oxygen. In this context, we employed a multi-component metallic glass in which atoms are randomly distributed, thereby facilitating the uniform and simultaneous growth of oxides. This structural feature also provides advantages for developing flexible photoelectrodes. For these reasons, the quaternary Ti-Cu-Ni-Sn metallic glass was specifically designed for the water-splitting photoelectrode, with each element chosen according to its unique role in promoting oxide formation and enhancing performance.
Accordingly, this work focused on elucidating how the degree of oxide formation, as a function of hydrothermal processing time, influences the water-splitting ability of the resulting photoelectrodes. The study was conducted to confirm whether multifunctional oxides could be successfully formed on the substrate surface despite the short processing time and to evaluate the impact of oxide growth kinetics on the overall photoelectrochemical performance.

2. Materials and Methods

The master alloy of Ti50Cu32Ni15Sn3 was strategically designed and prepared for its intended use as a photoelectrode material for water splitting. This quaternary alloy was composed of elements selected based on their specific functional roles and oxygen affinities. Ti and Sn were selected to form a functional oxide with the capability for water splitting, while Cu and Ni were selected for their oxidation resistance to fulfill the necessary mechanical properties and stability of the photoelectrode.
The master alloy Ti50Cu32Ni15Sn3 was prepared by arc-melting high-purity elements (>99.99 wt%) under a high-purity argon atmosphere (99.9999%). The resulting ingot was re-melted by induction in a quartz tube under the same atmosphere and then melt-spun onto a rotating copper wheel (surface velocity: 35 m·s−1) to produce amorphous ribbons approximately 50 μm thick and 10 mm wide.
Hydrothermal oxidation was performed in 150 mL of distilled water at 220 °C for either 3 h (3HRS) or 6 h (6HRS). Phase identification and structural analysis were conducted using X-ray diffraction (XRD; PANalytical Empyrean, Almelo, Netherlands) with Cu Kα1 radiation (λ = 1.5406 Å). Differential scanning calorimetry (DSC) was performed at a heating rate of 20 K·min−1 under a high-purity Ar atmosphere. Surface morphology and oxide coverage were examined using field-emission scanning electron microscopy (FE-SEM; Hitachi SU-8010, Tokyo, Japan). XPS depth profiling was performed on the 6HRS samples using a PHI 5000 VersaProbe (Ulvac-PHI, Chigasaki, Japan) spectrometer with monochromatic Al Kα radiation. For the depth profile, the surface was etched with 2 keV Ar+ ions at a calibrated sputter rate of 15 nm/min using a SiO2 standard. The binding energies were calibrated by referencing the C 1s peak to 284.6 eV. Spectral analysis and quantification were carried out using MultiPak 9.0 software.
Photoelectrochemical (PEC) measurements were performed in a three-electrode cell. For the working electrodes, the as-spun, 3HRS, and 6HRS ribbons were mounted onto fluorine-doped tin oxide (FTO) glass using a silver paste to ensure robust ohmic contact. A platinum (Pt) mesh was used as the counter electrode, and an Ag/AgCl electrode as the reference electrode. Linear sweep voltammetry (LSV) and chronoamperometry (CA) were conducted in 1 M HClO4 (pH 0) under both dark and AM 1.5G illumination (100 mW·cm−2) conditions. All measured potentials were converted to the reversible hydrogen electrode (RHE) scale using the following equation:
ERHE = EAg/AgCl + E0Ag/AgCl + 0.059 × pH.

3. Results and Discussion

Figure 1a,b show the X-ray diffraction (XRD) patterns and differential scanning calorimetry (DSC) traces of the as-spun, 3HRS, and 6HRS Ti50Cu32Ni15Sn3 alloys, respectively.
As seen in Figure 1a, all samples display a broad halo pattern, which is characteristic of an amorphous phase [19]. This indicates that the amorphous structure was retained even after the 3-h and 6-h hydrothermal treatments.
Figure 1b presents the DSC curves, revealing one endothermic reaction (Tg, glass transition) followed by two exothermic reactions (Tx1 and Tx2, crystallization). As summarized in Table 1, the glass transition and crystallization onset temperatures (Tg, Tx1, and Tx2), as well as the integral area of the crystallization peak (ΔH), remained nearly identical for the as-spun, 3HRS, and 6HRS alloys.
Collectively, the data presented in Figure 1a,b and Table 1 provide clear evidence that the as-spun Ti50Cu32Ni15Sn3 alloy is an amorphous phase and that this phase is successfully preserved throughout the hydrothermal process [19,20,21]. This retention of the amorphous phase implies that the samples maintain their inherent flexibility even after the formation of the oxide layer, which is crucial for their potential durability and long-term stability in photoelectrochemical devices and potentially in other flexible electronic and photoelectrochemical applications.
Figure 2a–c present FE-SEM images of the oxide morphology on the as-spun, 3HRS, and 6HRS Ti50Cu32Ni15Sn3 alloys, respectively.
Figure 2a shows that the as-spun alloy has a smooth surface, devoid of any metal oxides. In contrast, the 3HRS sample in Figure 2b exhibits localized formation of oxides with a relatively uniform shape. This indicates that while oxides were formed by the hydrothermal process, the coverage was non-uniform due to the insufficient processing time of 3 h.
As shown in Figure 2c, the 6HRS sample displays a relatively uniform and continuous spread of oxides across the surface. A 45° tilted image (inset of Figure 2c) further reveals that these oxides grew randomly and overlapped with each other, forming a dense layer.
The collective results from Figure 2 demonstrate that longer hydrothermal processing time leads to a more uniform distribution of oxides on the surface of the Ti50Cu32Ni15Sn3 alloy. Based on a previous study with the same composition, temperature, and pressure conditions, the oxides in the layer are primarily the TiO2 anatase phase. It was also reported that Sn oxide is mixed with the TiO2 to create a synergistic effect, analogous to a SnOx-TiO2 junction or Sn-doped TiO2 [18]. Therefore, the oxides in the present study are also expected to be a mixture of Sn oxide and the TiO2 anatase phase.
The observed increase in oxide uniformity and layer density with longer hydrothermal duration, as qualitatively seen in FESEM images (Figure 2), is further corroborated by XPS depth profiling, which allows a quantitative assessment of the oxide layer thickness.
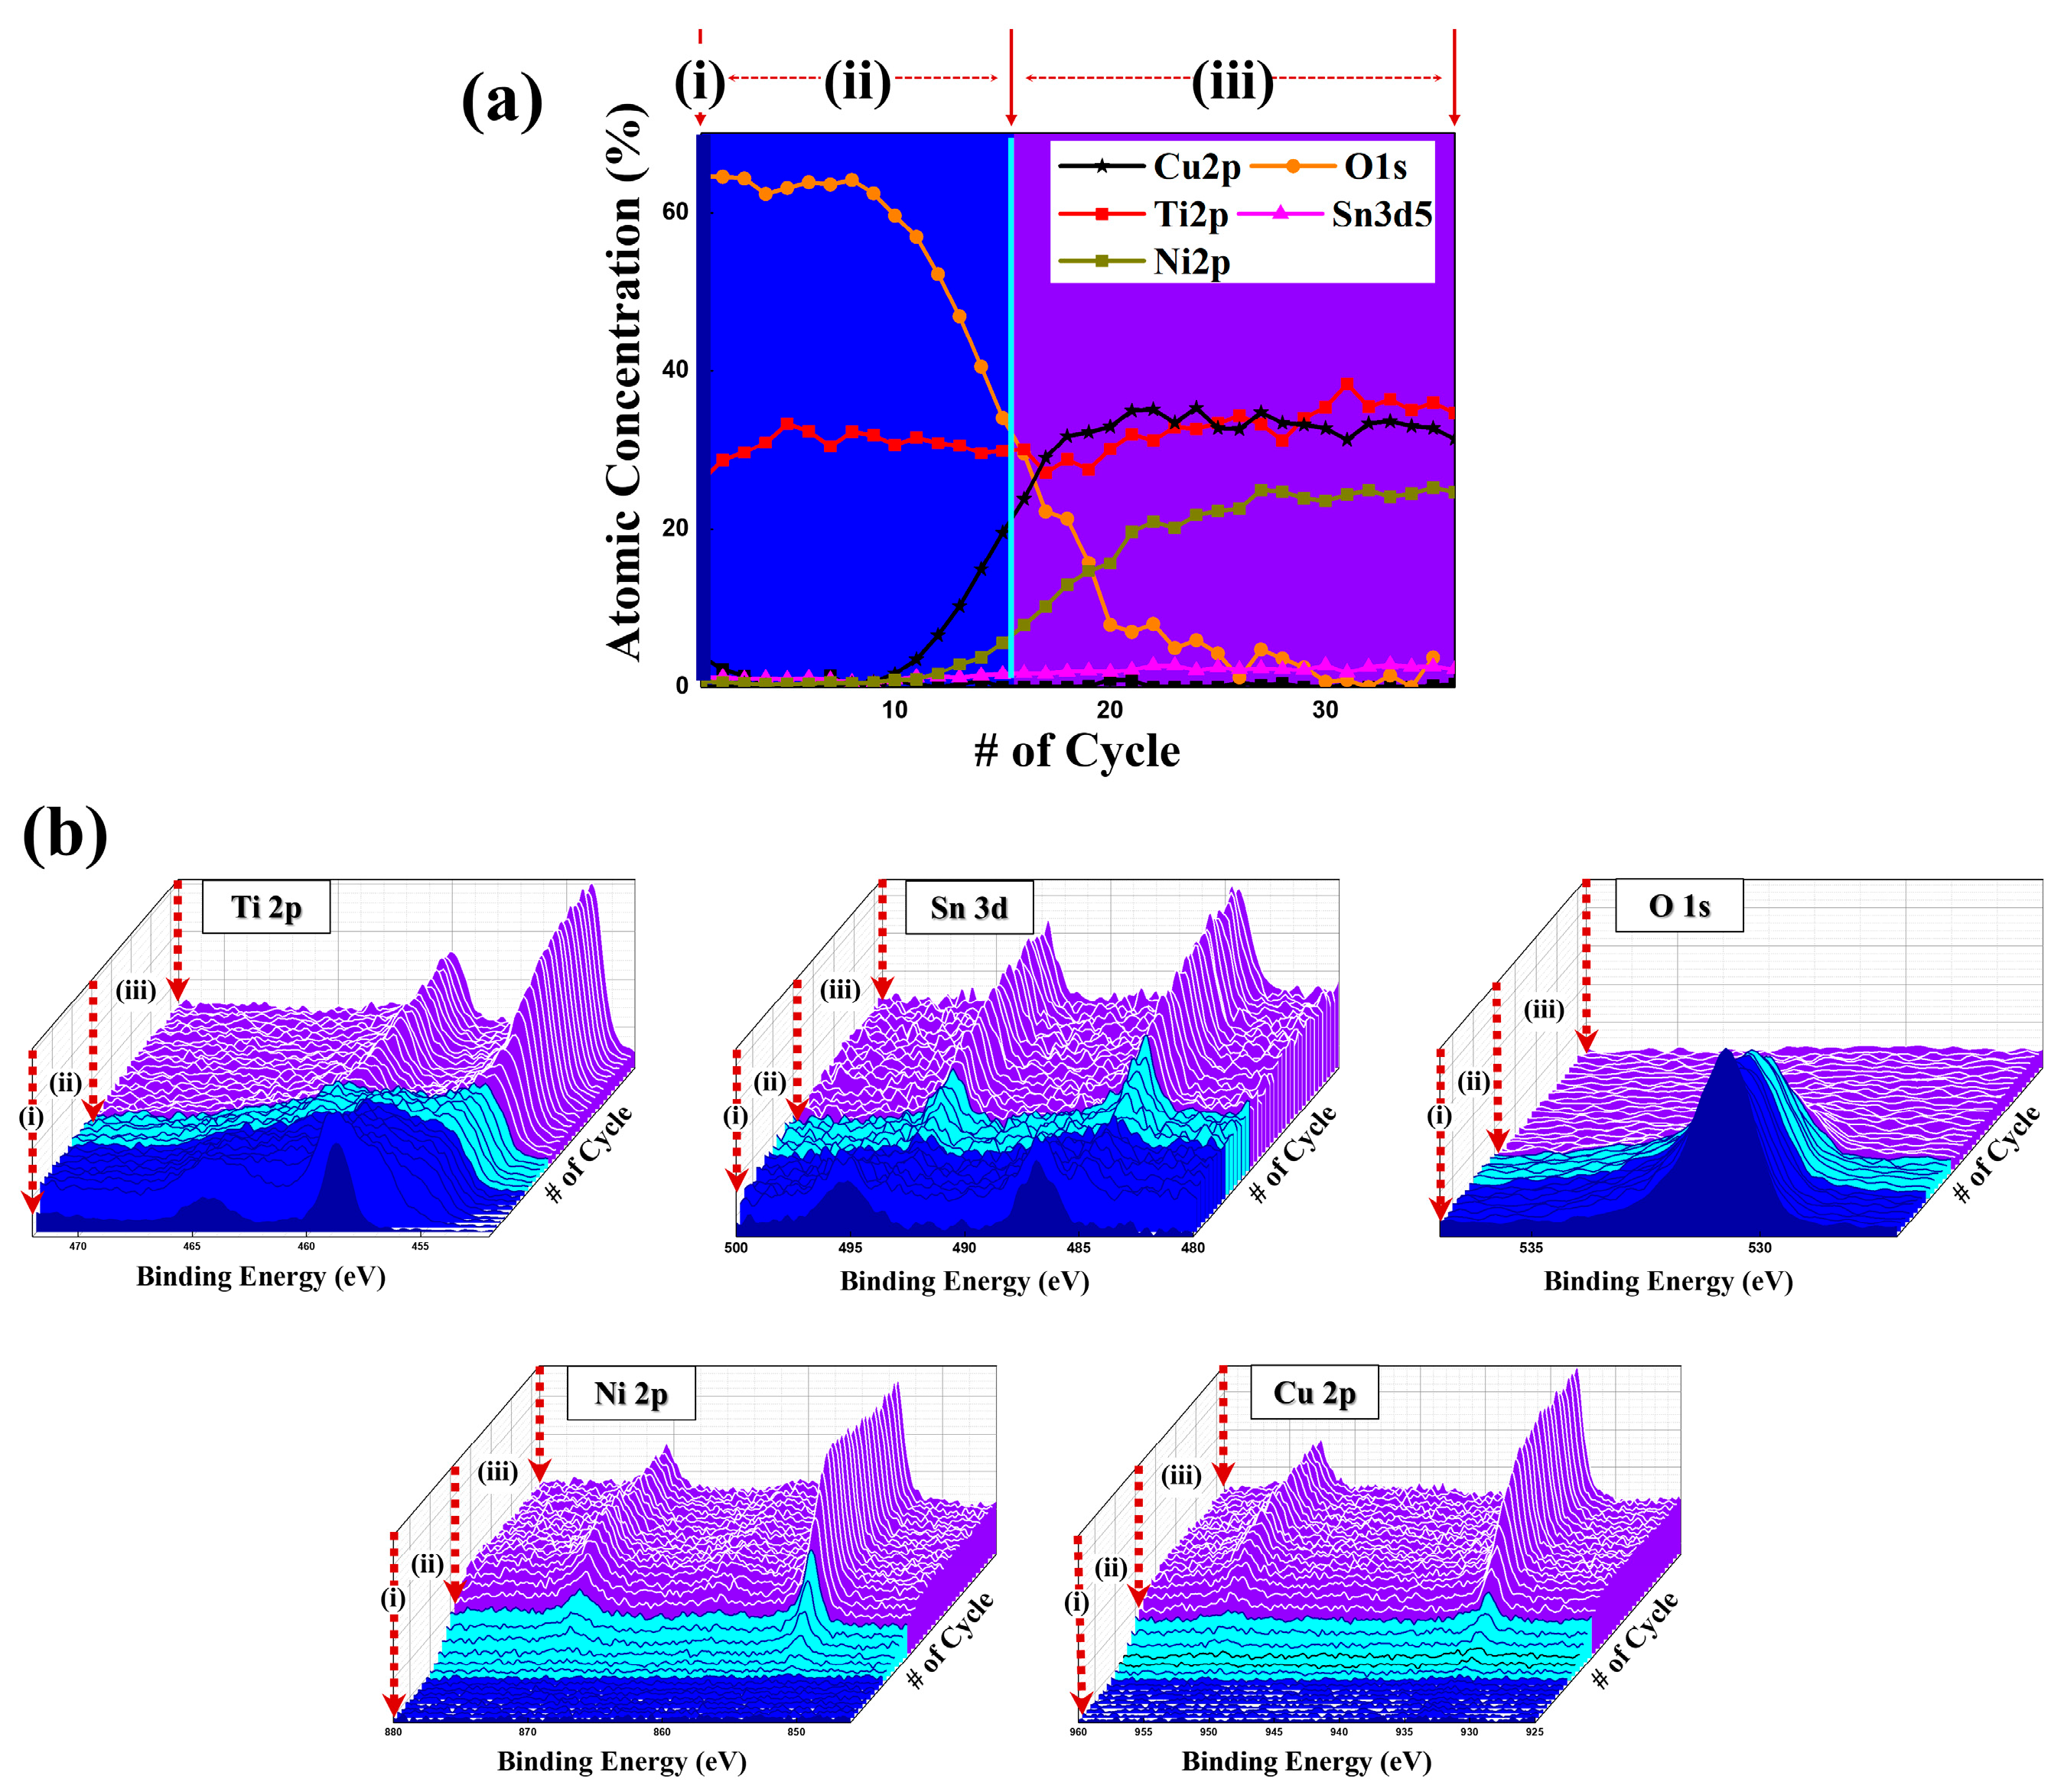
Figure 3a,b show the XPS depth profiling analysis of the 6HRS sample, which exhibited the most uniform oxide layer. The binding energies in the XPS spectra were calibrated using the C 1s peak at 264.6 eV.
As illustrated in Figure 3a, the atomic concentration profile of the 6HRS sample from the surface can be divided into three distinct regions: (i) a surface layer, (ii) an oxide layer with oxygen permeation, and (iii) a metallic layer where oxygen is absent. In the surface layer (i), only O 1s, Ti 2p, and Sn 3d are present. Copper and nickel were not detected until a sufficient depth was reached in the oxide layer (ii). The oxygen concentration gradually decreases with depth, which corresponds to the point where the concentrations of Cu and Ni begin to increase. This trend is consistent with a previously reported 96-h hydrothermal process [18], confirming that a similar nanostructure can be achieved in a significantly shorter 6-h process. The oxide thickness of the 6HRS sample was estimated from the XPS depth profile to be ~27–40 nm, corresponding to the depth region where the O 1s atomic concentration reached its maximum. For comparison, our previous study on the same alloy composition showed that a much longer hydrothermal process of 96 h produced an oxide thickness of ~50 nm [18]. Taken together, these results indicate that the hydrothermal duration directly affects not only the density and uniformity of the oxide layer but also its thickness. This time dependence underscores the importance of systematically optimizing the duration in order to achieve oxide layers with superior structural continuity and photoelectrochemical performance.
Figure 3b shows the profile montage plots for each element. As with the atomic concentration data, Cu 2p and Ni 2p signals are absent from the surface layer (i) and increase with depth, a trend opposite to that of the O 1s signal [22,23,24,25].
In the surface layer (i) and the metallic layer (iii), the Sn 3d and Ti 2p spectra each consist of a single doublet peak. However, multiple mixed peaks are observed within the intermediate oxide layer (ii). The specific chemical states of these elements are further detailed through binding energy deconvolution in Figure 4.
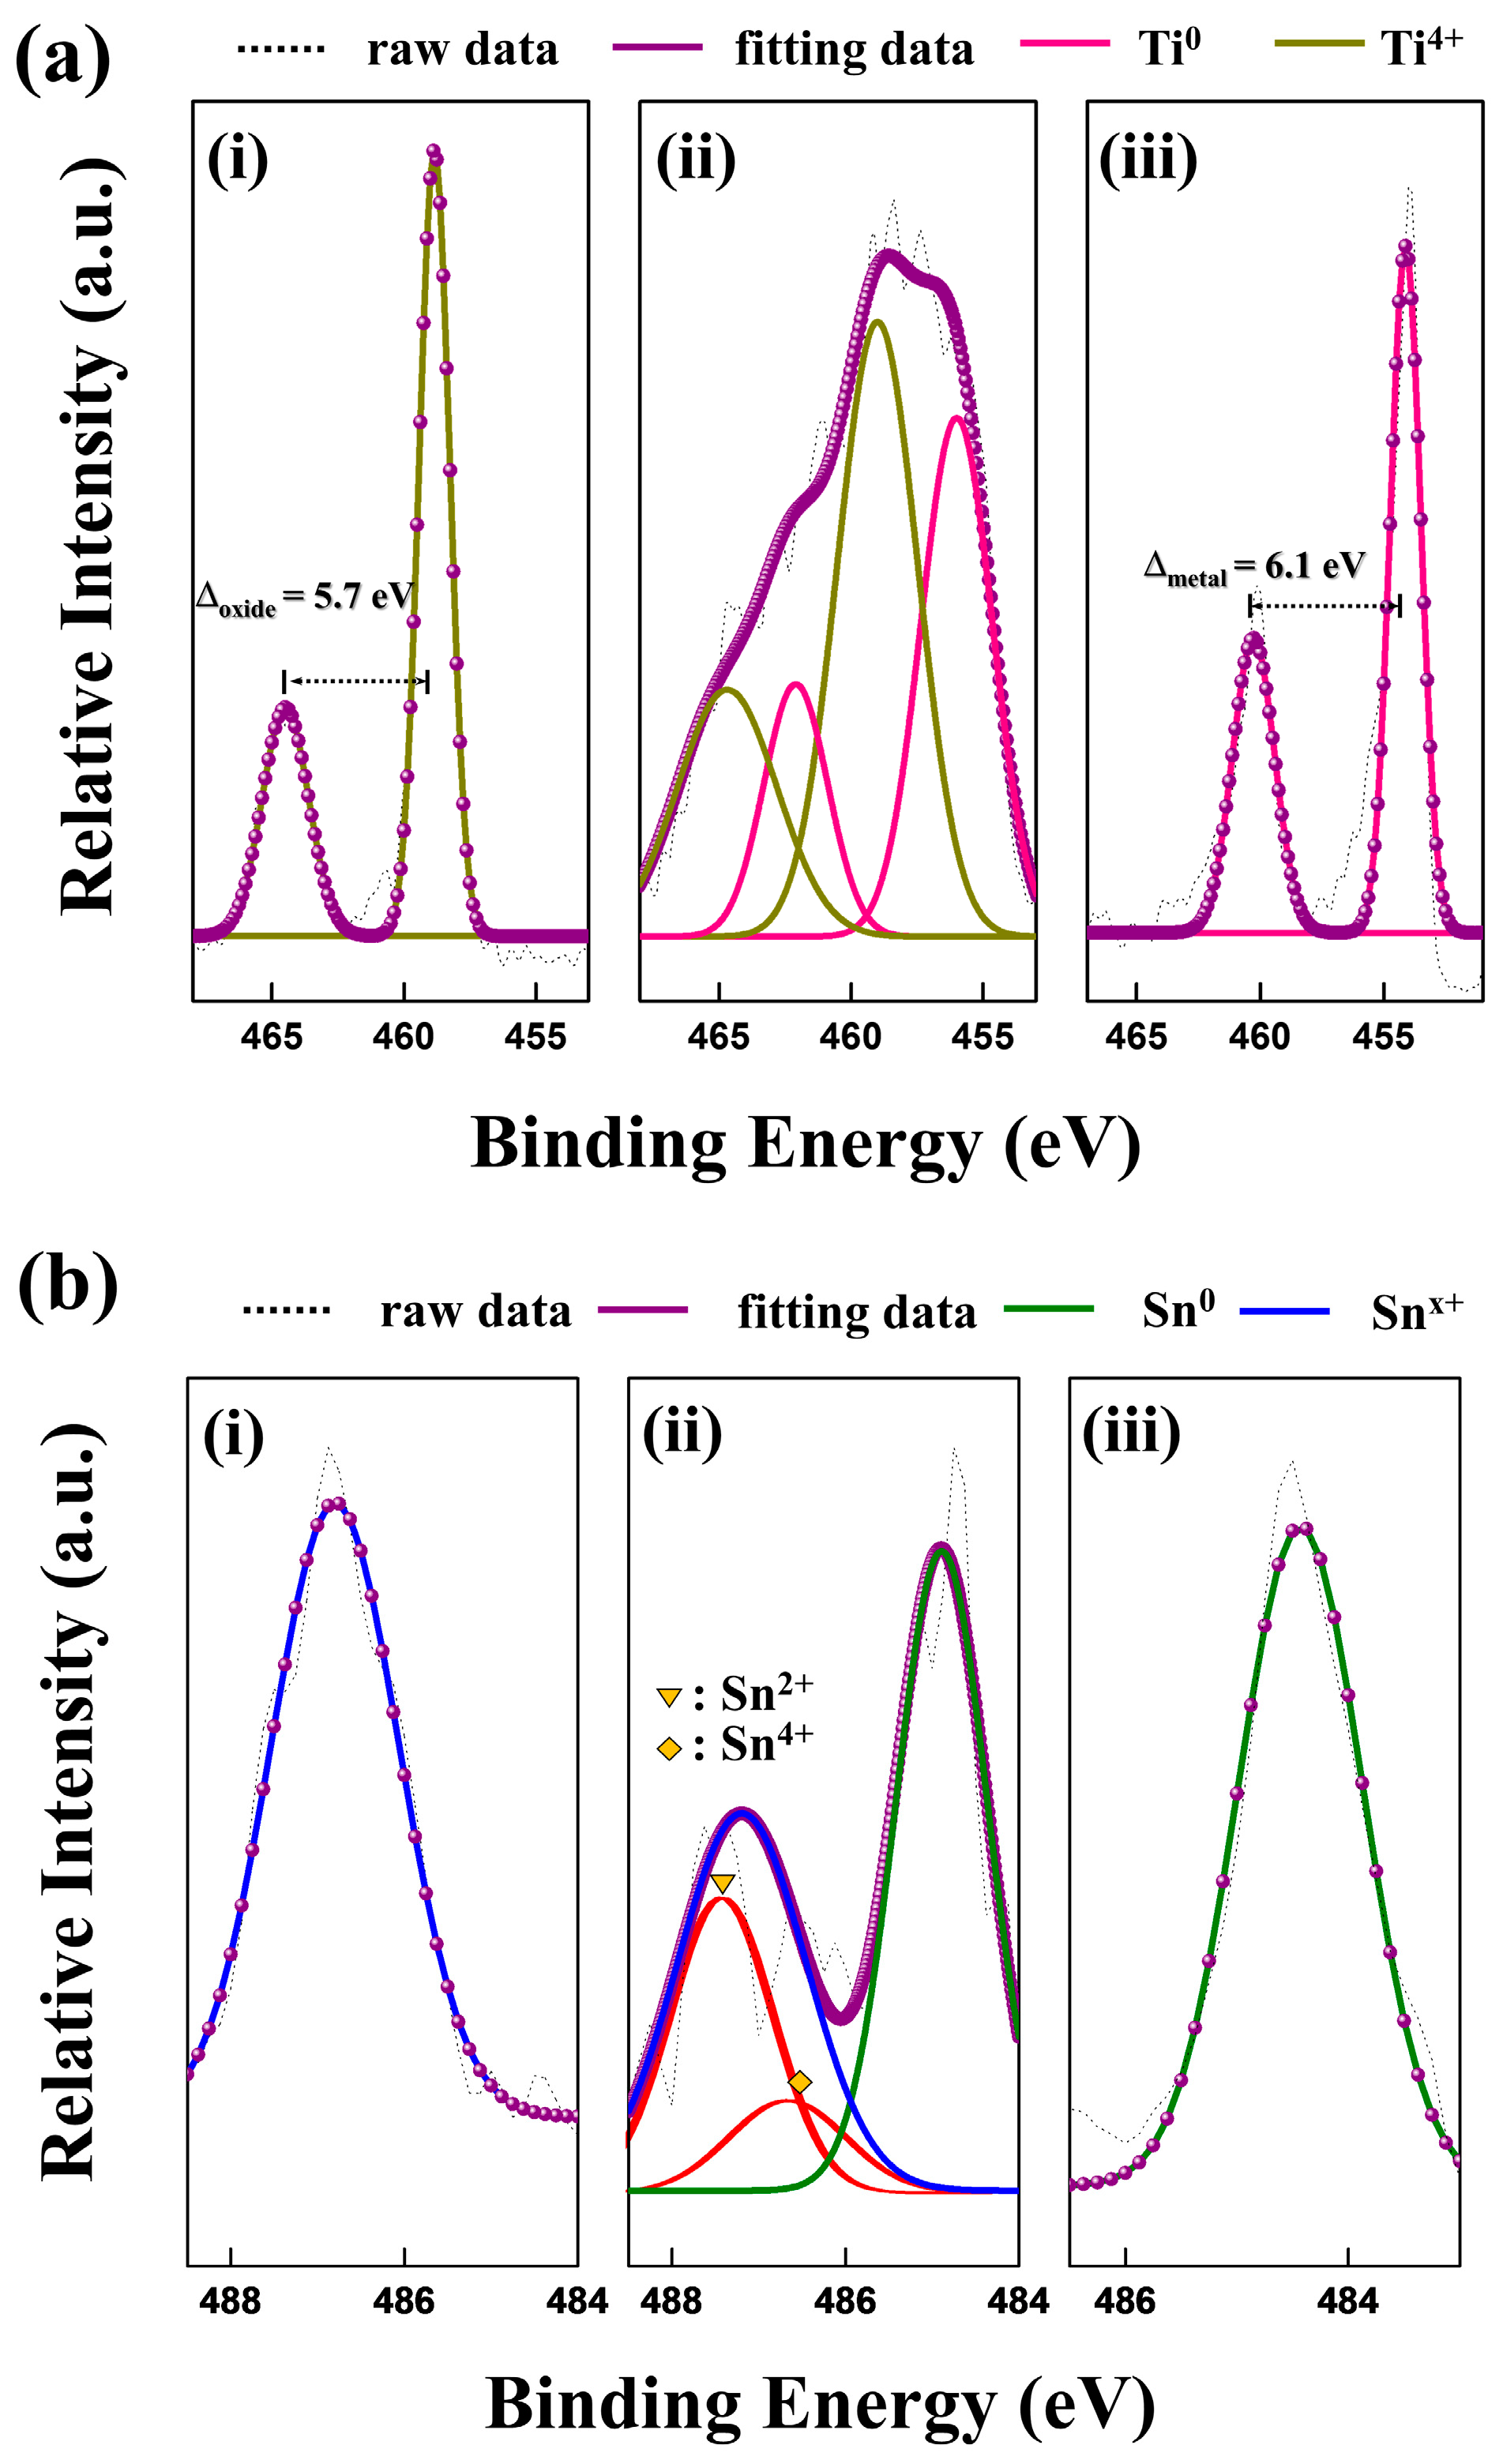
High-resolution XPS spectra for Ti 2p (a) and Sn 3d5/2 (b) are shown in Figure 4, depicting the chemical states within the surface (i), oxide layer (ii), and metal layer (iii) of the sample.
In the Ti 2p spectra (a) of the surface (i), the doublet at 464.5 eV (2p1/2) and 458.8 eV (2p3/2) arises from spin-orbit splitting. These peaks are consistent with the Ti4+ state in the TiO2 lattice [26]. In the oxide layer (ii), the TiO2 peaks were detected simultaneously with a doublet corresponding to metallic Ti (Ti0), with peaks at 464.7 eV (2p1/2) and 459.0 eV (2p3/2). As expected, the metal layer (iii) shows a doublet corresponding exclusively to the Ti0 state. Deconvolution of the Ti 2p binding energy thus indicates that TiO2 exists on the surface, while the oxide layer is a mixture of TiO2 and metallic Ti.
In the Sn 3d5/2 spectra (b) of the surface (i), the peak for Snx+ is located at 486.8 eV. This Snx+ peak represents a mixture of Sn2+ and Sn4+ states. According to the literature, the 3d5/2 peak for Sn2+ is located around 486.7 eV, and that for Sn4+ is around 486.5 eV; their close proximity makes them difficult to distinguish [27]. In Figure 4b(i), since the Sn2+ and Sn4+ peaks cannot be distinguished from each other, they are referred to as Snx+ and indexed with a single peak corresponding to a SnOx structure, a mixture of SnO and SnO2 lattices. Although this distinction is difficult, we can predict the phase transition as the process progresses [28], as the unstable Sn2+ state tends to gradually change to Sn4+ through the following reactions [29]:
4SnO(s) → Sn3O4(s) + Sn,
Sn3O4 → 2SnO2 + Sn,
Sn + O2 → SnO2(s),
In the oxide layer (Figure 4b(ii)), a doublet is seen with peaks representing Snx+ at 487.2 eV and metallic Sn0 at 484.9 eV. This indicates the coexistence of both SnOx and metallic Sn within this layer [30]. The positive shift of the Sn 3d5/2 peak to 487.2 eV arises from the complex chemical environment and lattice effects in this multi-component system, which contains tin oxide, titanium oxide, and metallic species. Incorporation of multiple elements into the lattice induces local distortion, modifying M–O bond lengths and angles, and consequently reducing the electron density around oxygen atoms [31,32,33]. This electron deficiency increases the core-level binding energy of Sn and Ti, as observed in XPS, consistent with widely reported shifts in multi-component oxide systems [34,35].
The Sn 3d5/2 spectrum of the metal layer in Figure 4b(iii) shows a peak that can be assigned to the metallic Sn0 state. The locations of all deconvoluted peaks are listed in Table 2. Through XPS analysis of the 6HRS sample, we were able to confirm the presence of a mixed SnOx–TiO2 layer on the surface. The underlying oxide layer contains a mixture of metallic Ti, metallic Sn, SnOx, and TiO2. The selective oxidation of Ti and Sn, and the non-oxidation of Cu and Ni, can be explained by the standard heat of formation (ΔHf) for their respective oxides. Since the ΔHf values for TiO2 anatase (−938.72 kJ/mol) and SnO2 (−577.6 kJ/mol) are significantly more negative than those for CuO (−314.8 kJ/mol) and NiO (−240.2 kJ/mol) [36,37], Ti and Sn are preferentially oxidized in the hydrothermal environment.
Photoelectrochemical analysis was performed to evaluate the water-splitting characteristics of the oxides formed on the amorphous alloy.
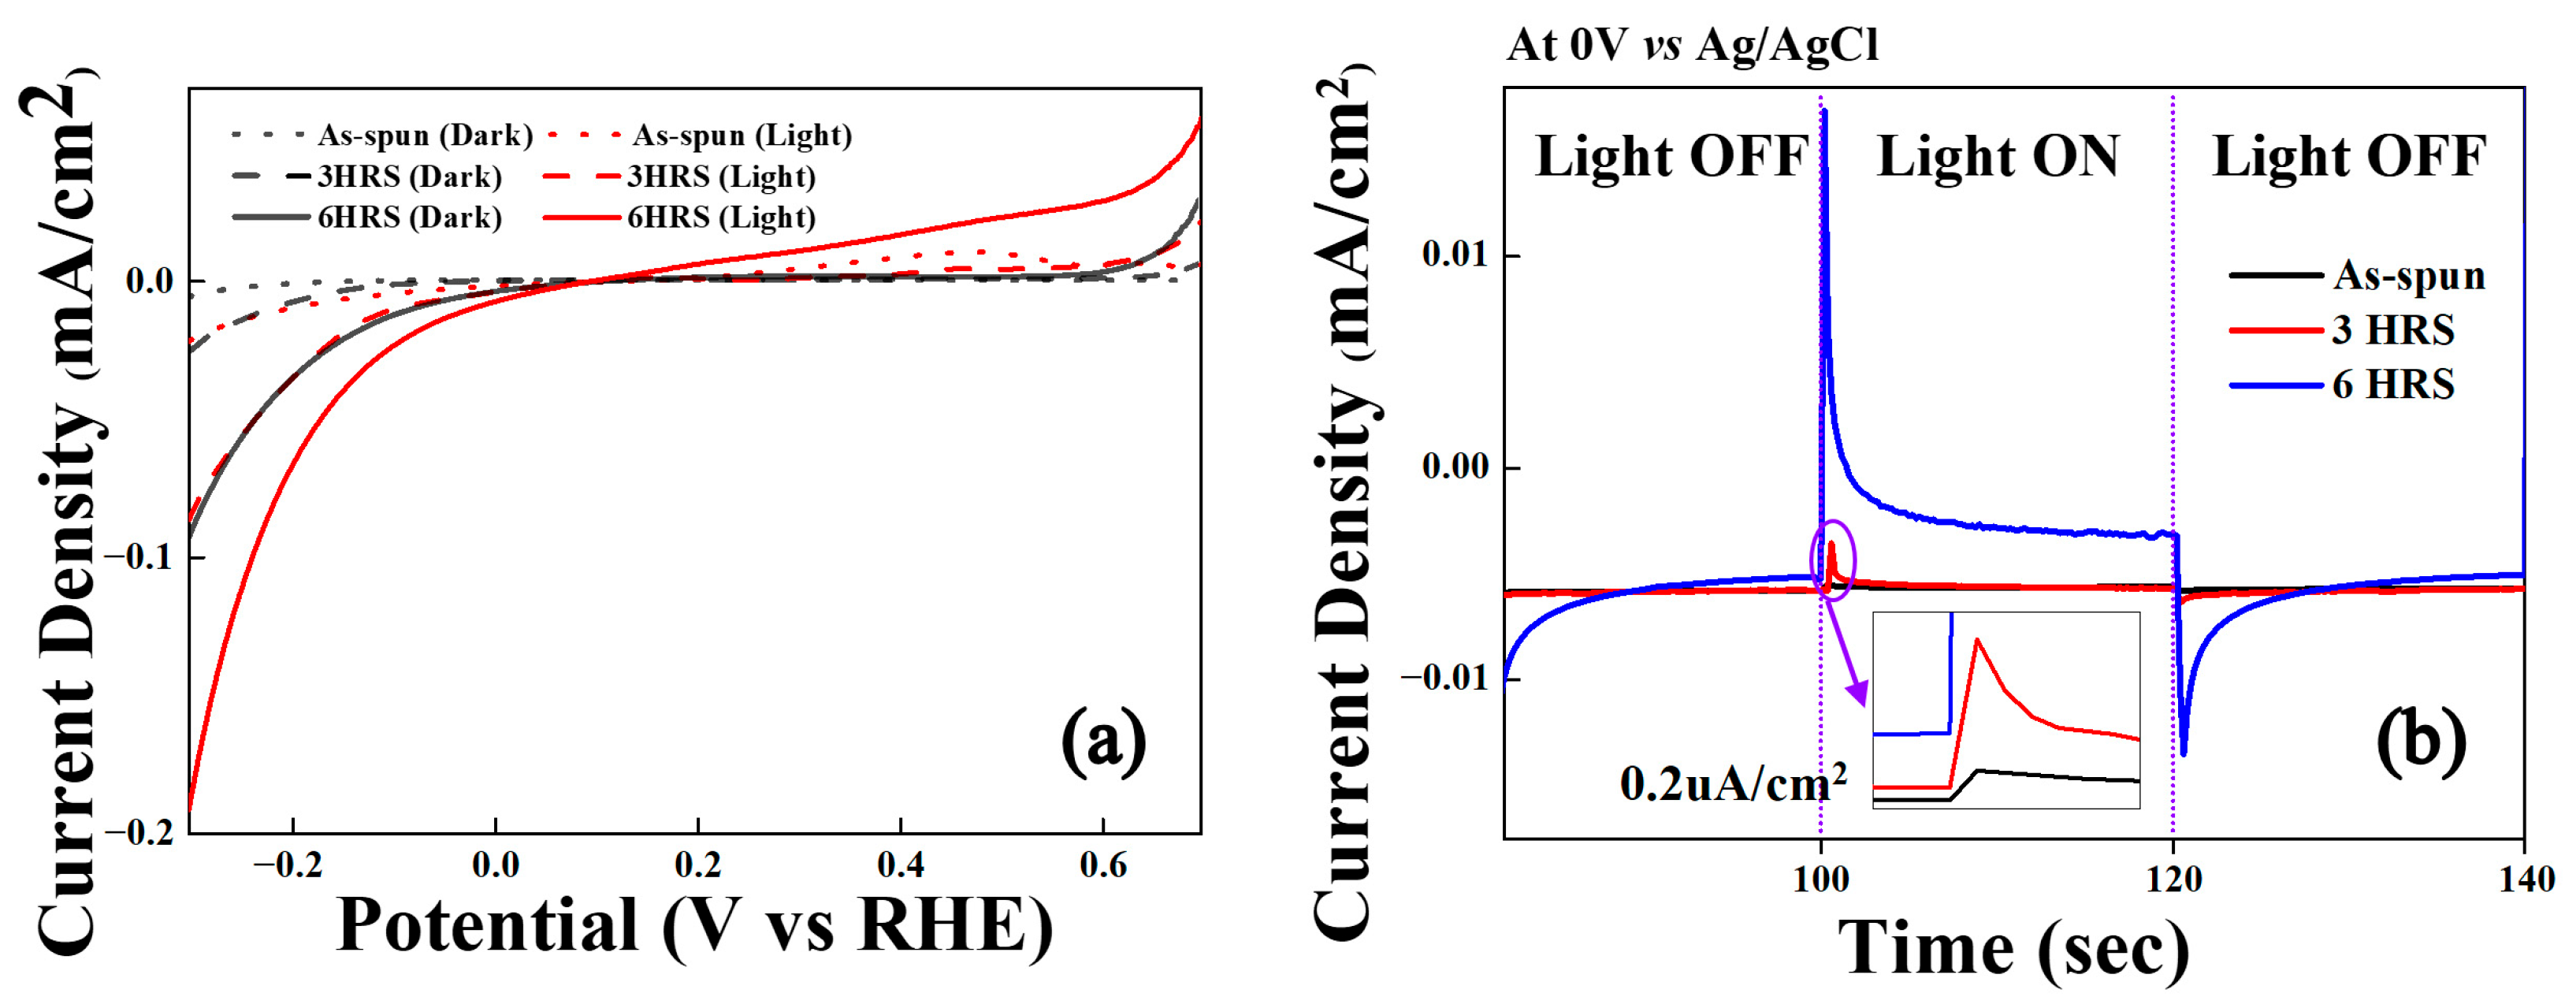
Figure 5a illustrates the linear sweep voltammograms for the as-spun, 3HRS, and 6HRS ribbons. At −0.3 V vs. RHE, the photocurrent densities were −0.021 mA/cm2 for the as-spun ribbon, −0.024 mA/cm2 for the 3HRS sample, and a significantly higher −0.187 mA/cm2 for the 6HRS sample. Similarly, at +0.6 V vs. RHE, the photocurrent densities were 0.005, 0.006, and 0.03 mA/cm2 for the as-spun, 3HRS, and 6HRS samples, respectively. The current density of the alloy was consistently higher under light irradiation than in the dark and increased with longer hydrothermal processing time. For example, at −0.3 V vs. RHE, the 6HRS sample exhibited a current density approximately twice as high under illumination compared to dark conditions and about nine times higher than that of the as-spun ribbon. In addition to photocurrent density, the 6HRS sample also demonstrated the lowest onset potentials for both the Hydrogen Evolution Reaction (HER) and the Oxygen Evolution Reaction (OER).
Figure 5b presents the chronoamperometry curves for the Ti50Cu32Ni15Sn3 alloys, measured at 0.197 V vs. RHE under alternating 20-s light ON/OFF cycles. Overall, the current density increased under light irradiation. However, the enhancement was minor for the as-spun and 3HRS ribbons compared to the 6HRS sample. The increased photocurrent densities were 0.2, 0.35, and 2.8 μA/cm2 for the as-spun, 3HRS, and 6HRS samples, respectively, indicating that the 6HRS sample exhibited a photocurrent response roughly nine times greater than that of the 3HRS sample.
The superior performance of the 6HRS sample can be attributed to a dual-synergy effect. First, the highly uniform and continuous oxide layer, as confirmed by FE-SEM (Figure 2c), significantly increases the active surface area for light absorption, generating more photo-induced charge carriers. Second, the coexistence of TiO2 and SnOx phases creates a heterojunction structure, which facilitates efficient charge separation and transport. This mixed-phase structure effectively suppresses electron-hole recombination, leading to a substantial increase in photocurrent density.
For a more comprehensive understanding of the effect of process duration, these results can be compared with our previous study on the same Ti50Cu32Ni15Sn3 alloy subjected to a much longer 96-h hydrothermal treatment [18]. In that study, the photocurrent density at −0.3 V vs. RHE reached approximately −11.1 mA/cm2, highlighting a significant difference in absolute performance between the two processes. The 96HRS sample also exhibited a substantially higher photocurrent and a sharper on/off response, indicating more efficient charge separation and faster carrier transfer. This superior response, along with its stable current under prolonged illumination, is attributed to a more mature and well-developed oxide layer resulting from the extended hydrothermal treatment. Importantly, the 6HRS sample was still able to show a clear and stable photoresponse, demonstrating that the underlying mechanisms for charge generation and transfer are successfully established even in the early stages of oxide growth. This highlights the importance of systematically optimizing hydrothermal duration to control the maturity of the oxide layer and its resulting PEC performance.

4. Conclusions

This study identified an optimal hydrothermal process time for the uniform formation of metal oxides on the surface of a Ti50Cu32Ni15Sn3 alloy. Hydrothermal treatments were conducted at 220 °C for 3 and 6 h using 150 mL of distilled water, with an as-spun ribbon serving as a control for comparison. The as-spun ribbon was confirmed to be in an amorphous phase, which was successfully retained even after both hydrothermal treatments. FE-SEM images of the oxide morphology showed that the as-spun ribbon had a smooth, oxide-free surface. The 3-h (3HRS) sample exhibited localized oxide formation with a regular shape, while the 6-h (6HRS) sample displayed a relatively uniform and continuous layer of randomly grown, overlapping oxides. XPS depth profiling analysis of the 6HRS sample revealed selective oxidation, where only Ti and Sn were oxidized, while Cu and Ni remained in their metallic state [22,23,24,25]. The analysis further confirmed that the surface layer consists of a mixed SnOx–TiO2 phase, and the underlying oxide layer is a mixture of metallic Ti and Sn, along with their respective oxides.
Furthermore, photoelectrochemical analysis showed that the 6HRS sample exhibited superior water-splitting properties compared to the other samples. This enhanced performance is attributed to the uniformly spread oxide layer, which is a mixed phase of TiO2 and SnOx. The coexistence of these oxides can be engineered to tune the band structure, thereby improving light absorption and carrier separation [18]. This study demonstrates that hydrothermal duration is a critical parameter for controlling the morphology and composition of the oxide layer, which directly impacts photoelectrochemical performance. While a previous study showed that a much longer 96-h treatment could achieve even higher photocatalytic activity, our results confirm that time control is the key to optimizing the oxide layer for superior photoresponse. Our time-controlled hydrothermal process using only water provides a viable and efficient strategy to simplify the manufacturing of high-efficiency photoelectrodes, with the potential to contribute to a wider range of electronic and photoelectrochemical applications of MGs. This work highlights the fundamental role of process control in tailoring functional surfaces on metallic glasses.

Author Contributions

Writing—original draft, T.K.K. and H.J.P.; Writing—review and editing, H.J.P.; Methodology, T.K.K. and H.J.P.; Investigation, T.K.K.; Data curation, T.K.K. and S.H.H.; Formal analysis, S.H.H. and H.J.P.; Visualization, J.E. and H.J.P.; Conceptualization, K.B.K. and J.E.; Supervision, K.B.K.; Project administration, K.B.K. and H.J.P. All authors have read and agreed to the published version of the manuscript.

Funding

This research was supported by the National Research Foundation of Korea grant funded by the Korean Government (RS-2024-00409939) and the Basic Science Research Program through the National Research Foundation of Korea (NRF) funded by the Ministry of Education (RS-2023-00250752).

Institutional Review Board Statement

Not applicable.

Informed Consent Statement

Not applicable.

Data Availability Statement

The original contributions presented in this study are included in the article. Further inquiries can be directed to the corresponding author.

Conflicts of Interest

The authors declare that they have no known competing financial interests or personal relationships that could have appeared to influence the work reported in this paper.

References

  1. Telford, M. The case for bulk metallic glass. Mater. Today 2004, 7, 36–43. [Google Scholar] [CrossRef]
  2. Inoue, A.; Shen, B.; Koshiba, H.; Kato, H.; Yavari, A.R. Cobalt-based bulk glassy alloy with ultrahigh strength and soft magnetic properties. Nat. Mater. 2003, 2, 661–663. [Google Scholar] [CrossRef]
  3. Tian, L.; Cheng, Y.-Q.; Shan, Z.-W.; Li, J.; Wang, C.-C.; Han, X.-D.; Sun, J.; Ma, E. Approaching the ideal elastic limit of metallic glasses. Nat. Commun. 2012, 3, 609. [Google Scholar] [CrossRef] [PubMed]
  4. Inoue, A.; Takeuchi, A. Recent development and application products of bulk glassy alloys. Acta Mater. 2011, 59, 2243–2267. [Google Scholar] [CrossRef]
  5. Park, E.S.; Chang, H.J.; Kim, D.H. Mg-rich Mg–Ni–Gd ternary bulk metallic glasses with high compressive specific strength and ductility. J. Mater. Res. 2007, 22, 334–338. [Google Scholar] [CrossRef]
  6. Schroers, J.; Johnson, W.L. Ductile bulk metallic glass. Phys. Rev. Lett. 2004, 93, 255506. [Google Scholar] [CrossRef]
  7. Chen, M. Mechanical behavior of metallic glasses: Microscopic understanding of strength and ductility. Annu. Rev. Mater. Res. 2008, 38, 445–469. [Google Scholar] [CrossRef]
  8. Hao, G.J.; Zhang, Y.; Lin, J.P.; Wang, Y.L.; Lin, Z.; Chen, G.L. Bulk metallic glass formation of Ti-based alloys from low purity elements. Mater. Lett. 2006, 60, 1256–1260. [Google Scholar] [CrossRef]
  9. Inoue, A. Stabilization of metallic supercooled liquid and bulk amorphous alloys. Acta Mater. 2000, 48, 279–306. [Google Scholar] [CrossRef]
  10. Wang, W.; Zhou, B. The correlation of damping capacity with grain-boundary precipitates in Fe–Cr-based damping alloys annealed at high temperature. Mater. Sci. Eng. A 2004, 366, 45–49. [Google Scholar] [CrossRef]
  11. Carmo, M.; Sekol, R.C.; Ding, S.; Kumar, G.; Schroers, J.; Taylor, A.D. Bulk metallic glass nanowire architecture for electrochemical applications. ACS Nano 2011, 5, 2979–2983. [Google Scholar] [CrossRef] [PubMed]
  12. An, B.W.; Gwak, E.J.; Kim, K.; Kim, Y.C.; Jang, J.; Kim, J.Y.; Park, J.U. Stretchable, Transparent Electrodes as Wearable Heaters Using Nanotrough Networks of Metallic Glasses with Superior Mechanical Properties and Thermal Stability. Nano Lett. 2016, 16, 471–478. [Google Scholar] [CrossRef]
  13. Doubek, G.; Sekol, R.C.; Li, J.; Ryu, W.; Gittleson, F.S.; Nejati, S.; Moy, E.; Reid, C.; Carmo, M.; Linardi, M. Guided evolution of bulk metallic glass nanostructures: A platform for designing 3D electrocatalytic surfaces. Adv. Mater. 2016, 28, 1940–1949. [Google Scholar] [CrossRef]
  14. Tiwari, K.; Douest, Y.; Giraldo-Osorno, P.M.; Galipaud, J.; Douillard, T.; Blanchard, N.; Palmquist, A.; Courtois, N.; Fabrègue, D.; Chevalier, J. Nanotopographical design and corrosion resistance improvement of Ti40Zr10Cu36Pd14 glassy alloy using alkaline chemical treatment. J. Alloys Compd. 2025, 1024, 180150. [Google Scholar] [CrossRef]
  15. Moghbeli, B.; Khanouki, M.T.A.; Ehteshamzadeh, M. Corrosion assessment of ZrCuAgAl bulk metallic glass in NaCl solutions with different pH values. J. Alloys Compd. 2025, 1036, 181793. [Google Scholar] [CrossRef]
  16. Guo, C.; Liu, G.; Zhang, S.; Wang, T. Controlling the static quenching temperature to improve the corrosion resistance performance of Zr-based bulk metallic glass. J. Non-Cryst. Solids 2025, 660, 123540. [Google Scholar] [CrossRef]
  17. Yang, Y.; Zhuang, C.; Liu, X.; Chen, L.; Zhu, Y.; Zhang, X.; Gao, M.; Li, H.; Shi, Z.; Liang, S. Study on the corrosion properties of Ti41.4Zr28.52Cu6.44Nb8.0Be15.64 metallic glass-based composites in binary acid-salt solutions. J. Alloys Compd. 2025, 1017, 179133. [Google Scholar] [CrossRef]
  18. Park, H.J.; Lee, H.J.; Kim, T.K.; Hong, S.H.; Wang, W.M.; Choi, T.J.; Kim, K.B. Formation of photo-reactive heterostructure from a multicomponent amorphous alloy with atomically random distribution. J. Mater. Sci. Technol. 2022, 109, 245–253. [Google Scholar] [CrossRef]
  19. Bates, S.; Zografi, G.; Engers, D.; Morris, K.; Crowley, K.; Newman, A. Analysis of amorphous and nanocrystalline solids from their X-ray diffraction patterns. Pharm. Res. 2006, 23, 2333–2349. [Google Scholar] [CrossRef]
  20. Inoue, A.; Nishiyama, N.; Amiya, K.; Zhang, T.; Masumoto, T. Ti-based amorphous alloys with a wide supercooled liquid region. Mater. Lett. 1994, 19, 131–135. [Google Scholar] [CrossRef]
  21. Kim, Y.-C.; Kim, W.T.; Kim, D.-H. Glass Forming Ability and Crystallization Behavior in Amorphous Ti50Cu32−xNi15Sn3Bex (x = 0, 1, 3, 7) Alloys. Mater. Trans. 2002, 43, 1243–1247. [Google Scholar] [CrossRef]
  22. Dhawan, A.; Raetzke, K.; Faupel, F.; Sharma, S.K. Air oxidation of Zr65Cu17.5Ni10Al7.5 in its amorphous and supercooled liquid states, studied by thermogravimetric analysis. Phys. Status Solidi 2003, 199, 431–438. [Google Scholar] [CrossRef]
  23. Sharma, S.K.; Strunskus, T.; Ladebusch, H.; Faupel, F. Surface oxidation of amorphous Zr65Cu17.5Ni10Al7.5 and Zr46.75Ti8.25Cu7.5Ni10Be27.5. Mater. Sci. Eng. A 2001, 304, 747–752. [Google Scholar] [CrossRef]
  24. Premkumar, H.; Vadivel, S.; Al-Lohedan, H.; Syed, S.R.M. Synthesis and Characterization of Ternary ZnO/CuO/NiO Nanocomposite for Pseudocapacitive Energy Storage application. Vacuum 2025, 241, 114650. [Google Scholar] [CrossRef]
  25. Oleksak, R.P.; Hostetler, E.B.; Flynn, B.T.; McGlone, J.M.; Landau, N.P.; Wager, J.F.; Stickle, W.F.; Herman, G.S. Thermal oxidation of Zr–Cu–Al–Ni amorphous metal thin films. Thin Solid. Films 2015, 595, 209–213. [Google Scholar] [CrossRef]
  26. Bharti, B.; Kumar, S.; Lee, H.-N.; Kumar, R. Formation of oxygen vacancies and Ti3+ state in TiO2 thin film and enhanced optical properties by air plasma treatment. Sci. Rep. 2016, 6, 32355. [Google Scholar] [CrossRef]
  27. Kobayashi, Y.; Salgueiriño-Maceira, V.; Liz-Marzán, L.M. Deposition of silver nanoparticles on silica spheres by pretreatment steps in electroless plating. Chem. Mater. 2001, 13, 1630–1633. [Google Scholar] [CrossRef]
  28. González-Angeles, A.; Mendoza-Suárez, G.; Grusková, A.; Dosoudil, R.; Ortega-Zempoalteca, R. Magnetic studies of Sn2+–Sn4+-substituted barium hexaferrites synthesized by mechanical alloying. Mater. Lett. 2004, 58, 2906–2910. [Google Scholar] [CrossRef]
  29. Li, K.; Li, Y.; Lu, M.; Kuo, C.; Chen, L. Direct Conversion of Single-Layer SnO Nanoplates to Multi-Layer SnO2 Nanoplates with Enhanced Ethanol Sensing Properties. Adv. Funct. Mater. 2009, 19, 2453–2456. [Google Scholar] [CrossRef]
  30. Biesinger, M.C.; Lau, L.W.M.; Gerson, A.R.; Smart, R.S.C. Resolving surface chemical states in XPS analysis of first row transition metals, oxides and hydroxides: Sc, Ti, V, Cu and Zn. Appl. Surf. Sci. 2010, 257, 887–898. [Google Scholar] [CrossRef]
  31. Tu, Y.; Chen, S.; Li, X.; Gorbaciova, J.; Gillin, W.P.; Krause, S.; Briscoe, J. Control of oxygen vacancies in ZnO nanorods by annealing and their influence on ZnO/PEDOT: PSS diode behaviour. J. Mater. Chem. C 2018, 6, 1815–1821. [Google Scholar] [CrossRef]
  32. Lackner, P.; Zou, Z.; Mayr, S.; Diebold, U.; Schmid, M. Using photoelectron spectroscopy to observe oxygen spillover to zirconia. Phys. Chem. Chem. Phys. 2019, 21, 17613–17620. [Google Scholar] [CrossRef]
  33. Rosendal, V.; Pryds, N.; Petersen, D.H.; Brandbyge, M. Electron-vacancy scattering in SrNbO3 and SrTiO3: A density functional theory study with nonequilibrium Green’s functions. Phys. Rev. B 2024, 109, 205129. [Google Scholar] [CrossRef]
  34. Md Saad, S.K.; Ali Umar, A.; Ali Umar, M.I.; Tomitori, M.; Rahman, M.Y.A.; Mat Salleh, M.; Oyama, M. Two-Dimensional, Hierarchical Ag-Doped TiO2 Nanocatalysts: Effect of the Metal Oxidation State on the Photocatalytic Properties. ACS Omega 2018, 3, 2579–2587. [Google Scholar] [CrossRef] [PubMed]
  35. Natarajan, T.S.; Mozhiarasi, V.; Tayade, R.J. Nitrogen Doped Titanium Dioxide (N-TiO2): Synopsis of Synthesis Methodologies, Doping Mechanisms, Property Evaluation and Visible Light Photocatalytic Applications. Photochem 2021, 1, 371–410. [Google Scholar] [CrossRef]
  36. Sharma, S.K.; Strunskus, T.; Ladebusch, H.; Zaporojtchenko, V.; Faupel, F. XPS study of the initial oxidation of the bulk metallic glass Zr46.75Ti8.25Cu7.5Ni10Be27.5. J. Mater. Sci. 2008, 43, 5495–5503. [Google Scholar] [CrossRef]
  37. Haynes, W.M. CRC Handbook of Chemistry and Physics; CRC Press: Boca Raton, FL, USA, 2014; ISBN 1482208687. [Google Scholar]
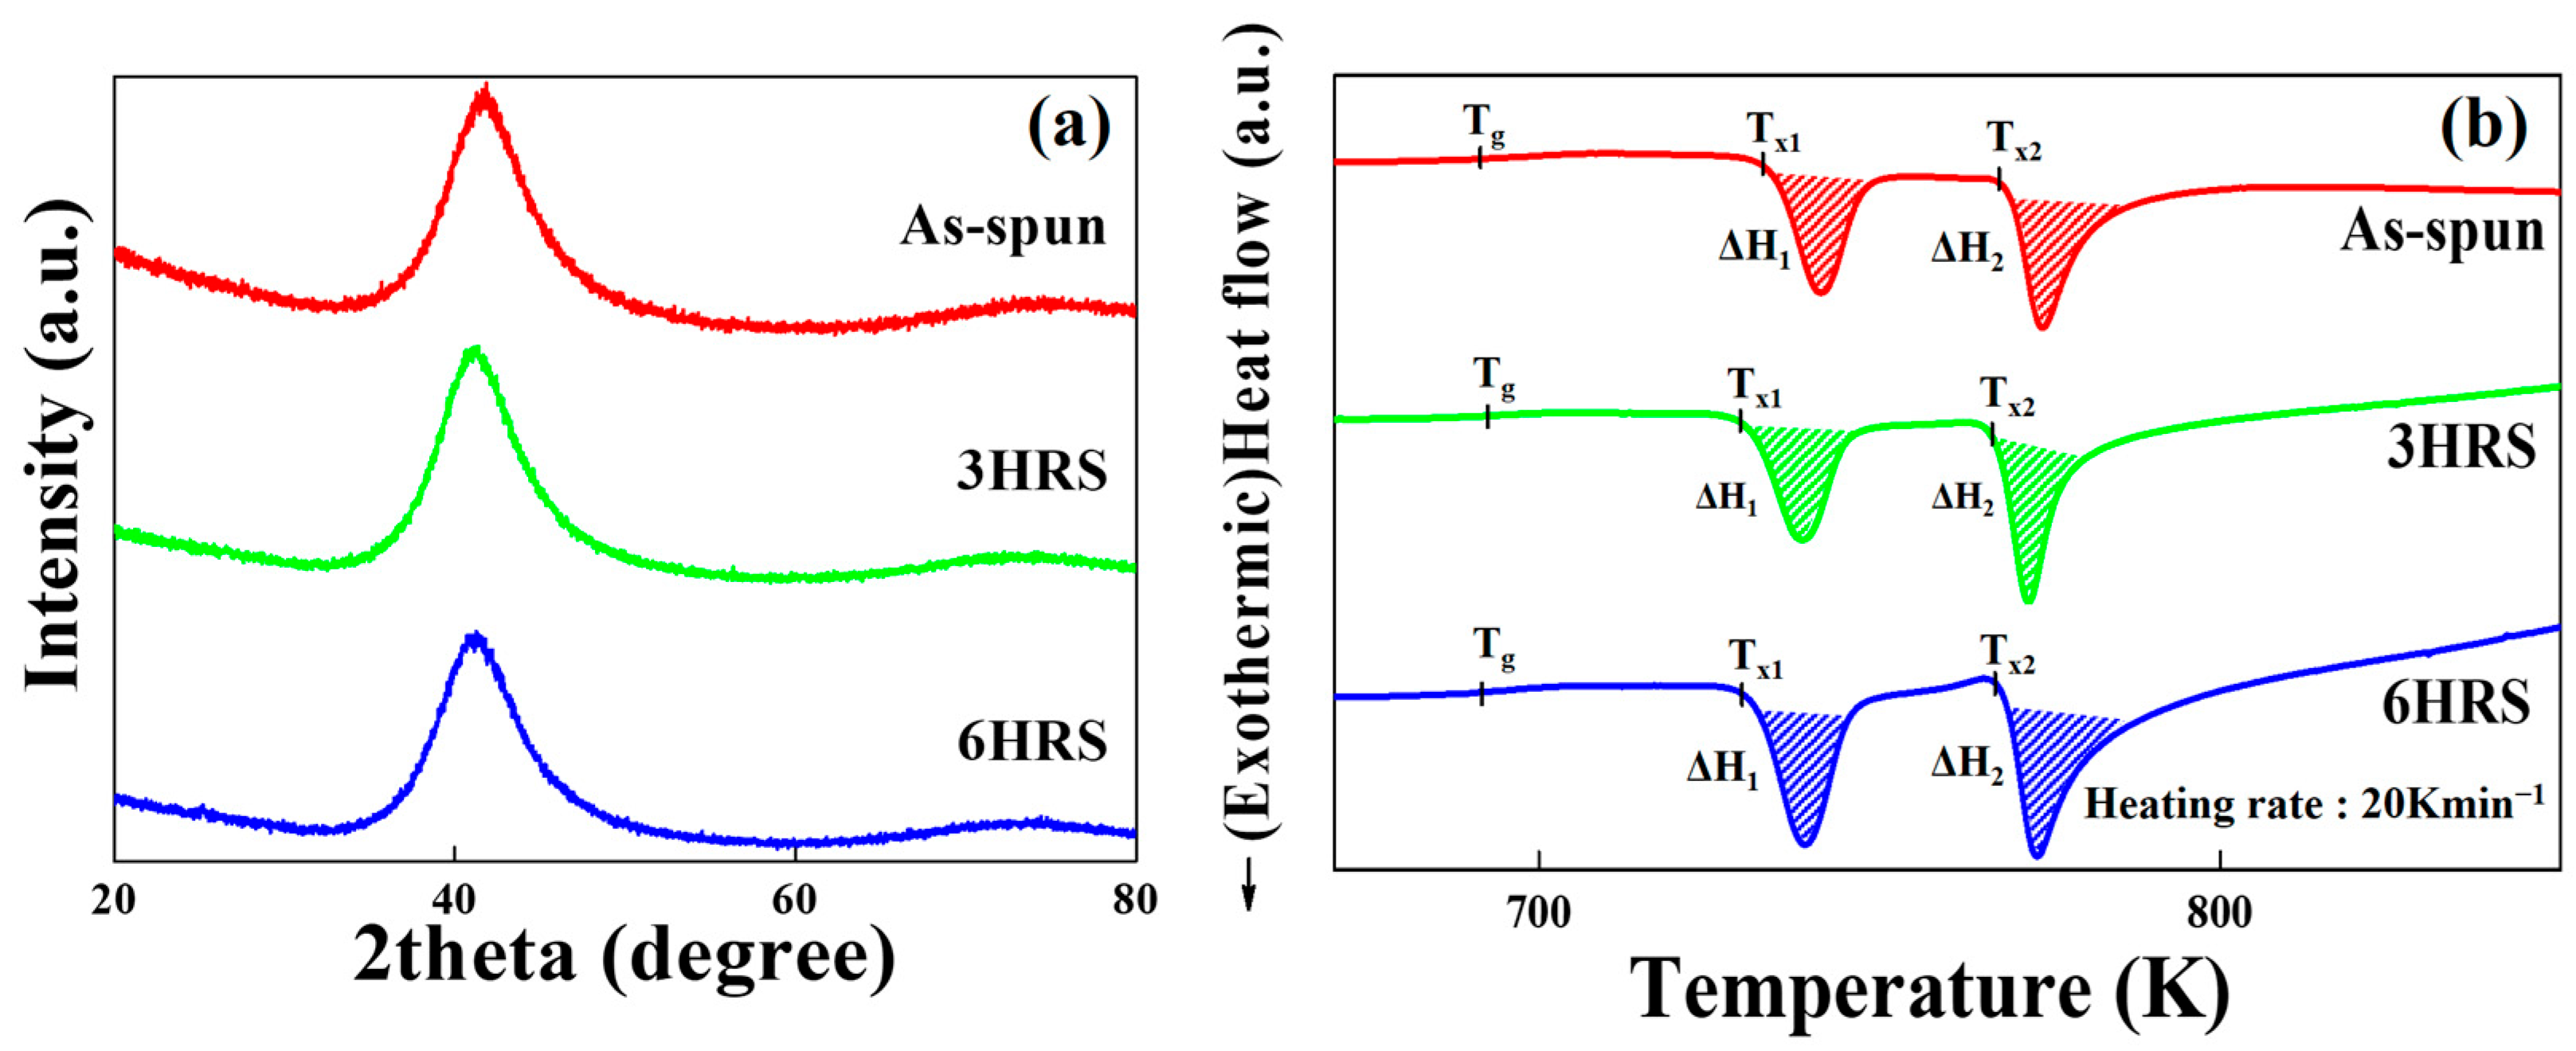
Figure 1. Structural analysis of the Ti50Cu32Ni15Sn3 alloy. (a) X-ray diffraction patterns. (b) Differential scanning calorimetry curves of as-spun, 3-h, and 6-h hydrothermally treated Ti50Cu32Ni15Sn3 metallic glass, respectively.
Materials 18 04082 g001
Figure 2. Surface morphology of the Ti50Cu32Ni15Sn3 alloy. Secondary electron micrographs of the (a) as-spun, (b) 3-h, and (c) 6-h hydrothermally treated Ti50Cu32Ni15Sn3 metallic glass.
Materials 18 04082 g002
Figure 3. XPS depth profile analysis of the 6-h hydrothermally treated Ti50Cu32Ni15Sn3 alloy. (a) Atomic concentration depth profiles of Ti, Cu, Ni, Sn, and O within oxygen-rich surface layer (i), a gradual transition layer (ii), and a metallic substrate (iii). (b) Profile montage plots of each element.
Materials 18 04082 g003
Figure 4. High-resolution XPS spectra of the 6-h hydrothermally treated Ti50Cu32Ni15Sn3 alloy. (a) The Ti 2p and (b) Sn 3d5/2 core-level spectra for distinct chemical states within the (i) surface layer, (ii) intermediate oxide layer, and (iii) metallic substrate. In ((b)-ii), the Sn 3d5/2 spectrum clearly resolves the contributions from Sn2+ and Sn4+ states, highlighted by the red lines, revealing the coexistence of mixed valence states in the intermediate oxide layer.
Materials 18 04082 g004
Figure 5. Photoelectrochemical (PEC) performance of the Ti50Cu32Ni15Sn3 alloys. (a) Linear sweep voltammetry (LSV) curves measured under dark and light illumination. (b) Chronoamperometry (CA) measurements conducted at 0 V versus Ag/AgCl with alternating illumination and dark periods.
Materials 18 04082 g005
Table 1. Thermal stability of the Ti50Cu32Ni15Sn3 alloys. The glass transition (Tg) and crystallization onset (Tx) temperatures, and the heat of crystallization (ΔH) for the as-spun, 3-h, and 6-h hydrothermally treated Ti50Cu32Ni15Sn3 metallic glass.
SampleTg (K)Tx1 (K)ΔH1 (J/g)Tx2 (K)ΔH2 (J/g)
As-spun691.4732.8–36.7767.7–49.5
3HRS692.5729.5–39.4766.5–53.6
6HRS691.6729.8–37.5766.9–53.5
Table 2. Chemical states and binding energy values of 6-h hydrothermally treated Ti50Cu32Ni15Sn3 alloy. The deconvoluted binding energies and corresponding chemical states for the Ti 2p and Sn 3d5/2 core-level peaks, as analyzed by X-ray photoelectron spectroscopy on the 6-h hydrothermally treated Ti50Cu32Ni15Sn3 metallic glass.
6HRSBinding Energy (eV)
Ti 2pSn 3d5/2
LayerSurfaceOxideMetalSurfaceOxideMetal
Ti4+Ti4+ Snx+Snx+
464.5464.7 486.8487.2
458.8459.0
Ti0Ti0 Sn0Sn0
462.1461.4 484.9484.4
456.0455.3
Disclaimer/Publisher’s Note: The statements, opinions and data contained in all publications are solely those of the individual author(s) and contributor(s) and not of MDPI and/or the editor(s). MDPI and/or the editor(s) disclaim responsibility for any injury to people or property resulting from any ideas, methods, instructions or products referred to in the content.