4. Discussion
A comparative analysis of the oxidised PEO layers in cross-section (see
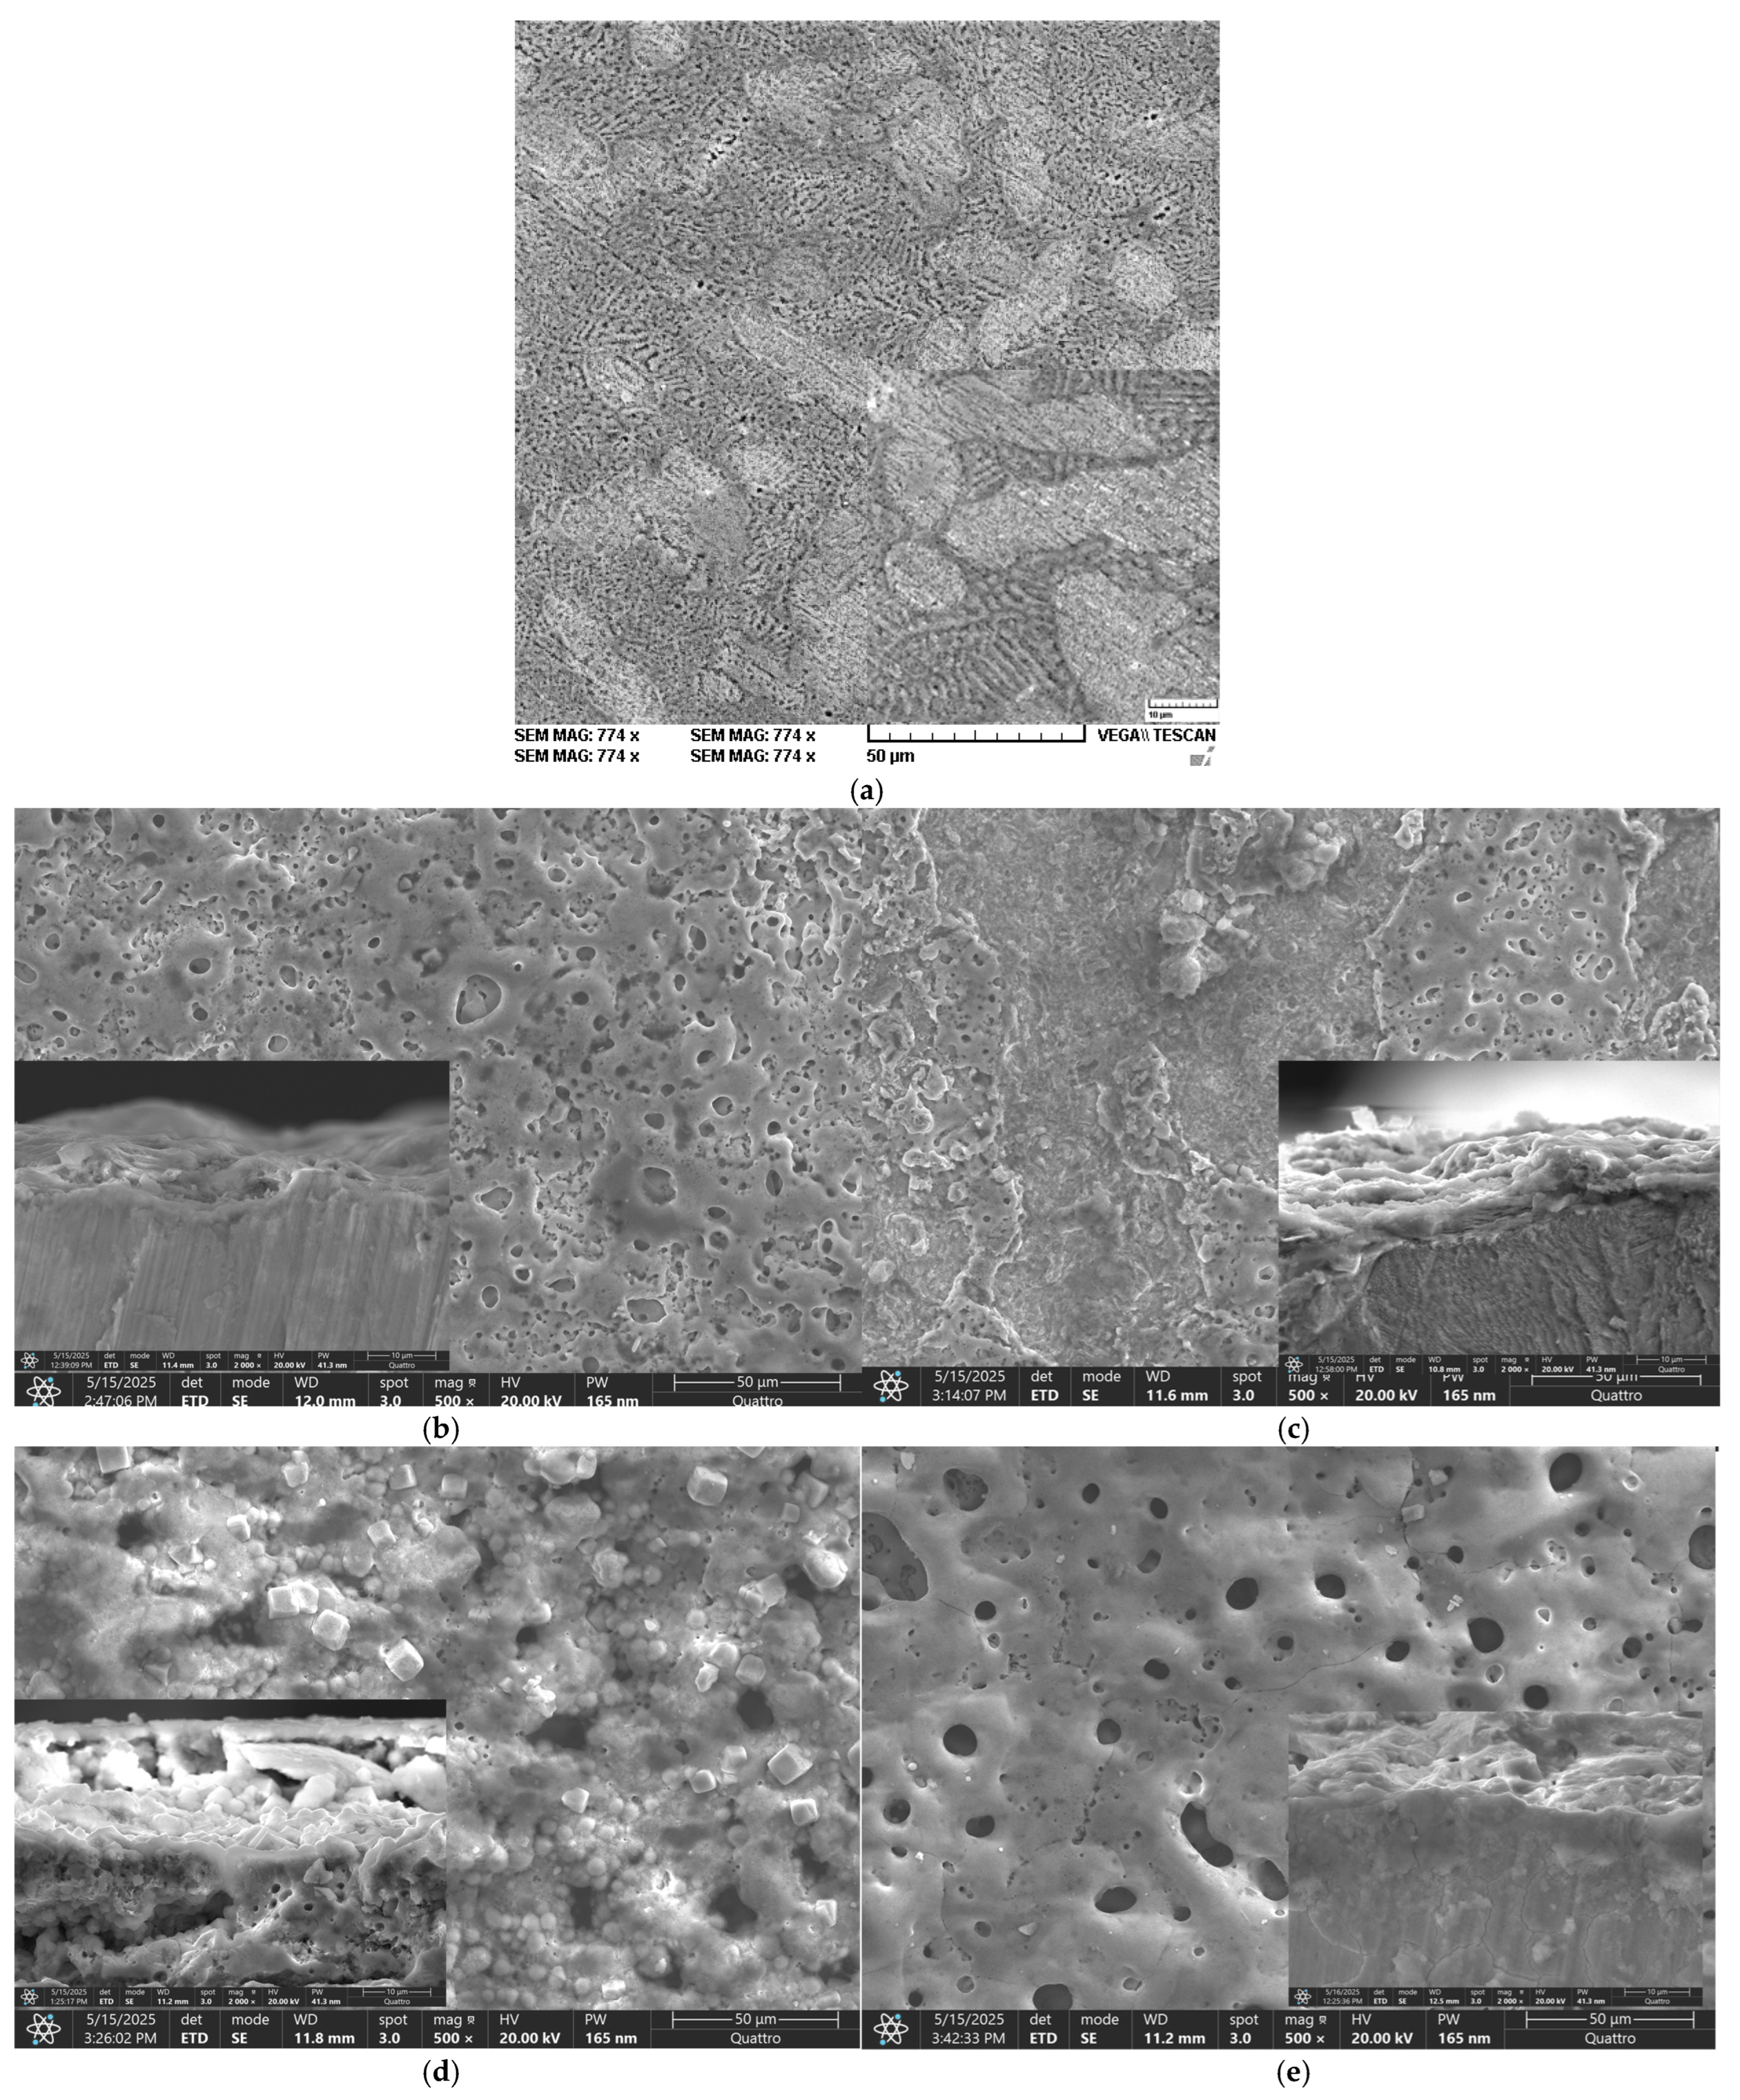
Figure S2 in the Supplementary File) revealed that for ZnMg-PEO250, a relatively thin yet compact, uniform and largely free of major visible discontinuities layer was obtained, with an estimated thickness of 2.5–4.0 μm (mean ≈ 3.2 μm). This outcome can be attributed to a low-intensity oxidation process, resulting in a uniform but limited-in-thickness layer. The ZnMg-PEO300 sample, which exhibited a thickness greater than that of the ZnMg-PEO250 sample, yet possessed a slight degree of porosity, was observed to contain micro-discontinuities and areas of uneven density. The estimated thickness of the ZnMg-PEO300 sample ranged from 5.0 to 7.0 μm, with a mean value of approximately 6.0 μm, as a result of an accelerated yet non-uniform oxidation process. In the case of the ZnMg-PEO350 sample, a dense, compact, continuous-textured layer with very good continuity was observed. No visible cracks or separations were identified, and the estimated average thickness was approximately 23.5 μm. This was attributed to an optimal oxidation process that formed a consistent, protective layer without any obvious exfoliation zones. The sample designated ZnMg-PEO400 exhibited a substantial layer characterised by microcracks and elevated porosity. The layer exhibited localised disruption, manifesting as vertical cracks, presumably resulting from the cutting process. The estimated thickness of the layer was found to be between 10 and 13 μm (with a mean of approximately 11.5 μm), a result of an intense oxidation process. However, this process also presented a risk of mechanical instability, as evidenced by the occurrence of cracks due to internal stresses.
It can be stated that, in the case of the ZnMg-PEO350 sample, the formed oxidised layer demonstrates a typical structure for successful PEO treatments, exhibiting a porous outer zone and a dense inner zone with good continuity and functional thickness [
23,
24]. The morphology of the material suggests that it is formed under controlled conditions, which would indicate that it has effective corrosion and wear protection properties.
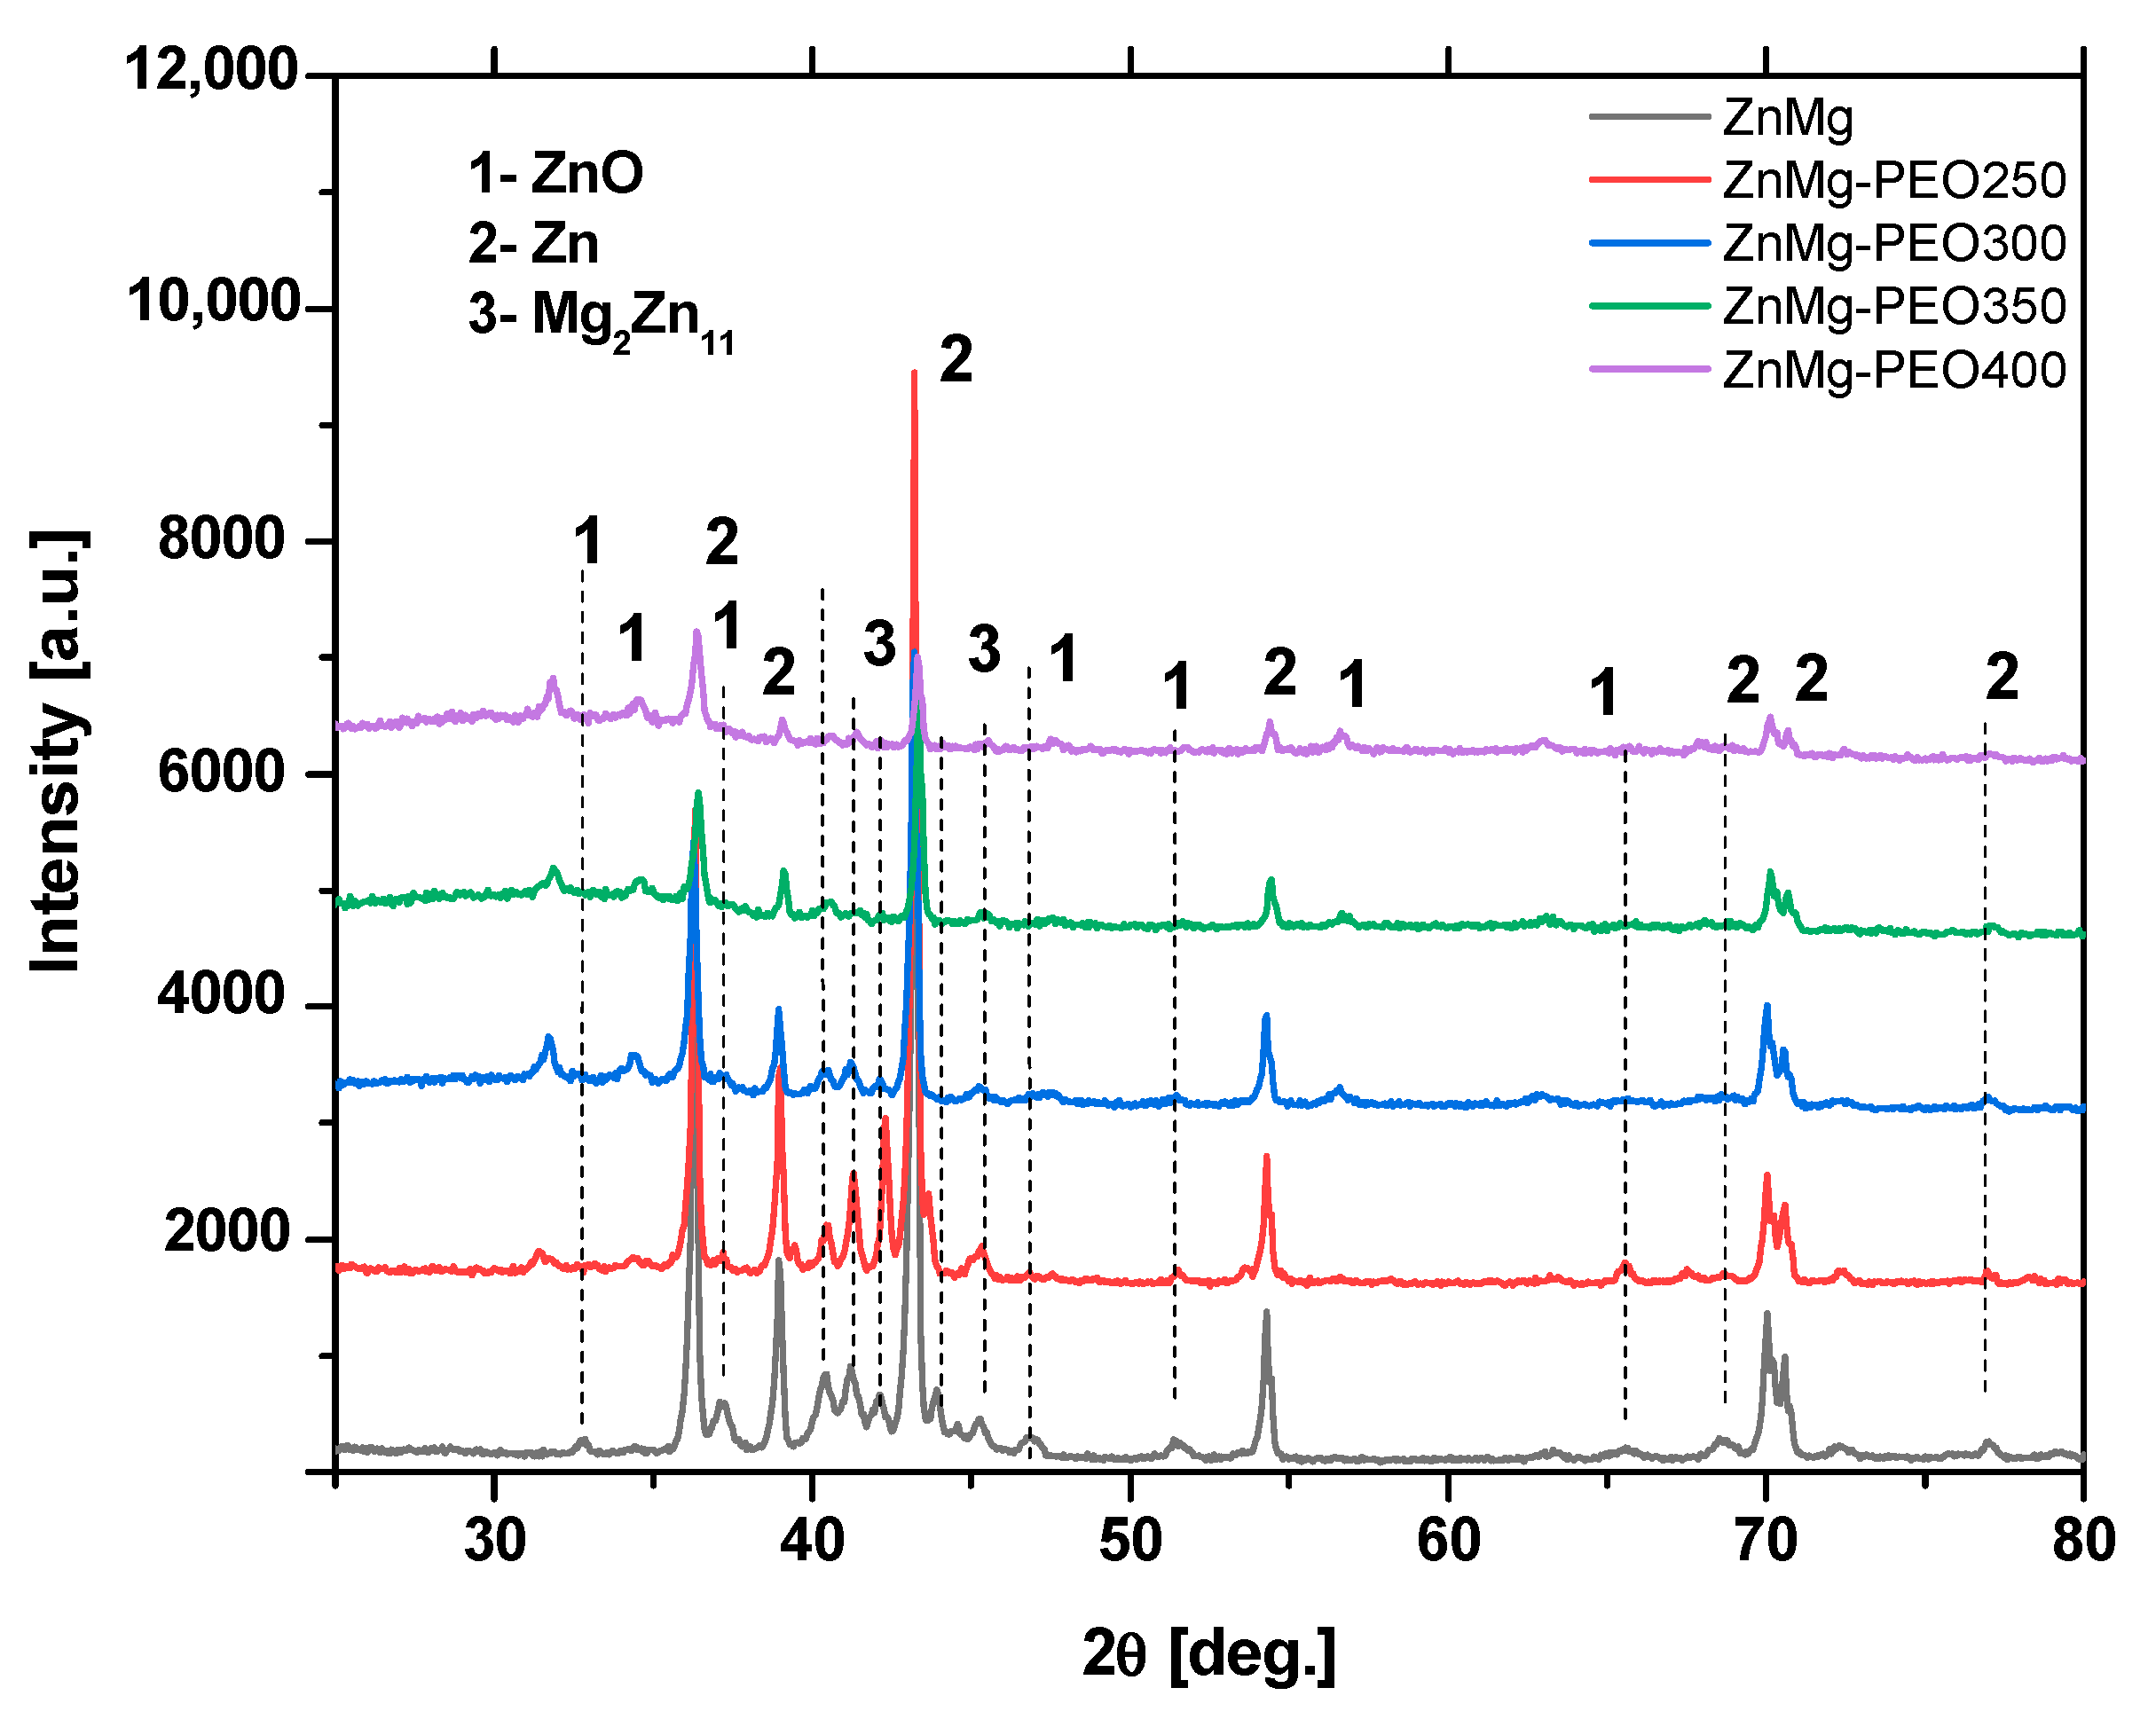
The intensity of the diffractometric maxima corresponding to ZnO increased progressively with treatment voltage, reaching a maximum at 400 V. This suggests that the thickness and/or crystallinity of the oxide layer may be increasing.
Concurrently, the intensities of lines attributable to metallic Zn (2) and intermetallic phase-Mg2Zn11 exhibited a tendency to decrease, indicating an enhanced coating of the substrate or a potential partial transformation of these into oxide phases. The findings of this study demonstrate that PEO treatment results in the formation of an oxide-crystalline mixed layer, which possesses the inherent capacity to function as a corrosion inhibitor.
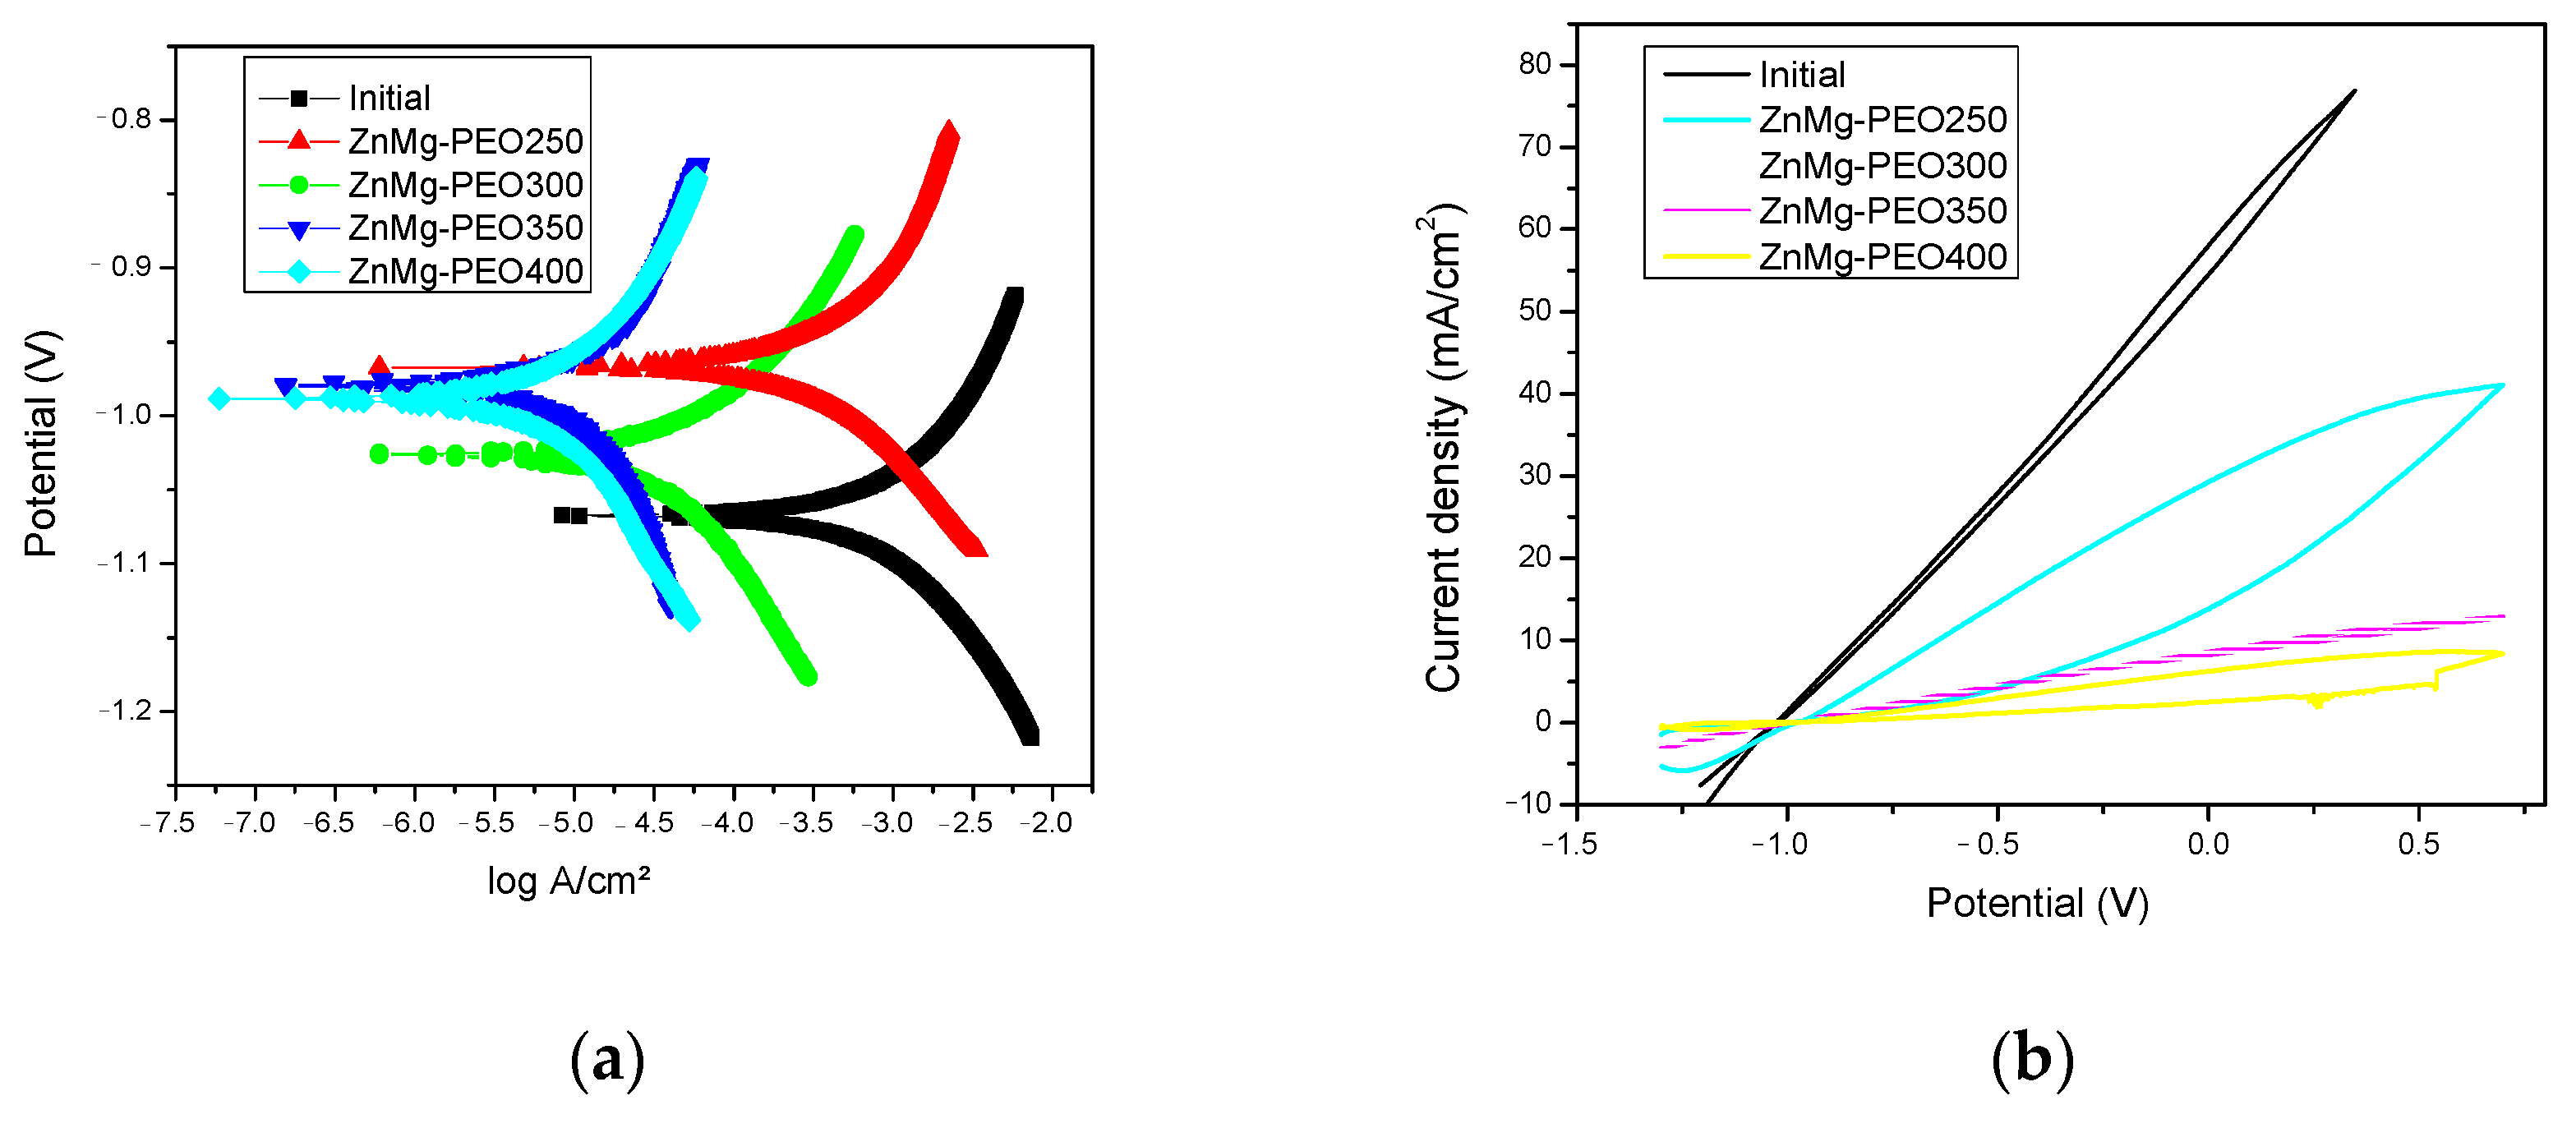
The Tafel curves (see
Figure 3a) enabled the assessment of the corrosion potential (E
corr) and the corrosion current density (i
corr), which are pivotal parameters for the quantification of the corrosion rate. A shift of E
corr towards more positive values and a significant reduction of i
corr were observed for the PEO-treated samples compared to the initial sample, indicating improved electrochemical protection due to the formation of the oxide layer. The ZnMg-PEO350 sample exhibited the lowest corrosion current density, indicative of its superior electrochemical protection properties.
The parameters extracted from the Tafel curves (see
Table 3) revealed a substantial enhancement in corrosion resistance following PEO treatment. The untreated sample exhibited a corrosion current density (j
corr) of 0.277 mA/cm
2 and a corrosion rate (v
corr) of 3.87 mm/yr, associated with a reduced polarisation resistance (Rp) of 112 Ω·cm
2. In contrast, the samples that were treated with PEO, specifically O3 and O4, exhibited a significant decrease in j
corr, reaching 0.014 mA/cm
2 and 0.032 mA/cm
2, respectively. Concurrently, v
corr underwent a reduction to 0.199 and 0.451 mm/yr. This enhancement is substantiated by the elevated Rp values of 2210 and 1180 Ω·cm
2 for O3 and O4, respectively, which are considerably higher than those of the original sample. In addition, a minor alteration in the corrosion potential (E
corr) towards more positive values was detected for all PEO samples, indicating a more noble character of the oxide-dated surfaces.
The cyclic polarisation curves (see
Figure 3b) provided additional information on the susceptibility to localised corrosion. The oxidised samples exhibited darker or absent hysteresis loops, suggesting a reduced tendency to oxidise in comparison to the untreated surface. The initial sample displays a substantially higher current density over the entire anodic range, reaching values exceeding 70 mA/cm
2, indicating intense electrochemical activity and an increased susceptibility to generalised corrosion and possible pitting initiation. The ZnMg-PEO250 sample displays a moderately open hysteresis loop, which is indicative of the initiation of partial passivation mechanisms and a reduced, though not eliminated, susceptibility to localised corrosion. When considering the ZnMg-PEO300-ZnMg-PEO400 samples, the curves demonstrate a substantially diminished current density, thereby signifying the establishment of stable oxide layers with a high degree of efficiency in the inhibition of anodic reactions and the provision of effective protection against localised corrosion.
This evolution of cyclic behaviour suggests a progressive improvement in corrosion resistance with PEO treatment. The ZnMg-PEO400 sample exhibited the best electrochemical performance in terms of passivation and stability.
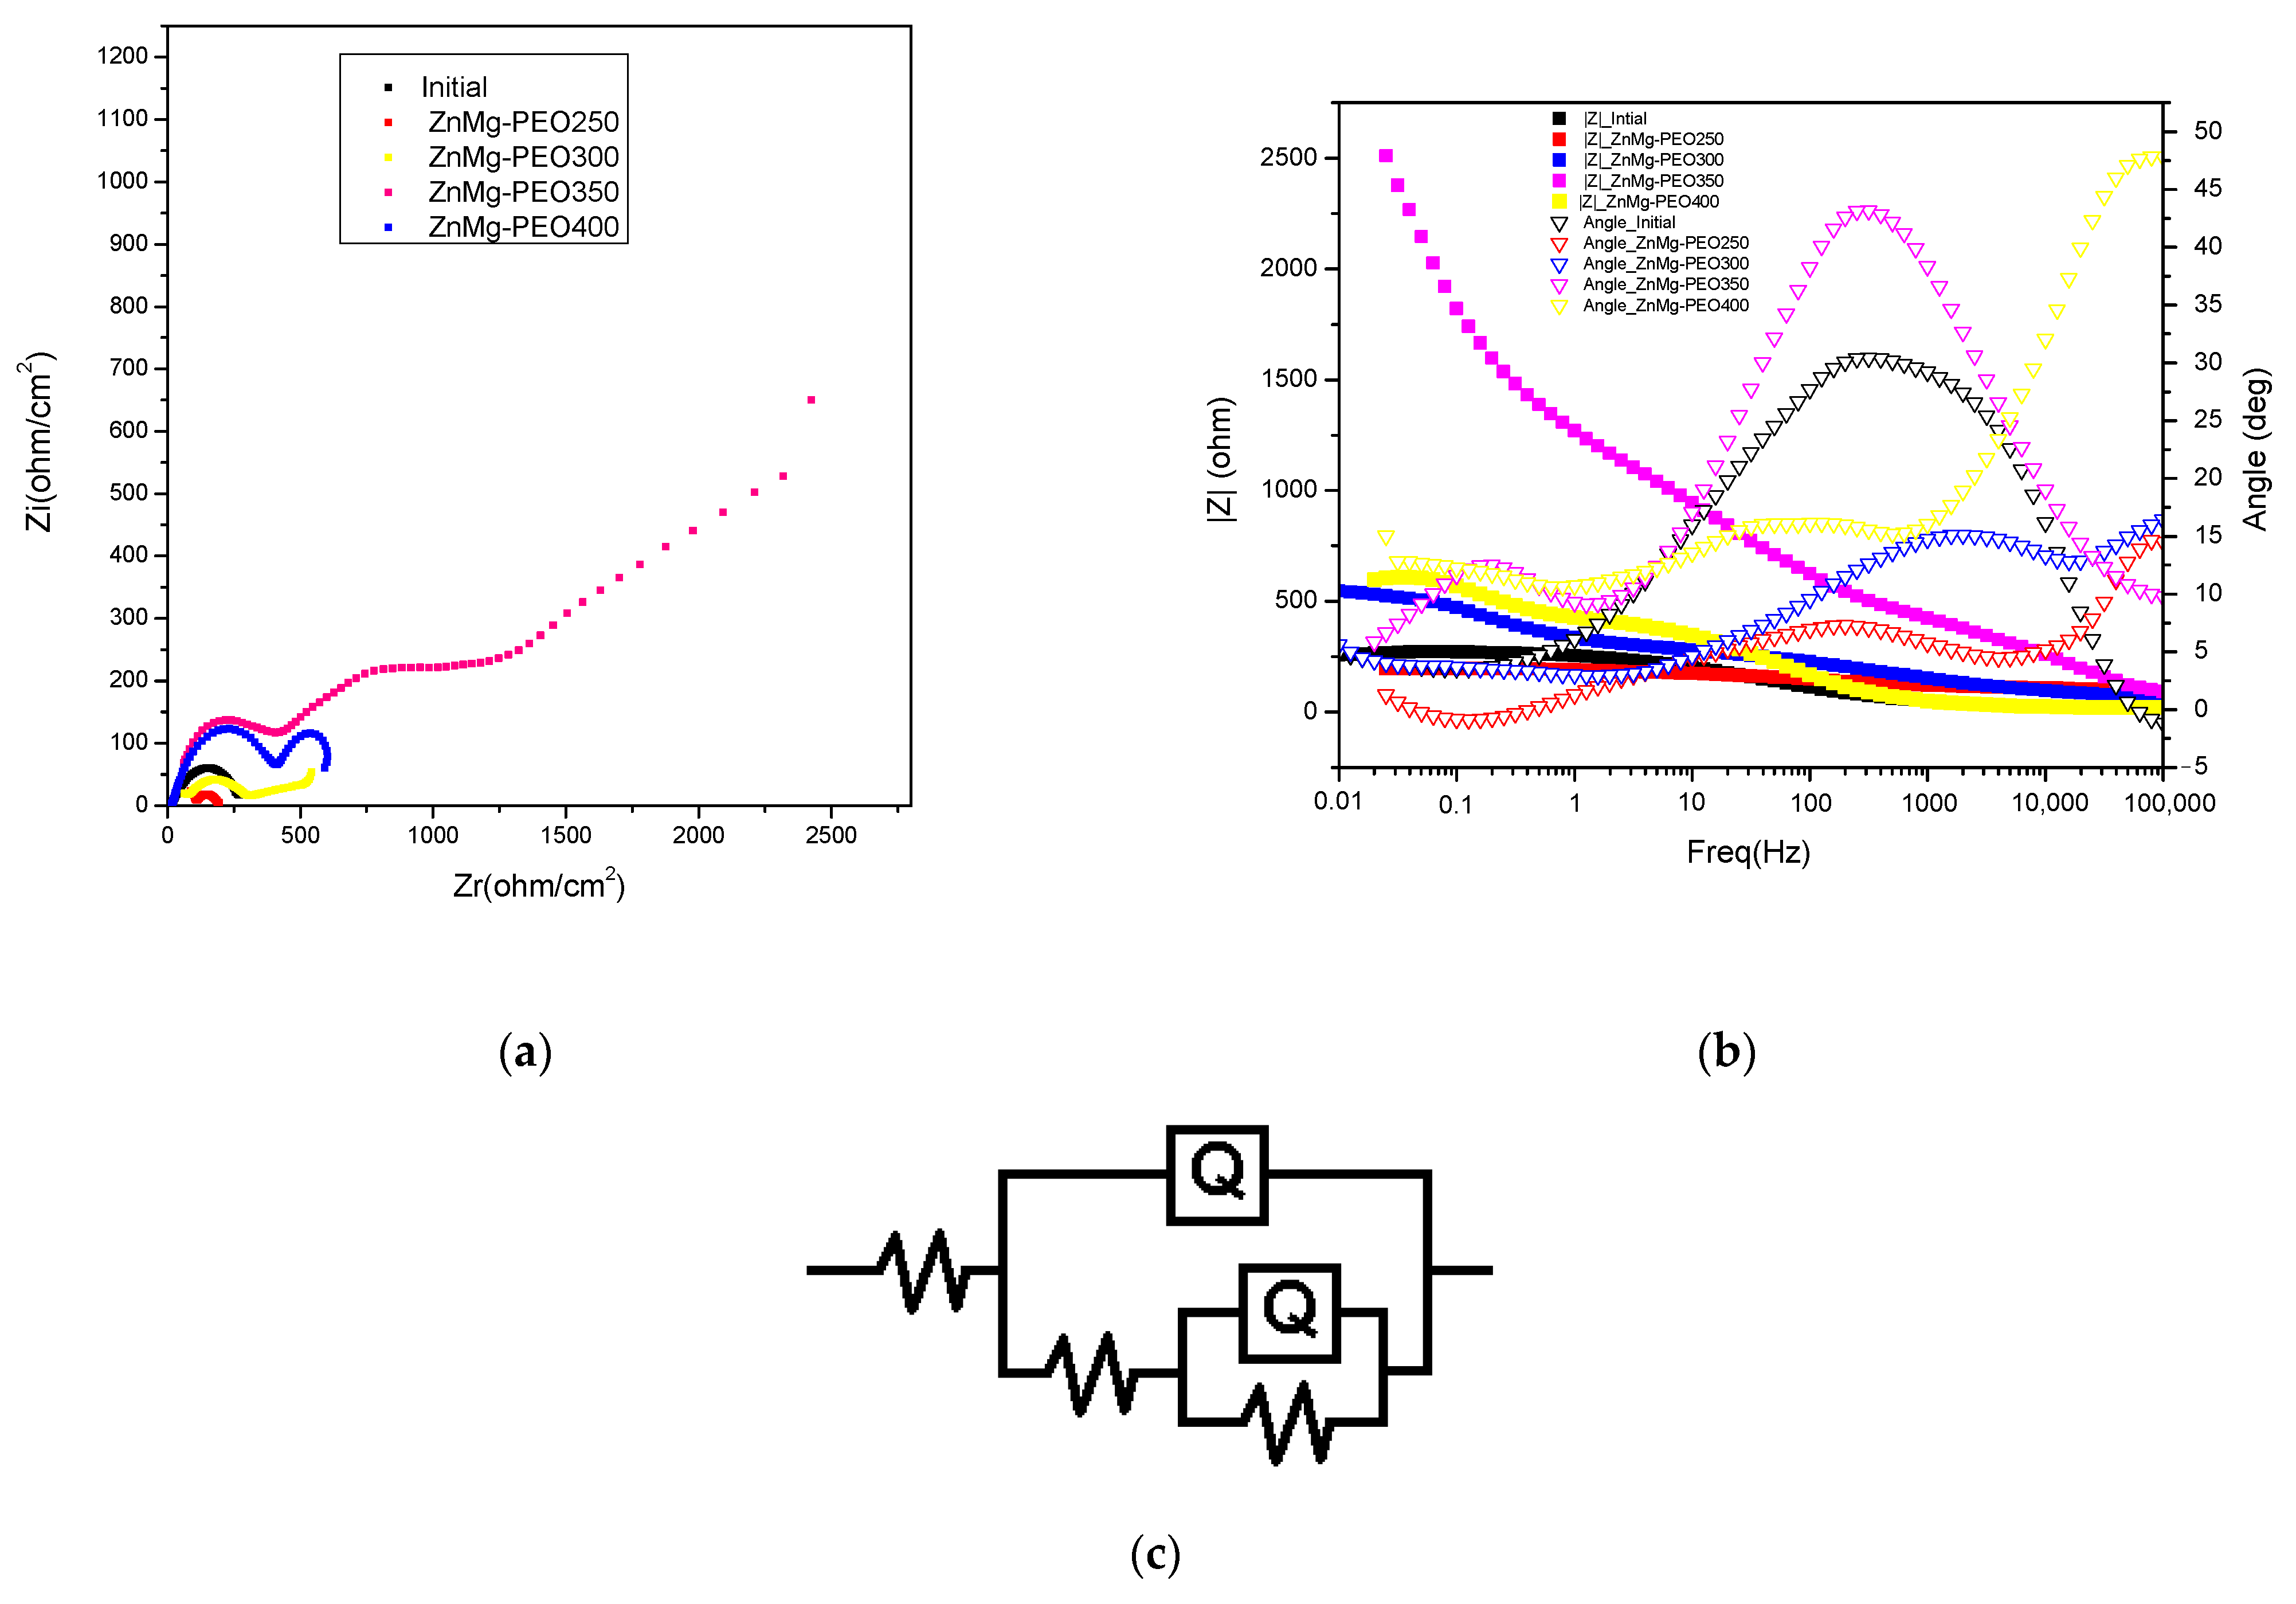
Nyquist plots (
Figure 4a) show significant improvements in the electrochemical behaviour of the ZnMg alloy following PEO treatment. The untreated specimen displays a minor capacitive semicircle, suggesting a low polarisation resistance and, consequently, restricted corrosion protection. In turn, the samples treated with PEO demonstrate semicircles of increased diameter, attributable to elevated charge transfer resistance and the formation of protective oxide layers. The ZnMg-PEO350 sample displays the most substantial semicircle diameter, indicative of elevated polarisation resistance and an exceptional barrier capability against corrosive ions. The ZnMg-PEO300 and ZnMg-PEO400 samples also showed improvements over the initial state, though to a lesser extent, suggesting differences in the morphology, thickness or compactness of the oxide layer formed [
25].
The existence of two time constants (as evidenced by the deviations from the ideal semicircles) is consistent with a porous layer-compact layer model and has been modelled using the circuit R(Q(R(QR))), as illustrated in
Figure 4c.
Bode plots (see
Figure 4b) furnish supplementary data concerning the electrochemical behaviour of the treated and untreated samples, thereby reflecting the efficacy of the oxide layers in acting as a barrier to corrosion processes. In the |Z| vs. frequency plot, it can be observed that the PEO3 sample exhibits the highest impedance values over almost the entire frequency range, with a maximum of over 2000 Ω at low frequencies (0.01–0.1 Hz). This indicates a significantly increased polarisation resistance and, therefore, a superior corrosion protection. In contrast, the ZnMg-PEO250 sample, and to a lesser extent the initial sample, exhibit considerably lower |Z| values, reflecting a poor efficiency of the formed layer. With regard to phase behaviour, ZnMg-PEO350 and ZnMg-PEO400 samples demonstrate high maximum phase angles (approximately 45°) across a broad frequency range (10–1000 Hz), suggesting a notable capacitive response linked to the development of a compact and stable oxide layer. The presence of a broad region where the phase angle remains high is indicative of extensive electrochemical passivity and the efficiency of the protective layer. The ZnMg-PEO250 samples, notably the untreated sample, demonstrate a low phase angle (below 20°) across the majority of the frequency range. This indicates a tendency towards a more resistive-like behaviour, consequently leading to a diminished pro-protection effect [
26].
Therefore, PEO treatment leads to a significant improvement in the corrosion resistance [
27] of the ZnMg alloy, attributable to the formation of stable, adherent and electrochemically passive oxide layers.
The equivalent circuit R(Q(R(QR)) has been utilised for the modelling of EIS data and has been found to be suitable for systems with two time constants, a characteristic of PEO-organic oxide coated materials. This circuit reflects the contributions of the electrolyte, the outer porous layer and the inner dense layer to the electrochemical response of the system. The primary parameters of the circuit (
Table 4) were as follows: Rs (electrolyte resistance): This represents the solution resistance (NaCl 0.9%) between the working and reference electrode, Q1 (CPE—constant phase element, outer layer). This replaces an ideal capacitance in order to describe the nonlinear behaviour of the outer porous layer formed after PEO treatment. This element serves to reflect the heterogeneity and roughness of the surface, R1 (porous layer resistance), which is associated with the less compact portion of the oxide layer. An elevated value suggests a porous layer exhibiting enhanced resistance to ion penetration. Q2 (CPE, inner layer): This phenomenon is indicative of the capacitive behaviour exhibited by the dense, compact layer that is situated between the substrate and the porous layer. R2 (charge transfer resistance) is defined as the resistance to charge transfer at the metal/solution interface, which is influenced by the properties of the inner layer. An increase in this value is indicative of enhanced protection against the process of corrosion. The electrolyte resistance (Rs) exhibited relatively consistent values across the samples, ranging from 18 to 43 Ω·cm
2, with no substantial impact on the interpretation. In contradistinction, the variations in the internal resistances and constant phase element (CPE) parameters provide a clear reflection of the efficacy of the applied treatment. The untreated specimen displays an exceptionally low charge transfer resistance (R1) of just 20 Ω·cm
2, suggesting inadequate corrosion protection. The PEO treatment has been shown to induce a substantial increase in R1, particularly in samples ZnMg-PEO350 (1471 Ω·cm
2) and ZnMg-PEO400 (419 Ω·cm
2), thereby indicating the presence of an effective barrier at the metal-electrolyte interface. The low values of Q2 for ZnMg-PEO350 (4.66·10
−7 Ss
n/cm
2) and ZnMg-PEO400 (5.5·10
−5 Ss
n/cm
2) samples, which correlate with relatively constant n exponents (
n ≈ 0.72–0.86), suggest an enhanced capacitive behaviour and the formation of more homogeneous and compact layers. The ZnMg-PEO400 sample exhibited an n2 exponent of 0.86, the closest to the ideal capacitive behaviour (
n = 1), thus supporting the hypothesis of efficient electrochemical passivation. With regard to the outer porous layer, considerable variation is observed in Q1 and R1. The ZnMg-PEO350 sample is characterised by a high R1 (83 Ω·cm
2), indicating a resistant porous layer, and a low Q1 value, suggesting a reduced porosity distribution and a more pronounced dielectric character.
The charge transfer resistance (R1), associated with the dense inner layer formed by microarc oxidation, reflects the ability of the electrochemical barrier to limit anodic processes. The untreated specimen displays an extremely low R1 value (20 Ω·cm
2), signifying direct contact between the electrolyte and the metal substrate, lacking substantial protection. Subsequent to the implementation of PEO treatment, a progressive escalation of R1 was observed, with maximum values recorded for ZnMg-PEO350 (1471 Ω·cm
2) and ZnMg-PEO400 (419 Ω·cm
2). This finding suggests the formation of a compact and stable oxide layer, which is capable of effectively reducing charge transfer at the interface. This substantial increase in R1 is consistent with the capacitive behaviour observed in the Bode plots and with the large Nyquist half-circle diameters, thus confirming the superior effectiveness of the ZnMg-PEO350 treatment in improving corrosion resistance. The ZnMg-PEO300 sample, with an R1 of 309 Ω·cm
2, indicates an intermediate level of protection. In contrast, ZnMg-PEO250 remains significantly below the others, with an R1 of only 71 Ω·cm
2, suggesting the presence of a less dense or poorly coated layer. The corrosion protection efficiency (P.E.) was calculated based on the charge transfer resistance values obtained from EIS, using the method reported by Yang et al. [
28]. The results showed a significant increase in P.E.% for the PEO-treated samples compared to the untreated ZnMg alloy: 71.8% (ZnMg-PEO250), 93.5% (ZnMg-PEO300), 98.6% (ZnMg-PEO350) and 95.2% (ZnMg-PEO400), respectively.
The strength of the porous layer (R2) provides relevant information on the continuity and efficiency of the outer barrier formed by microarc oxidation. The ZnMg-PEO350 sample shows an exceptionally high R2 value (1962 Ω·cm2), indicating a well-organised porous layer with low porosity and limited interconnectivity, which effectively prevents the penetration of aggressive ionic species. This value is almost 10 times higher than that of the untreated sample (232 Ω·cm2), suggesting extensive protection as early as the subsurface layer. The ZnMg-PEO300 sample demonstrates an intermediate value of 296 Ω·cm2, which is moderately higher than the initial sample. This finding suggests a partial improvement. In contrast, ZnMg-PEO250 (90 Ω·cm2) showed low R2 values, suggesting a more permeable pore structure or insufficient growth of the outer layer under these treatment conditions. Thus, ZnMg-PEO350 exhibits a clear synergy between the resistance of the porous layer (R2) and the inner layer (R1), both of which have high values, which explains the superior behaviour observed in the Nyquist and Bode plots.
Yao et al. [
29] reported a corrosion current density of 8.787 × 10
−6 A/cm
2 and an E
corr of −1.01 V vs. SCE for a Zn-3Mg alloy in 3.5% NaCl. In our study, the PEO350 sample exhibited a similar j
corr (0.014 mA/cm
2) and a more noble E
corr value of −0.94 V, suggesting improved corrosion resistance and delayed onset of degradation. Similarly, Vida et al. [
30] reported j
corr values in the range of 0.00073 to 0.002 mA/cm
2 for as-cast Zn-Mg alloys. Although these are slightly lower than the values obtained in our study for the untreated alloy, the PEO-treated samples, particularly ZnMg PEO350, show a better corrosion performance. Moreover, our impedance results for PEO350 reveal a significantly higher charge transfer resistance and larger Nyquist semicircle compared to the untreated alloy and other PEO variants. This supports the enhanced corrosion protection performance of the dual-layered PEO oxide film, which provides a dense and stable barrier not observed in the as-cast alloys studied previously.
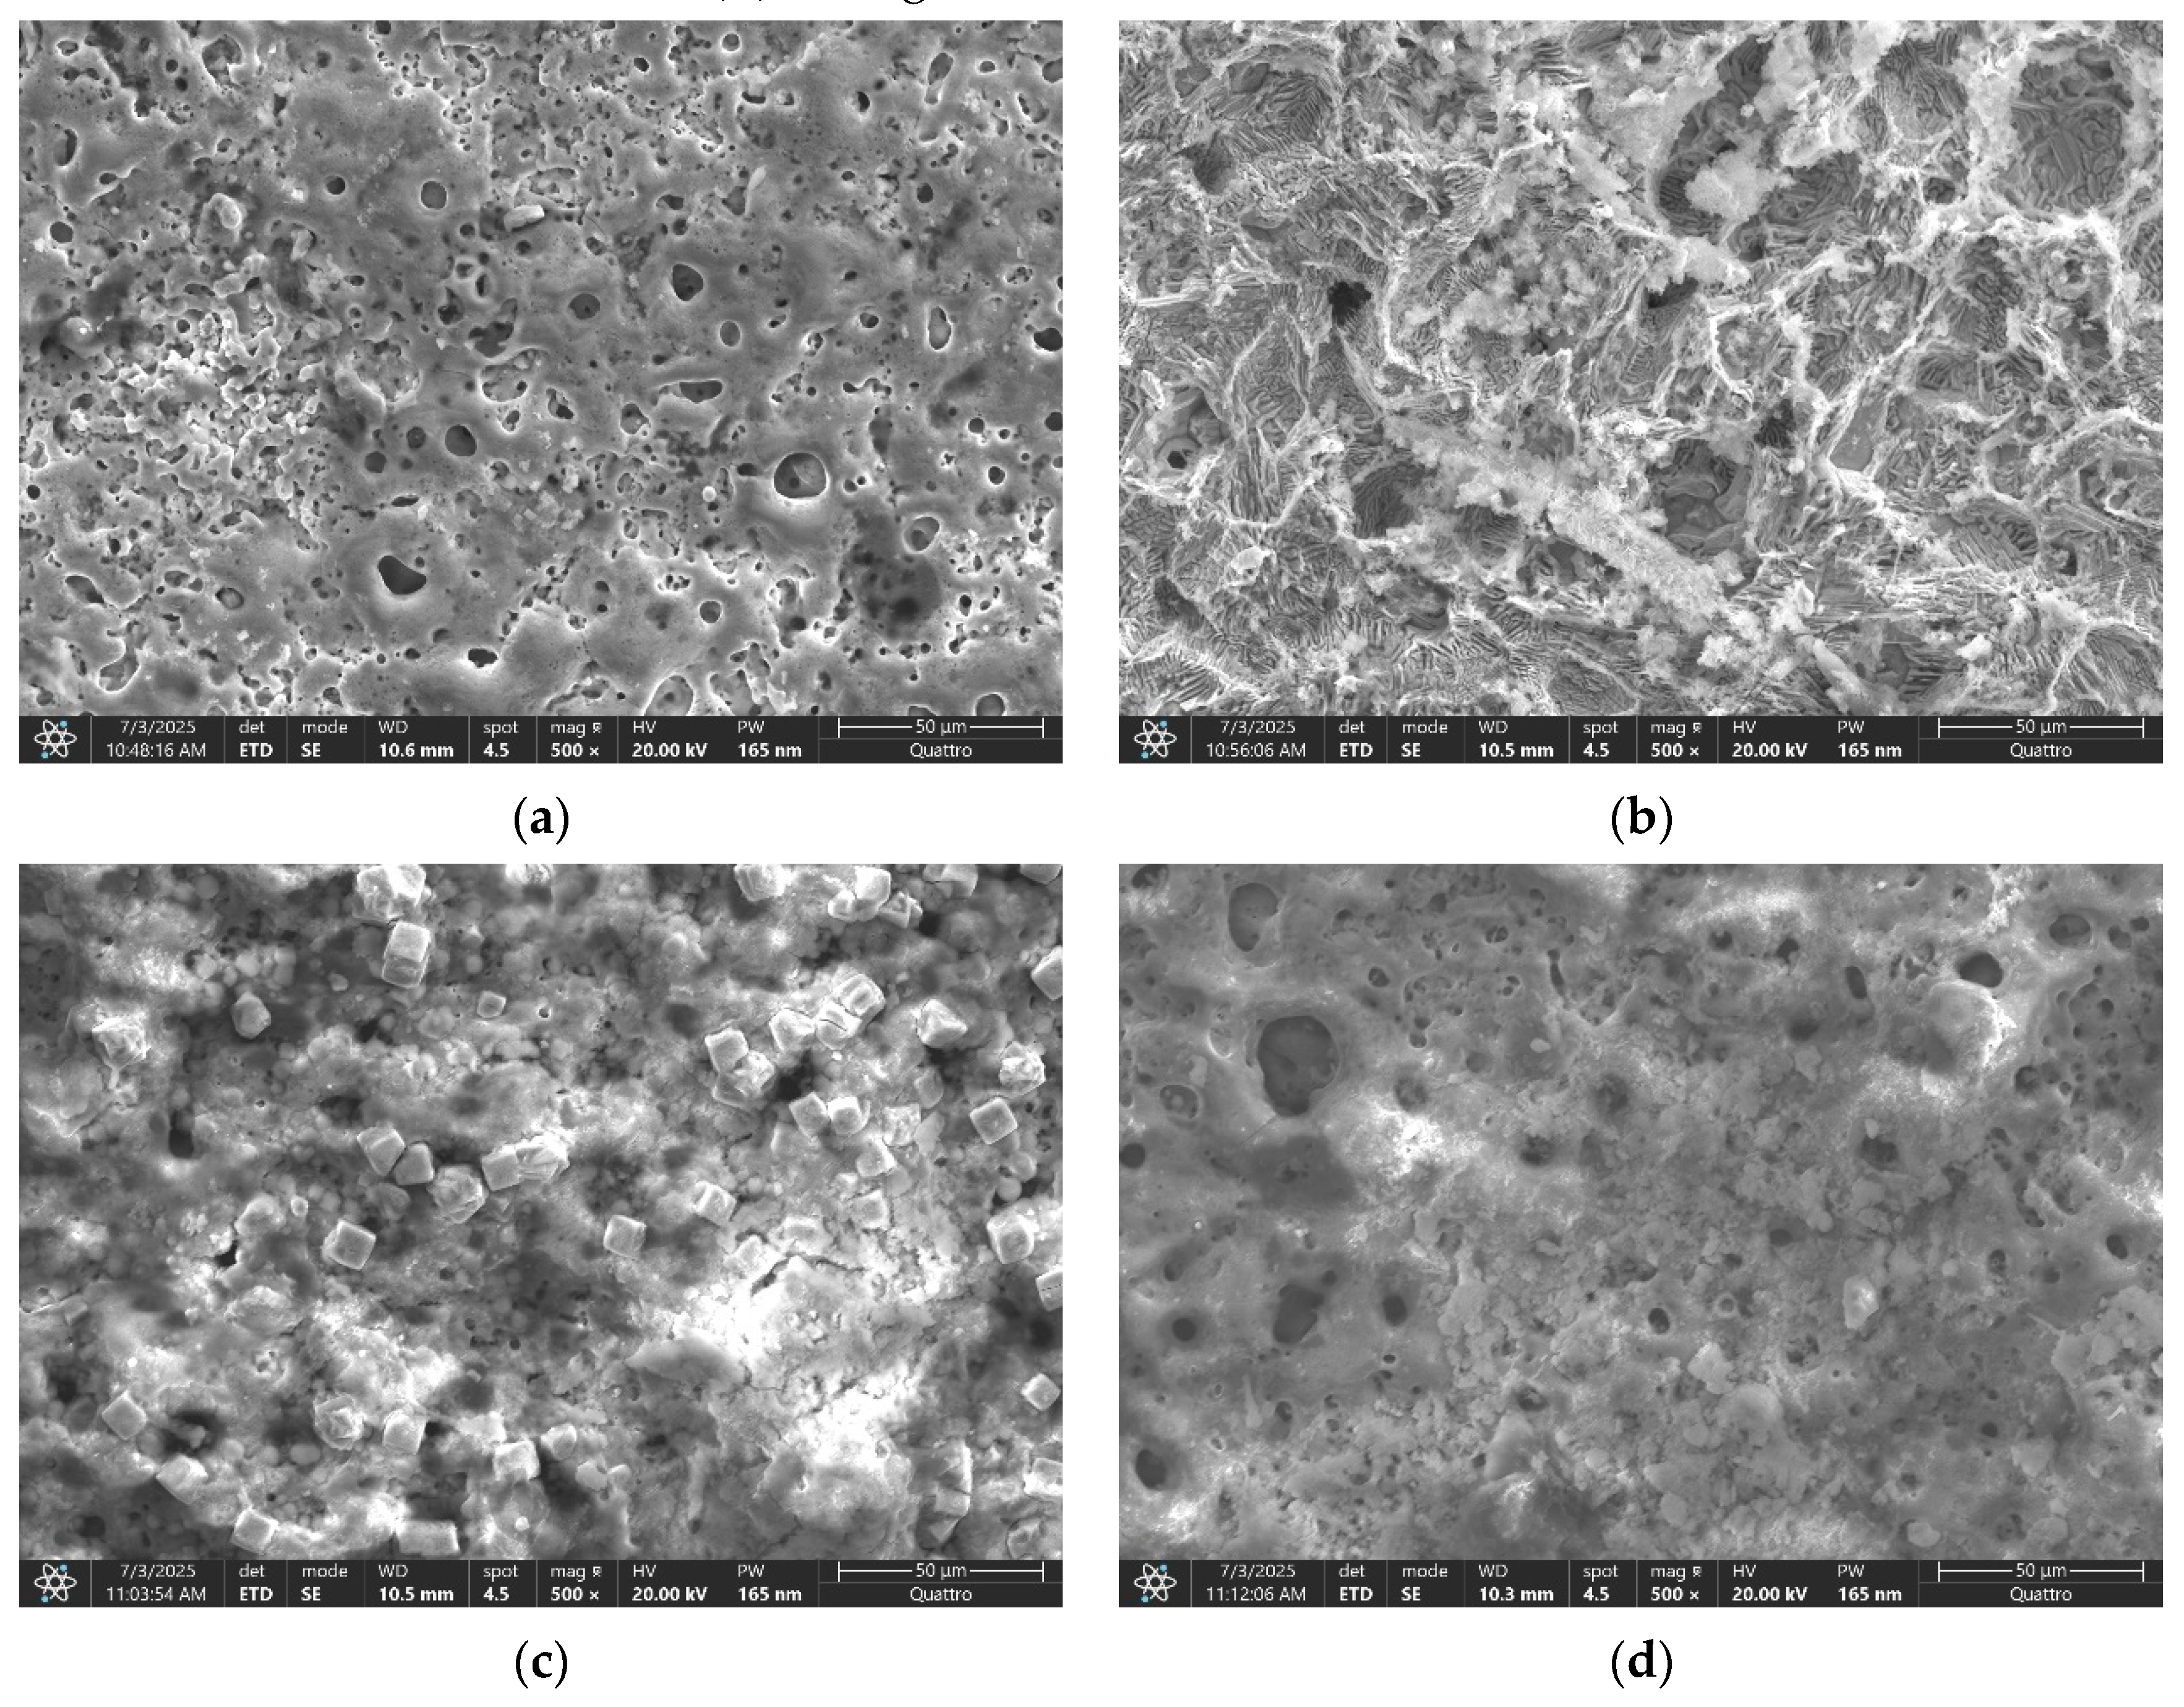
Prior to salt solution exposure, the surface of ZnMg-PEO250 displayed a relatively smooth morphology, as illustrated in
Figure 1a, exhibiting fine and evenly distributed porosity. However, following the corrosion test, the surface underwent visible changes, characterised by the emergence of discrete traces of fine cracks, the pores became more irregular and deep in some regions, and the overall texture underwent slight degradation, as depicted in
Figure 5a. Despite the oxide layer maintaining its adhesion and integrity, these alterations mark the onset of a localised deterioration process due to extended exposure to the 0.9% NaCl solution.
As illustrated in
Figure 1b, the surface of the ZnMg-PEO300 sample exhibited a relatively rough texture, characterised by irregular, medium-sized pores prior to the electro-chemical corrosion resistance test. However, the surface underwent significant alterations following the test, as illustrated in
Figure 5b. The alterations included the development of deeper pores, “open” edges, and a fragmented texture, accompanied by the presence of evident cracks between the oxidic regions. Additionally, exposed areas, potentially indicating a visible metallic substrate, were identified. Despite the fact that the coating was initially found to be relatively continuous and uniform, significant degradation was observed after the corrosion test, with indications of local delamination and penetration of the corrosive medium.
In the case of ZnMg-PEO350, the surface before corrosion was found to be dense (
Figure 1c). The porosity appeared fine and uniformly distributed, with round and small pores, suggesting a controlled PEO process. No obvious cracks were evident, and the texture was compact and homogeneous. After the corrosion resistance test, the surface retained a generally stable appearance with minor changes (
Figure 5c). The morphology of the ZnMg-PEO350 sample exhibited remarkable robustness, maintaining its structural integrity even under exposure to a saline environment. This observation is further substantiated by the presence of a well-formed oxide structure, which demonstrated notable resistance to the effects of ionic attack. The presence of slightly pronounced pores is observed in some regions, but no major cracks have been identified and no aggressive exfoliation or openings in the oxide layer were observed [
31].
As illustrated in
Figure 1d, the surface of sample ZnMg-PEO400 appears to be quite rough, characterised by the presence of large, deep, and irregularly distributed pores. The structure appears to be more severely formed, exhibiting traces of microcracks within oxidised regions. The layer density was found to be more uneven in comparison to ZnMg-PEO350. Following the corrosion process (see
Figure 5d), the surface of the material underwent significant alterations. The pores became more open, the microcracks became more pronounced, and local delamination or exfoliation was observed in some regions. The overall texture indicated a compromise in the integrity of the oxide layer. At a voltage of 400 V, the oxide layer that is initially formed is characterised by increased thickness. However, this layer is susceptible to cracking and mechanical instability [
32]. These vulnerabilities are further accentuated during the process of corrosion.
The substantial decline in the percentage of oxygen in ZnMg-PEO300 indicates a severe degradation of the oxide layer in a saline environment. The analysis of sample PEO3 revealed the presence of a consistent oxide layer, a property that is known to contribute to enhanced corrosion resistance. Elemental sodium (Na) exhibits redox mobility, which suggests the potential for migration or partial removal from the surface during testing procedures.
The reduced content of ZnMg-PEO350 is indicative of a more stable structure, exhibiting reduced permeability to ion exchange. It has been observed that Mg exhibits increased reactivity in saline environments; in ZnMg-PEO400, a decline is noted, which is likely attributable to preferential dissolution. ZnMg-PEO250-PEO3 have been shown to retain Mg more effectively in the oxide layer, suggesting that they may facilitate more efficient initial oxidation. The almost zero value in ZnMg-PEO300 indicates a deep degradation of the phosphate layer. ZnMg-PEO350 retains the most P, indicating a stable and protective layer with corrosion inhibitory potential. Cl is a direct indicator of salt solution penetration. ZnMg-PEO400 has the highest accumulation, which is indicative of a porous or cracked layer. Furthermore, ZnMg-PEO250 and ZnMg-PEO350 have been shown to offer effective protection against Cl
− penetration. ZnMg-PEO350 appears to retain the greatest quantity of K, a phenomenon that may be attributable to a denser oxide layer and a propensity to incorporate cationic species. The elevated ZnMg-PEO300 content is indicative of substrate exposure, manifesting as damaged or thin oxide layers. ZnMg-PEO350 and ZnMg-PEO400 both exhibited moderate values, indicative of an effective oxidative barrier [
33].
In comparison with the chemical compositions that have been determined on oxidised surfaces following PEO, the following observations were made: A decline in oxygen (O) was observed in ZnMg-PEO250 (–1.3%) and ZnMg-PEO400 (–1.3%), while ZnMg-PEO350 (0.2%) exhibited a marginal increase. Conversely, a substantial decrease was noted in ZnMg-PEO300 (–11.1%). The observed decrease in oxygen levels is indicative of the degradation of the oxide layer that had been formed during the PEO treatment. ZnMg-PEO300 exhibited the most significant degradation of the protective layer. ZnMg-PEO350 appears to be the most stable, with the oxide layer preserved. Na is mobile on the surface, i.e., it is not anchored in the compounds, and can be washed or replaced during the corrosion test. The decline in Na levels in ZnMg-PEO350 indicates that the material is becoming more compact and less permeable. For ZnMg-PEO250 and ZnMg-PEO400 samples, Na could be concentrated by diffusion from the saline environment or local restructuring. For the percentages of Mg, slight increases were observed at ZnMg-PEO250-ZnMg-PEO350 (+0.4–0.1%), while a decrease was noted at ZnMg-PEO400 (−0.5%). This is attributable to the reactivity of Mg, which readily dissolves in a saline medium. In the case of ZnMg-PEO400, the loss of Mg can be attributed to selective dissolution. The stability of the other samples indicates satisfactory initial oxidation and, to a certain extent, effective protection. P has been shown to function as a protective element, playing an inhibitory role in a saline environment. The loss of this layer, particularly in ZnMg-PEO300, is indicative of a breakdown in the protective barrier. ZnMg-PEO350 maintains a compact, protective layer of phosphorus. K represents a mobile and weakly bound cation within the layer. The observed variability indicates that it does not directly impact corrosion resistance. The slight increase in ZnMg-PEO350 may be related to efficient retention in the layer. Zn is derived from the metallic substrate; an increase in Zn results in the erosion of the oxide layer. In the case of ZnMg-PEO300, the layer exhibited a pronounced response, enabling substrate detection. The increase observed for ZnMg-PEO350 is moderate, indicating a potential for localised exposure.
As shown in
Table 5, the corrosion process initiates the degradation of the material. P continued to be maintained, although with a marginally more discontinuous distribution. Cl has been identified as a new phenomenon, indicating the presence of chloride ions from the salt solution that have penetrated the layer. Furthermore, Na and K have been redistributed, and there is a possibility that they have migrated due to exposure to the solution. A slight increase in intensity is observed for Zn, indicating localised erosion of the layer and partial exposure of the substrate. A slight decrease in Mg was observed, which may be indicative of preferential dissolution within a saline environment. Cl is an indicator of the penetrative action of the salt solution and the initiation of the chemical degradation process. In general, the layer retains its functionality; however, processes of ionic migration and localised attack begin, especially in the defect areas. The intensity of oxygen is slightly diminished, indicating that the oxide has been partially consumed or converted. The assertion that oxygen is “partially consumed or converted” signifies that oxygen, existing in the form of metal oxides (e.g., ZnO, MgO or oxygenated phosphates), is capable of undergoing specific processes when exposed to a saline solution (0.9% NaCl):
- 1.
Either consumed by dissolution reactions: in the presence of Cl
− ions, metal oxides can be dissolved:
The oxygen is thus “lost” as water and the metal is released as an ion.
- 2.
Participates in the formation of new products: Oxygen can react with chlorides or corrosion intermediates, resulting in:
- -
Hydroxides (less protective):
- -
Complex chlorinated oxihalides or chlorinated zinc species:
- 3.
Local cathodic reduction loss: in anodic or micro-cracked areas:
This reaction consumes dissolved oxygen and has the potential to destabilise the local chemistry of the oxide layer. The conversion of oxygen on the surface from stable forms (oxides) to other forms is a process of significant scientific interest. The presence of soluble metal ions (e.g., Zn
2+, Mg
2+) and by-products (e.g., hydroxides, chlorides) or water is indicative of redox reactions,
Figure 6 and confirmed by XRD analysis in
Figure 7.
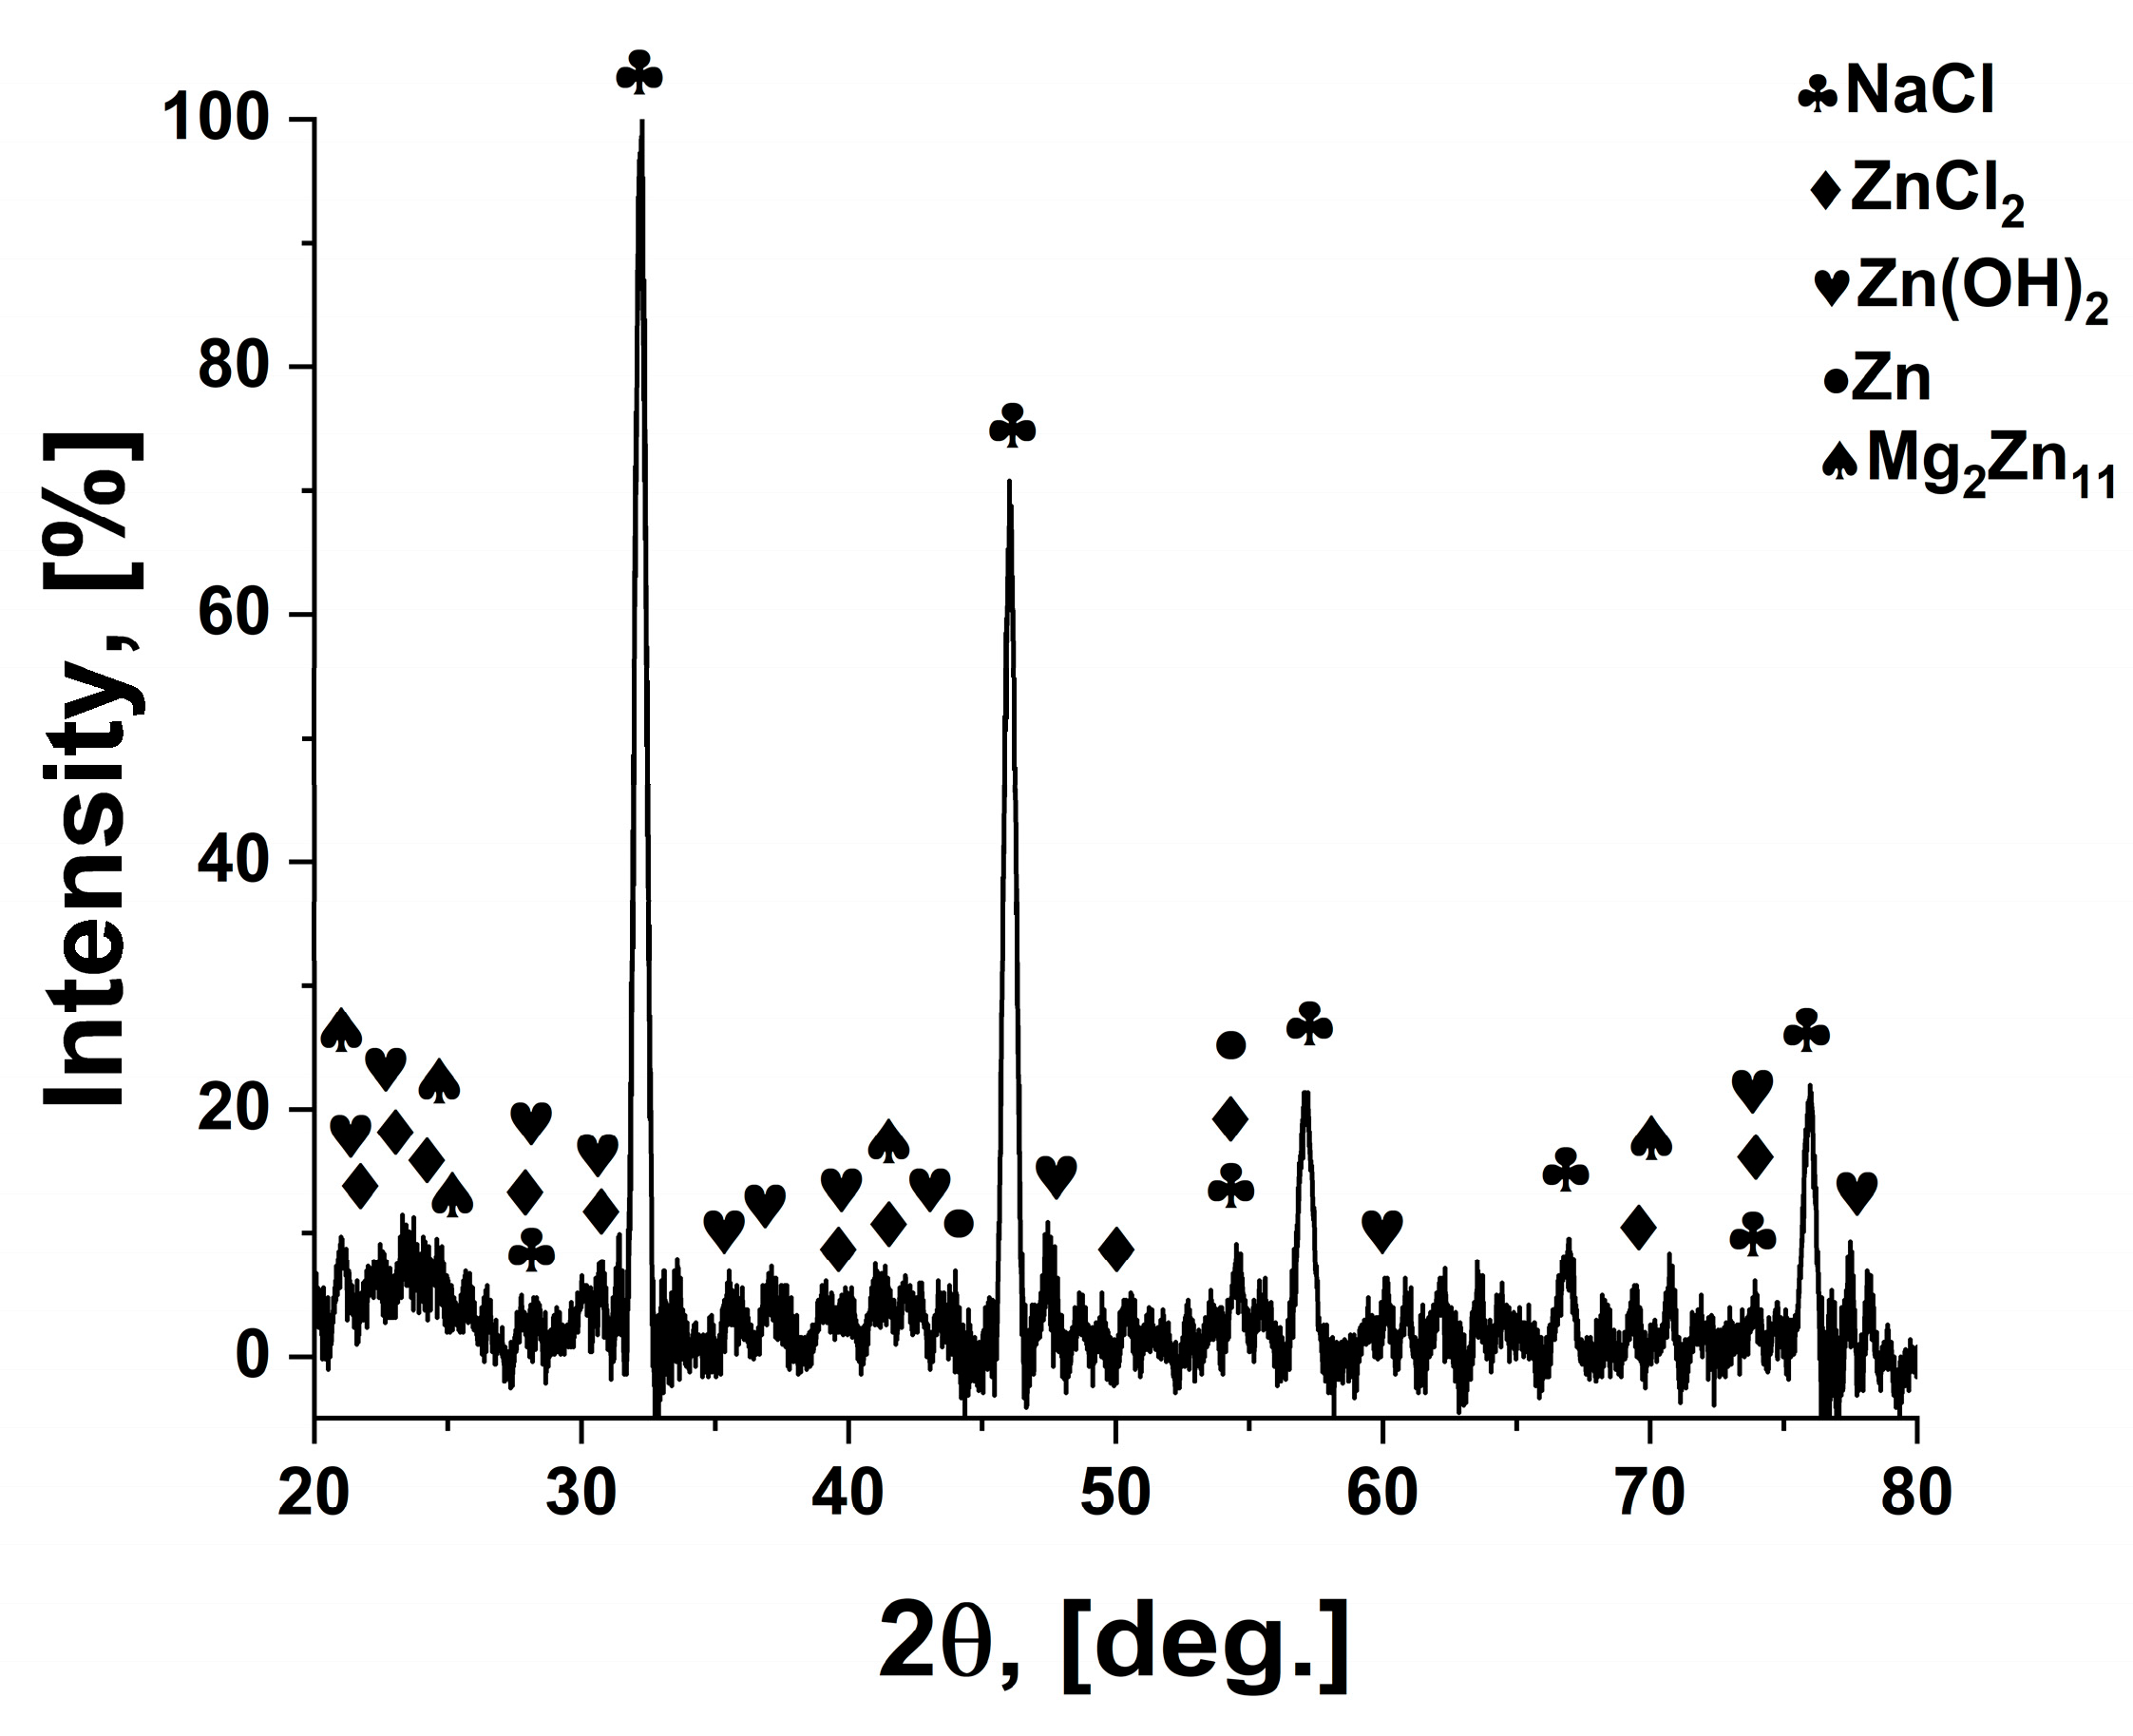
After corrosion of the oxidised layer, based on XRD analysis,
Figure 7, the following compounds were identified: NaCl (halite), Zn(OH)
2, ZnCl
2, Zn, Mg
2Zn
11. The identification of the compounds on the surface confirms the results of the EDS analysis and the chemical reactions taking place between the metallic material and the etching solution. A decrease in the intensity of the characteristic peaks for Zn and Mg
2Zn
11 is observed. The presence of natrium chloride is due to the deposition of this compound, present in the electrolyte solution, in the pores on the surface. Phase identification and peak indexing were performed using Match! version 3.16 software, in conjunction with the Crystallography Open Database (COD). The following reference CIF files were used to ensure accurate phase assignment: Zn—COD: 96-900-8523, ZnO—COD: 96-900-4182, Mg
2Zn
11—COD: 96-152-2822, ZnCl
2—COD: 96-152-8213, Zn(OH)
2—COD: 96-152-7884.
The decline in the oxygen signal, as observed through EDS analysis, is indicative of these transformations and the degradation of the protective layer. For sample ZnMg-PEO300, as illustrated in the analysis of element distribution prior to corrosion (
Supplementary File Figure S1b), it was observed that O exhibited a weak and non-uniform distribution, indicative of an incomplete or porous oxide layer. Zn manifested a high intensity, suggesting either partial substrate exposure or a thin oxide layer. The presence of Na and P elements was marginal, indicating reduced phosphate incorporation. Mg and K elements were also weakly visible, consistent with a weakly oxidised composition. Following the corrosion process, the presence of Cl becomes visible in certain areas, exhibiting both intense and diffuse characteristics. This phenomenon can be attributed to the substantial penetration of ions from the saline solution. Concurrently, the presence of oxygen was found to be minimal, suggesting significant dissolution of the oxide. The intensity of Zn exhibited a pronounced response, indicating extensive exposure of the substrate. In contrast, the signals from Na and P indicated a marked weakness, possibly attributable to their complete dissolution, resulting in the dissolution of phosphates and sodium. The signals from Mg and K were either weak or absent, suggesting preferential dissolution of these elements. The oxide layer composition has been severely compromised. The presence of chlorine, both in terms of quantity and intensity, along with the amplification of the zinc signal, serves to substantiate the degradation of the protective layer and the subsequent exposure of the metallic substrate.
An analysis of the distribution of elements on the surface of the ZnMg-PEO350 sample, as illustrated in the
Supplementary File (see Figure S1c [before]), reveals a robust and homogeneously distributed presence of O before corrosion, thereby confirming the formation of an oxide layer. In contrast, P exhibits a clear distribution. Evidence suggests that the presence of phosphates within the layer is indicative of their integration. The uniform distribution of Na and K elements is attributable to the influence of the electrolyte (Na
3PO
4 + KOH). The moderate signal observed for Zn can be ascribed to the effective coating of the substrate, while the slight visibility of Mg is attributed to its incorporation within the oxide structure. As shown in
Table 5, post-corrosion analysis reveals the retention of elements O and P in terms of intensity and distribution. This is attributable to the layer’s effective resistance to corrosion. In contrast, the presence of element Cl appears diminished and localised, attributed to a reduced penetration of corrosive ions. The presence of Zn is slightly accentuated in certain areas, yet it does not dominate, as the oxide layer continues to provide protection to the substrate. Additionally, Na and K undergo slight redistribution or concentration at the surface, an outcome of their interaction with the saline environment. The elemental distributions confirm a superior chemical resistance of this sample compared to the two previously analysed. Furthermore, the Cl
− ions do not penetrate deeply, and the oxide layer components are maintained.
As demonstrated in
Figure S1d (before) and
Table 5 (after), the distribution of elements was found to be adequate; however, it was slightly non-uniform. This observation indicates efficient oxidation of oxygen prior to corrosion, though with variable density. The presence of P is observed in the layer; however, its homogeneity is found to be inferior to that of ZnMg-PEO350. The elements Na and K are discernible and originate from the PEO electrolyte solution, exhibiting a distribution that encompasses the entire surface. The intensity of Zn is notable due to the imperfect coverage of the substrate by the layer. Following the oxidation process, the elemental magnesium is represented only in a minor way, given that it underwent only marginal oxidation. Following the corrosion process, the presence of Cl is detected, exhibiting an intense, diffuse distribution, attributed to the high penetrability of the layer. A distinct decrease in intensity corresponding to elements O and P was observed, attributable to the impact on the oxide and phosphate layers. Concurrently, Zn becomes predominant due to the exposure of the substrate in multiple regions. The redistribution of Na and K elements, potentially resulting from migration or dilution due to salt attack, is a notable phenomenon. The oxide layer exhibited significant deterioration under the influence of the saline environment. The penetration of Cl ions is extensive, which is conducive to the dissolution of oxide components and the exposure of the metallic substrate.
Subsequent to the corrosion tests, the PEO samples exhibited divergent behaviours, which were found to be directly influenced by the structure and quality of the oxide layer initially formed at varying voltages. The ZnMg-PEO250 sample, which was subjected to a voltage of 250 V, exhibited a relatively stable surface following the corrosion process. This was characterised by minimal layer degradation and moderate Cl− ion penetration, which collectively suggested a satisfactory level of protection. However, it should be noted that the efficacy of this protection was constrained by the limited thickness of the layer. The ZnMg-PEO300 sample, oxidised at 300 V, exhibited the most significant damage: SEM images illustrate substantial cracking and delamination of the layer, while the element distribution demonstrates substantial chlorine ion penetration and significant oxygen and phosphorus losses. These observations are indicative of advanced corrosion and an initially unstable layer. In contrast, PEO3, treated at 350 V, demonstrated optimal performance. The surface remained compact, with no visible cracks, and EDS maps after corrosion showed that oxygen, phosphorus and chlorine, in minimal quantities, had penetrated the oxide layer, indicating that it was dense, homogeneous and protective. The ZnMg-PEO400 sample, obtained at 400 V, exhibited an initial layer of considerable thickness, yet demonstrated a propensity towards exfoliation and substantial penetration of corrosive ions. This observation suggests that the high voltage may have induced a brittle layer, which is susceptible to cracking and structural instability.
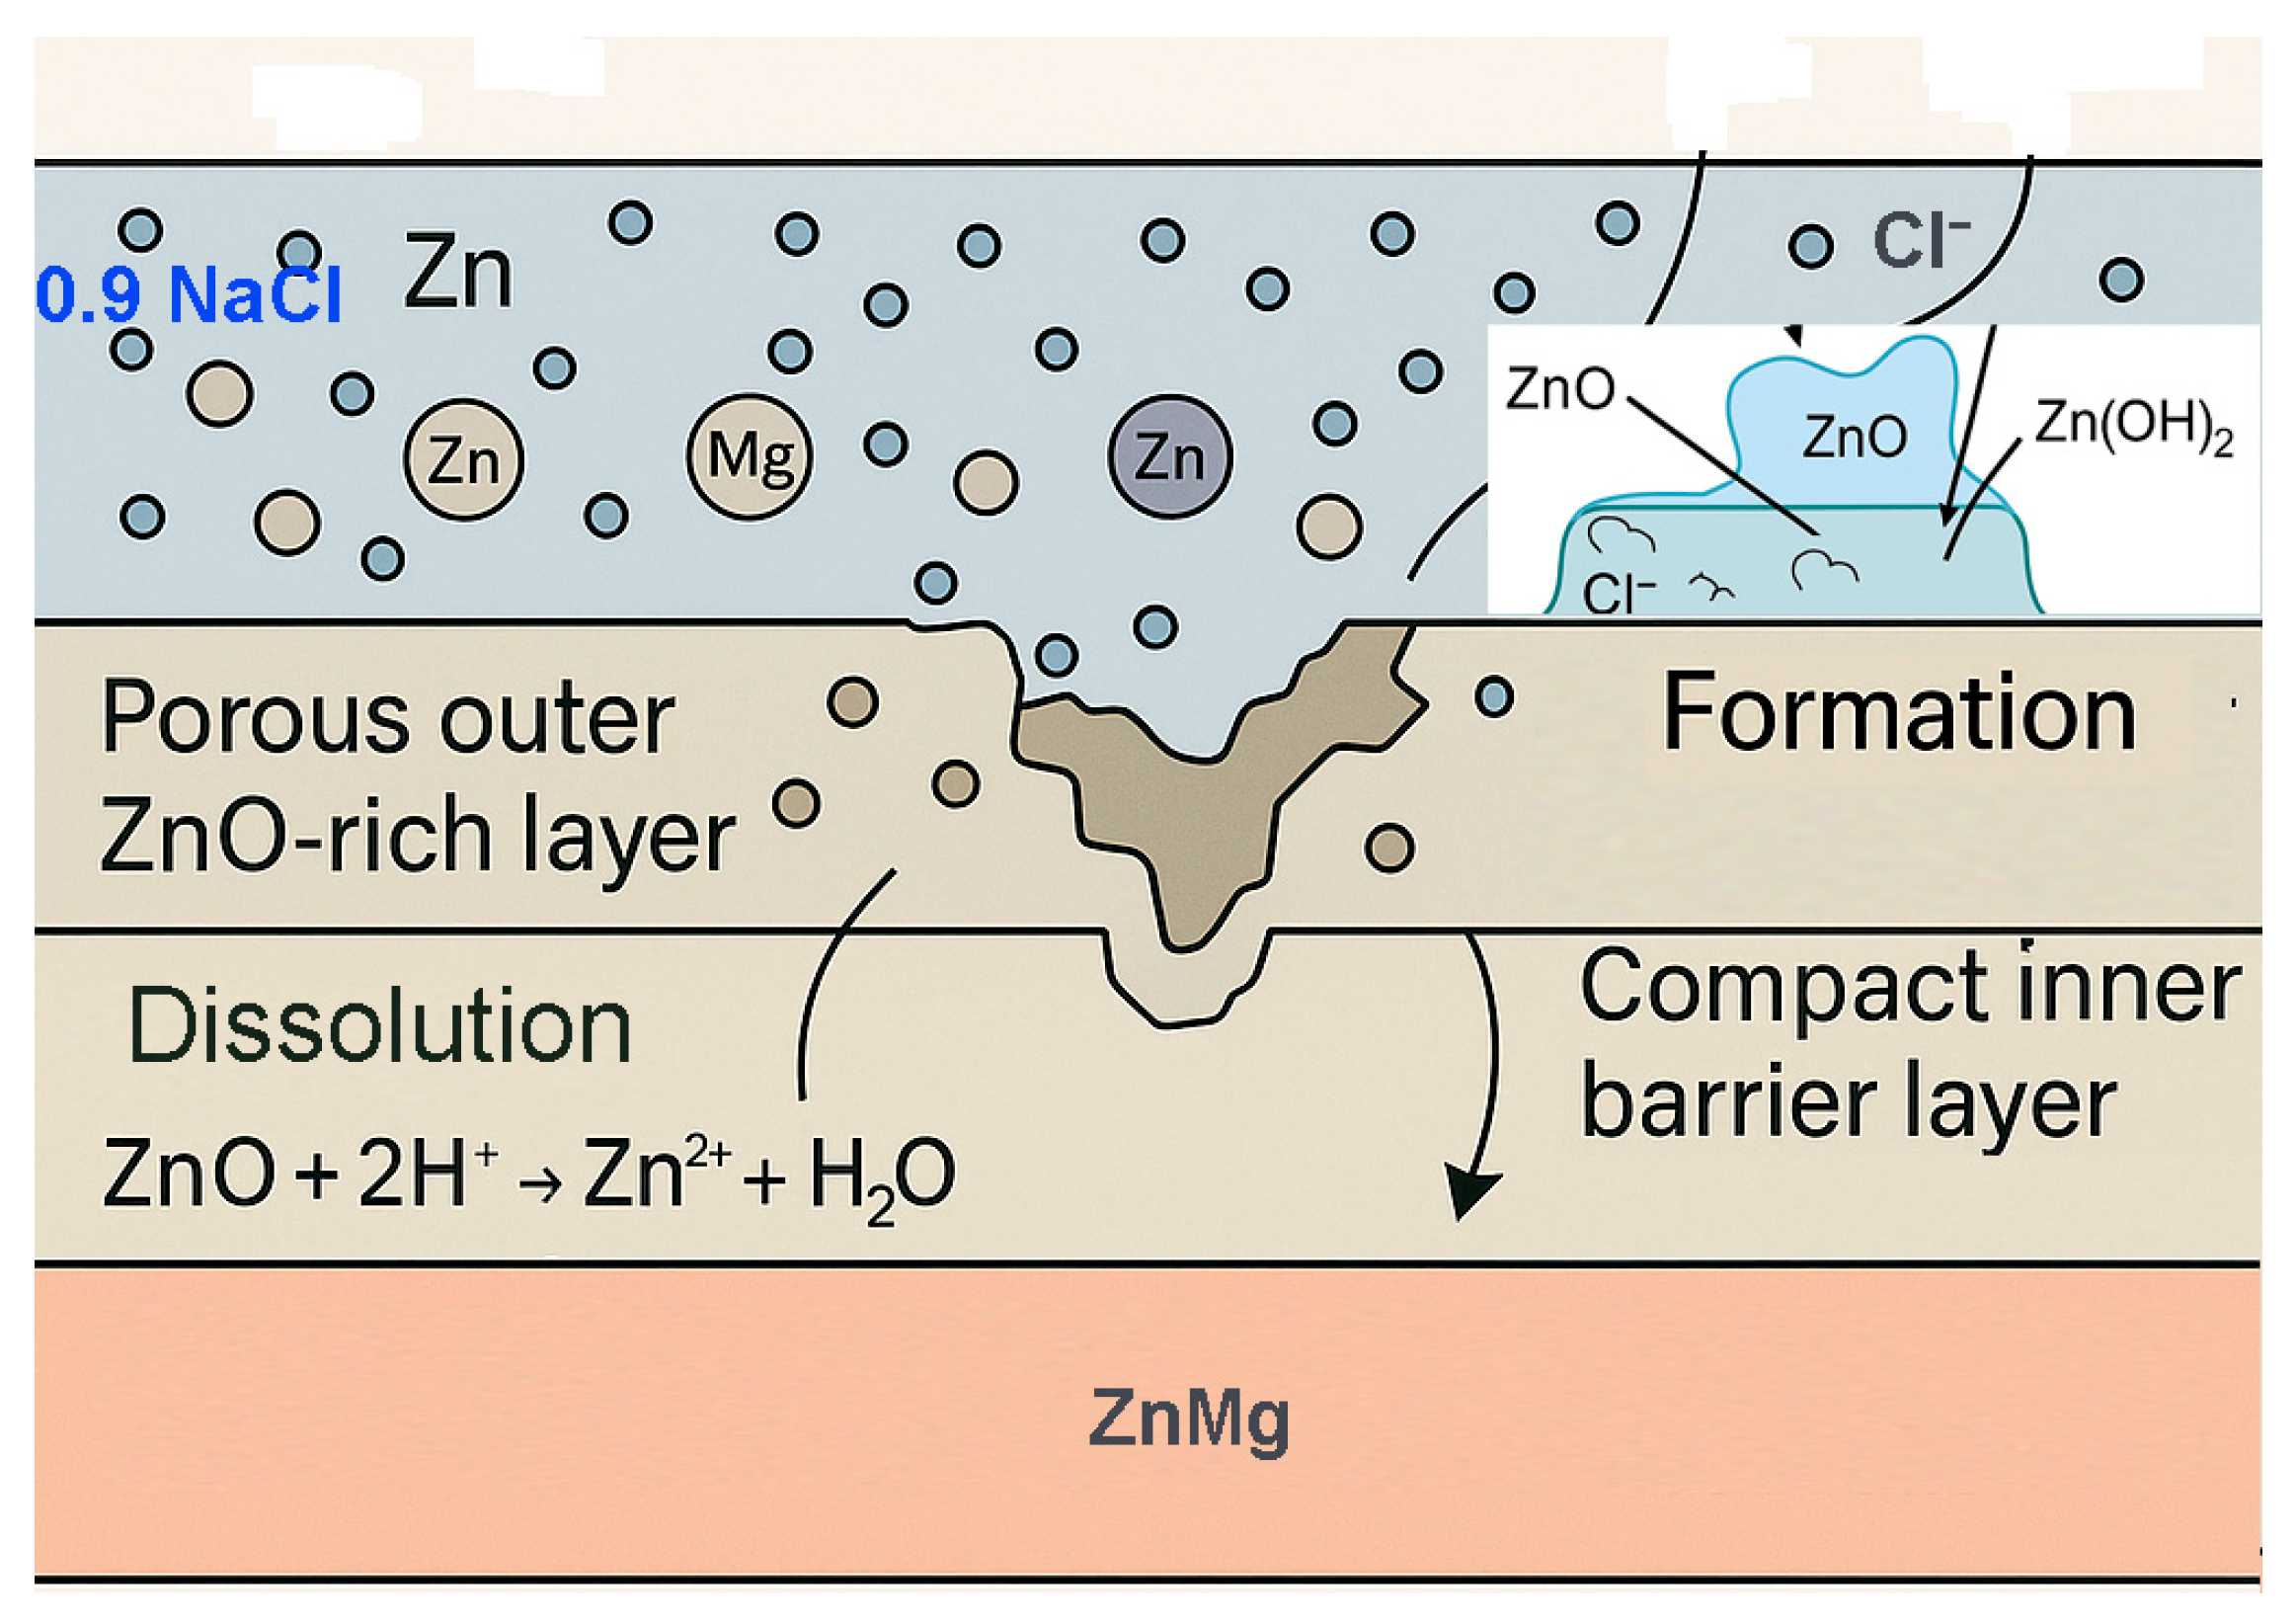
The main steps of the 0.9% NaCl saline corrosion model of oxidised layers are as follows:
The penetration of Cl− ions through the pores of the PEO layer (especially in defective or cracked areas);
Chemical attack on metal oxides: Cl− destabilises Zn and Mg oxides by dissolution reactions;
Dissolution of the phosphate phases, especially in ZnMg-PEO300, by replacing PO43− anions by Cl−;
Exposure of the metallic substrate ZnMg, which starts to oxidise galvanically in the presence of water and dissolved oxygen;
Corrosion products formation (hydroxides, chlorides, oxyhalogens).
