
Microstructure and Mechanical Properties of Tungsten Zircaloy-4 Diffusion Welding Interface

 , ,
, ,
Abstract
1. Introduction
2. Materials and Methods
3. Results
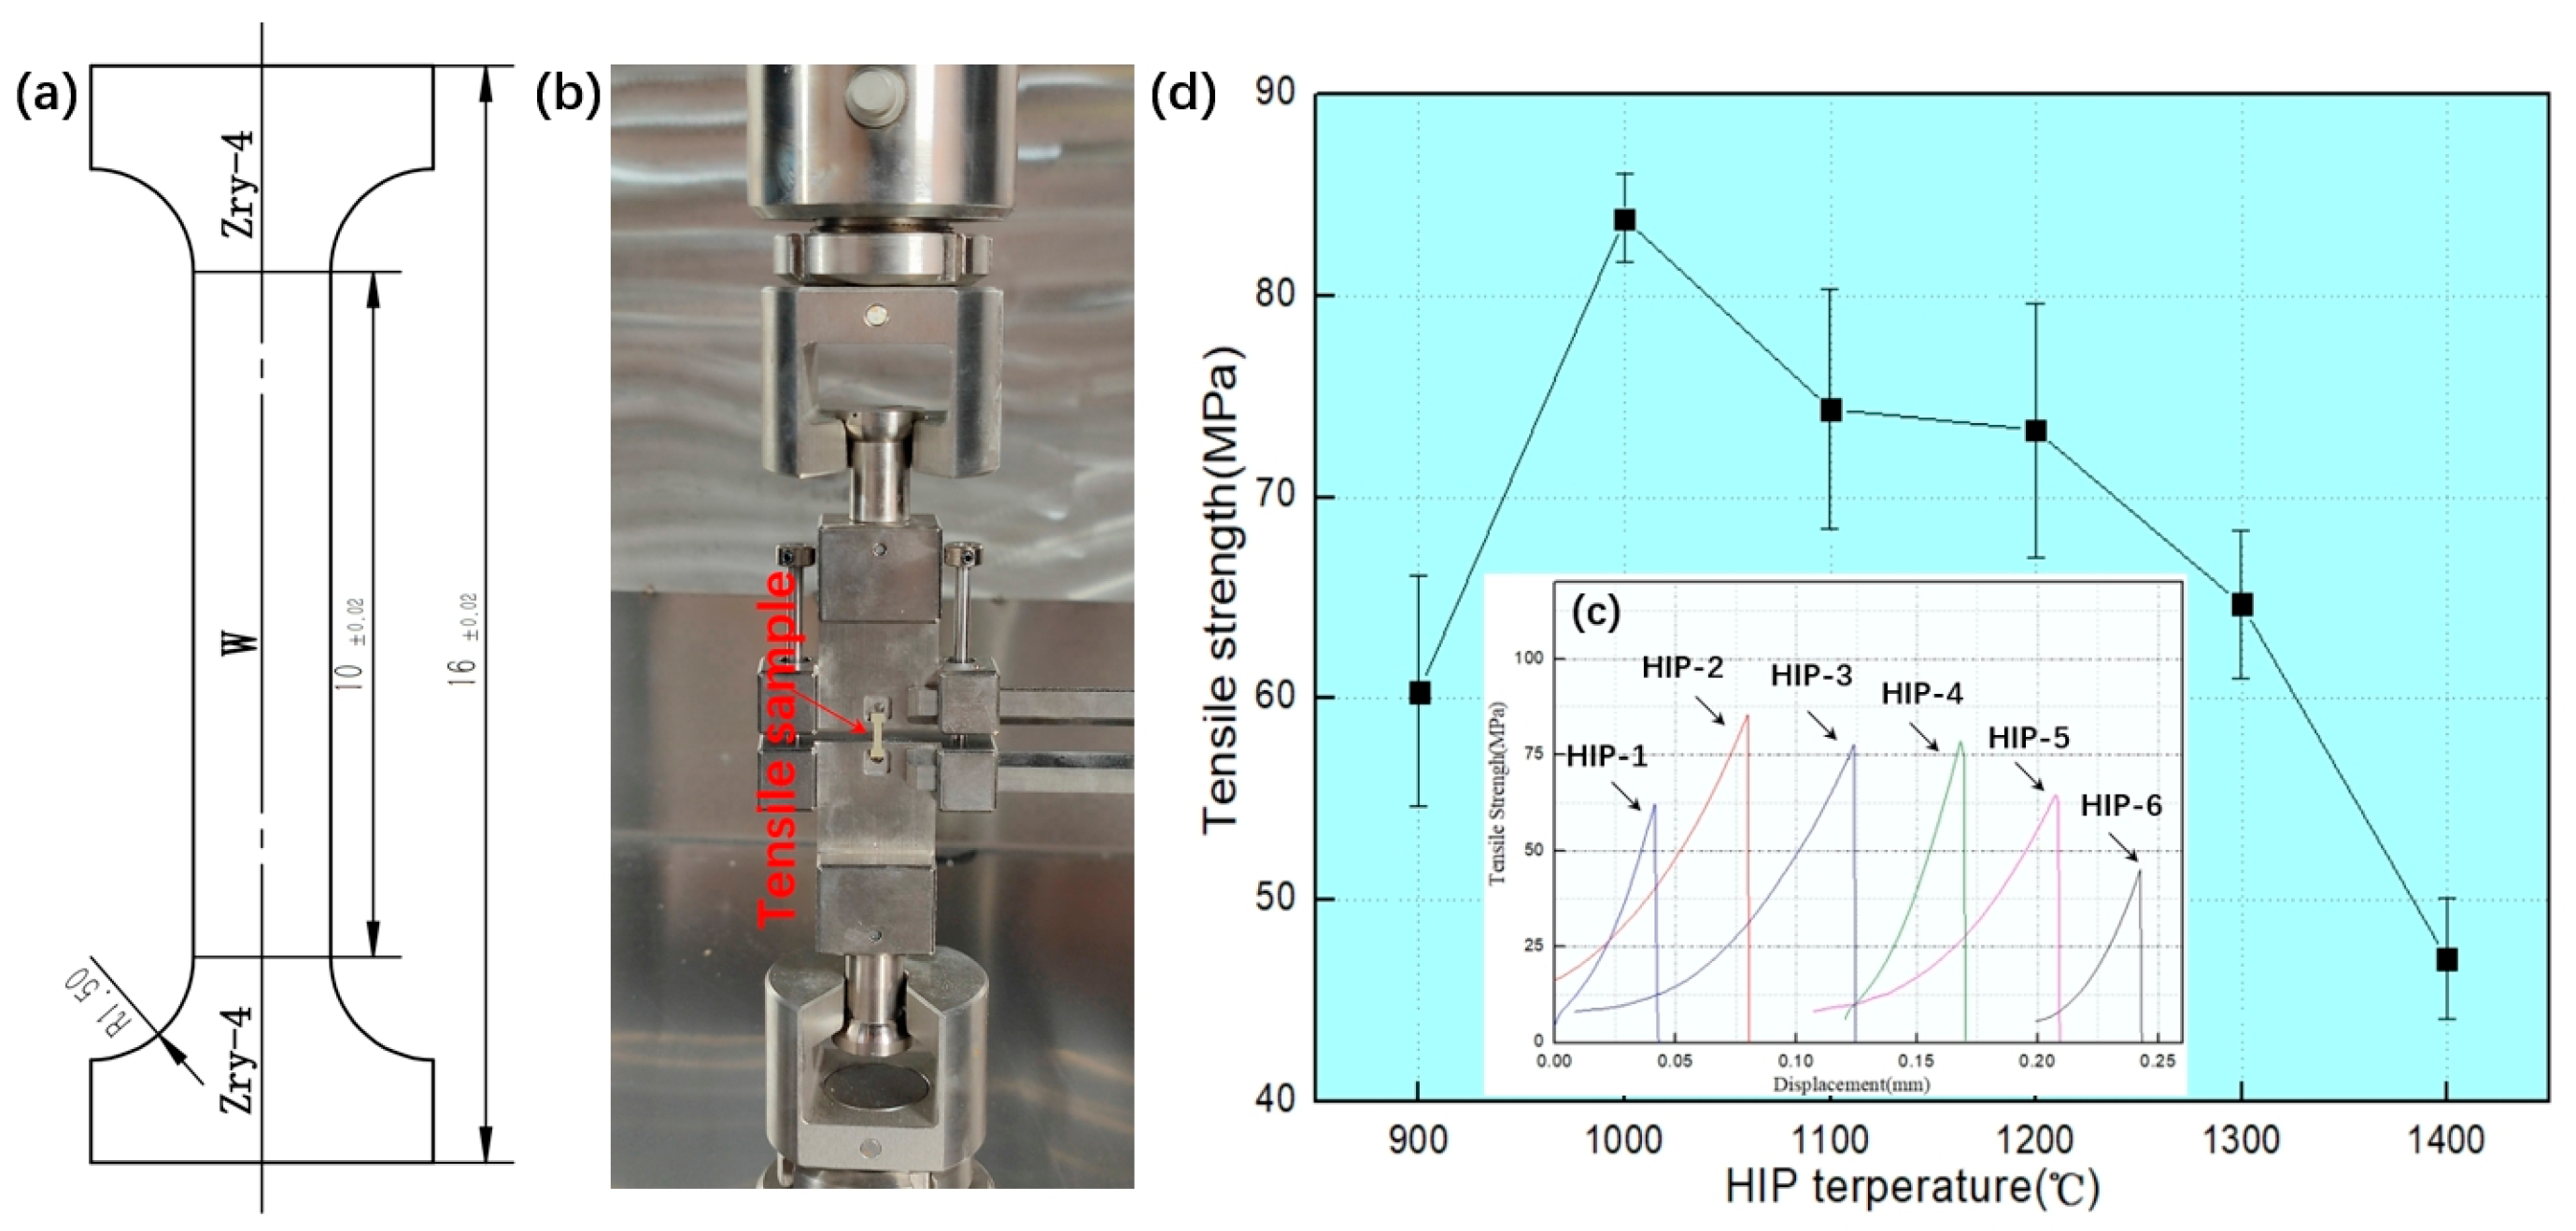
Mechanical Properties of W-Zr Alloy Interface
4. Discussion
5. Conclusions
- (1)
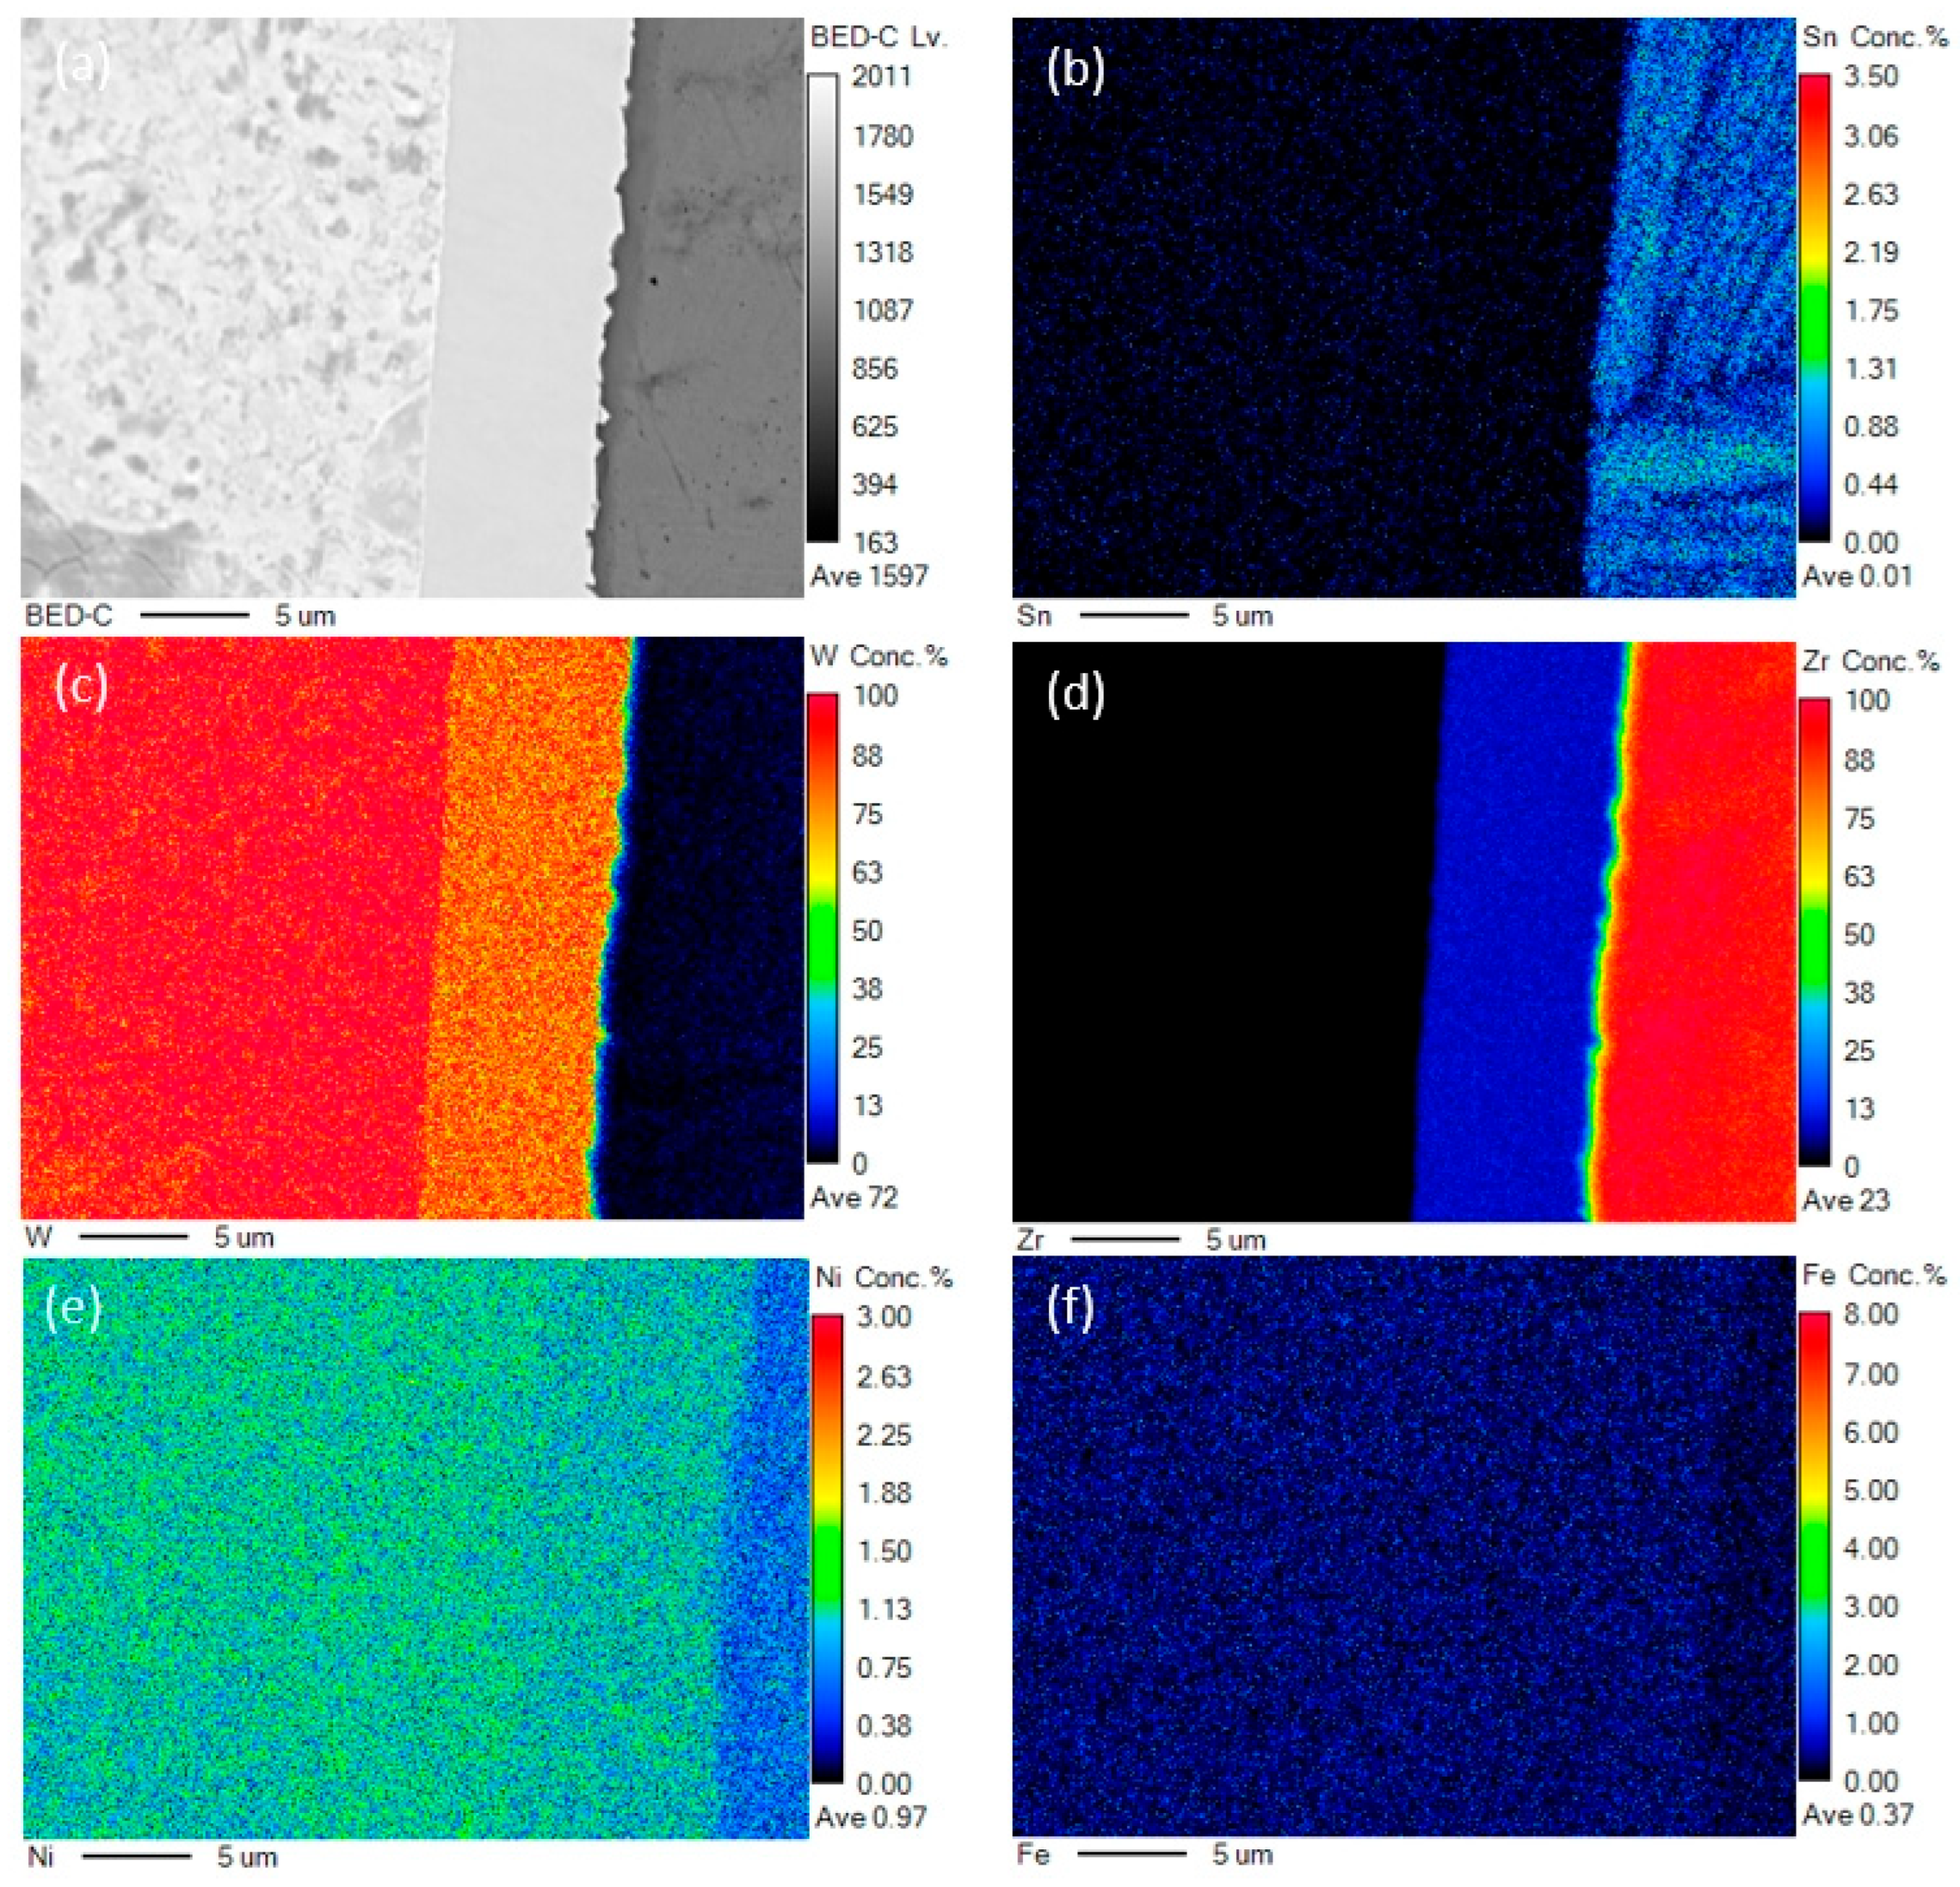
- Within the 900 °C to 1400 °C diffusion welding temperature range, W and Zr joints develop metallurgical bonding with a distinct interfacial layer. The intermediate layer thickness increases from 0.28 μm to 10.74 μm with a rising HIP temperature.
- (2)
- ZrW2 intermetallic phase was formed at the W/Zry-4 interface after HIP diffusion welding.
- (3)
- The ZrW2 intermediate layer exhibits a hardness of 17.96 GPa, which is significantly higher than that of base materials Zry-4 and W.
- (4)
- The W-Zr interfacial bonding strength demonstrates a non-monotonic temperature dependence: (i) it increases initially with temperature, (ii) peaks at 83.9 MPa at 1000 °C HIP temperature, and (iii) subsequently decreases at higher temperatures.
Author Contributions
Funding
Institutional Review Board Statement
Informed Consent Statement
Data Availability Statement
Conflicts of Interest
References
- Thomason, J. The ISIS Spallation Neutron and Muon Source—The first thirty-three years. Nucl. Instrum. Methods Phys. Res. Sect. A Accel. Spectrometers Detect. Assoc. Equip. 2019, 917, 61–67. [Google Scholar] [CrossRef]
- Gabriel, T.; Haines, J.R.; McManamy, T.J. Overview of the Spallation Neutron Source (SNS) with emphasis on target systems. J. Nucl. Mater. 2003, 318, 1–13. [Google Scholar] [CrossRef]
- Futakawa, M.; Haga, K.; Wakui, T.; Kogawa, H.; Naoe, T. Development of the Hg target in the J-PARC neutron source. Nucl. Instrum. Methods Phys. Res. Sect. A Accel. Spectrometers Detect. Assoc. Equip. 2009, 600, 18–21. [Google Scholar] [CrossRef]
- Chen, H.; Wang, X.-L. China’s first pulsed neutron source. Nat. Mater. 2016, 15, 689–691. [Google Scholar] [CrossRef]
- Liu, L.; Yu, Q.; Wang, Z.; Ell, J.; Huang, M.X.; Ritchie, R.O. Making ultrastrong steel tough by grain-boundary delamination. Science 2020, 368, 1347–1352. [Google Scholar] [CrossRef]
- Cuypers, M.G.; Mason, S.A.; Mossou, E.; Haertlein, M.; Forsyth, V.T.; Mitchell, E.P. Macromolecular structure phasing by neutron anomalous diffraction. Sci. Rep. 2016, 6, 31487. [Google Scholar] [CrossRef]
- Yang, Y.; Wang, Z.; Du, C.; Wang, B.; Li, X.; Wu, S.; Li, X.; Zhang, X.; Wang, X.; Niu, Y.; et al. Decoupling the air sensitivity of Na-layered oxides. Science 2024, 385, 744–752. [Google Scholar] [CrossRef]
- Zhou, Y.; Zhang, J.; Wang, L.; Cui, X.; Liu, X.; Wong, S.S.; An, H.; Yan, N.; Xie, J.; Yu, C.; et al. Self-assembled iron-containing mordenite monolith for carbon dioxide sieving. Science 2021, 373, 315–320. [Google Scholar] [CrossRef] [PubMed]
- Mansur, L.; Haines, J. Status of the Spallation Neutron Source with focus on target materials. J. Nucl. Mater. 2006, 356, 1–15. [Google Scholar] [CrossRef]
- Bauer, G. Physics and technology of spallation neutron sources. Nucl. Instrum. Methods Phys. Res. Sect. A Accel. Spectrometers Detect. Assoc. Equip. 2001, 463, 505–543. [Google Scholar] [CrossRef]
- Ghiglino, A.; Terrón, S.; Thomsen, K.; Wolters, J.; Magán, M.; Martínez, F.; de Vicente, P.; Vivanco, R.; Sordo, F.; Butzek, M.; et al. A neutron production target for ESS based upon the Canned-rods concept. Nucl. Instrum. Methods Phys. Res. Sect. A Accel. Spectrometers Detect. Assoc. Equip. 2014, 756, 73–81. [Google Scholar] [CrossRef]
- Kawai, M.; Furusaka, M.; Kikuchi, K.; Kurishita, H.; Watanabe, R.; Li, J.-F.; Sugimoto, K.; Yamamura, T.; Hiraoka, Y.; Abe, K.; et al. R&D of A MW-class solid-target for a spallation neutron source. J. Nucl. Mater. 2003, 318, 38–55. [Google Scholar] [CrossRef]
- Wagner, W.; Dai, Y.; Glasbrenner, H.; Grosse, M.; Lehmann, E. Status of SINQ, the only MW spallation neutron source—Highlighting target development and industrial applications. Nucl. Instrum. Methods Phys. Res. Sect. A Accel. Spectrometers Detect. Assoc. Equip. 2006, 562, 541–547. [Google Scholar] [CrossRef]
- Medarde, M.; Moormann, R.; Frison, R.; Puźniak, R.J.; Pomjakushina, E.; Conder, K.; Platacis, E.; Dai, Y.; Kiselev, D.; Zanini, L.; et al. Lead–gold eutectic: An alternative liquid target material candidate for high power spallation neutron sources. J. Nucl. Mater. 2011, 411, 72–82. [Google Scholar] [CrossRef]
- McManamy, T.; Crabtree, A.; Lousteau, D.; DeVore, J.; Jacobs, L.; Rennich, M. Overview of the SNS target system testing and initial beam operation experience. J. Nucl. Mater. 2008, 377, 1–11. [Google Scholar] [CrossRef]
- Jiang, Y.; Yang, J.; Xie, Z.; Fang, Q. Enhanced Erosion–Corrosion Resistance of Tungsten by Carburizing Using Spark Plasma Sintering Technique. Materials 2020, 13, 2719. [Google Scholar] [CrossRef]
- Wilcox, D.; Loveridge, P.; Davenne, T.; Jones, L.; Jenkins, D. Stress levels and failure modes of tantalum-clad tungsten targets at ISIS. J. Nucl. Mater. 2018, 506, 76–82. [Google Scholar] [CrossRef]
- Wei, S.; Wang, B.; Song, P.; Yin, W.; Zhang, R.; Liang, T. Microstructure and strength of the Ta cladded W targets prepared by electron beam welding followed by hot isostatic pressure. Int. J. Refract. Met. Hard Mater. 2023, 116, 106341. [Google Scholar] [CrossRef]
- Lee, Y. Proton beam power limits for stationary water-cooled tungsten target with different cladding materials. In Proceedings of the 15th International Particle Accelerator Conference, Nashvile, TN, USA, 19–24 May 2024. [Google Scholar] [CrossRef]
- Solans, V.; Sjöstrand, H.; Grape, S.; Branger, E.; Sjöland, A. Prediction of decay heat using non-destructive assay. Nucl. Instrum. Methods Phys. Res. Sect. A Accel. Spectrometers Detect. Assoc. Equip. 2024, 1070, 170003. [Google Scholar] [CrossRef]
- Bali, Z.; Mayer, G. Investigation of decay heat removal systems in the ALLEGRO helium-cooled fast reactor. Nucl. Eng. Des. 2025, 435, 113952. [Google Scholar] [CrossRef]
- Allen, T.R.; Konings, R.J.M.; Motta, A.T.; Couet, A. Corrosion of Zirconium Alloys. In Comprehensive Nuclear Materials; Elsevier: Amsterdam, The Netherlands, 2020; pp. 64–95. [Google Scholar] [CrossRef]
- Motta, A.T.; Couet, A.; Comstock, R.J. Corrosion of Zirconium Alloys Used for Nuclear Fuel Cladding. Annu. Rev. Mater. Res. 2015, 45, 311–343. [Google Scholar] [CrossRef]
- García-León, R.; Martínez-Trinidad, J.; Zepeda-Bautista, R.; Campos-Silva, I.; Guevara-Morales, A.; Martínez-Londoño, J.; Barbosa-Saldaña, J. Dry sliding wear test on borided AISI 316L stainless steel under ball-on-flat configuration: A statistical analysis. Tribol. Int. 2021, 157, 106885. [Google Scholar] [CrossRef]
- Cho, D.; Ghassemi-Armaki, H.; Stoughton, T.B.; Carlson, B.E.; Sung, H.-M.; Hwang, J.; Legarth, B.N.; Yoon, J.W. Fracture mechanisms of Al-steel resistance spot welds: The role of intermetallic compound phases. Eng. Fract. Mech. 2024, 311, 110520. [Google Scholar] [CrossRef]
- Morales, M.; Rezayat, M.; Fargas, G.; Mateo, A. Mitigating the corrosion of AISI 301LN steel in molten carbonate salts by doping with alumina nanoparticles for thermal energy storage applications. Sol. Energy Mater. Sol. Cells 2024, 270, 112805. [Google Scholar] [CrossRef]
- Li, W.; Dong, H.; Zhang, B.; Zou, S.; Mu, W.; Cai, Y. The influence of adjustable ring-mode laser on the formation of intermetallic compounds and mechanical properties of ultra-thin Al-Cu lap welded joints. J. Mech. Work. Technol. 2024, 332, 118537. [Google Scholar] [CrossRef]
- Wei, S.; Li, Y.; Zhang, R.; Chen, H.; Liang, T.; Yin, W. Microstructure and mechanical properties of Zr-W and Zr-Ta-W interface fabricated by hot isostatic pressing diffusion welding. J. Nucl. Mater. 2025, 606, 155627. [Google Scholar] [CrossRef]
- Wagner, C. The evaluation of data obtained with diffusion couples of binary single-phase and multiphase systems. Acta Met. 1969, 17, 99–107. [Google Scholar] [CrossRef]
- Wang, J.; Fang, L.; Li, X.; Liu, F.; He, X.; Xu, G.; Zhou, Y.; Tao, X.; Ouyang, Y.; Du, Y. Interdiffusion behaviors and mechanical properties of Zr-X (X Nb, Ta, Hf) binary systems. J. Alloy. Compd. 2022, 910, 164910. [Google Scholar] [CrossRef]
- Puente, A.P.Y.; Dickson, J.; Keiser, D.; Sohn, Y. Investigation of interdiffusion behavior in the Mo–Zr binary system via diffusion couple studies. Int. J. Refract. Met. Hard Mater. 2014, 43, 317–321. [Google Scholar] [CrossRef]
- Wang, K.; Liu, X.; Liu, T.; He, C.; Liu, J. Interdiffusion in Zr-Mo/W Intermetallics. Appl. Sci. 2023, 13, 6375. [Google Scholar] [CrossRef]
- Suzuki, A.; Mishin, Y. Atomic mechanisms of grain boundary diffusion: Low versus high temperatures. J. Mater. Sci. 2005, 40, 3155–3161. [Google Scholar] [CrossRef]
- Mishin, Y.; Herzig, C.; Bernardini, J.; Gust, W. Grain boundary diffusion: Fundamentals to recent developments. Int. Mater. Rev. 1997, 42, 155–178. [Google Scholar] [CrossRef]
- Balluffi, R.W. Grain Boundary Diffusion Mechanisms in Metals; Springer: Berlin/Heidelberg, Germany, 1982; pp. 527–553. [Google Scholar]
- Prussin, S. Generation and Distribution of Dislocations by Solute Diffusion. J. Appl. Phys. 1961, 32, 1876–1881. [Google Scholar] [CrossRef]
- Larcht’E, F.; Cahn, J. The effect of self-stress on diffusion in solids. Acta Met. 1982, 30, 1835–1845. [Google Scholar] [CrossRef]


| Samples ID | HIP Parameters | ||
|---|---|---|---|
| Temperature | Holding Time | Pressure | |
| HIP-1 | 900 °C | 2 h | 100 MPa |
| HIP-2 | 1000 °C | 2 h | 100 MPa |
| HIP-3 | 1100 °C | 2 h | 100 MPa |
| HIP-4 | 1200 °C | 2 h | 100 MPa |
| HIP-5 | 1300 °C | 2 h | 100 MPa |
| HIP-6 | 1400 °C | 2 h | 100 MPa |
| Specimens ID | HIP Temperature (°C) | Intermediate Layer Thickness (μm) |
|---|---|---|
| HIP-1 | 900 °C | 0.28 |
| HIP-2 | 1000 °C | 0.78 |
| HIP-3 | 1100 °C | 1.90 |
| HIP-4 | 1200 °C | 3.72 |
| HIP-5 | 1300 °C | 6.90 |
| HIP-6 | 1400 °C | 10.74 |
| Specimens ID | T (°C) | ) | |
|---|---|---|---|
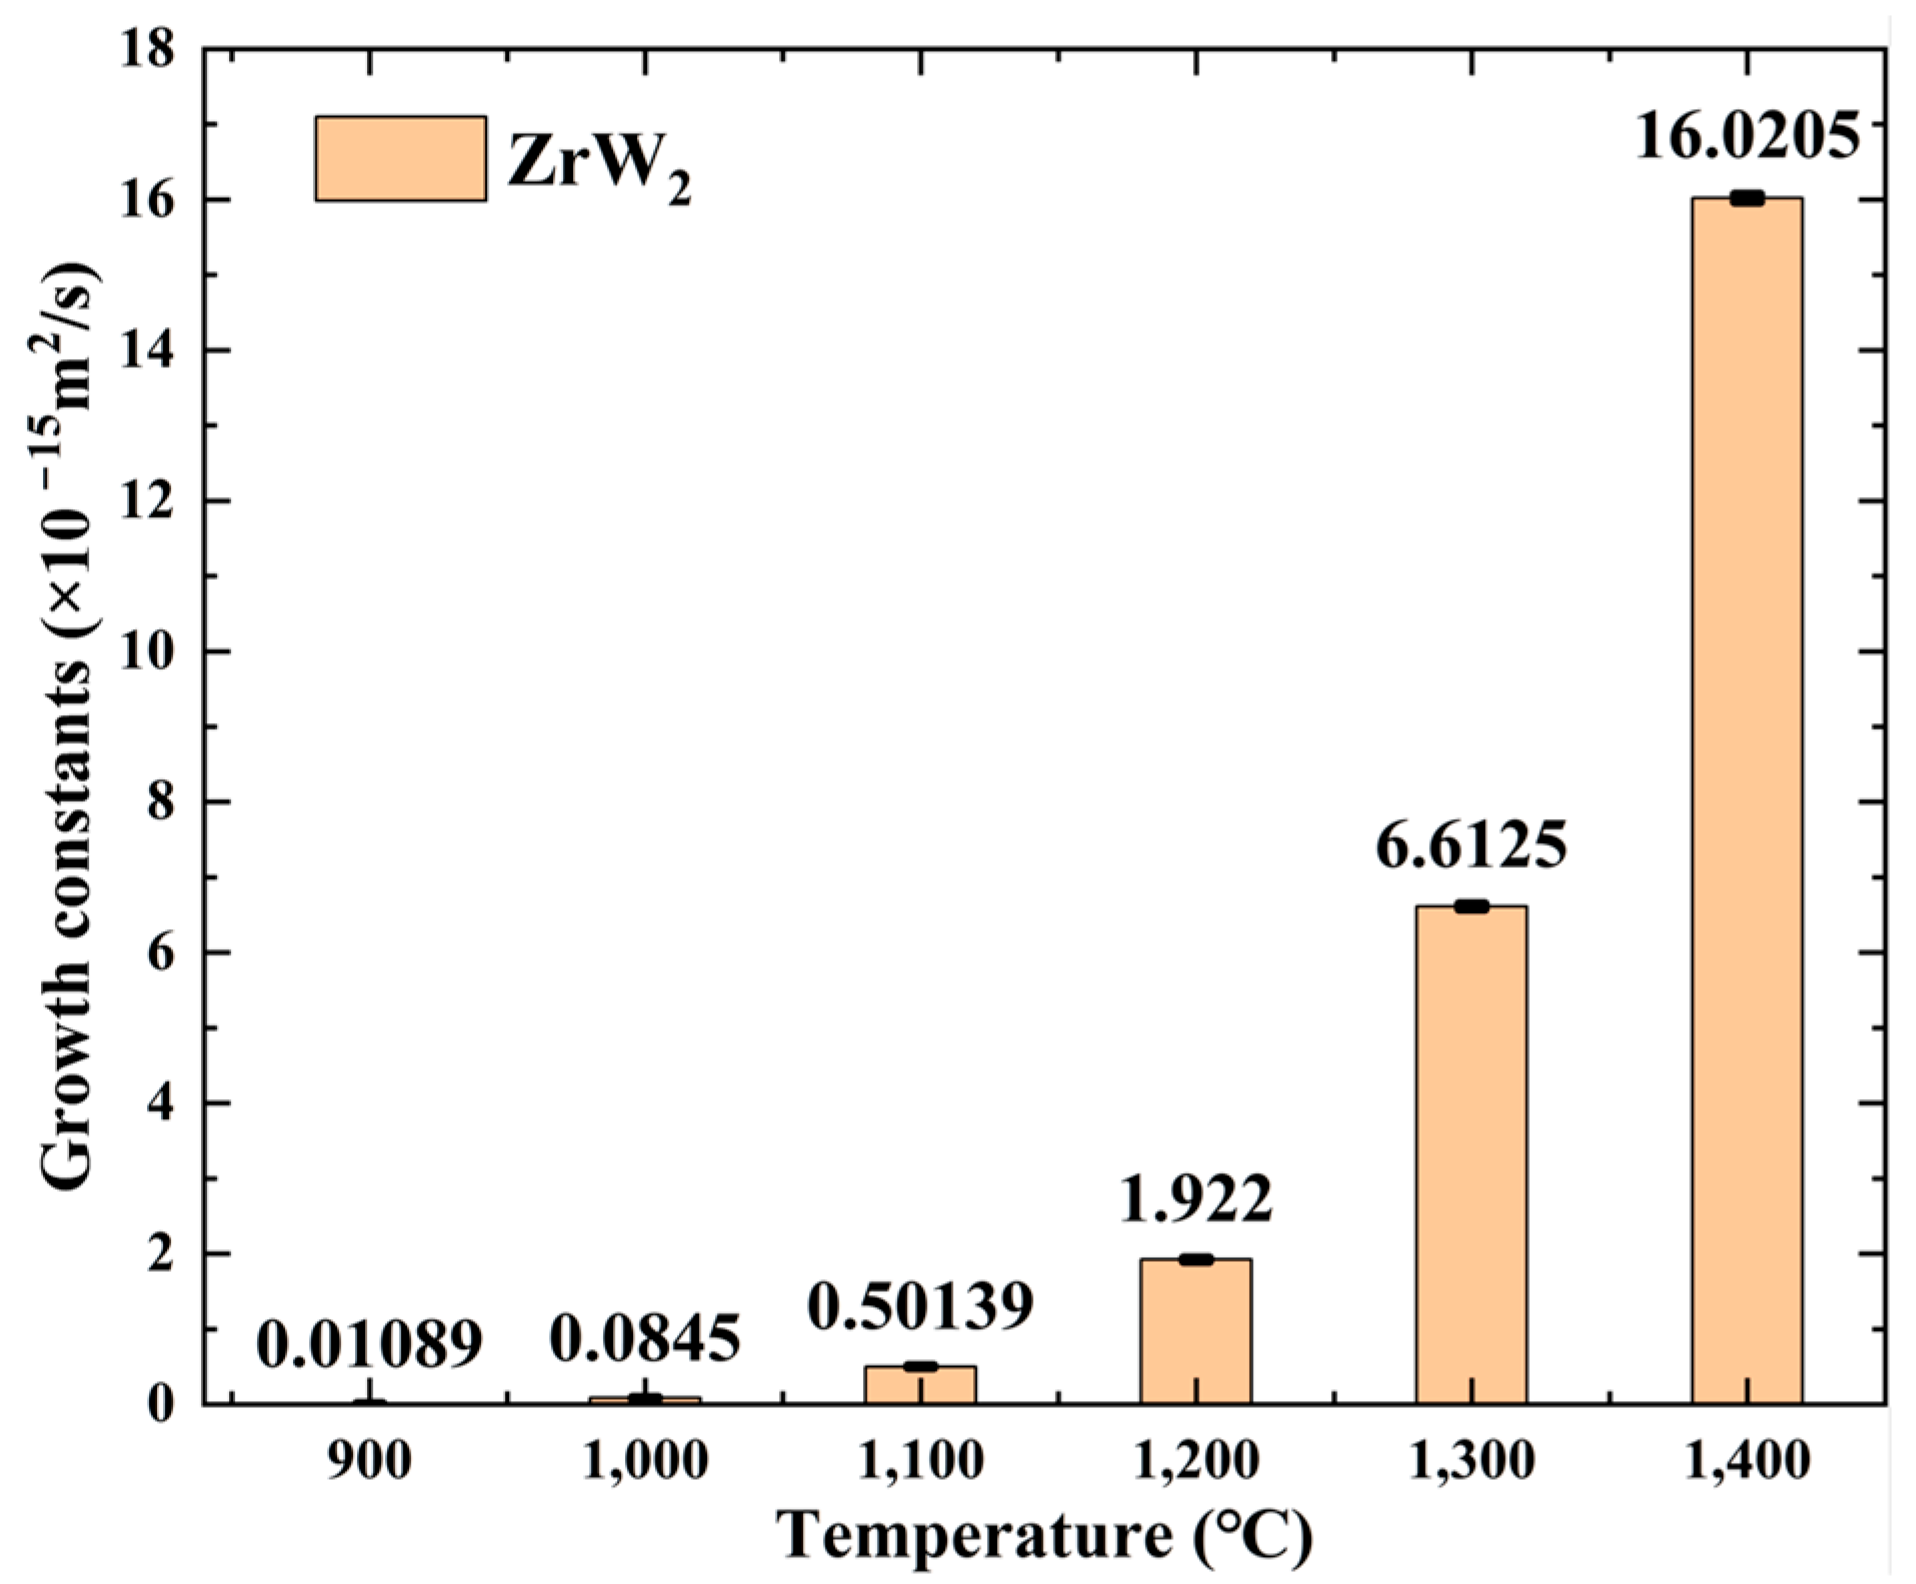
| HIP-1 | 900 | 0.28 | 0.01089 |
| HIP-2 | 1000 | 0.84 | 0.0845 |
| HIP-3 | 1100 | 1.90 | 0.50139 |
| HIP-4 | 1200 | 3.75 | 1.922 |
| HIP-5 | 1300 | 6.75 | 6.6125 |
| HIP-6 | 1400 | 10.75 | 16.0205 |
| (This work) | |||
| (This work) | 285 [32] | ||
Disclaimer/Publisher’s Note: The statements, opinions and data contained in all publications are solely those of the individual author(s) and contributor(s) and not of MDPI and/or the editor(s). MDPI and/or the editor(s) disclaim responsibility for any injury to people or property resulting from any ideas, methods, instructions or products referred to in the content. |
© 2025 by the authors. Licensee MDPI, Basel, Switzerland. This article is an open access article distributed under the terms and conditions of the Creative Commons Attribution (CC BY) license (https://creativecommons.org/licenses/by/4.0/).
Share and Cite
Wei, S.; Li, Y.; Zhang, R.; Wang, B.; Liang, T.; Yin, W. Microstructure and Mechanical Properties of Tungsten Zircaloy-4 Diffusion Welding Interface. Materials 2025, 18, 2823. https://doi.org/10.3390/ma18122823
Wei S, Li Y, Zhang R, Wang B, Liang T, Yin W. Microstructure and Mechanical Properties of Tungsten Zircaloy-4 Diffusion Welding Interface. Materials. 2025; 18(12):2823. https://doi.org/10.3390/ma18122823
Chicago/Turabian StyleWei, Shaohong, Yan Li, Ruiqiang Zhang, Bingfeng Wang, Tianjiao Liang, and Wen Yin. 2025. "Microstructure and Mechanical Properties of Tungsten Zircaloy-4 Diffusion Welding Interface" Materials 18, no. 12: 2823. https://doi.org/10.3390/ma18122823
APA StyleWei, S., Li, Y., Zhang, R., Wang, B., Liang, T., & Yin, W. (2025). Microstructure and Mechanical Properties of Tungsten Zircaloy-4 Diffusion Welding Interface. Materials, 18(12), 2823. https://doi.org/10.3390/ma18122823