Article

The Influence of Thermal Parameters on the Self-Nucleation Behavior of Polyphenylene Sulfide (PPS) during Secondary Thermoforming

1
State Key Laboratory for Modification of Chemical Fibers and Polymer Materials, Shanghai Collaborative Innovation Center of High-Performance Fibers and Composites (Province-Ministry Joint), Key Laboratory of High-Performance Fibers & Products, Ministry of Education, Center for Civil Aviation Composites, Donghua University, Shanghai 201620, China
2
Key Laboratory of Shanghai City for Lightweight Composites, College of Materials Science and Engineering, Donghua University, Shanghai 201620, China
3
School of Chemistry and Chemical Engineering, Frontiers Science Center for Transformative Molecules, Shanghai Jiao Tong University, Shanghai 201306, China
*
Authors to whom correspondence should be addressed.
Materials 2024, 17(4), 890; https://doi.org/10.3390/ma17040890
Submission received: 11 January 2024 / Revised: 4 February 2024 / Accepted: 7 February 2024 / Published: 15 February 2024
(This article belongs to the Special Issue Advanced Manufacturing Technologies of Thermoplastic Composites)

Abstract

:

Highlights

  • The influence of temperature parameters in two thermal cycles on the self-nucleation (SN) behavior was revealed.
  • The heating rate and processing melt temperature during the first thermal cycle exhibited a synergistic effect on the SN behavior.
  • Under appropriate conditions, both the first and second thermal cycles can generate SN behavior, but the mechanisms were different.

Abstract

During the secondary thermoforming of carbon fiber-reinforced polyphenylene sulfide (CF/PPS) composites, a vital material for the aerospace field, varied thermal parameters profoundly influence the crystallization behavior of the PPS matrix. Notably, PPS exhibits a distinctive self-nucleation (SN) behavior during repeated thermal cycles. This behavior not only affects its crystallization but also impacts the processing and mechanical properties of PPS and CF/PPS composites. In this article, the effects of various parameters on the SN and non-isothermal crystallization behavior of PPS during two thermal cycles were systematically investigated by differential scanning calorimetry. It was found that the SN behavior was not affected by the cooling rate in the second thermal cycle. Furthermore, the lamellar annealing resulting from the heating process in both thermal cycles affected the temperature range for forming the special SN domain, because of the refined lamellar structure, and expelled various defects. Finally, this study indicated that to control the strong melt memory effect in the first thermal cycle, both the heating rate and processing melt temperature need to be controlled simultaneously. This work reveals that through collaborative control of these parameters, the crystalline morphology, crystallization temperature and crystallization rate in two thermal cycles are controlled. Furthermore, it presents a new perspective for controlling the crystallization behavior of the thermoplastic composite matrix during the secondary thermoforming process.

Graphical Abstract

1. Introduction

Advanced thermoplastic composites have garnered extensive attention due to their noteworthy attributes including lightweight, high strength, excellent toughness, elevated damage tolerance, and recyclability [1,2]. Carbon fiber-reinforced polyphenylene sulfide (CF/PPS) composites, as a vital material for the aerospace field, exhibit a compelling cost-performance ratio, especially when compared to poly(ether-ether ketone) (CF/PEEK) composites, despite marginal disparities in mechanical performance. Utilizing the characteristics of PPS that can be melted and cooled repeatedly, innovative manufacturing approaches such as stamping forming [3,4,5], in situ consolidation [6,7,8], and induction welding [9,10,11] have been devised. These secondary thermoforming methods enable rapid fabrication of CF/PPS composites, consequently reducing production cycles and minimizing manufacturing costs.
The thermal history of CF/PPS composites in the secondary thermoforming is complicated, involving multiple melting and cooling processes. PPS, as the matrix of thermoplastic composites, is a semi-crystalline polymer. The crystallization behavior of PPS is significantly influenced by these processes. Although the crystallization and melting behaviors [12,13,14,15] of PPS have been extensively investigated, most of studies only focused on a single melt-cooling cycle for PPS [16,17,18,19,20], ignoring the potential influence of multiple thermal cycles on the crystallization behavior of PPS. Self-nucleation (SN) is a distinctive nucleation mechanism observed in semi-crystalline polymers under specific conditions of repeated thermal cycling. The generation of SN is due to the residual crystalline fragments or locally ordered region in the melt [21]. The SN behavior in crystallization process manifests as promoted polymer crystallization behavior without the addition of external heterogeneous surfaces, such as nucleating agents [22], resulting in an increase in crystallization temperature during non-isothermal crystallization processes [23,24]. Therefore, it is important to pay attention to the effect of multiple thermal cycles on PPS crystallization.
It is noteworthy that PPS exhibits a strong melt memory effect [16,25,26]. Even when melted at 40 °C above its melting point, the crystallization process still shows SN behavior. Furthermore, within the processing melt temperature range of 292–323 °C, the SN behavior of PPS remains unchanged with temperature variations [26]. A similar melt memory effect is observed in many copolymers [27,28,29,30,31,32] and some homopolymers [33,34,35,36,37,38]. They all demonstrate SN behaviors a few to several tens of degrees above their melting point. This pronounced melt memory effect could be attributed to either a unique molecular chain topology [29,39,40] or potent intermolecular interactions [41].
PPS has a distinct structure, with alternating phenyl rings and sulfur atoms, leading to numerous sulfur bonds in its molecular chain. Consequently, PPS displays considerable instability at elevated temperatures. Potential thermal degradation actions, like chain scission [42,43], branching [44] and crosslinking [45,46], can change the molecular chain structure and conformation in the PPS melt, leading to its pronounced melt memory effect and unique SN behavior. Therefore, it is crucial to understanding the effects of thermal parameters in multiple thermal cycle on the SN behavior of PPS, and discern how to influence the molecular chain conformation to control the SN behavior. Such insights can guide the selection of thermal protocols in specific manufacturing processes.
In this study, the crystallization and remelting behaviors of PPS across two thermal cycles were systematically investigated. Employing the DSC technique, the relationship between the various thermal parameters in two thermal cycles and the SN behaviors of PPS were explored. Notably, through a comprehensive analysis involving crystallization temperature, processing melt temperature and crystalline morphology, the significant impact of lamellae annealing on the SN behavior of PPS was illuminated. The synergistic relationship between heating rates and processing melt temperature in affecting the crystallization behavior of PPS was highlighted. Overall, this work will not only provide new insights into the SN behavior of PPS, but also provide a theoretical basis for the controllable processing of PPS and CF/PPS composites.

2. Materials and Methods

2.1. Materials

The material studied in this work is a commercial PPS film obtained from Zhejiang NHU Co., Ltd. (Shaoxing, China). It has a weight-average molecular weight (Mw) of 48,200 g/mol, and a polydispersity index (PDI) of 4.03. The specified glass transition temperature is 87 °C and the melting point is 284.6 °C.

2.2. Characterizations

2.2.1. Differential Scanning Calorimetry
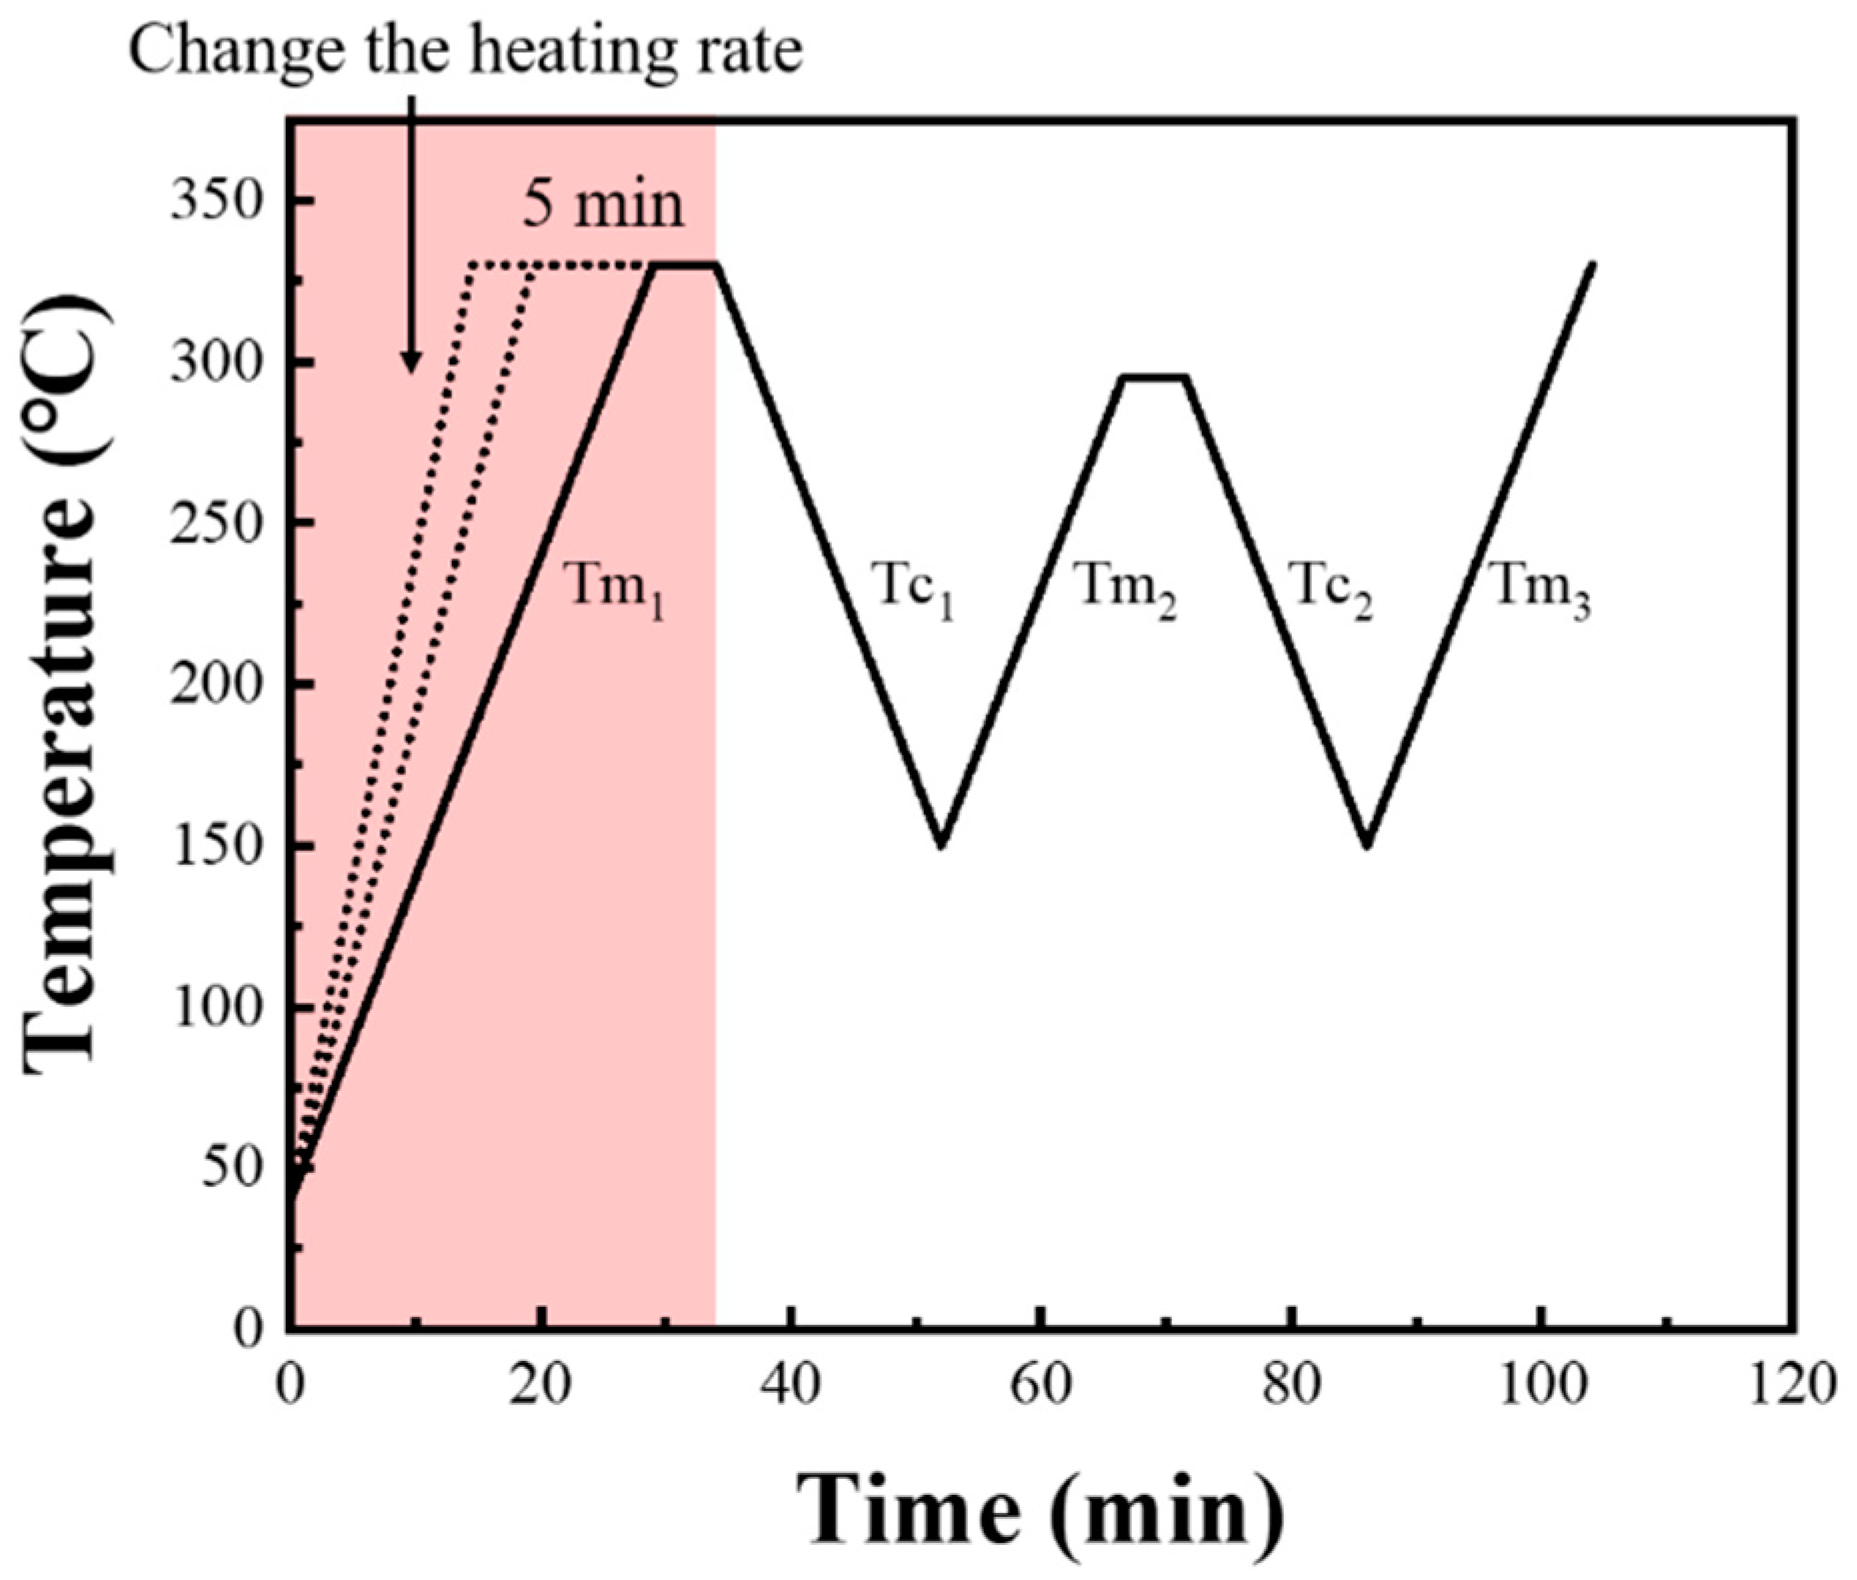
The melting and crystallization behaviors were performed using a TA Instruments Q20 (TA instrument, New Castle, DE, USA) under a nitrogen atmosphere (50 mL/min). The instrument was calibrated before each set of scans with high-purity indium or tin. Samples (6.0 ± 0.5 mg) were sealed in aluminum pans.
The primary objective of this study is to investigate the influence of various thermal cycle parameters on the SN behavior and the crystallization behavior of PPS during two thermal cycles. These parameters include the heating rate (Hr1) and processing melt temperature (Ts1) during the first thermal cycle, as well as the heating rate (Hr2), melting temperature (Ts), and cooling rate (Cr1) during the second thermal cycle. This section provides a brief overview of the thermal protocol corresponding to PPS undergoing melt-cooling. The detailed thermal protocols examining the impact of individual variables on crystallization behavior are presented in the Section 3.
The thermal protocol comprises two thermal cycles, and a reheating step for analyzing the PPS crystal structure, as shown in Figure 1.
For the first thermal cycle:
(a)
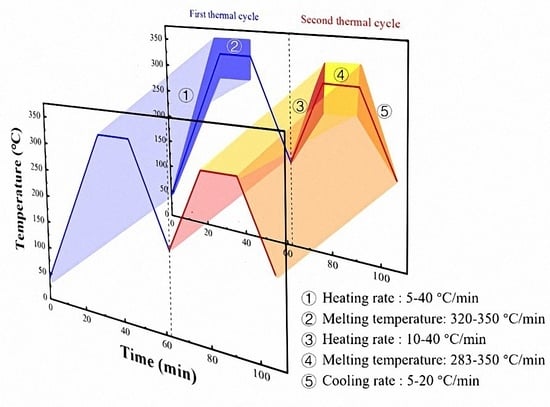
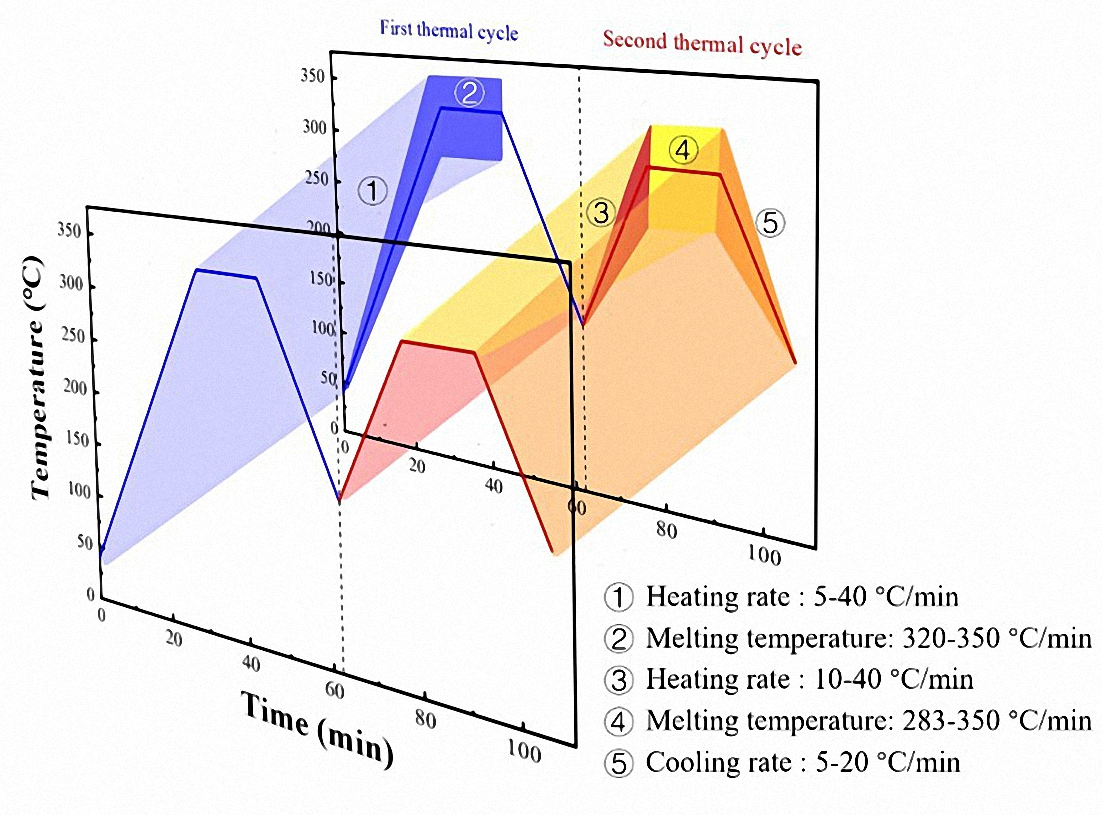
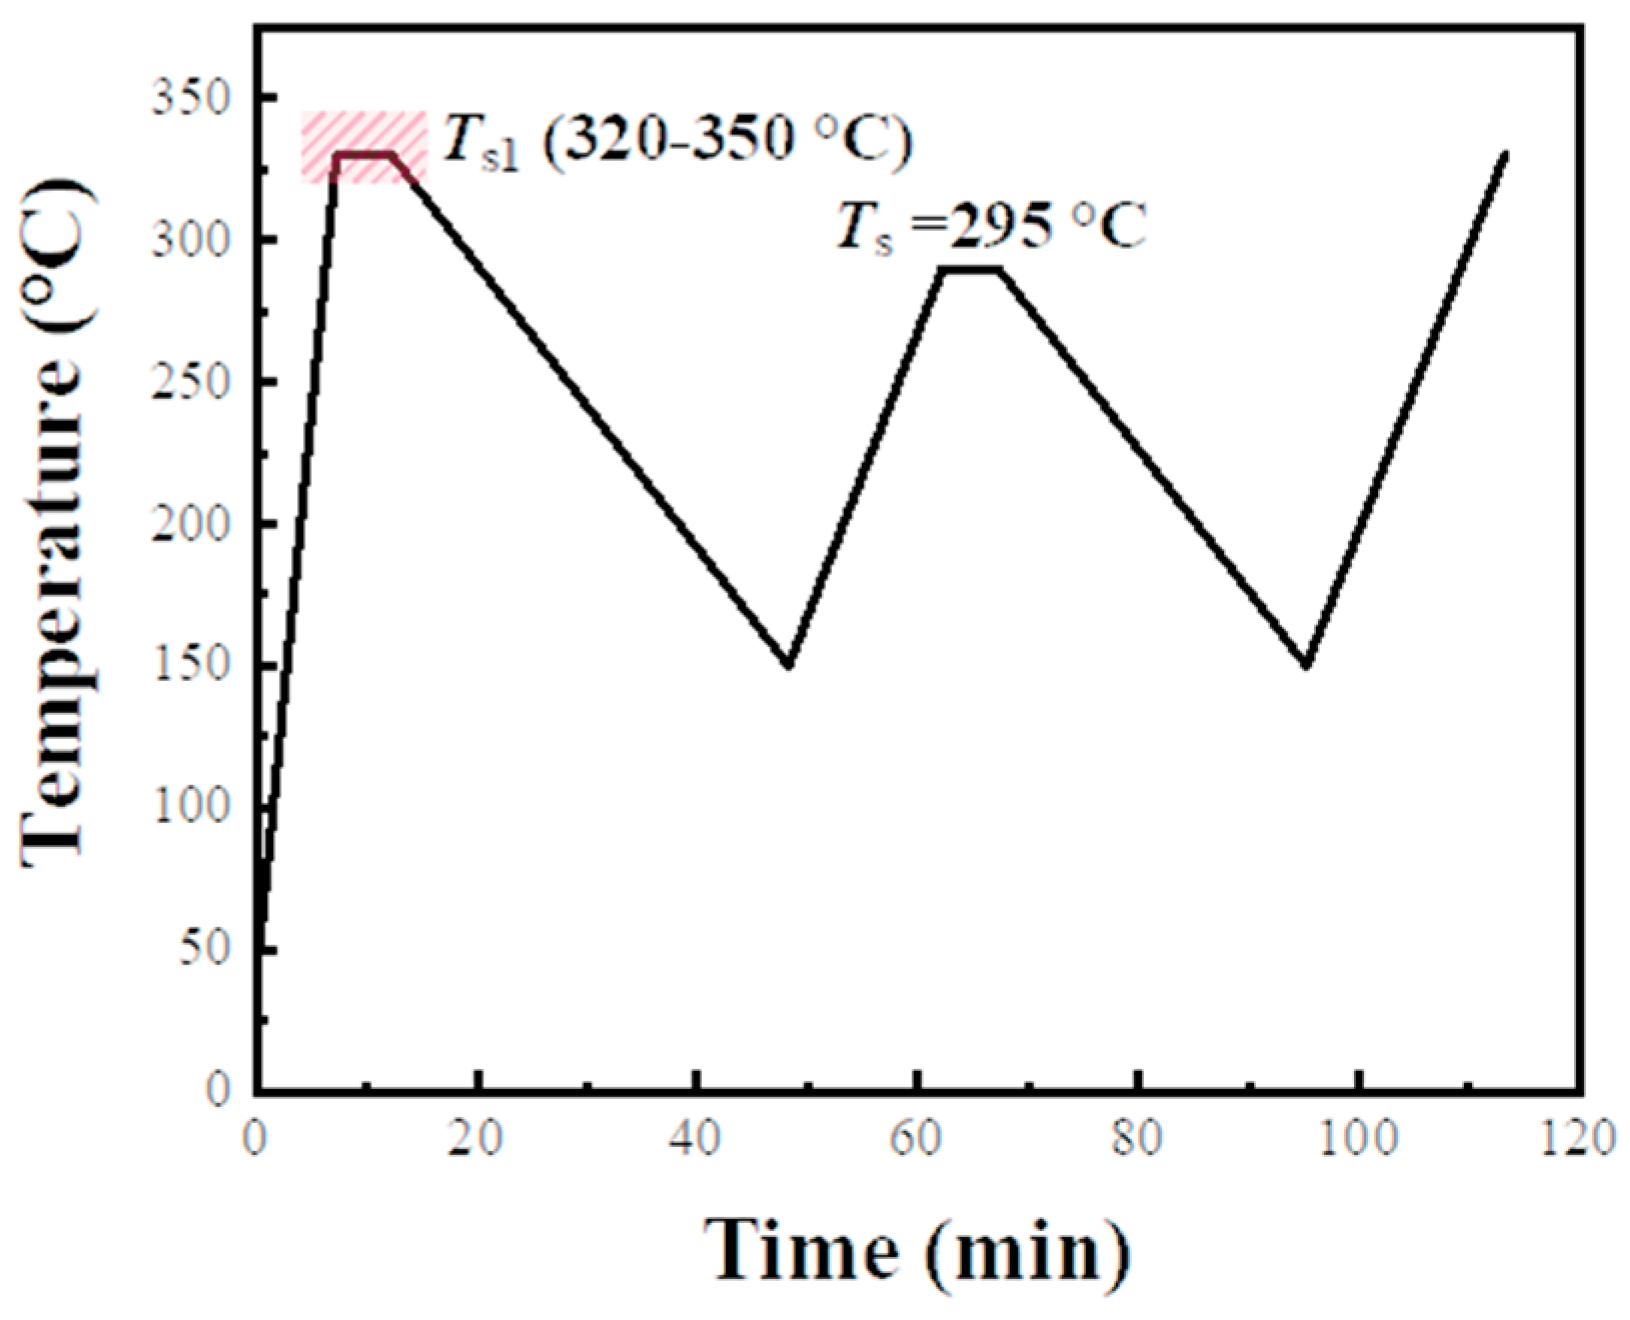
Due to the broad melting range of PPS, the melting peak occurs between 250 °C and 290 °C. To ensure melting completely and eliminated any thermal history effects during the first melting process, the sample was heated to the initial processing melt temperature (Ts1) at a specified heating rate (Hr1), and held for 5 min. Incomplete melting due to a too-low Ts1 would impact the consistency of the PPS melt during the first thermal cycle, ultimately affecting the investigation of PPS crystallization behavior.
(b)
The sample was then cooled to 150 °C at a designated cooling rate, completing its initial crystallization.
For the second thermal cycle:
(c)
The crystallized sample was subsequently reheated to the processing melt temperature (Ts) at a specified heating rate (Hr2), and held for 5 min. Different Ts led to distinct molecular chain conformations in PPS, subsequently resulting in varied SN behaviors and crystallization behaviors.
(d)
The sample was cooled again to 150 °C at a specified cooling rate (Cr2) for its second crystallization.
(e)
Finally, the twice-crystallized sample was heated from 150 °C to 330 °C at a rate of 10 °C/min to analyze the crystalline structure forming in the second crystallization.

2.2.2. Polarized Optical Microscopy

The crystalline morphology of PPS during crystallization was observed by Olympus BX-53 optical microscopes (Olympus Corporation, Shinjuku-ku, Japan) operating in reflection mode equipped with a Linkam THMS 600 hot stage (Linkam Scientific Instruments Ltd., Tadworth, UK). Images were taken with a Motic CCD camera, and for analysis of crystallization on cooling, NIH ImageJ software (Version 1.46 r) was used.

3. Results and Discussion

3.1. Effect of the Cooling Rate in the Second Thermal Cycle on the SN Behavior of PPS

During the secondary thermoforming of PPS, the molecular chain conformation in the melt exhibits variations based on the processing melt temperature. Specifically, with an elevation in processing melt temperature, the conformation transitions sequentially through stages: from residual crystalline fragments to locally ordered regions of molecular chains, followed by relaxation, interdiffusion, re-entanglement, and eventually reverts to a fully disordered random coil conformation [26]. It is worth noting that, due to differences in entropy, these various conformations of molecular chains showcase different crystallization temperature upon cooling. Additionally, the cooling rate is a significant factor affecting the non-isothermal crystallization behavior of semi-crystalline polymers, profoundly influencing the nucleation and subsequent crystal growth behaviors [47,48,49,50,51,52]. Therefore, it is imperative to focus on the influence of varying cooling rates on crystallization temperature of PPS when PPS exhibits SN behaviors. The thermal protocol applied to PPS was illustrated in Figure 2a.
The SN behavior of PPS is greatly influenced by the secondary processing melt temperature. In our previous studies [26], we observed distinct SN behaviors of PPS at different secondary processing melt temperatures, which we divided into six domains, as shown in Figure 2b. Each domain represented by a different colored line on the PPS melting enthalpy curve. Domain IIb represents PPS melting within a specific temperature range, where residual crystalline fragments remain in the melt. These fragments act as self-seeds and promote the nucleation process during cooling. Domain IIa indicates PPS melting within a temperature range where crystalline fragments are absent and are replaced by locally ordered molecular chains. This configuration can promote the nucleation process in PPS. Notably, PPS has a unique region called Domain II’. Within this domain, the crystallization temperature remains constant despite the increase in processing melt temperature, and maintaining a high nucleation density. This domain forms because the molecular chains in PPS cannot interdiffuse within this temperature range due to the complex molecular chain topology of the PPS amorphous region and the strong interaction between molecular chains. PPS is in Domain IIa’ when the melting temperature is sufficient for interdiffusion of PPS molecular chains through thermal motion. In this domain, as the melting temperature continues to increase, the self-nucleation behavior of PPS gradually disappears. Based on prior research, five typical secondary processing melt temperatures (Ts) were selected for applying two thermal cycles to PPS. Each of these temperatures falls within specific ranges that can induce various SN behaviors in PPS. These temperatures are marked with red dots in Figure 2. A temperature of 285 °C corresponds to Domain IIb. For Domain II’, two temperatures were selected: 295 °C corresponds to the lower temperature of this domain, while 315 °C represents the higher temperature. A temperature of 326 °C corresponds to Domain IIa’, and 335 °C corresponds to the temperature region where the SN effect almost disappears. After melting at these varied temperatures, three different cooling rates were used to finish non-isothermal crystallization during the PPS cooling process.
As shown in Figure 2c–g, it is evident that with a constant Ts, the crystallization peak shifted to a lower temperature with an increase in cooling rate. Figure 2h illustrates a declining trend in the peak crystallization temperature (Tc) of PPS within Domain IIb as the Ts increased. When the Ts was in Domain II’, the Tc of PPS remained unaltered with variations in Ts, even if the cooling rate was different. As the Ts continued to increase, the Tc of PPS decreased again. This could be attributed to the diminishing melting memory effect, caused by the PPS molecular chains gradually reverting to a random coil conformation. Notably, although a higher cooling rate resulted in an overall decrease in crystallization temperature, the exhibited trend—a decline, followed by stabilization, and a subsequent decline—with respect to Ts variations remains consistent across different crystallization rates.
The consistency in the trend of Tc and Ts shown between different cooling rate groups in Figure 2h indicated that the molecular chain conformations associated with different SN behaviors of PPS were highly stable in the melt. This signifies that, while the cooling rate can alter the crystallization temperature, the nucleation mechanism during the crystallization process is not affected by the cooling rate. Furthermore, the constant Tc maintained in Domain II’ across different cooling rates suggested that the molecular chain conformation of PPS is consistent within this temperature range. Even if melt temperature differed by 20 °C, the molecular chains in the melt all maintain this particular metastable state. Consequently, theses conformation exhibited the same efficacy in fostering nucleation and facilitating the growth of spherulites, resulting in the same crystallization temperature within Domain II’.

3.2. Effect of the Heating Rate in the Second Thermal Cycle on the SN Behavior of PPS

As the crystals are heated, they undergo a process known as annealing. This process could further promote lamellae growth, leading to a more perfect internal crystalline structure [53,54,55]. For CF/PPS composites during secondary thermoforming, there exists a significant difference in heating rates due to diverse processing method. Such variation in heating rate might result in different annealing processes for the PPS spherulites. This can potentially lead to varying degrees of perfection in the PPS crystalline structure, ultimately influencing the SN behavior of PPS. As depicted in Figure 3, heating rates of 10 °C/min, 20 °C/min, and 40 °C/min were chosen to examine the impact of different heating rates in the second thermal cycle on the SN behavior of PPS.
From Figure 4a–a″, it can be observed that the trend in crystallization temperature (Tc) changes with Ts remained largely consistent across different secondary heating rates. Initially, as Ts increased, the crystallization peak shifted to a lower temperature. This trend sustained until a specific temperature was reached, after which the Tc plateaued, maintaining this equilibrium until approximately 320 °C. Beyond this Ts, the Tc of PPS declined once more, which then remained constant at a higher temperature. The Using a heating rate of 20 °C/min for illustration: At Ts of 283 °C, the Tc descended from 256.1 °C to 253.2 °C with increasing Ts. Subsequently, once Ts surpassed 288 °C, the Tc remained steady at 253.2 °C, persisting until 325 °C. When Ts exceeded 325 °C, the crystallization peak once again trended towards a lower temperature, ultimately stabilizing beyond 340 °C. From Figure 4b–b″, it can be noted that when Ts was 283 °C, samples with different heating rates exhibited double peaks in the remelting curves after second crystallization. This is the typical characteristic representation of Domain III. It means that at this temperature, the PPS spherulites were only partially melted, and the unmelted part was annealed.
To clearly analyze the influence of the heating rate on the SN behavior, the relationship between the Tc and the Ts under different heating rates was compiled into Figure 4c. It can be observed that the heating rate did not significantly affect the relationship between Ts and corresponding Tc. Furthermore, regardless of the heating rate, the special region (Domain II’) consistently emerged between 292 °C and 318 °C. Within this region, the Tc did not change with an increase in the Ts. This phenomenon further validated the stable existence of this region. However, it should be noted that an increase in the heating rate caused Domain II’ to shift overall to lower temperature. When the heating rate was 10 °C/min, the Ts range of domain II’ is defined between 292 °C and 323 °C, which was based on the relationship between the Ts and Tc. However, when the heating rate was 20 °C/min and 40 °C/min, respectively, this domain began at 288 °C, and the Tc no longer changed with the increase in Ts. Only when the Ts exceed 320 °C/min, the Tc decreased again with the increasing Ts.
The change in the temperature region of Domain II’ suggests that the SN behavior of PPS is indeed influenced by different heating rates in the second thermal cycle. Analyzing the Tc between groups with different heating rates reveals that despite the heating rates varied, the Tc within Domain II’ remained almost consistent. This indicates that the molecular chain conformation in the melt prior to crystallization is essentially the same, and therefore the promotion effect on post-melting crystallization is nearly identical. When PPS spherulites undergo a secondary heating process, annealing occurs and the lamellae thicken. Additionally, during the annealing process, various defects contained within the PPS crystalline regions are gradually expelled such as branched chains, impurities, and various dislocations [56]. This makes the topological structure of the amorphous molecular chains between the crystalline regions even more complex. When the heating rate is slow, the lamellar have sufficient time to anneal and become thicker. Therefore, a higher temperature is required to destroy the more perfect residual crystalline fragments and locally ordered regions. It also requires a higher temperature to break the metastable state where the molecular chains are relaxed but do not interdiffuse. Conversely, faster rates suppress the annealing process and the lamellar thickening behavior, such as 20 °C/min. This allows PPS molecular chains to reach a metastable state at a lower processing melt temperature, ultimately destroying the metastable state at a lower temperature. Furthermore, it can be inferred from Figure 4d that the SN behavior of PPS leads to a discernible rise in the peak remelting temperature of the crystals. As this SN behavior gradually diminished with increasing Ts, there was a corresponding gradual reduction in the peak remelting temperature, which eventually kept stable.

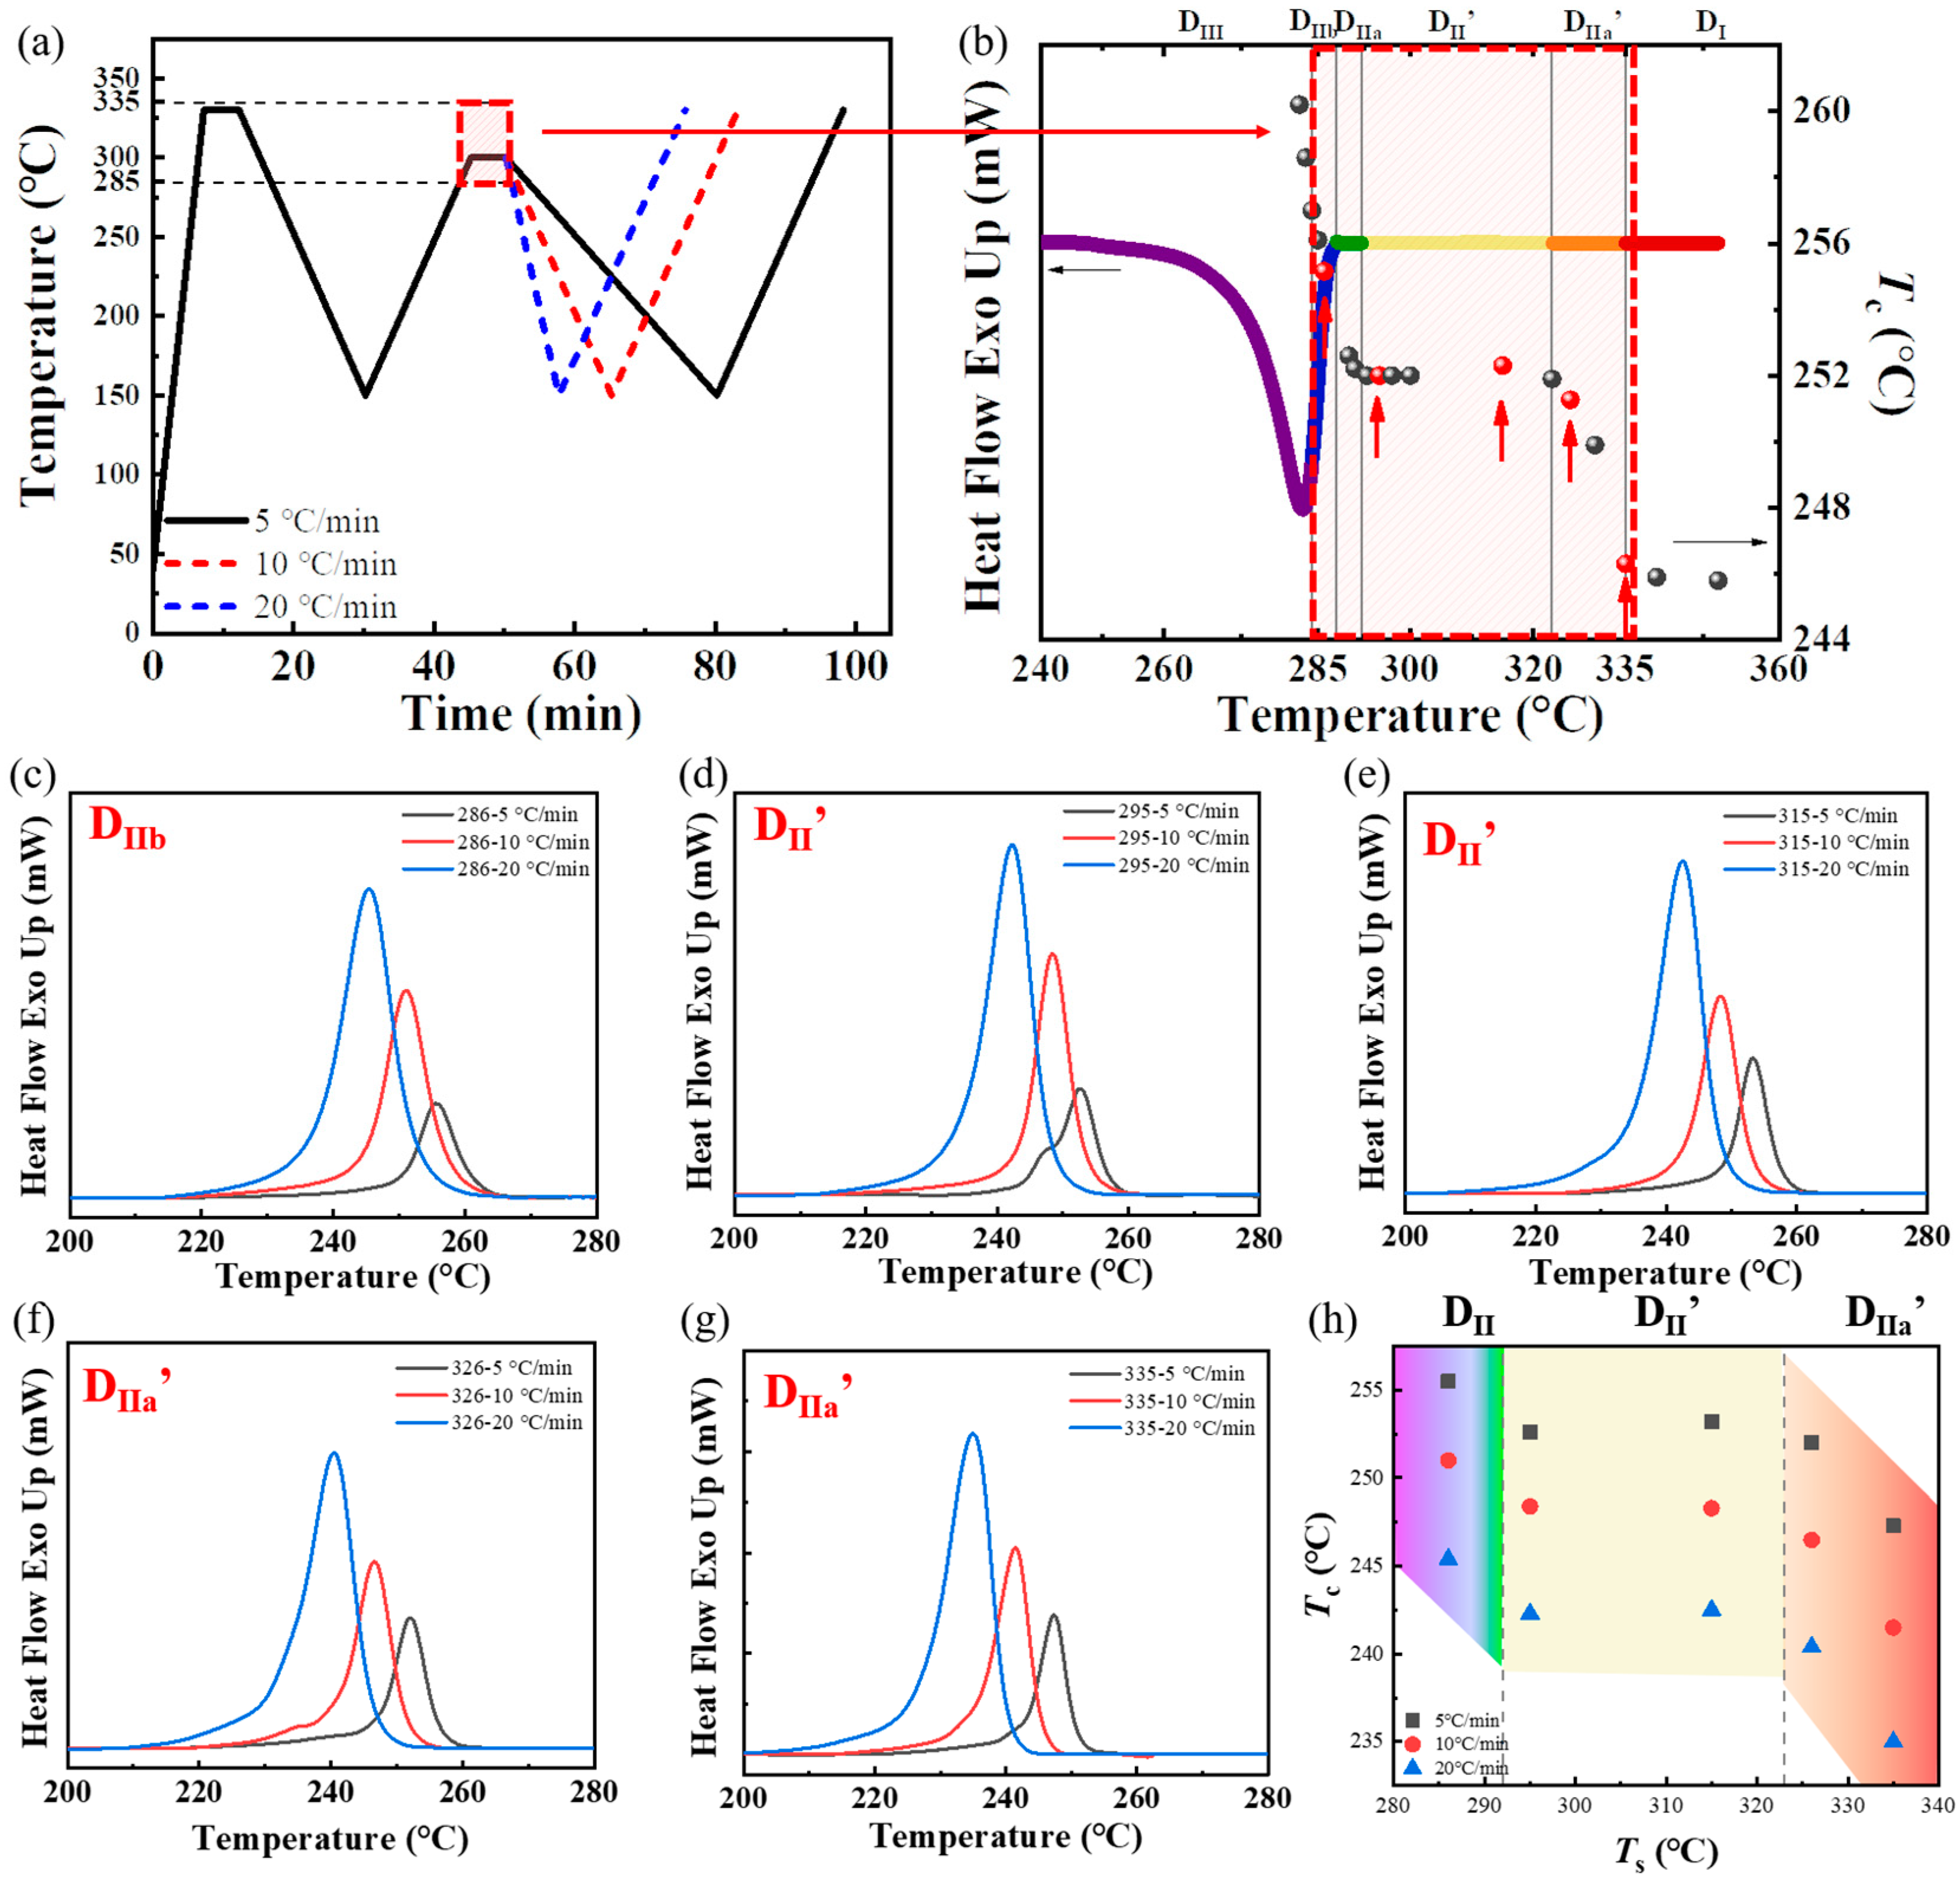
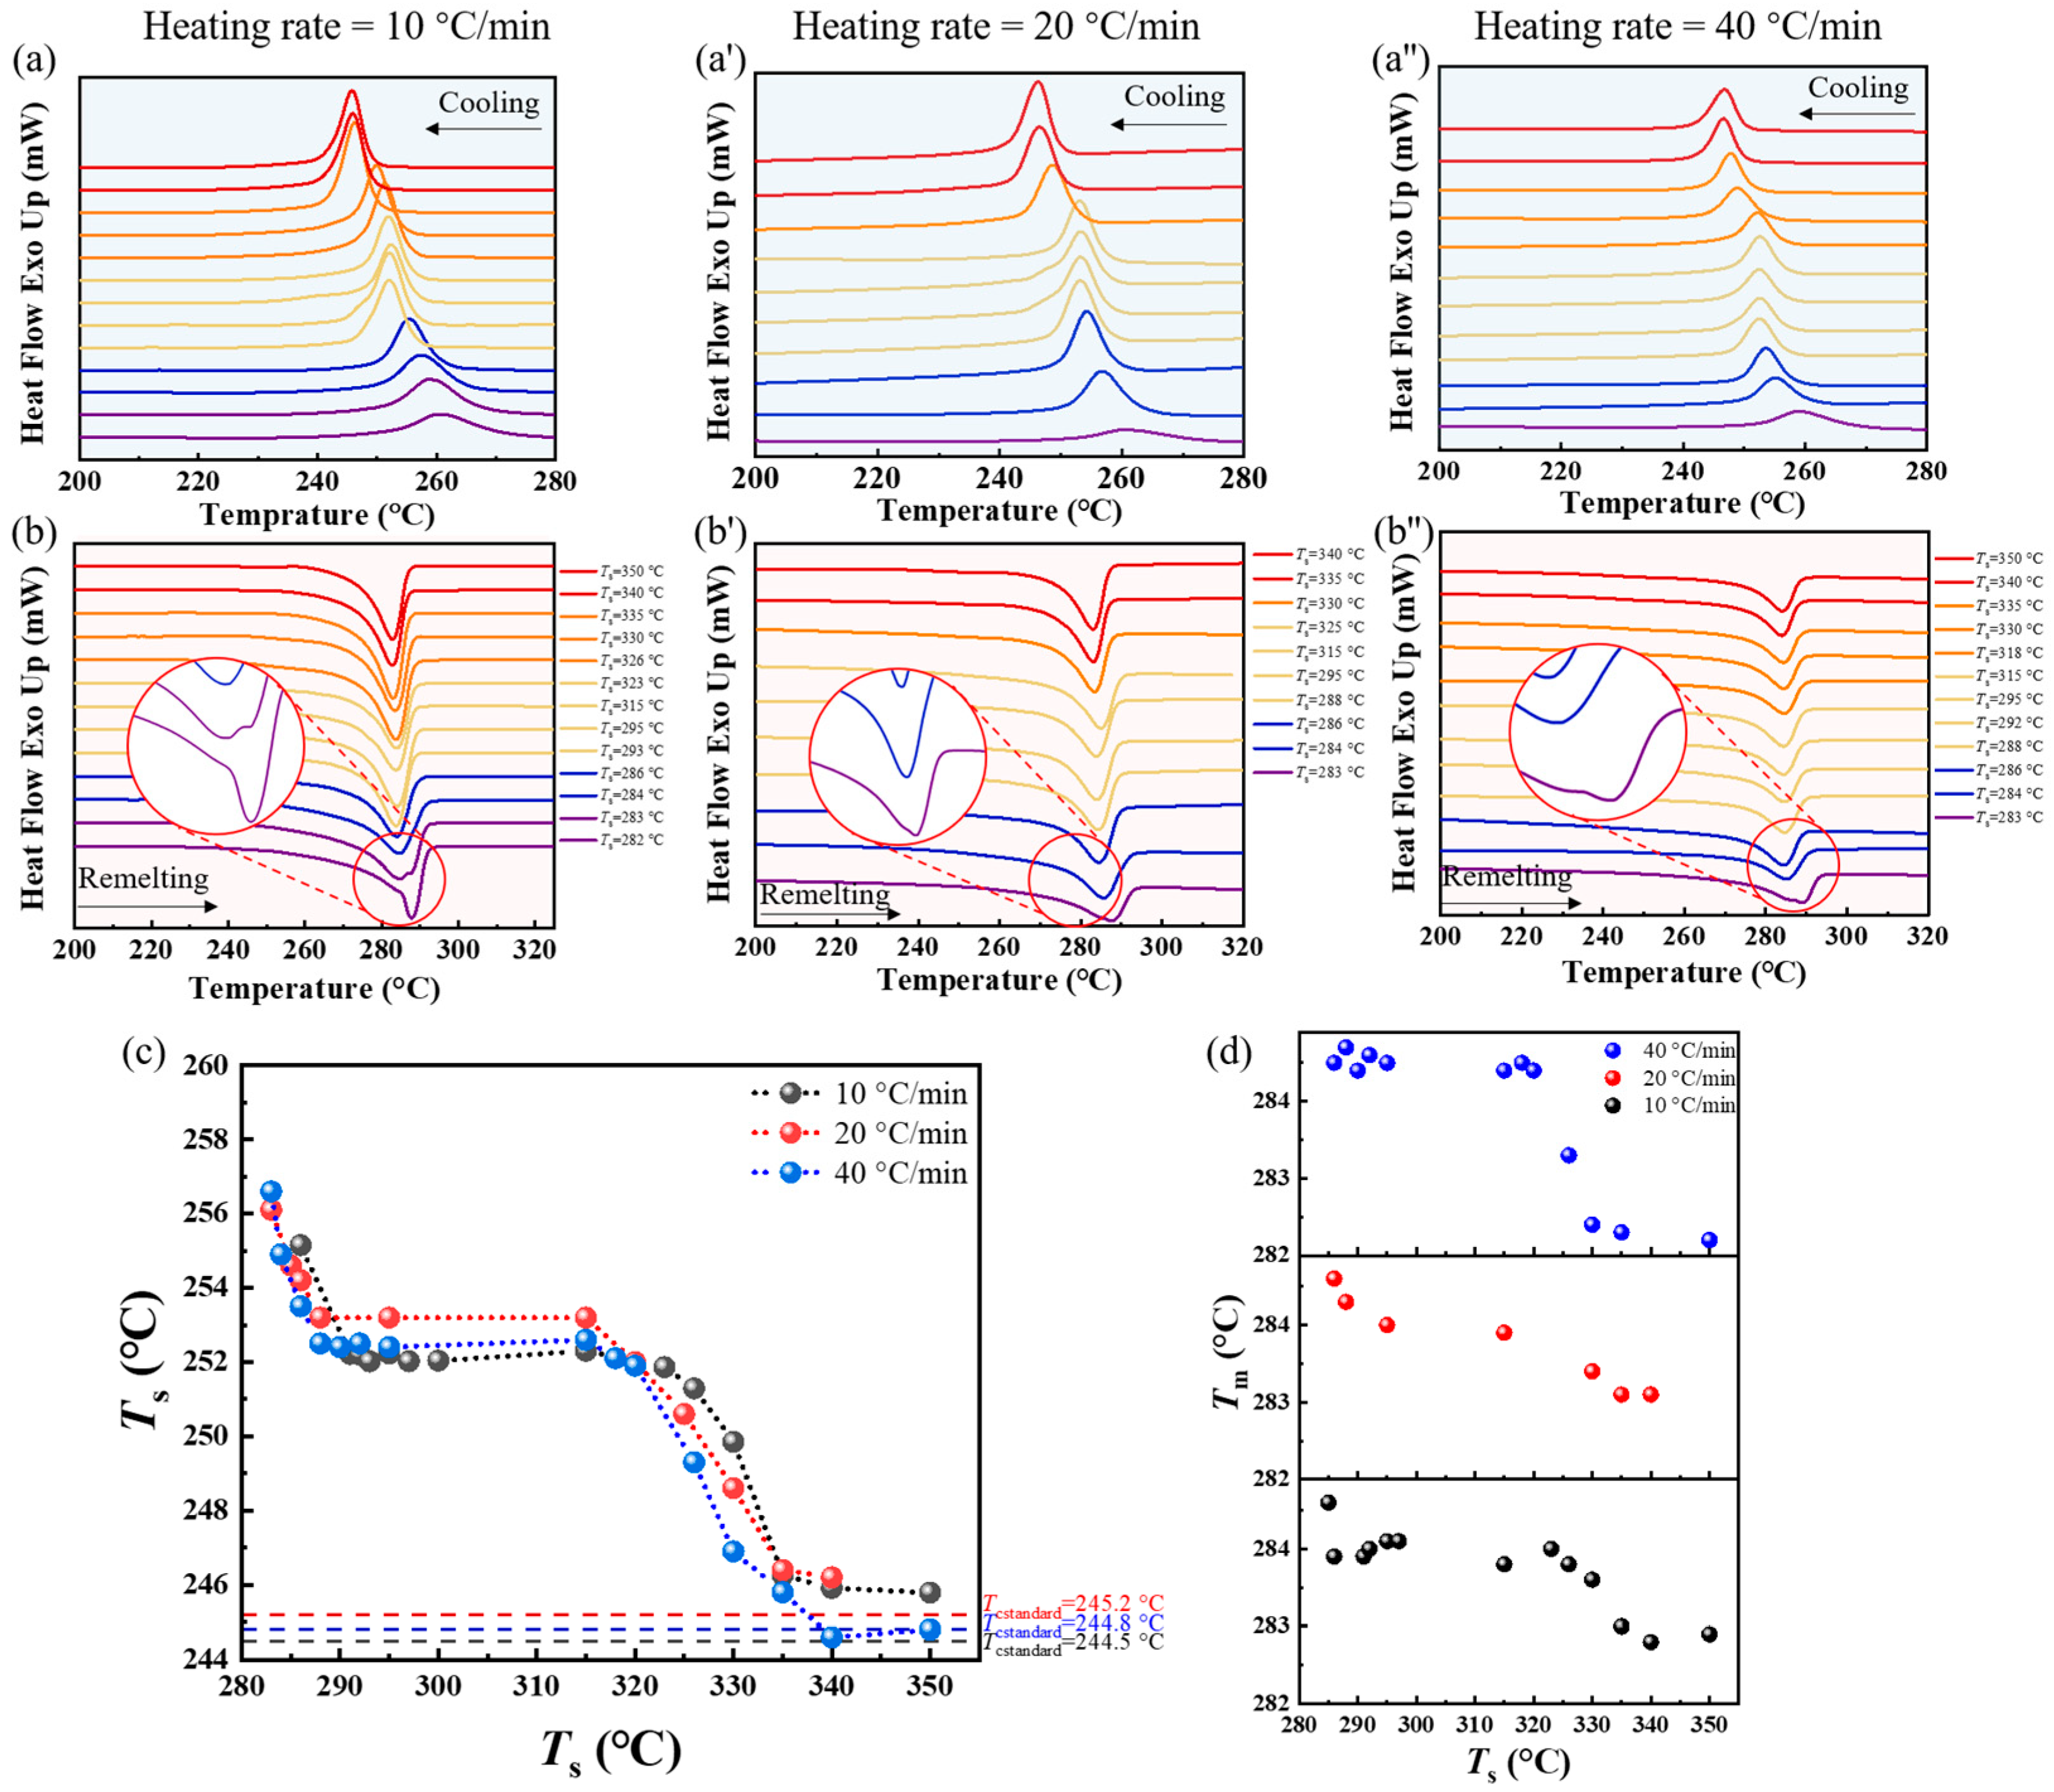
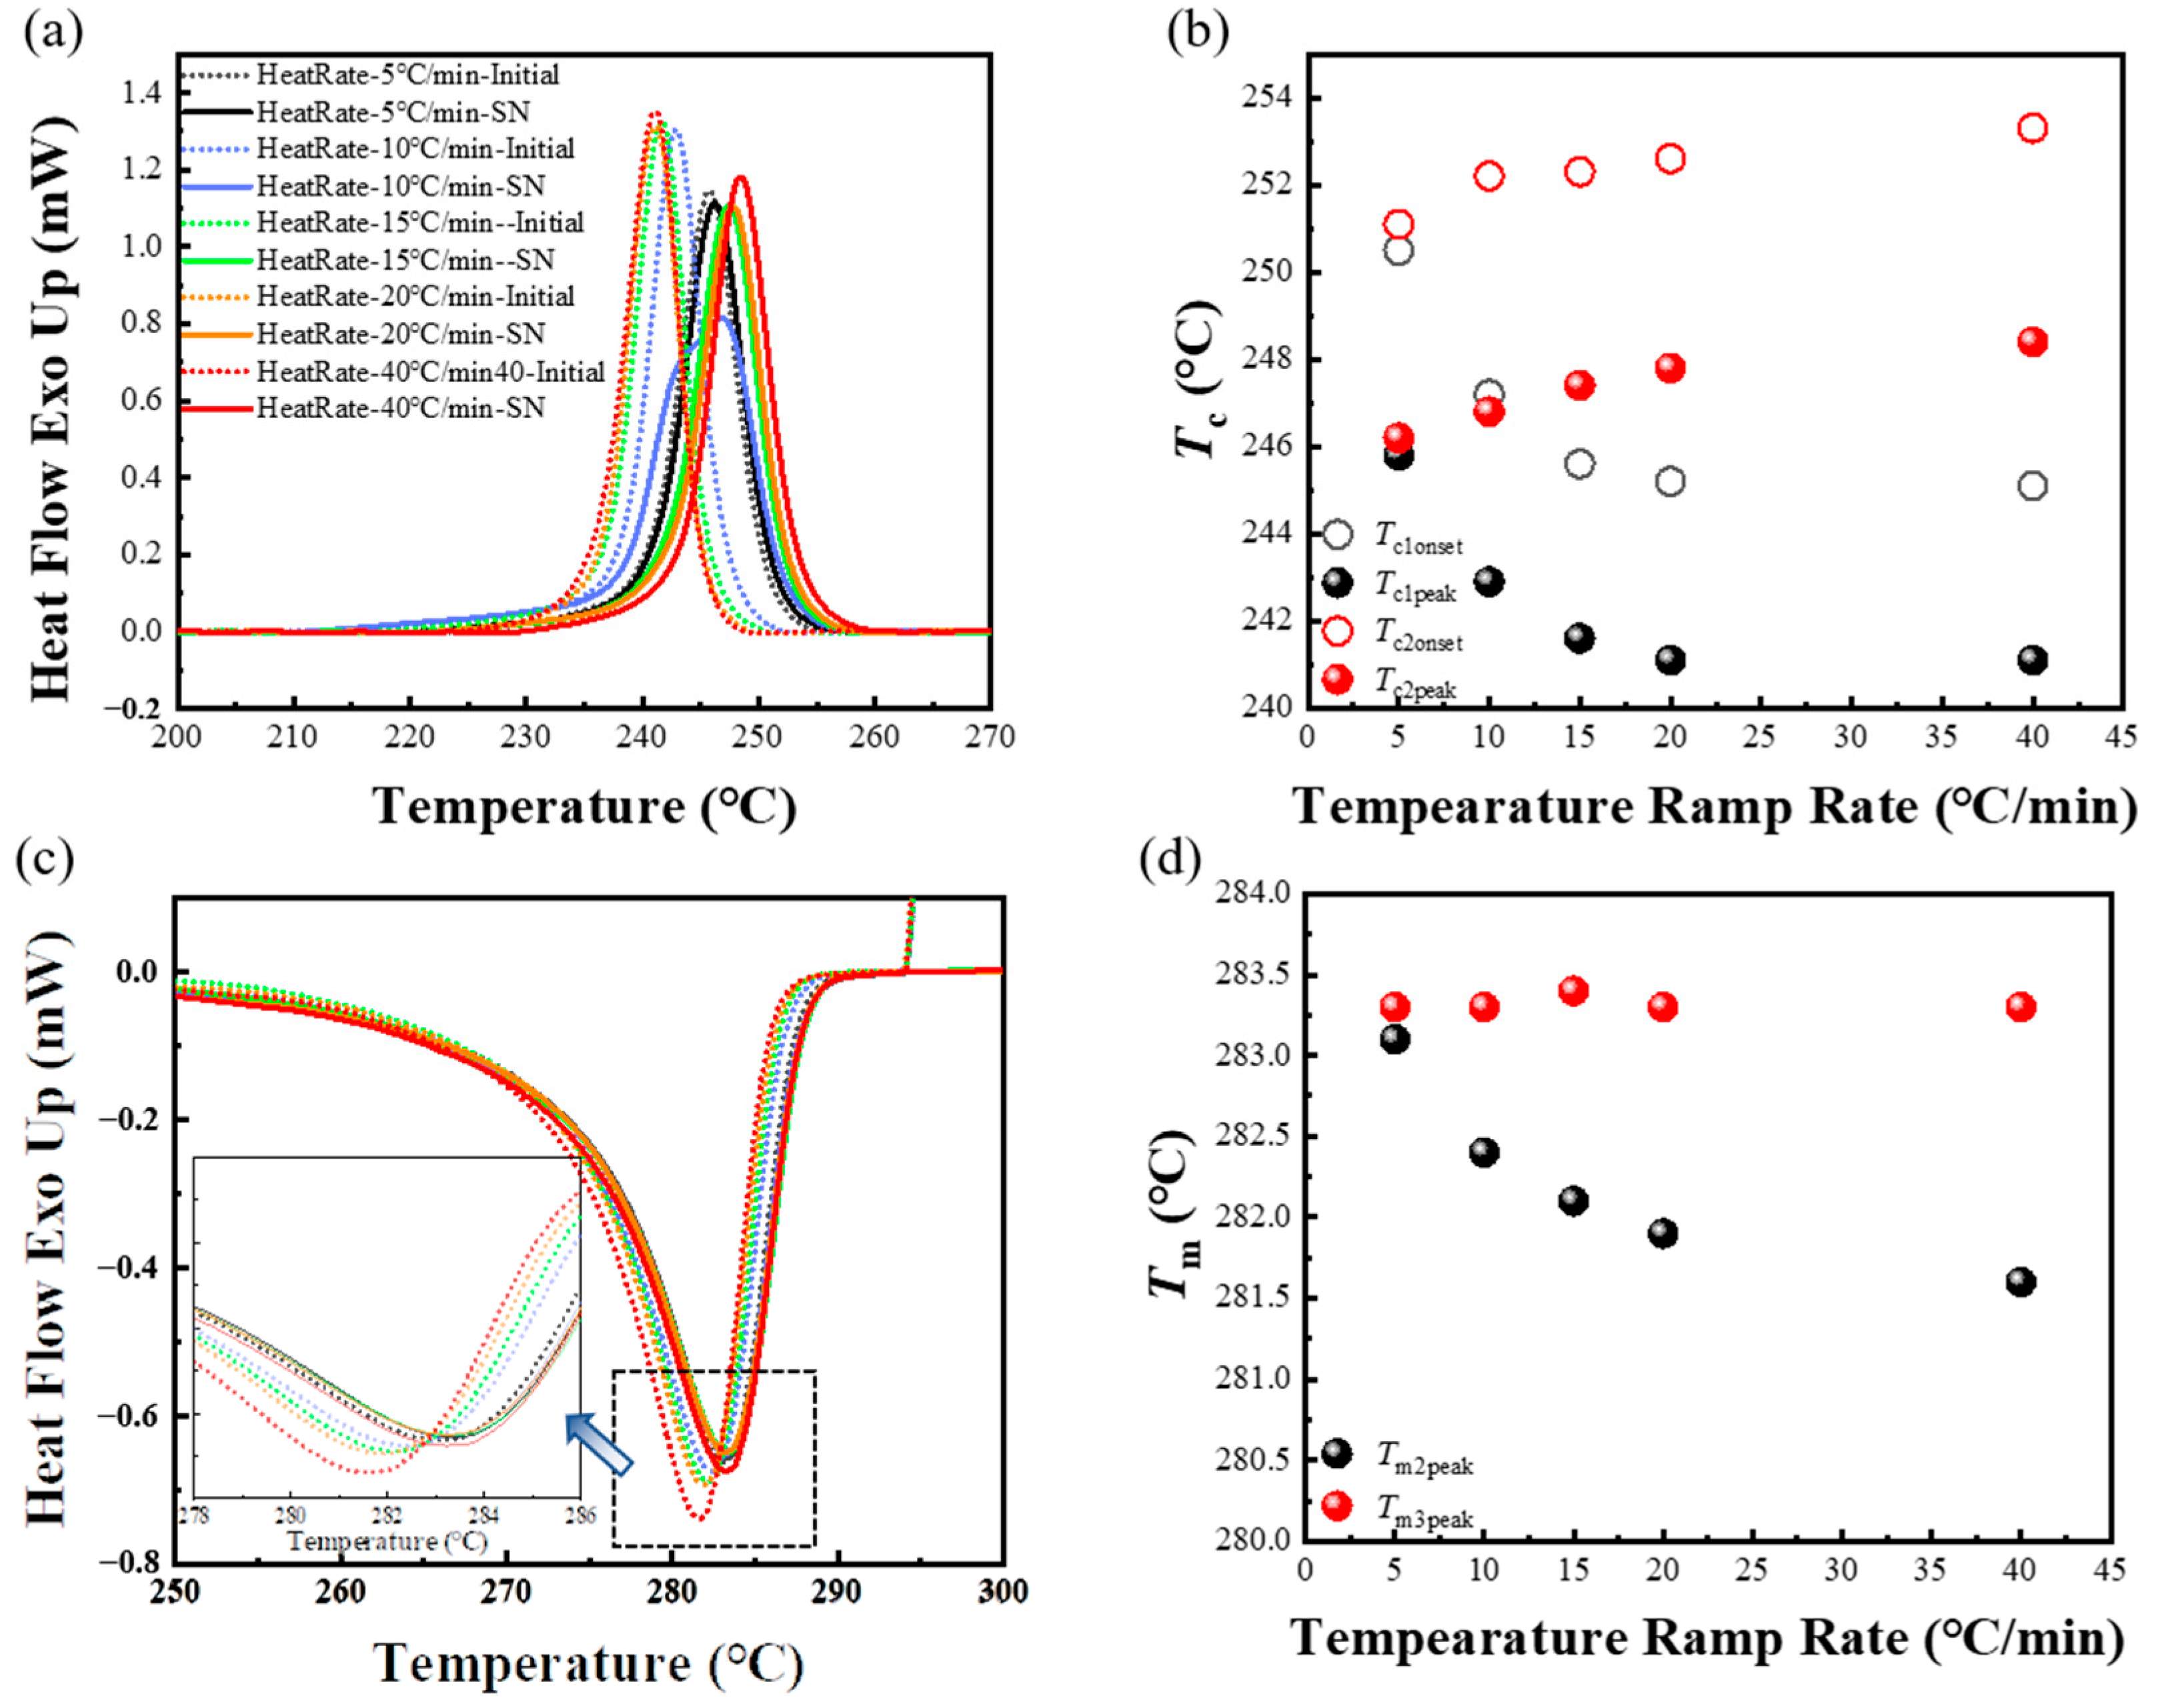
3.3. Effect of the Heating Rate in the First Thermal Cycle on the SN Behavior of PPS

The premise of SN behavior in semi-crystalline polymers is that the polymer needs to be sufficiently crystallized before the secondary melting. In the actual secondary thermoforming process of CF/PPS composites, the raw material may either be amorphous or in a fully crystallized state, potentially leading to inconsistencies in the initial crystallization behavior of PPS. In this study, the PPS film is amorphous, and cold crystallization will occur during its first heating process. Then, the lamellae thicken and become perfect due to annealing during the heating process. Compared with the melt crystallization, the crystals of PPS with imperfect structure resulting from cold crystallization are more significantly affected by annealing. Hence, the amorphous PPS raw material might be strongly influenced by the heating rate in the first thermal cycle. Figure 4 have found that there were subtle differences in the memory effect of PPS melt under different heating rates in the second thermal cycle. Therefore, it is of interest to see if applying different heating rates in the first thermal cycle to the amorphous PPS film will affect its initial crystallization behavior, and finally change the SN behavior during the second crystallization of PPS.
The PPS was subjected to a heating rate of 10 °C/min and maintained at 330 °C for 5 min in the first thermal cycle. After cooling process, the temperature was increased again to observe the changes in the relationship between crystallization temperature (Tc2) and the processing melt temperature (Ts) in the second thermal cycle. As shown in Figure 5a, it was found that when Ts below 295 °C, the Tc2 of PPS consistently decreased with the rise of Ts. This is consistent with the SN behavior exhibited by PPS in previous experiments. As the Ts increased, diminishing residual crystalline fragments in the melt weakened the promotion effect of the self-seeds on PPS crystallization. However, for Ts exceeding 295 °C, the Tc2 dropped to around the initial crystallization temperature (Tc1). This phenomenon is quite unique. According to the previous experimental results of the SN behavior of PPS, Ts should be within the temperature range that could form PPS’s special SN domain (Domain II’). In this range, while the Tc2 of PPS does not change with the increasing Ts, the Tc2 of PPS at this range should be higher than the Tc1. This is because although PPS might lack residual crystalline fragments or ordered structural regions, its intricate amorphous chain topology restricts the interdiffuse of molecular chains. This particular conformation, with its inherent low entropy, promote the nucleation behavior of PPS. The phenomenon depicted in Figure 5b, as suggested by other literature reports, indicates that the memory effect of the polymer melt has disappeared and the SN behavior no longer occurs. At this temperature, the PPS melt was homogeneous, and nucleation was trigger on the foreign pre-existing surface provided by high-temperature-resistant heterogeneities [56].
Interestingly, as depicted in Figure 5b, with a heating rate of 10 °C/min in the first thermal cycle, the Tc1 of PPS was 243.1 °C. However, when the first heating rate was escalated to 40 °C/min, under the same processing melt temperature and cooling rate, the Tc1 of PPS was 240.5 °C. The slower first heating rate resulted in a higher Tc1 for PPS during the initial crystallization. This suggests that the first heating rate had an impact on the Tc1. Could this result explain the phenomenon that Tc2 approached Tc1 is not due to the disappearance of the SN effect, but rather because the Tc1 increased due to the slow first heating rate? To further analyze the impact of the initial heating rate on both primary crystallization behavior and behavior after secondary melting, experiments were conducted while maintaining the same first processing melt temperature as before, which is 330 °C. The heating rates were set to 5 °C/min, 10 °C/min, 15 °C/min, 20 °C/min, and 40 °C/min. The thermal protocols were shown in Figure 6. With the processing melt temperature in the second thermal cycle selected as 295 °C, the thermal flow changes in the sample during thermal cycling at different heating rates were recorded.
As seen in Figure 7a, the varying first heating rates profoundly influenced both initial crystallization behavior and the second crystallization behavior. Notably, when the initial heating rate was 5 °C/min, the cooling curve of the initial cooling process almost coincides with that of the secondary cooling process. However, as the initial heating rate accelerated, the curves corresponding to the first and second crystallization process gradually separated. The first crystallization peak shifted towards a lower temperature, while the second crystallization peak shifted towards a higher temperature. Eventually, when the heating rate exceeded 20 °C/min, the relative positions of the two curves attained stability. The relationship between the crystallization temperature of the two stages and the initial heating rate was summarized in Figure 7b. It can be seen that when the first heating rate was 5 °C/min, the crystallization temperatures of the two stages were almost the same. As the heating rate increased, the Tc1 gradually decreased, from 245.8 °C to 241.1 °C. In contrast, the Tc2 gradually increased, from 246.2 °C to 248.0 °C. This resulted in an increasing temperature difference between the crystallization temperature of the two stages. When the heating rate was 40 °C/min, compared with the sample at a heating rate of 20 °C/min, the variances of crystallization temperature in both crystallization process were minimal, maintaining a steady temperature gap. It is crucial to highlight that although the initial processing melt temperature is the same, a slower heating rate resulted in a higher crystallization temperature (~4 °C). This suggests that there were some ordered structures in the melt that promoted the crystallization process of PPS, and these structures were formed at the slower heating rate.
Beyond the evident shifts in crystallization temperature, the impact of the initial heating rate on PPS crystallization behavior can also observe from the change in the remelting behavior of spherulites forming in the prior and subsequent cycles, as shown in Figure 7c,d. With the increases in the first heating rate, the peak remelting temperature of the spherulites forming in initial crystallization gradually decreased, dropping from 283.1 °C to 282.2 °C. In contrast, the peak remelting temperature of the spherulites forming in second crystallization remained relatively unchanged. It is noteworthy that the trend of the peak remelting temperature of the initial crystallization with the initial heating rate was almost the same as the trend of the peak melting temperature exhibited by the different SN behavior of PPS. The peak melting temperature could reflect the structural information of lamellae. According to Gibbs–Thomson equation [57], a higher peak remelting temperature corresponds to a more perfect lamellar structure. As can be seen from Figure 4d, if PPS displays SN behaviors during the cooling process after secondary melting, the peak remelting temperature of the formed crystals would be higher than that of regular spherulites. This is because PPS melt, which can generate SN behavior, can start to crystallize at a higher temperature during non-isothermal crystallization. The molecular chains move and arrange thoroughly at high temperature, leading the lamellae to become more orderly and perfected. As a result, it requires a higher temperature to melt these perfect lamellae. Thus, the static peak remelting temperature of spherulites forming in the subsequent crystallization, as depicted in Figure 7d, indicated that the crystalline structure of the second crystallization was not affected by the heating rate in the first thermal cycle.
It is worth noting that since there was SN behavior during the second crystallization process when the first heating rate was 40 °C/min. It could be speculated that SN behavior also occurred during the second crystallization when the first heating rate was 5 °C/min, due to the same Tm3peak. Moreover, a consistent initial and second crystallization temperature at this heating rate suggested the same crystallization behaviors. Thus, based on the nearly identical crystallization temperature and peak remelting temperature in the two thermal cycles at a slower initial heating rate, it could be deduced that PPS exhibited SN behavior during the first crystallization.
To verify that under different heating rates in the first thermal cycle, PPS exhibits various crystallization behavior during the first crystallization due to the influence of cold crystallization and annealing. The same thermal protocol as DSC was applied to PPS films using a hot stage. The crystalline morphology was observed in real time by microscopy. Figure 8a shows that when the heating rate was 40 °C/min, the crystalline morphology of the initial crystallization manifested as standard spherulites. When the sample underwent a secondary melting and cooling, the SN behavior occurred, and the crystalline morphology was transformed into tiny crystals. However, at a heating rate of 5 °C/min, the initial crystalline morphology already presented as very tiny crystals, as shown in Figure 8b. This is the typical crystalline morphology following the SN behavior of PPS, where the volume of the spherulite dropped to a level that is difficult to discern with the naked eye. When this sample underwent the secondary melting and crystallization, the crystalline morphology is similar to that of the initial crystallization.
This result directly confirms that at a slower heating rate, PPS exhibits SN behavior during the initial crystallization process, leading to a significant increase in the crystallization temperature of PPS and a drastic reduction in crystalline size. This is due to the cold crystallization of the amorphous PPS film when it was heated in the first thermal cycle, and the crystals formed in the cold crystallization process underwent annealing during the slow heating process. This annealing process thickened the lamellae, perfected their structure, and expelled the various defects, thus forming a complex molecular chain topology between the lamellae. When the initial processing melt temperature was 330 °C, while the temperature can melt the annealed crystals, the complex molecular chain topology between the crystalline regions prevented the locally ordered relaxation molecular chains, originated from crystalline region, from reverting to the random coil conformation. Consequently, due to the advantage of entropy, the nucleation process of PPS is promoted by ordered molecular chains, manifesting as an increase in crystallization temperature and a sharp decrease in spherulitic size. However, when the heating rate surpasses 20 °C/min, the annealing process is suppressed, and the crystalline structure is not fully perfected. Thus, 330 °C could disrupt the metastable structure where molecular chains can relax but cannot interdiffuse. Ultimately, due to the absence of melt memory effect, PPS forms standard spherulites during cooling process. Additionally, the imaging results indicated that in situations where crystalline morphology cannot be obtained, the correlation between crystallization temperature and post-crystallization peak remelting temperatures could qualitatively predict crystalline morphology of PPS under given thermal conditions.

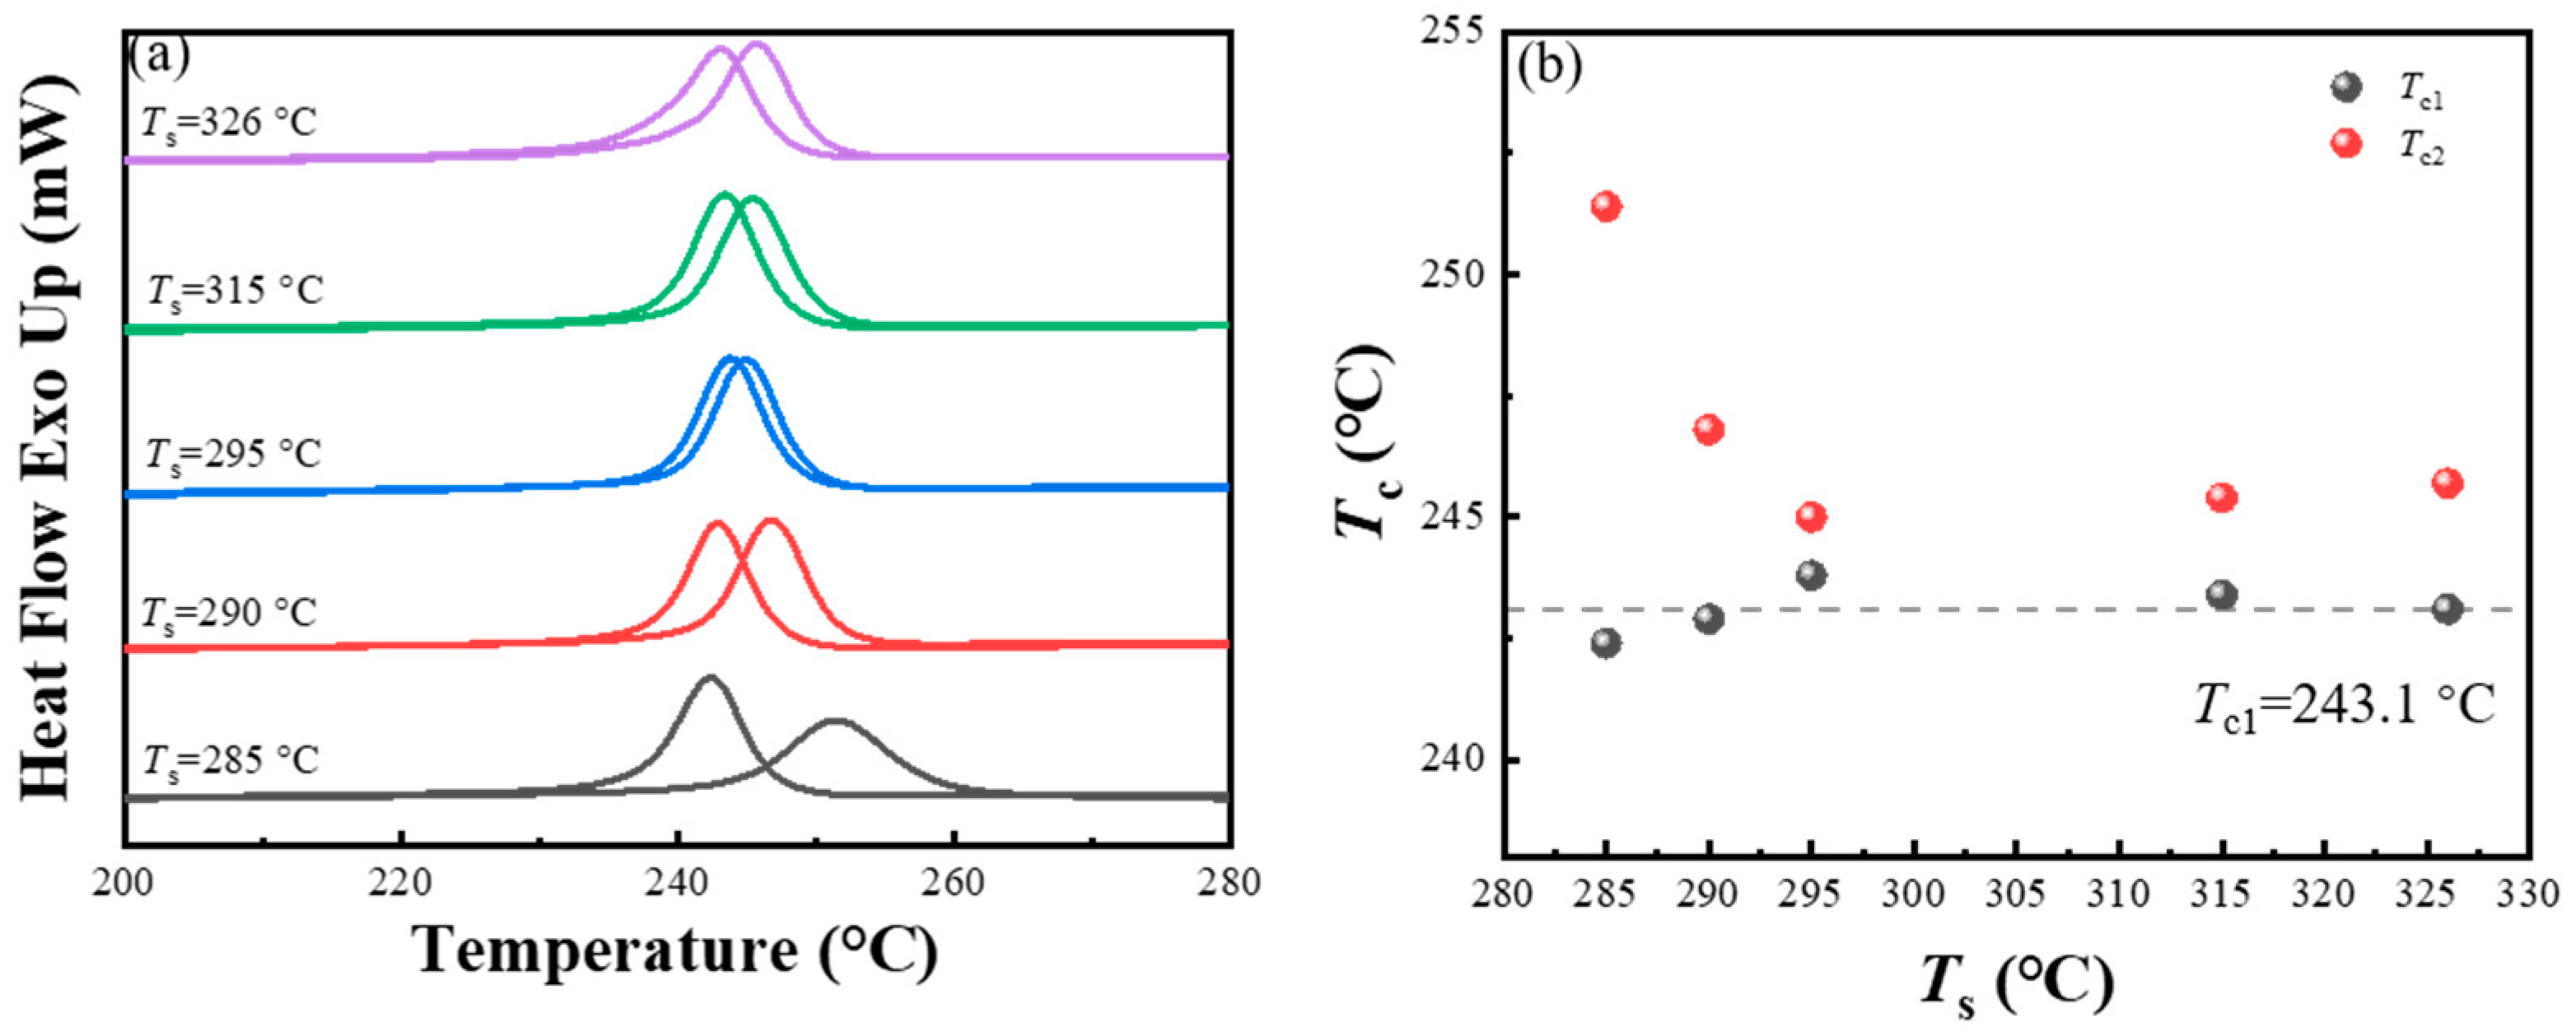
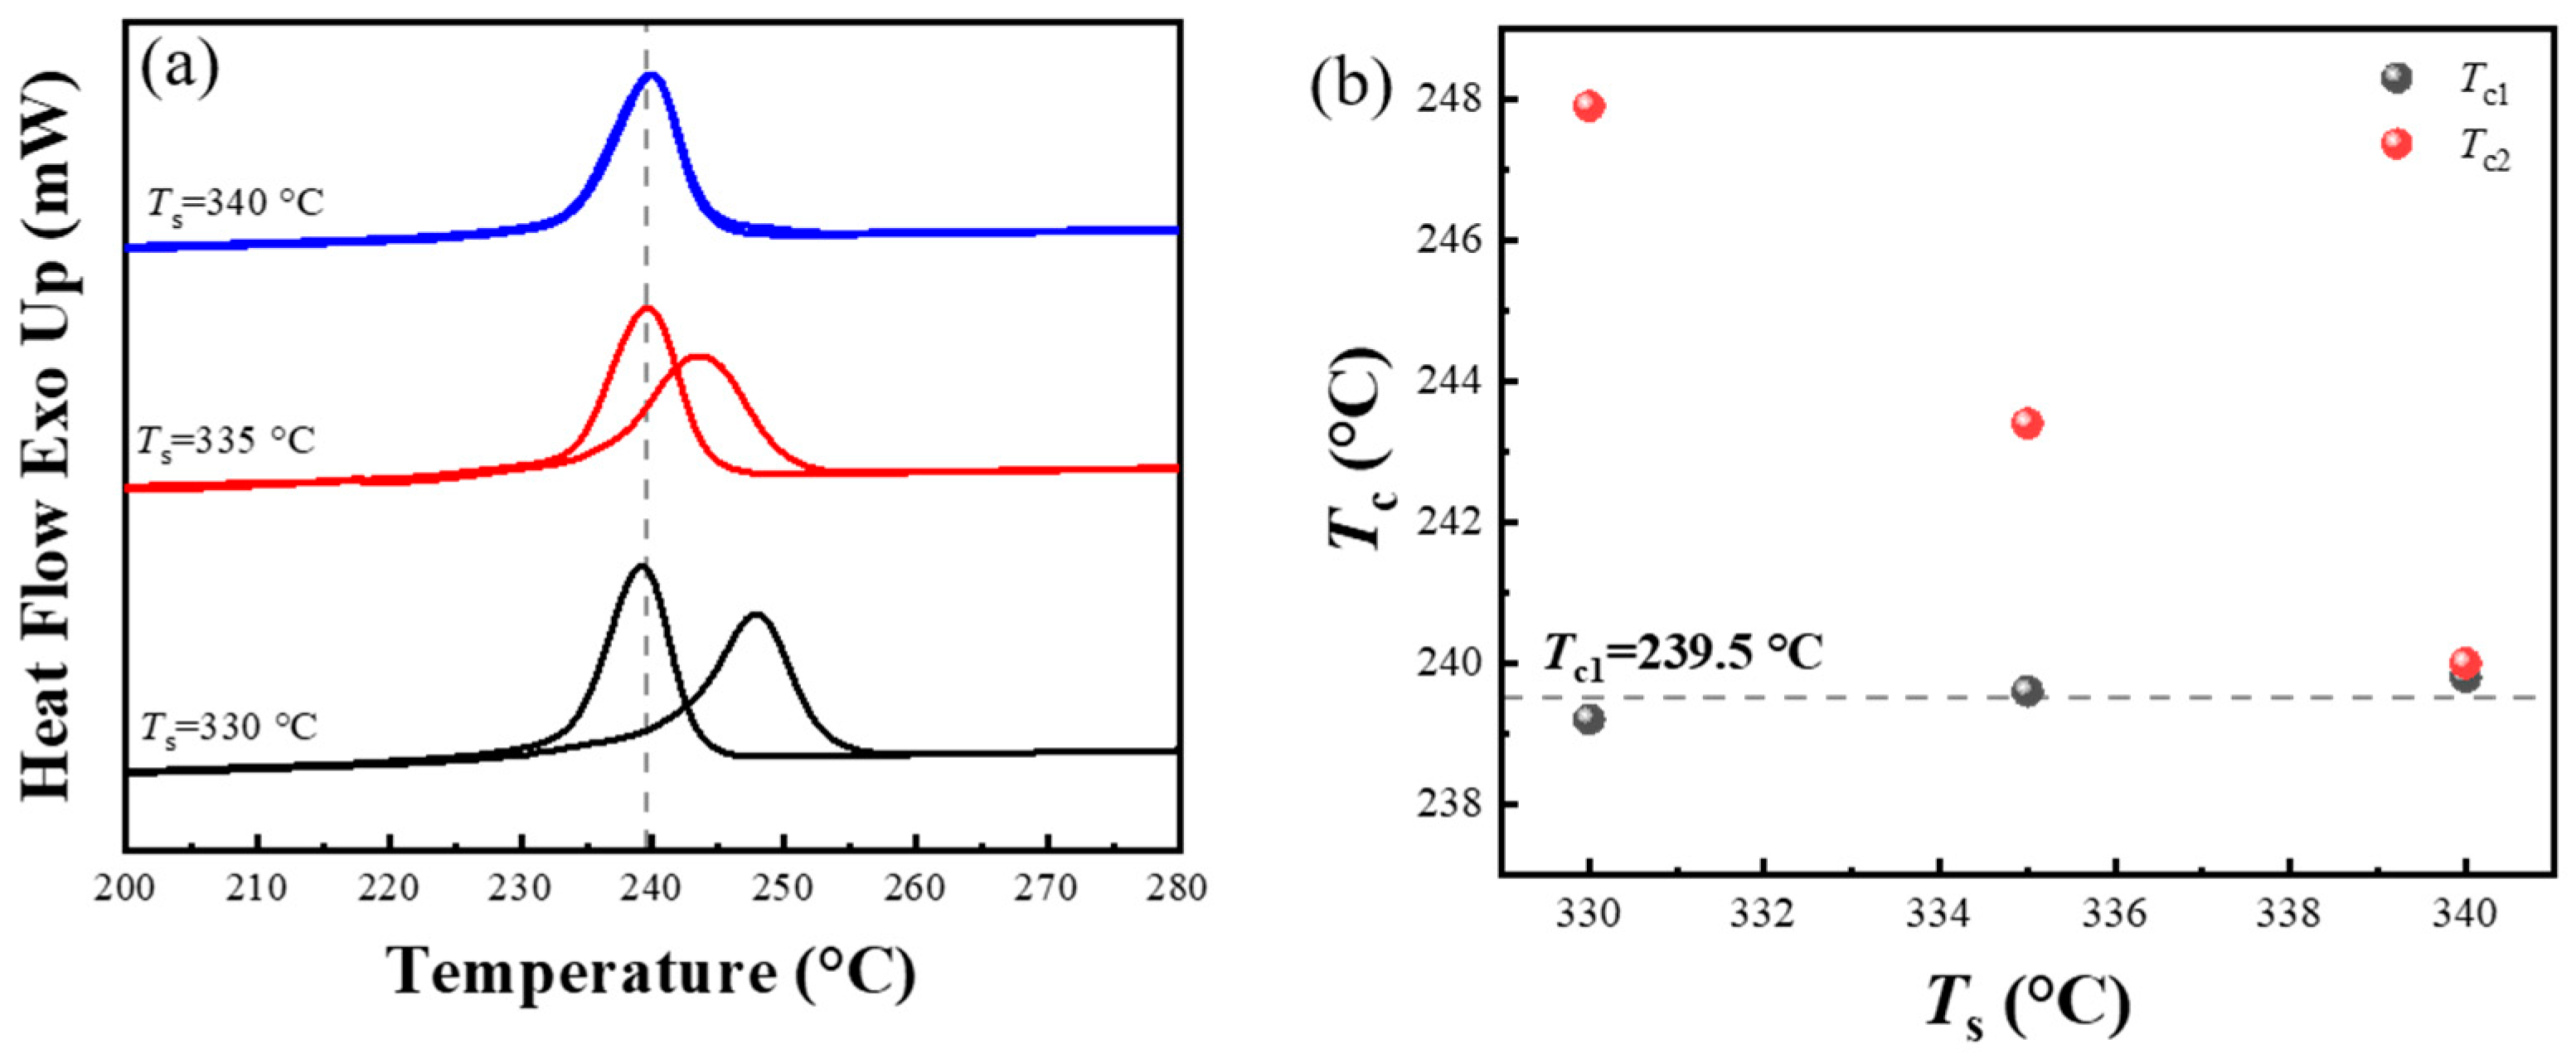
3.4. Effect of the Processing Melt Temperature in the First Thermal Cycle on the SN Behavior of PPS

The slow heating rate induces the annealing and thickening of lamellae in the PPS, which consequently elevates the processing melt temperature required for the polymer chains to return to the random coil conformation. This phenomenon’s implications for PPS processing are often understated in practical applications, which might lead to heightened crystallization temperature and increased viscosity during cooling process. To avoid the SN behavior occurring in the first thermal cycle, a higher processing melt temperature was used to eliminate the strong melt memory effect in PPS. By heating PPS at rate of 10 °C/min, annealing and thickening of the lamellae occurred after cold crystallization of PPS. The first processing melt temperature was then set to 340 °C. It can be seen from Figure 9a that when the processing melt temperature of second thermal cycle (Ts) was set to 330 °C, the crystallization peak is separated from the crystallization peak of the first thermal cycle. As Ts increased, the crystallization peak began to shift toward low temperature. Finally, the crystallization peaks of the first and second thermal cycles were coincided when Ts increased to 340 °C. Figure 9b shows that after PPS melting at 340 °C in the first thermal cycle, the Tc1 dropped to 239.5 °C, a reduction of 3.6 °C compared to the Tc1 when the initial processing melt temperature was 330 °C. Importantly, the cooling rate for both sets were the same. Furthermore, it is noteworthy that a reemergence of the discrepancy between Tc1 and Tc2 was observed during the second thermal cycle of PPS. The Tc2 was approximately 8 °C higher than the Tc1, which is a typical manifestation of the SN behavior. As the processing melt temperature in the second thermal cycle (Ts) increased, the Tc2 gradually decreased due to the diminishing melt memory effect.
The experiment with an initial processing melt temperature of 340 °C also demonstrated the synergistic effects of the first heating rate and the initial processing melt temperature. A slower heating rate could induce a strong melt memory effect, which could be counteracted by elevating the initial processing melt temperature. To clearly reveal the impact of the single factor of initial processing melt temperature on the SN behavior in the second crystallization process, the heating should be set above 20 °C/min. This helps to reduce the influence of annealing and thickening during the initial heating process on the melt memory effect. Although the literature has widely reported the impact of the initial processing melt temperature on the crystallization temperature [58,59,60], it is important to focus on that whether it affects the crystallization behavior in the second thermal cycle.
The thermal protocol that was used to study the relationship between crystallization behaviors and initial processing melt temperature is shown in Figure 10. It can be seen from Figure 11a that when the initial processing melt temperature of PPS was below 330 °C, the initial crystallization temperature decreased from 252.4 °C to 244.4 °C with an elevation in the initial processing melt temperature. This is due to the melt memory effect caused by the PPS spherulites formed during cold crystallization, and the insufficient initial processing melt temperature cannot dimmish the melt memory effect. Although the annealing and thickening after cold crystallization is suppressed by fast heating rates, a suitably high processing melt temperature is essential to diminish the melt memory effect. In the thermal protocol corresponding to Figure 10, this proper initial processing melt temperature (Ts1) was 330 °C, which corresponding to the lowest initial crystallization temperature (Tc1). Beyond this processing melt temperature, the Tc1 of PPS slightly increased with the increase in Ts1, potentially due to minor crosslinking of molecular chains occurring within PPS.
Interestingly, when PPS underwent the second thermal cycle to induce the SN behavior, the Tc2 was consistently around 252.4 °C. Figure 11b reveals that although PPS underwent melting at different temperature in the first thermal cycle, the heat flow curves during the secondary cooling process were almost identical, with no significant changes in peak shapes or positions. This consistency suggests minimal influence from the first processing melt temperature on second crystallization behavior with the SN effect. Furthermore, Figure 11c demonstrates that as the initial processing melt temperature gradually increased, the peak remelting temperature of the spherulites forming in the initial crystallization exhibited the same variation trend as the crystallization temperature. Notably, when the initial processing melt temperature was 320 °C, the crystallization and peak remelting temperature from both the prior and subsequent cycles were nearly the same, as shown in Figure 11d. Correspondingly, the heat flow curves during the cooling process and the heating process for spherulites remelting almost overlapped, indicating the occurrence of the SN behavior in both thermal cycles.

4. Conclusions

This study systematically investigated the crystallization and remelting behaviors of PPS during two thermal cycles. The effects of various conditions in the thermal cycles on the SN and crystallization behaviors of PPS were established.
(1)
While the cooling rate in the second thermal cycle changed the crystallization temperature of PPS, it did not influence the SN behavior of PPS, which was manifested as the same temperature range of the special SN domain, as well as the consistent change trend between the processing melt temperature and crystallization temperature in the second thermal cycle across different crystallization rates.
(2)
The heating rate of the second thermal cycle has a marginal influence on the perfection of the crystal. During the heating process of spherulites to melting, a slower heating rate led to significant annealing and thickening of lamellae, such as a rate less than 10 °C/min. As a result, the overall temperature range required for the formation of the specific Domain II’ in PPS was lower by approximately 4 °C.
(3)
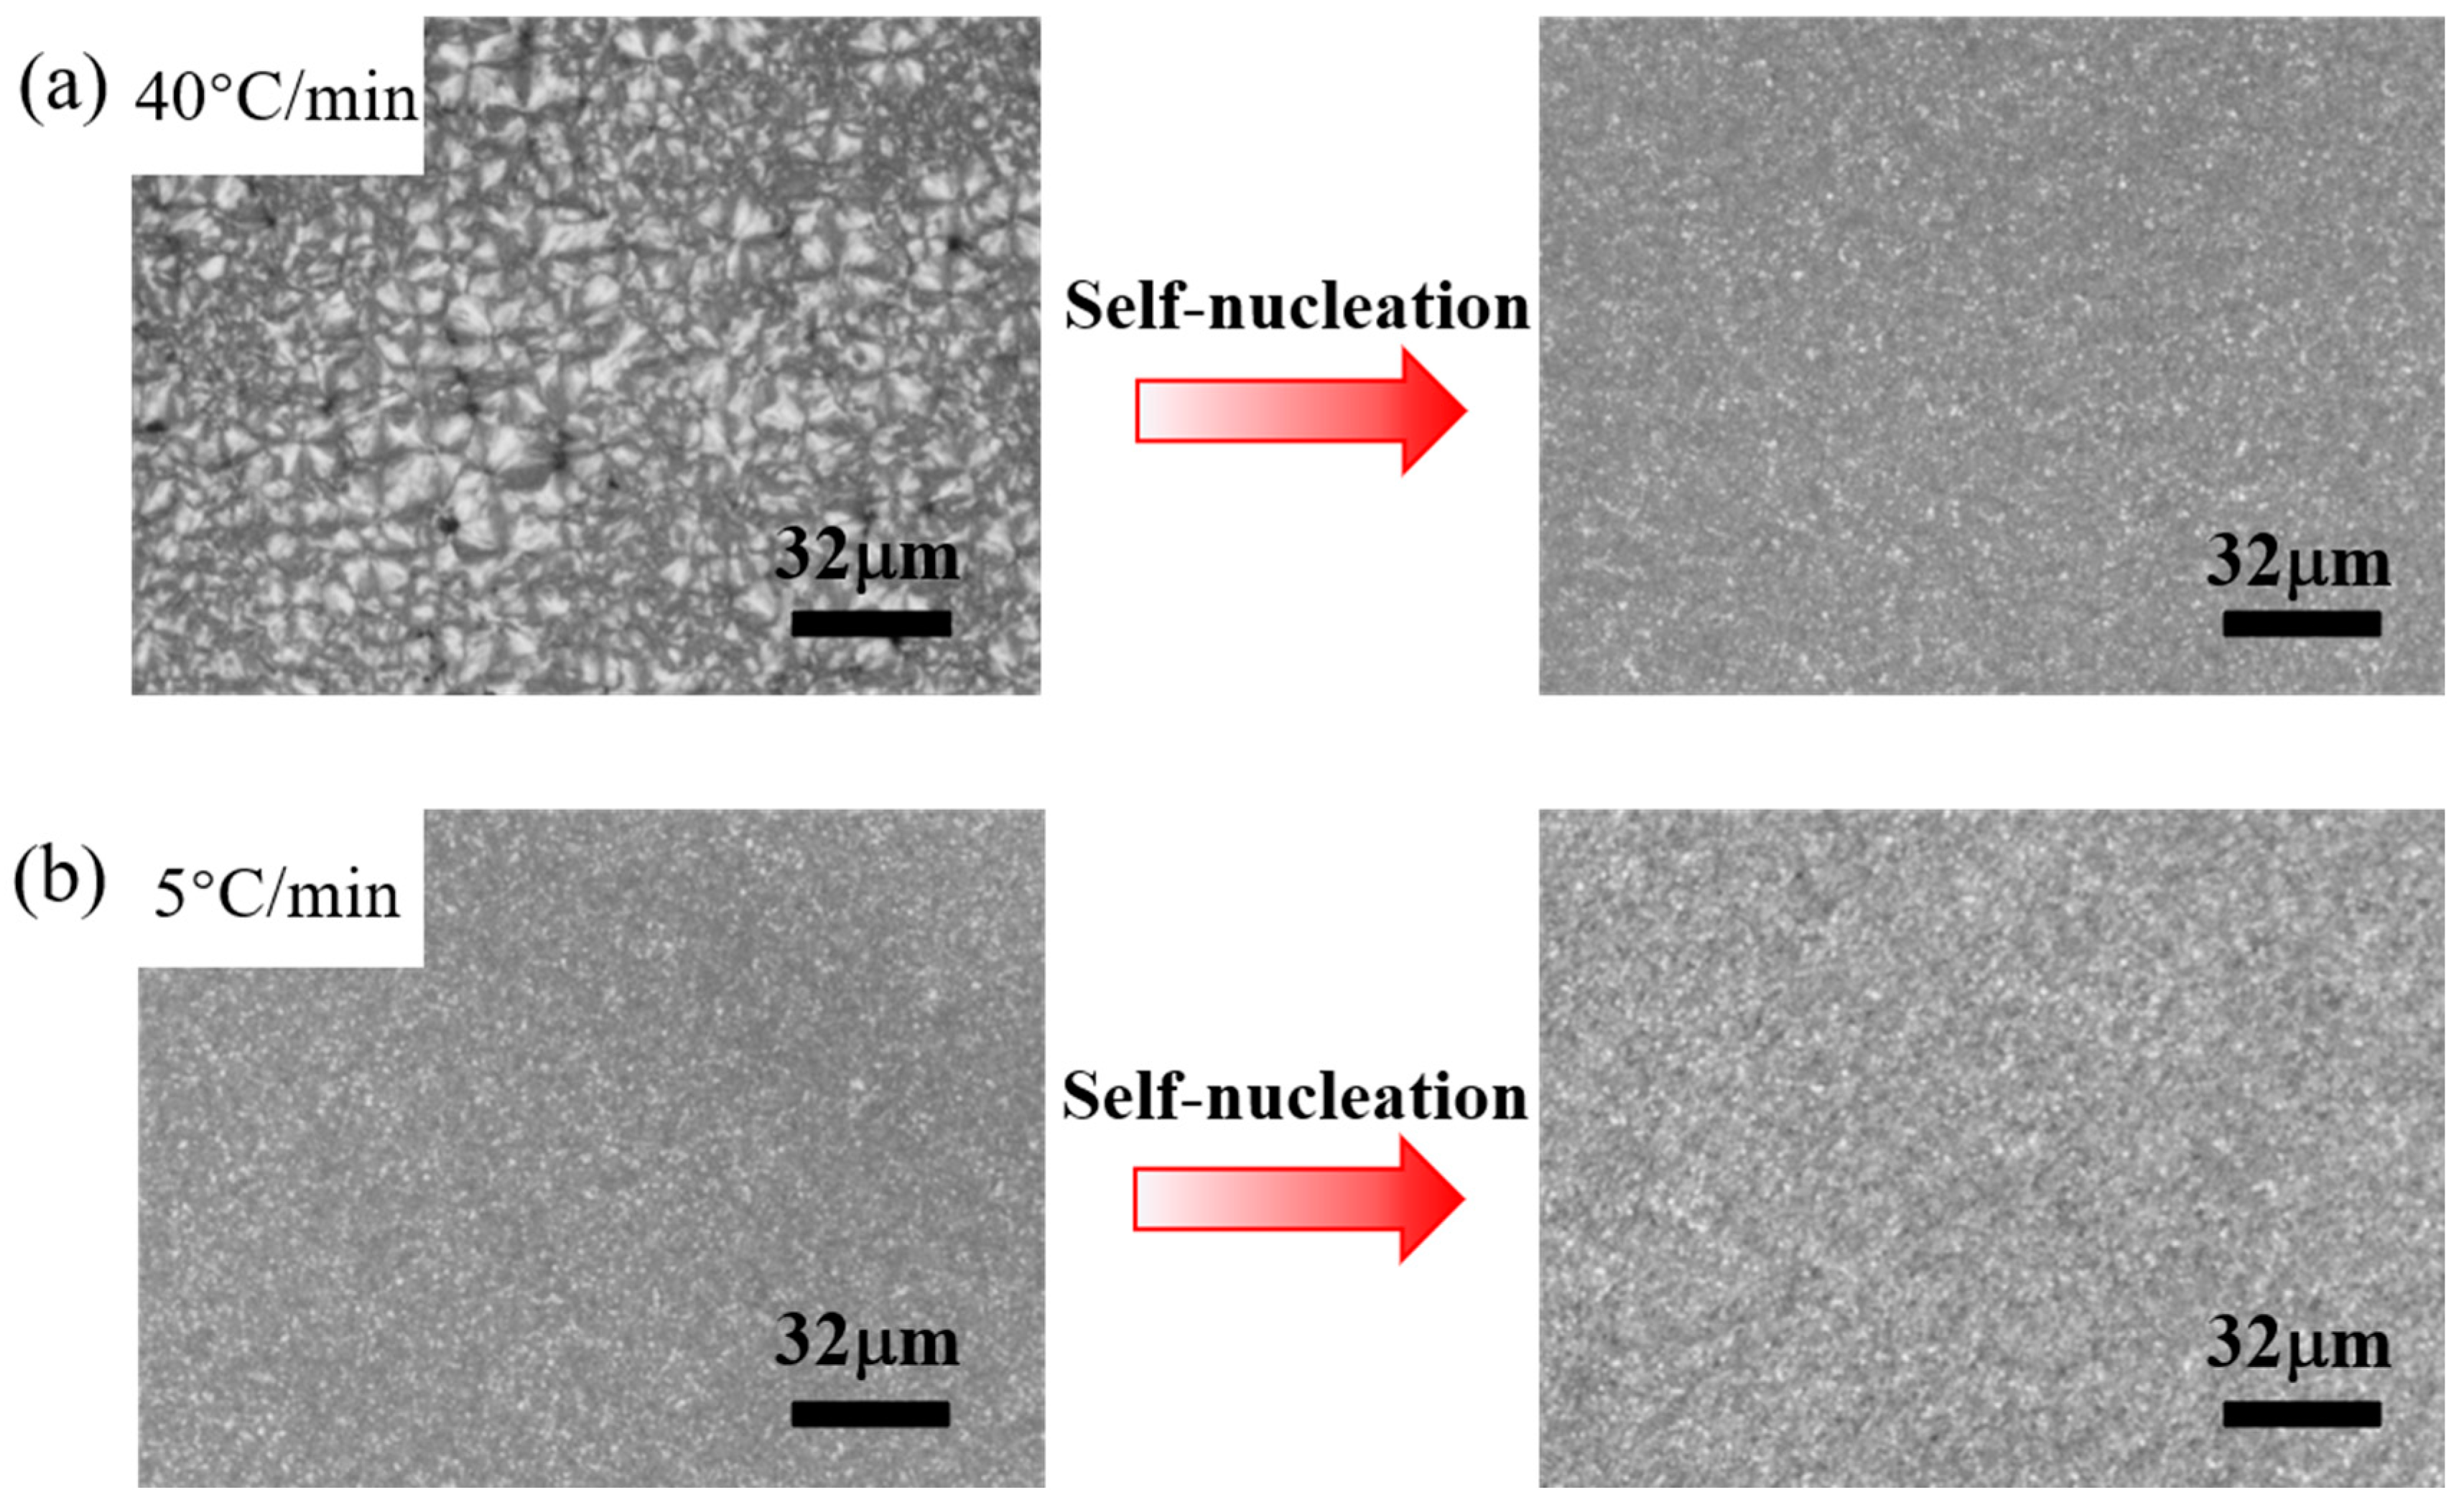
When PPS undergoes the first thermal cycle, there is a synergistic effect between the heating rate and the processing melt temperature. At a slower heating rate or a lower processing melt temperature, such as a rate less than 10 °C/min or a first-cycle processing melt temperature below 330 °C, PPS displays SN behavior. The SN behavior observed in the first thermal cycle originates from crystals formed during the cold crystallization of PPS. These crystals are annealed, and the lamella thickening at a lower heating rate. Additionally, the defect excluded from the lamella might heighten the existing entanglement of the molecular chains. This results in PPS requiring a higher temperature to revert to the random coil conformation. In addition, even with a faster heating rate like 40 °C/min, if the processing melt temperature is too low and insufficient to disrupt the locally ordered regions of the PPS molecular chains, it will also lead to a strong melt memory effect. Therefore, controlling the SN behavior of PPS requires simultaneous control of these two factors.
In summary, this study revealed the temperature parameters necessary for the initiation or inhibition of SN behavior in PPS during two thermal cycles. Furthermore, it elucidated the impact of each temperature parameter on PPS SN behavior, providing novel insights to control the crystallization temperature and morphology of PPS during secondary thermoforming processes.

Author Contributions

Y.R., investigation, data curation, and writing—original draft. Z.L., investigation. X.L., investigation. J.S., methodology. Y.L., conceptualization and supervision. Y.G., conceptualization. J.Z., formal analysis and methodology. C.J., conceptualization and supervision. S.Z., conceptualization, supervision, methodology, and writing—review and editing. M.Y., supervision and writing—review and editing. All authors have read and agreed to the published version of the manuscript.

Funding

This research was funded by the National Natural Science Foundation of China (52173247), and the funding from Jiangsu New Horizon Advanced Functional Fiber Innovation Center Co., Ltd. (HX281210639).

Institutional Review Board Statement

Not applicable.

Informed Consent Statement

Not applicable.

Data Availability Statement

Data are contained within this article.

Conflicts of Interest

The authors declare that they have no known competing financial interests or personal relationships that could have appeared to influence the work reported in this paper.

References

  1. Jagadeesh, P.; Rangappa, S.M.; Siengchin, S.; Puttegowda, M.; Thiagamani, S.M.K.; Rajeshkumar, G.; Kumar, M.H.; Oladijo, O.P.; Fiore, V.; Cuadrado, M.M.M. Sustainable recycling technologies for thermoplastic polymers and their composites: A review of the state of the art. Polym. Compos. 2022, 43, 5831–5862. [Google Scholar] [CrossRef]
  2. Stoeffler, K.; Andjelic, S.; Legros, N.; Roberge, J.; Schougaard, S.B. Polyphenylene sulfide (PPS) composites reinforced with recycled carbon fiber. Compos. Sci. Technol. 2013, 84, 65–71. [Google Scholar] [CrossRef]
  3. Wang, H.Y.; Liu, H.B.; Ding, Z.R.; Li, N. Experimental and constitutive modelling studies of semicrystalline thermoplastics under solid-state stamp forming conditions. Polymer 2021, 228, 123939. [Google Scholar] [CrossRef]
  4. Özdemir, A.O.; Karatas, C.; Kocak, H.; Demiral, M. Investigation of earing defect and thickness distribution in stamp forming of continuous glass fiber reinforced polypropylene composite laminates. J. Thermoplast. Compos. Mater. 2023, 36, 2154–2168. [Google Scholar] [CrossRef]
  5. Sitohang, R.D.R.; Grouve, W.J.B.; Warnet, L.L.; Akkerman, R. Effect of in-plane fiber waviness defects on the compressive properties of quasi-isotropic thermoplastic composites. Compos. Struct. 2021, 272, 114166. [Google Scholar] [CrossRef]
  6. Chen, J.P.; Fu, K.K.; Li, Y. Understanding processing parameter effects for carbon fibre reinforced thermoplastic composites manufactured by laser-assisted automated fibre placement (AFP). Compos. Part A Appl. 2021, 140, 106160. [Google Scholar] [CrossRef]
  7. Boon, Y.D.; Joshi, S.C.; Bhudolia, S.K. Filament Winding and Automated Fiber Placement with In Situ Consolidation for Fiber Reinforced Thermoplastic Polymer Composites. Polymers 2021, 13, 1951. [Google Scholar] [CrossRef]
  8. Donough, M.J.; Shafaq; St John, N.A.; Philips, A.W.; Prusty, B.G. Process modelling of In-situ consolidated thermoplastic composite by automated fibre placement—A review. Compos. Part A Appl. 2022, 163, 107179. [Google Scholar] [CrossRef]
  9. O’Shaughnessey, P.G.; Dube, M.; Villegas, I.F. Modeling and experimental investigation of induction welding of thermoplastic composites and comparison with other welding processes. J. Compos. Mater. 2016, 50, 2895–2910. [Google Scholar] [CrossRef]
  10. Pappada, S.; Salomi, A.; Montanaro, J.; Passaro, A.; Caruso, A.; Maffezzoli, A. Fabrication of a thermoplastic matrix composite stiffened panel by induction welding. Aerosp. Sci. Technol. 2015, 43, 314–320. [Google Scholar] [CrossRef]
  11. Farahani, R.D.; Dube, M. Novel Heating Elements for Induction Welding of Carbon Fiber/Polyphenylene Sulfide Thermoplastic Composites. Adv. Eng. Mater. 2017, 19, 1700294. [Google Scholar] [CrossRef]
  12. Mai, K.C.; Zhang, M.Q.; Zeng, H.M.; Qi, S.C. Double melting phenomena of polyphenylene sulfide and its blends. J. Appl. Polym. Sci. 1994, 51, 57–62. [Google Scholar] [CrossRef]
  13. Ghanbari, L.N.; Crater, E.R.; Enos, N.R.; McNair, O.D.; Moore, R.B.; Wiggins, J.S. Polyphenylene sulfide for high-rate composite manufacturing: Impacts of processing parameters on chain architecture, rheology, and crystallinity. Polym. Degrad. Stab. 2023, 218, 110580. [Google Scholar] [CrossRef]
  14. Um, C.; Jung, D.; Yu, S.Y.; Lee, S.S.; Lee, H.W.; Lee, P.C.; Ko, Y.K.; Jeoung, S.K.; Ha, J.U. Study on Physical Properties of Polyphenylene Sulfide Composites with Variothermal Mold Temperatures. Polym. Korea 2020, 44, 798–803. [Google Scholar] [CrossRef]
  15. Zuo, P.Y.; Tcharkhtchi, A.; Shirinbayan, M.; Fitoussi, J.; Bakir, F. Effect of thermal aging on crystallization behaviors and dynamic mechanical properties of glass fiber reinforced polyphenylene sulfide (PPS/GF) composites. J. Polym. Res. 2020, 27, 77. [Google Scholar] [CrossRef]
  16. Hu, S.H.; Yang, F.; Xiang, M.; Cao, Y.; Wu, T.; Fu, Q. Competition of memory effect and thermal degradation on the crystallization behavior of polyphenylene sulfide. Polymer 2022, 262, 125427. [Google Scholar] [CrossRef]
  17. Ferrara, J.A.; Seferis, J.C.; Sheppard, C.H. Dual-mechanism kinetics of polyphenylene sulfide (PPS) melt-crystallization. J. Therm. Anal. Calorim. 1994, 42, 467–484. [Google Scholar] [CrossRef]
  18. Jog, J.P.; Bulakh, N.; Nadkarni, V.M. Crystallization of polyphenylene sulfide. B Mater. Sci. 1994, 17, 1079–1089. [Google Scholar] [CrossRef]
  19. Furushima, Y.; Nakada, M.; Yoshida, Y.; Okada, K. Crystallization/Melting Kinetics and Morphological Analysis of Polyphenylene Sulfide. Macromol. Chem. Phys. 2018, 219, 1700481. [Google Scholar] [CrossRef]
  20. Oshima, S.; Higuchi, R.; Kato, M.; Minakuchi, S.; Yokozeki, T.; Aoki, T. Cooling rate-dependent mechanical properties of polyphenylene sulfide (PPS) and carbon fiber reinforced PPS (CF/PPS). Compos. Part A Appl. 2023, 164, 107250. [Google Scholar] [CrossRef]
  21. Sangroniz, L.; Cavallo, D.; Müller, A.J. Self-Nucleation Effects on Polymer Crystallization. Macromolecules 2020, 53, 4581–4604. [Google Scholar] [CrossRef]
  22. Candau, N.; Fernandes, J.P.C.; Vasmer, E.; Maspoch, M.L. Cellulose nanocrystals as nucleating agents for the strain induced crystallization in natural rubber. Soft Matter 2022, 18, 8663–8674. [Google Scholar] [CrossRef]
  23. Yang, J.H.; Xu, T.; Lu, A.; Zhang, Q.; Tan, H.; Fu, Q. Preparation and properties of poly (p-phenylene sulfide)/multiwall carbon nanotube composites obtained by melt compounding. Compos. Sci. Technol. 2009, 69, 147–153. [Google Scholar] [CrossRef]
  24. Diez-Pascual, A.M.; Naffakh, M. Tuning the properties of carbon fiber-reinforced poly(phenylene sulphide) laminates via incorporation of inorganic nanoparticles. Polymer 2012, 53, 2369–2378. [Google Scholar] [CrossRef]
  25. Yan, P.; Yang, F.; Xiang, M.; Wu, T.; Fu, Q. New insights into the memory effect on the crystallization behavior of poly(phenylene sulfide). Polymer 2020, 195, 122439. [Google Scholar] [CrossRef]
  26. Ren, Y.; Lu, Y.G.; Zhang, B.; Su, J.Y.; Liu, W.P.; Zhou, J.F.; Yu, M.H.; Zhu, S. Control of the crystalline morphology of polyphenylene sulfide in secondary thermoforming by the strong memory effect of crystallization. Polymer 2023, 281, 126067. [Google Scholar] [CrossRef]
  27. Chen, X.; Mamun, A.; Alamo, R.G. Effect of Level of Crystallinity on Melt Memory Above the Equilibrium Melting Temperature in a Random Ethylene 1-Butene Copolymer. Macromol. Chem. Phys. 2015, 216, 1220–1226. [Google Scholar] [CrossRef]
  28. Gao, H.; Vadlamudi, M.; Alamo, R.G.; Hu, W. Monte Carlo Simulations of Strong Memory Effect of Crystallization in Random Copolymers. Macromolecules 2013, 46, 6498–6506. [Google Scholar] [CrossRef]
  29. Reid, B.O.; Vadlamudi, M.; Mamun, A.; Janani, H.; Gao, H.; Hu, W.; Alamo, R.G. Strong Memory Effect of Crystallization above the Equilibrium Melting Point of Random Copolymers. Macromolecules 2013, 46, 6485–6497. [Google Scholar] [CrossRef]
  30. De Stefano, F.; Cicolella, A.; Barreca, A.; Scoti, M.; De Rosa, C. Melt memory in propene-pentene isotactic copolymers: The case of defects hosted in the crystals. Polym. Chem. 2023, 14, 5260–5273. [Google Scholar] [CrossRef]
  31. Liao, Y.L.; Pan, L.; Ma, Z.; Cavallo, D.; Liu, G.M.; Wang, D.J.; Müller, A.J. How 4-(7-Octen-1-yl)-N,N-diphenylaniline co-units induce strong melt memory effects in isotactic polypropylene random copolymers. Polymer 2023, 282, 126184. [Google Scholar] [CrossRef]
  32. Sangroniz, L.; Safari, M.; de Ilarduya, A.M.; Sardon, H.; Cavallo, D.; Müller, A.J. Disappearance of Melt Memory Effect with Comonomer Incorporation in Isodimorphic Random Copolyesters. Macromolecules 2023, 56, 7879–7888. [Google Scholar] [CrossRef]
  33. Jariyavidyanont, K.; Janke, A.; Androsch, R. Crystal self-nucleation in polyamide 11 of different semicrystalline morphology. Polymer 2019, 184, 121864. [Google Scholar] [CrossRef]
  34. Joijode, A.S.; Hawkins, K.; Tonelli, A.E. Improving Poly(ethylene terephthalate) Through Self-nucleation. Macromol. Mater. Eng. 2013, 298, 1190–1200. [Google Scholar] [CrossRef]
  35. Shen, J.F.; Zhou, Y.F.; Lu, Y.G.; Wang, B.H.; Shen, C.Y.; Chen, J.B.; Zhang, B. Later Stage Melting of Isotactic Polypropylene. Macromolecules 2020, 53, 2136–2144. [Google Scholar] [CrossRef]
  36. Balzano, L.; Rastogi, S.; Peters, G. Self-Nucleation of Polymers with Flow: The Case of Bimodal Polyethylene. Macromolecules 2011, 44, 2926–2933. [Google Scholar] [CrossRef]
  37. Vassiliadou, O.; Chrysostomou, V.; Pispas, S.; Klonos, P.A.; Kyritsis, A. Molecular dynamics and crystallization in polymers based on ethylene glycol methacrylates (EGMAs) with melt memory characteristics: From linear oligomers to comb-like polymers. Soft Matter 2021, 17, 1284–1298. [Google Scholar] [CrossRef]
  38. Sangroniz, L.; Ocando, C.; Cavallo, D.; Müller, A.J. Melt Memory Effects in Poly(butylene succinate) Studied by Differential Fast Scanning Calorimetry. Polymers 2020, 12, 2796. [Google Scholar] [CrossRef] [PubMed]
  39. Liu, X.; Yu, W. Role of Chain Dynamics in the Melt Memory Effect of Crystallization. Macromolecules 2020, 53, 7887–7898. [Google Scholar] [CrossRef]
  40. Arandia, I.; Mugica, A.; Zubitur, M.; Arbe, A.; Liu, G.; Wang, D.; Mincheva, R.; Dubois, P.; Muller, A.J. How Composition Determines the Properties of Isodimorphic Poly(butylene succinate-ran-butylene azelate) Random Biobased Copolymers: From Single to Double Crystalline Random Copolymers. Macromolecules 2015, 48, 43–57. [Google Scholar] [CrossRef]
  41. Liu, X.R.; Wang, Y.; Wang, Z.F.; Cavallo, D.; Muller, A.J.; Zhu, P.; Zhao, Y.; Dong, X.; Wang, D.J. The origin of memory effects in the crystallization of polyamides: Role of hydrogen bonding. Polymer 2020, 188, 122117. [Google Scholar] [CrossRef]
  42. Peters, O.A.; Still, R.H. The thermal degradation of poly (phenylene sulphide)—Part 1. Polym. Degrad. Stab. 1993, 42, 41–48. [Google Scholar] [CrossRef]
  43. Reents, W.D., Jr.; Kaplan, M.L. Mass spectral analysis of poly (p-phenylene sulphide). Polymer 1982, 23, 310–313. [Google Scholar] [CrossRef]
  44. Yan, P.; Peng, W.X.; Yang, F.; Cao, Y.; Xiang, M.; Wu, T.; Fu, Q. Investigation on thermal degradation mechanism of poly(phenylene sulfide). Polym. Degrad. Stab. 2022, 197, 109863. [Google Scholar] [CrossRef]
  45. Lian, D.; Zhang, R.; Lu, J.; Dai, J. Performances and structure changes of neat PPS fiber and nano Ti-SiO2-modified PPS fiber after over-temperature oxidation. High Perform. Polym. 2018, 30, 328–338. [Google Scholar] [CrossRef]
  46. Hawkins, R.T. Chemistry of the cure of poly (p-phenylene sulfide). Macromolecules 1976, 9, 189–194. [Google Scholar] [CrossRef]
  47. Hu, Y.Y.; Liao, Y.; Zheng, Y.N.; Ikeda, K.; Okabe, R.; Wu, R.F.; Ozaki, R.; Xu, J.; Xu, Q.Y. Influence of Cooling Rate on Crystallization Behavior of Semi-Crystalline Polypropylene: Experiments and Mathematical Modeling. Polymers 2022, 14, 3646. [Google Scholar] [CrossRef] [PubMed]
  48. Boelle, S.; Alms, J.; Weihermueller, M.; Robisch, M.; Wipperfuerth, J.; Hopmann, C.; Dahlmann, R. Modelling of the melting point shift in semi-crystalline thermoplastics dependent on prior cooling rate and heating rate. Polymer 2022, 254, 125100. [Google Scholar] [CrossRef]
  49. Heidrich, D.; Gehde, M. Calorimetric analysis of the crystallization of PBT considering the dynamic cooling condition of real processing. Polym. Test. 2020, 85, 106459. [Google Scholar] [CrossRef]
  50. Moghadam, A.S.N.; Rafizadeh, M.; Taromi, F.A. Non-isothermal crystallization kinetics of polyethylene terephthalate: A study based on Tobin, Hay and Nakamura models. Iran. Polym. J. 2023, 32, 125–137. [Google Scholar] [CrossRef]
  51. Speranza, V.; Salomone, R.; Pantani, R. Effects of Pressure and Cooling Rates on Crystallization Behavior and Morphology of Isotactic Polypropylene. Crystals 2023, 13, 922. [Google Scholar] [CrossRef]
  52. Volpe, V.; Speranza, V.; Schrank, T.; Berer, M.; Pantani, R. An investigation of crystallization kinetics of polyoxymethylene in processing conditions. Polym. Adv. Technol. 2022, 34, 634–645. [Google Scholar] [CrossRef]
  53. Ren, J.Y.; Ouyang, Q.F.; Ma, G.Q.; Li, Y.; Lei, J.; Huang, H.D.; Jia, L.C.; Lin, H.; Zhong, G.J.; Li, Z.M. Enhanced dielectric and ferroelectric properties of poly (vinylidene fluoride) through annealing oriented crystallites under high pressure. Macromolecules 2022, 55, 2014–2027. [Google Scholar] [CrossRef]
  54. Bair, H.E.; Salovey, R.; Huseby, T.W. Melting and annealing of polyethylene single crystals. Polymer 1967, 8, 9–20. [Google Scholar] [CrossRef]
  55. Schick, C.; Androsch, R. The Origin of Annealing Peaks in Semicrystalline Polymers: Enthalpy Recovery or Melting? Macromolecules 2020, 53, 8751–8756. [Google Scholar] [CrossRef]
  56. Hu, W.B. Principles of Polymer Crystallization; Chemical Industry Press: Beijing, China, 2013. [Google Scholar]
  57. Hoffman, J.D.; Davis, G.T.; Lauritzen, J.I., Jr. The rate of crystallization of linear polymers with chain folding. In Treatise on Solid State Chemistry: Volume 3 Crystalline and Noncrystalline Solids; Springer: Berlin/Heidelberg, Germany, 1976; pp. 497–614. [Google Scholar]
  58. Yin, Y.G.; Song, Y.; Xiong, Z.J.; Zhang, X.Q.; de Vos, S.; Wang, R.Y.; Joziasse, C.A.P.; Liu, G.M.; Wang, D.J. Effect of the melting temperature on the crystallization behavior of a poly(L-lactide)/poly(D-lactide) equimolar mixture. J. Appl. Polym. Sci. 2016, 133, 43015. [Google Scholar] [CrossRef]
  59. Supaphol, P.; Lin, J.S. Crystalline memory effect in isothermal crystallization of syndiotactic polypropylenes: Effect of fusion temperature on crystallization and melting behavior. Polymer 2001, 42, 9617–9626. [Google Scholar] [CrossRef]
  60. Kong, W.L.; Zhu, B.; Su, F.M.; Wang, Z.; Shao, C.G.; Wang, Y.M.; Liu, C.T.; Shen, C.Y. Melting temperature, concentration and cooling rate-dependent nucleating ability of a self-assembly aryl amide nucleator on poly(lactic acid) crystallization. Polymer 2019, 168, 77–85. [Google Scholar] [CrossRef]
Figure 1. The thermal protocol used in DSC experiments. (a)–(e) respectively represent the heating and cooling stages during the thermal cycles.
Materials 17 00890 g001
Figure 2. (a) The thermal protocol used by DSC, in which the cooling rates of the second thermal cycle is different. (b) The reference for the division of PPS Domain [26]. DSC cooling scans at different cooling rates when the secondary processing melt temperature (Ts) is (c) 285 °C, (d) 295 °C, (e) 315 °C, (f) 325 °C, and (g) 335 °C. The corresponding SN domain was marked in the upper left corner, and the legend showed the corresponding cooling rate at the Ts. (h) Peak crystallization temperature (Tc) as a function of the Ts with different cooling rates. The colors of the shadows correspond to the temperature ranges associated with the different domains of PPS SN behavior.
Materials 17 00890 g002
Figure 3. Thermal protocol used in experiment of investigating the relationship between the crystallization behavior and heating rate in the second thermal cycle. The range of the secondary processing melt temperature (Ts) was from 283 °C to 350 °C, and the stay period at Ts was 5 min.
Materials 17 00890 g003
Figure 4. DSC cooling scans from the indicated Ts during the second thermal cycle, when the secondary heating rate was set to (a) 10 °C/min, (a′) 20 °C/min, and (a″) 40 °C/min. Different line colors represented different domains where PPS was located. Subsequent DSC heating scans which correspond to the third heating segments. The secondary heating rate was set to (b) 10 °C/min, (b′) 20 °C/min, and (b″) 40 °C/min. (c) Peak crystallization temperature (Tc) as a function of Ts for different heating rates during the second thermal cycle. The dashed line represents the standard crystallization temperature of PPS. (d) Peak remelting temperature (Tm) after crystallization in the second thermal cycle as a function of Ts.
Materials 17 00890 g004
Figure 5. (a) DSC cooling scans during the first and second thermal cycles. The corresponding secondary processing melt temperature (Ts) is marked on the left side of the curve. (b) Peak crystallization temperature as a function of the Ts, which corresponds to the first (Tc1) and second (Tc2) cooling segments, respectively. The heating rate in the first thermal cycle was set to 10 °C/min, and the initial processing melt temperature was set to 330 °C.
Materials 17 00890 g005
Figure 6. Thermal treatment process used in experiment of investigating the relationship between the crystallization behavior and the first heating rate.
Materials 17 00890 g006
Figure 7. (a) DSC cooling scans and (b) onset crystallization temperature (Tconset) and peak crystallization temperature (Tcpeak) as a function of the temperature ramp rate, which corresponds to the first and secondary cooling segments, respectively. The selected secondary processing melt temperature was 295 °C. (c) The original DSC heating scans and (d) onset remelting temperature (Tmonset) and peak remelting temperature (Tmpeak) as a function of heating rate in the first thermal cycle, which corresponds to the remelting process of spherulites forming in the initial and second crystallization, respectively.
Materials 17 00890 g007
Figure 8. The change in PPS crystalline morphology in the first thermal cycle and the second thermal cycle. (a) The initial heating rate is 40 °C/min. (b) The initial heating rate is 5 °C/min.
Materials 17 00890 g008
Figure 9. (a) DSC cooling scans during the first and second thermal cycles. The corresponding secondary processing melt temperature (Ts) is marked on the left side of the curve. (b) Peak crystallization temperature as a function of the Ts, which corresponds to the cooling segments in the first (Tc1) and second thermal cycle (Tc2), respectively. The first heating rate was set to 10 °C/min, and the initial melting rate was set to 340 °C.
Materials 17 00890 g009
Figure 10. Thermal treatment process used in experiment of investigating the relationship between the crystallization behavior and initial processing melt temperature in the first thermal cycle.
Materials 17 00890 g010
Figure 11. (a) Peak crystallization temperature as a function of the selected initial processing melt temperature (Ts1), which corresponds to the cooling segments in the first (Tc1) and second thermal cycle (Tc2), respectively. (b) The original DSC cooling scans corresponding to the cooling process in two thermal cycle. The corresponding Ts1 is marked on the left side of the curve. The secondary processing melt temperature was set to 295 °C. (c) Peak remelting temperature as a function of the Ts1, which corresponds to the remelting process of spherulites forming in the initial (Tm2) and second crystallization (Tm3), respectively. (d) The original DSC heating scans.
Materials 17 00890 g011
Disclaimer/Publisher’s Note: The statements, opinions and data contained in all publications are solely those of the individual author(s) and contributor(s) and not of MDPI and/or the editor(s). MDPI and/or the editor(s) disclaim responsibility for any injury to people or property resulting from any ideas, methods, instructions or products referred to in the content.

