
Effects of Thermal Exposure on the Microstructure and Mechanical Properties of a Ti–48Al–3Nb–1.5Ta Alloy via Powder Hot Isostatic Pressing


 ,
,  ,
,
Abstract
1. Introduction
2. Materials and Methods
3. Results and Discussions
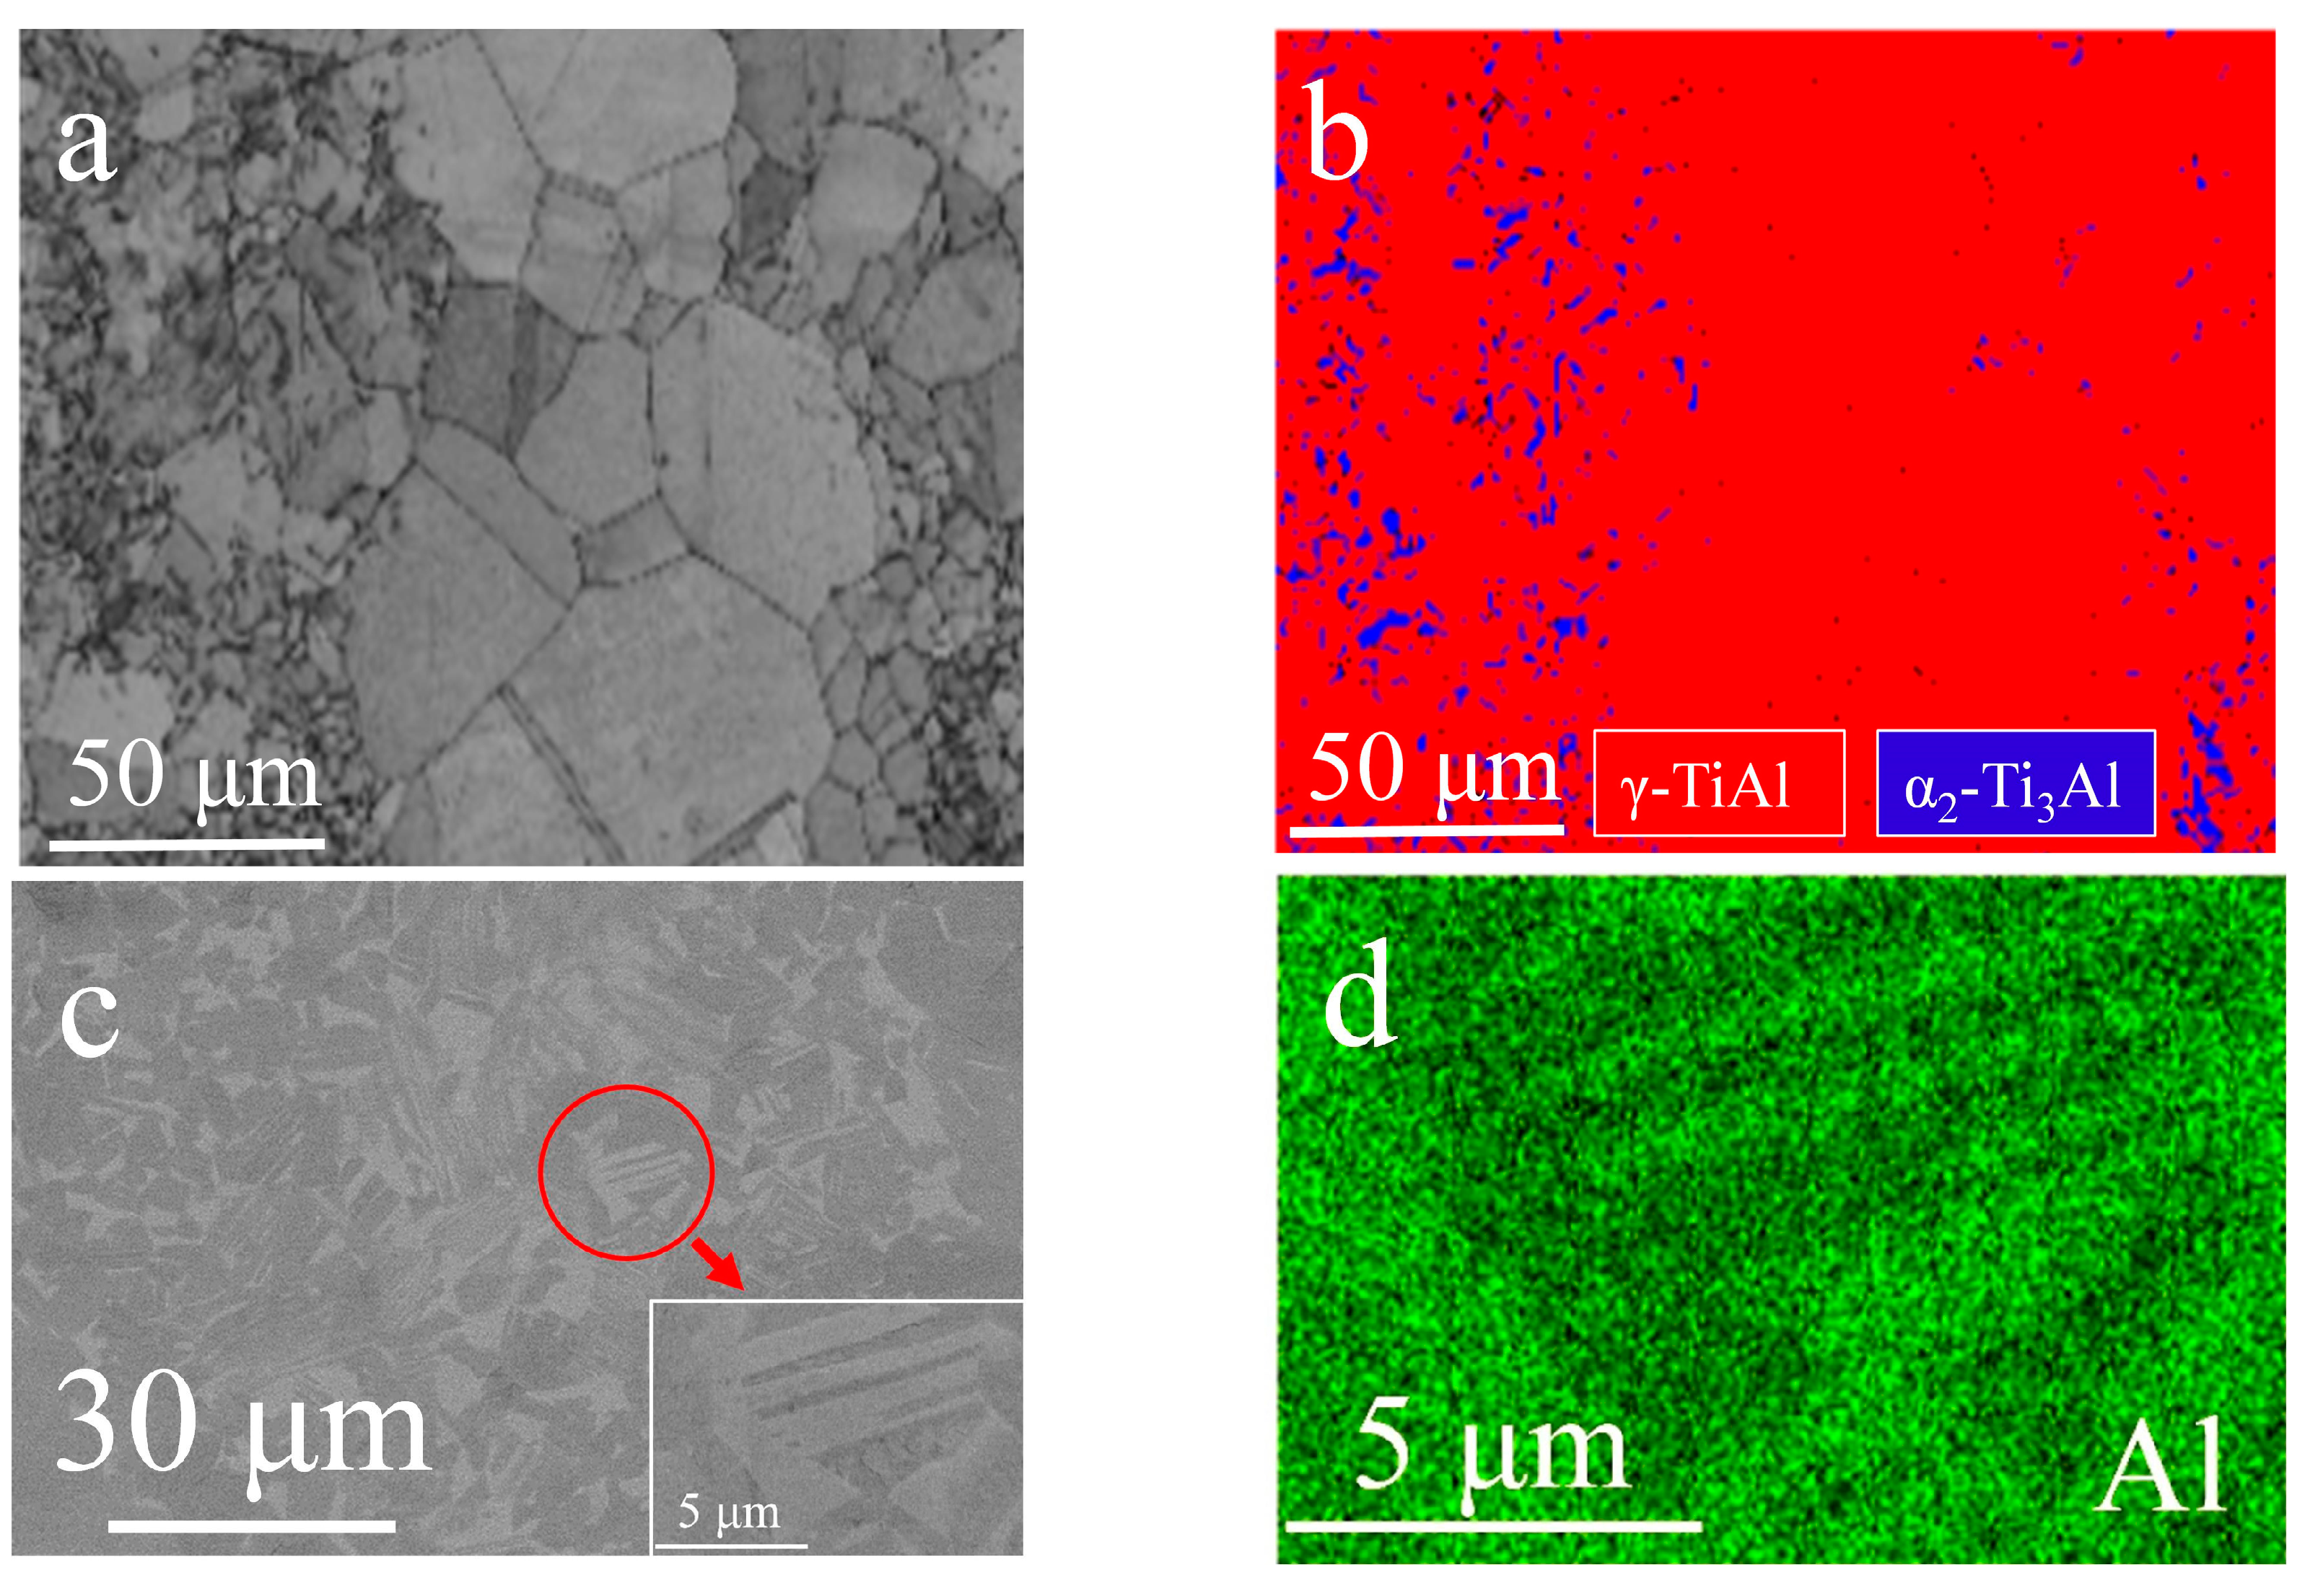
3.1. Microstructures of the P–HIP Ti–48Al–3Nb–1.5Ta Alloy
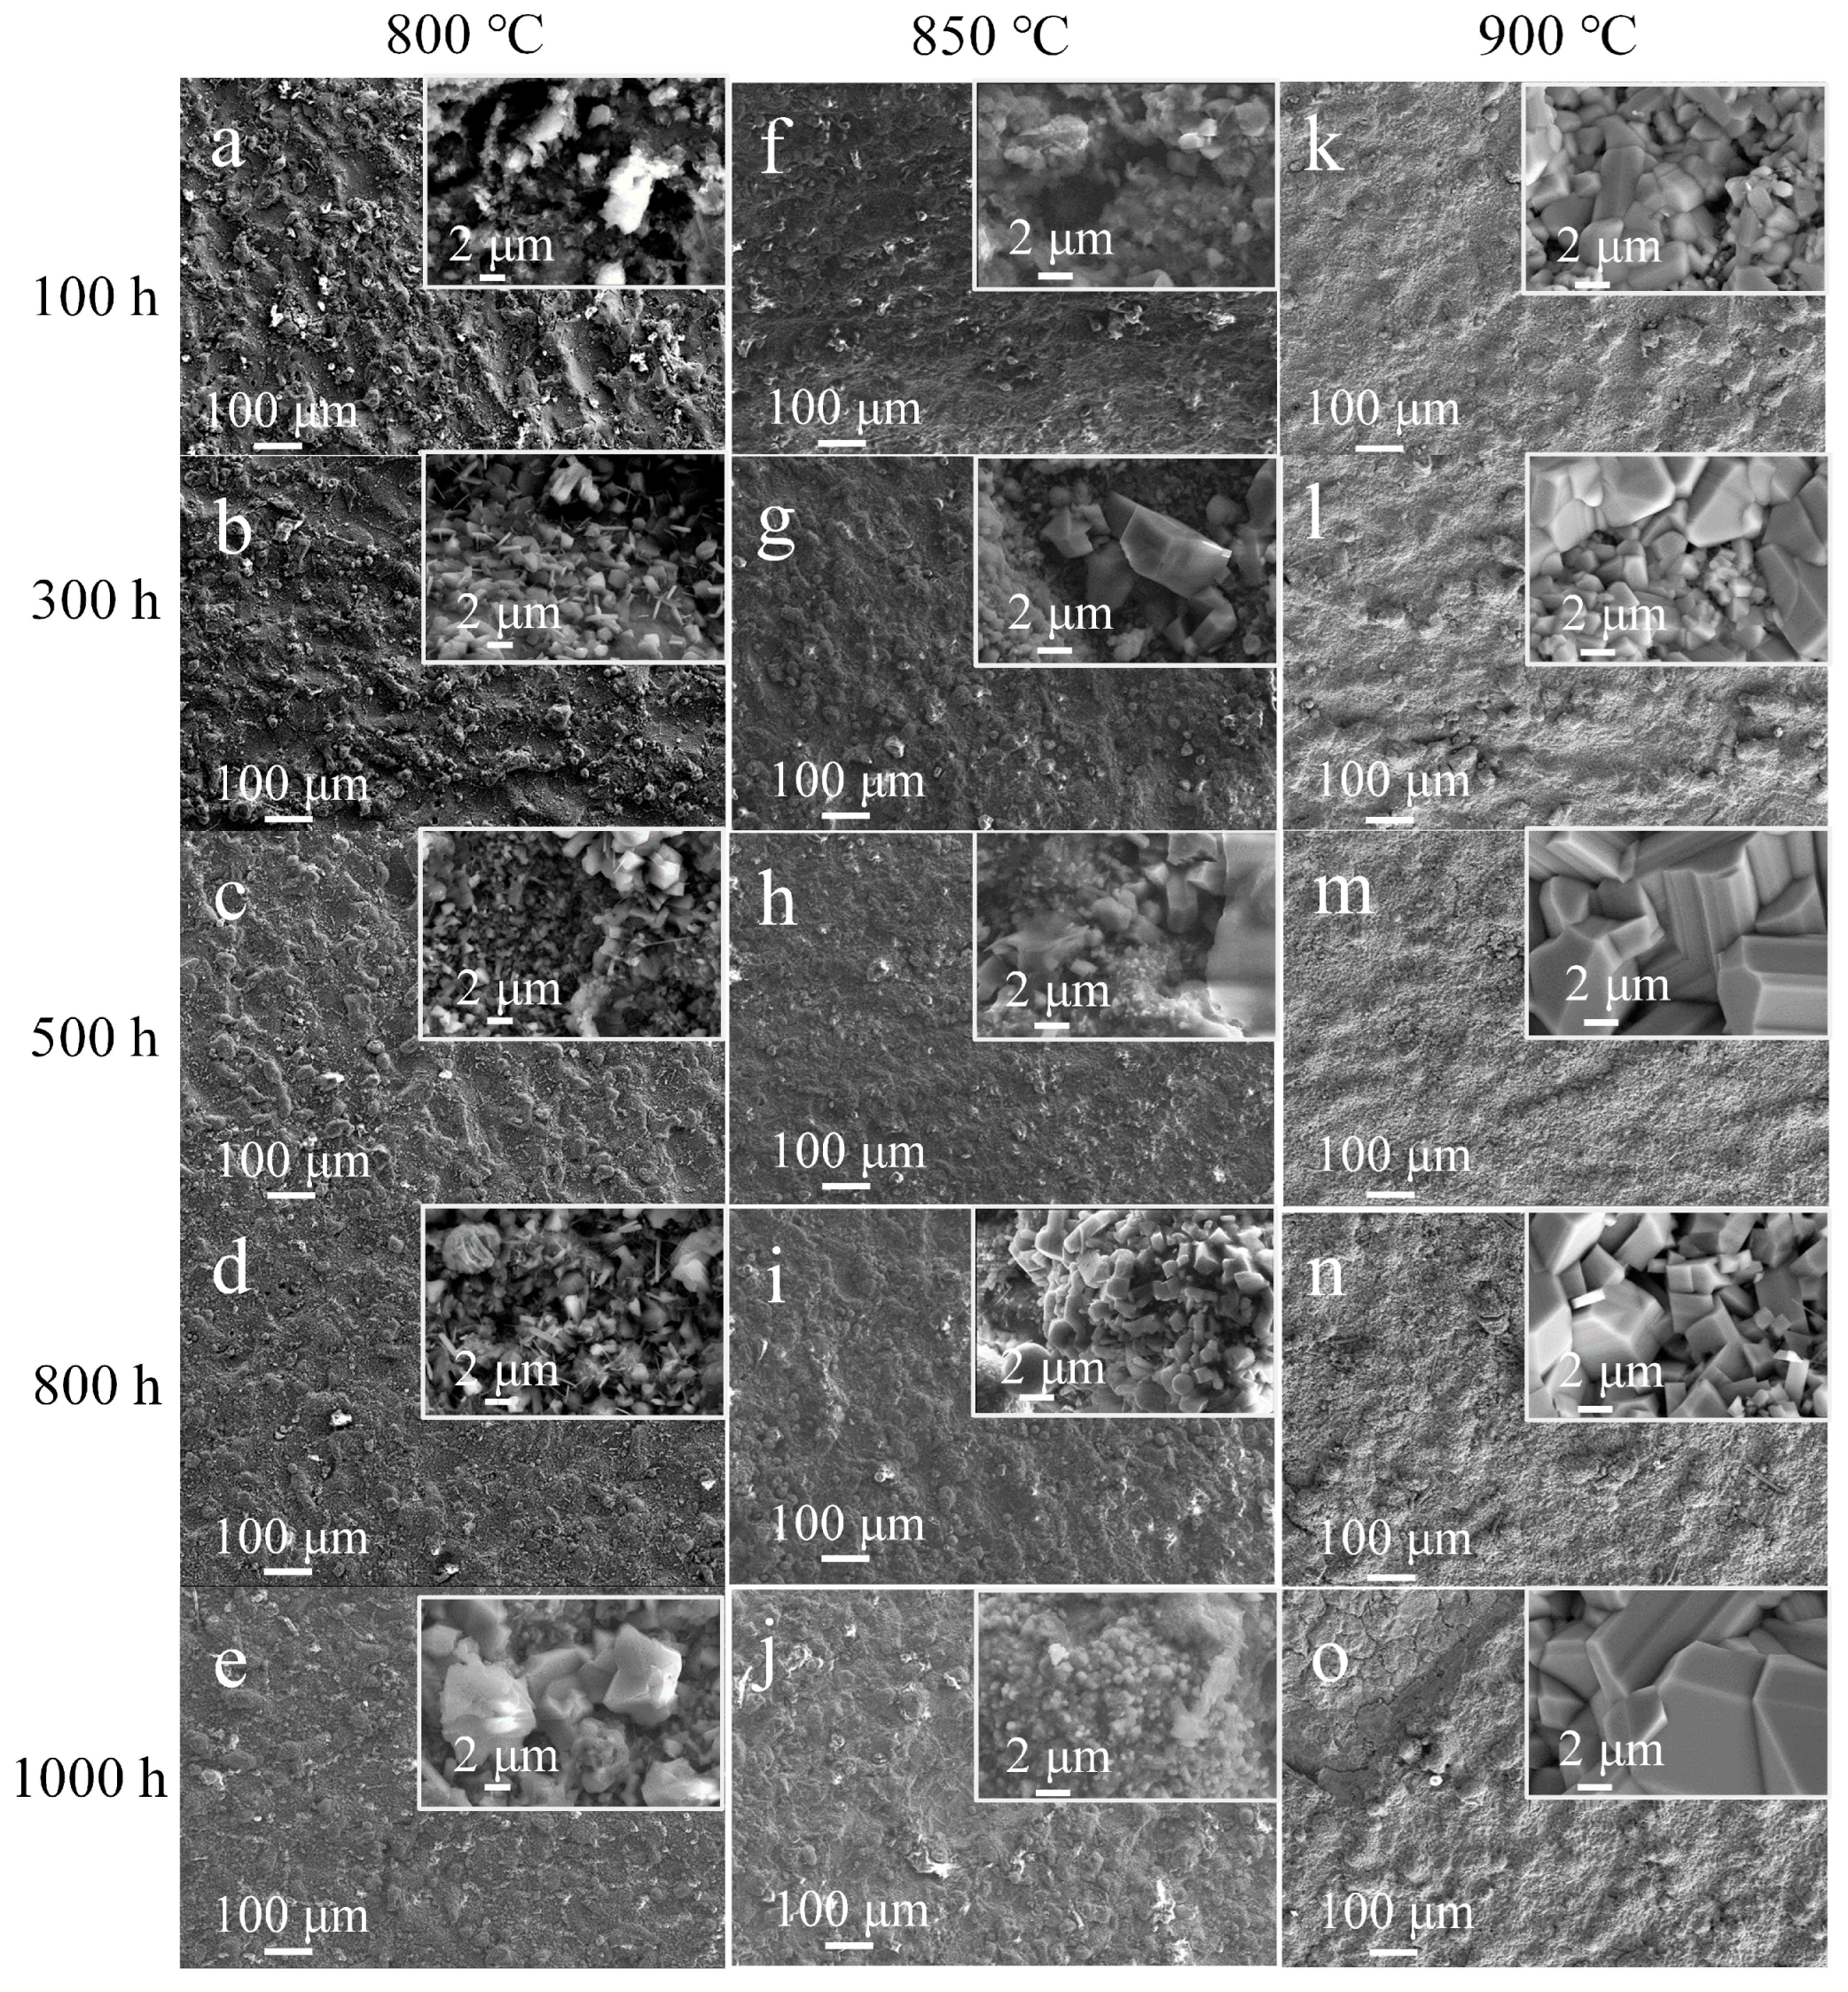
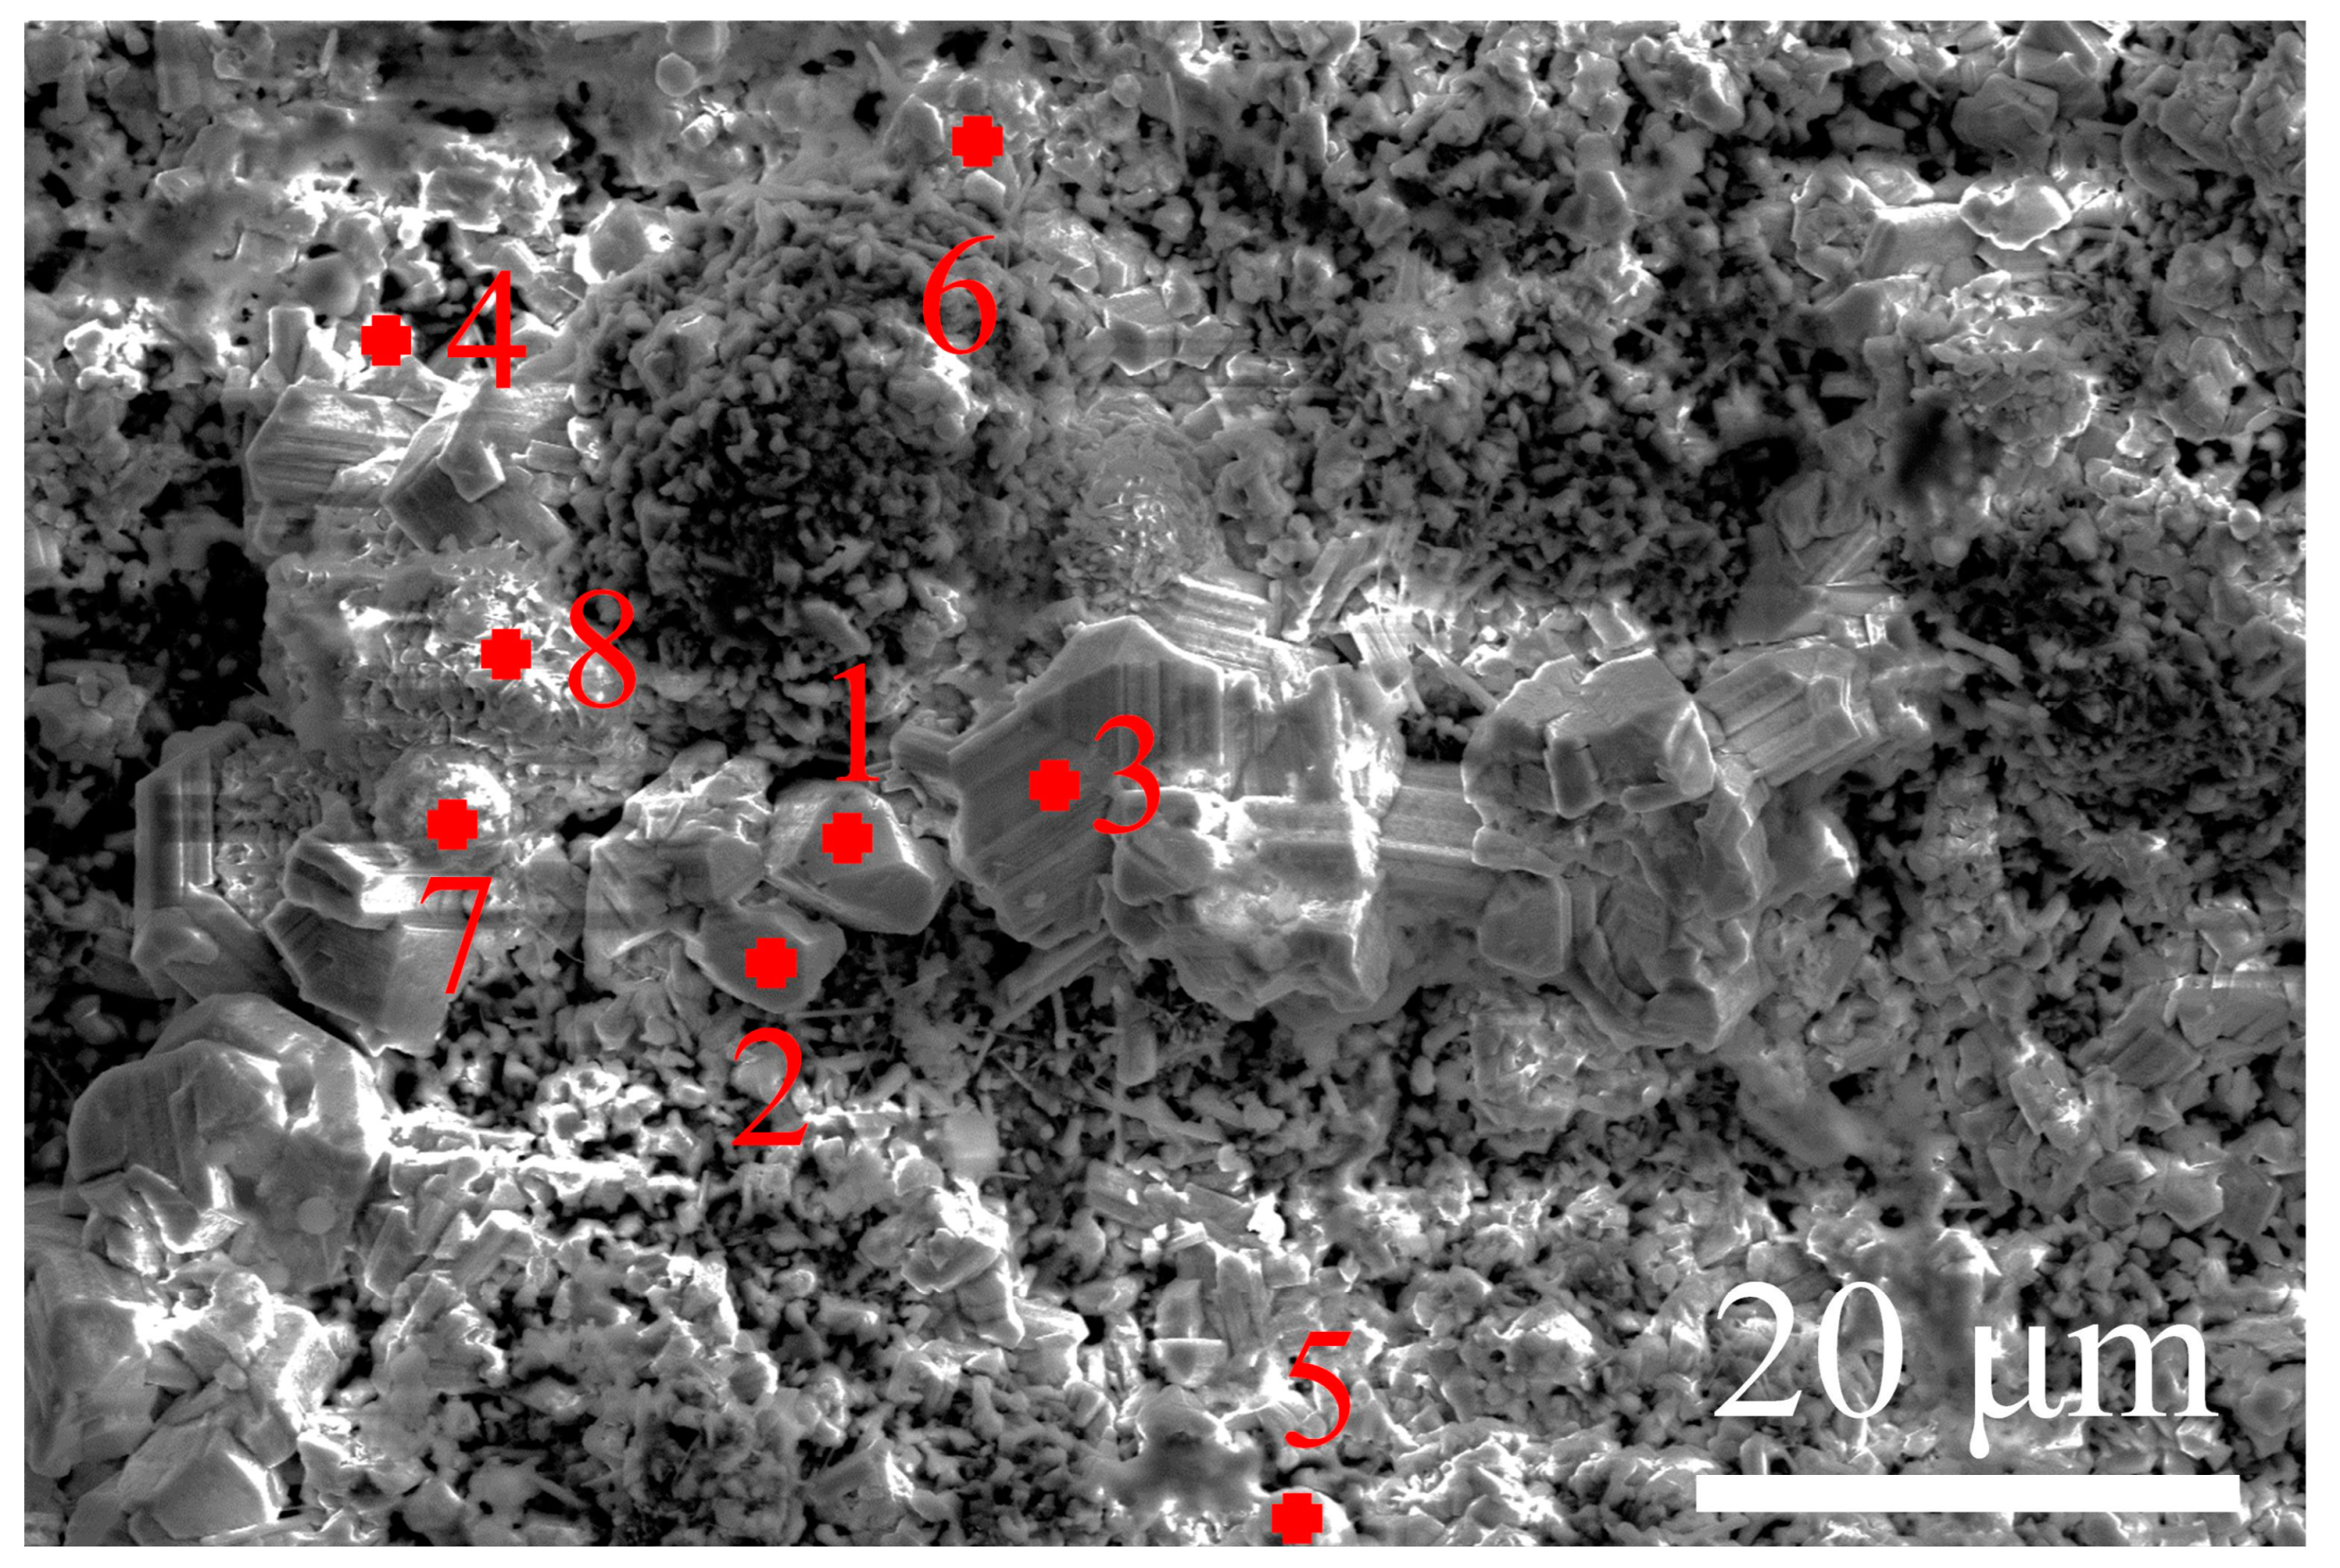
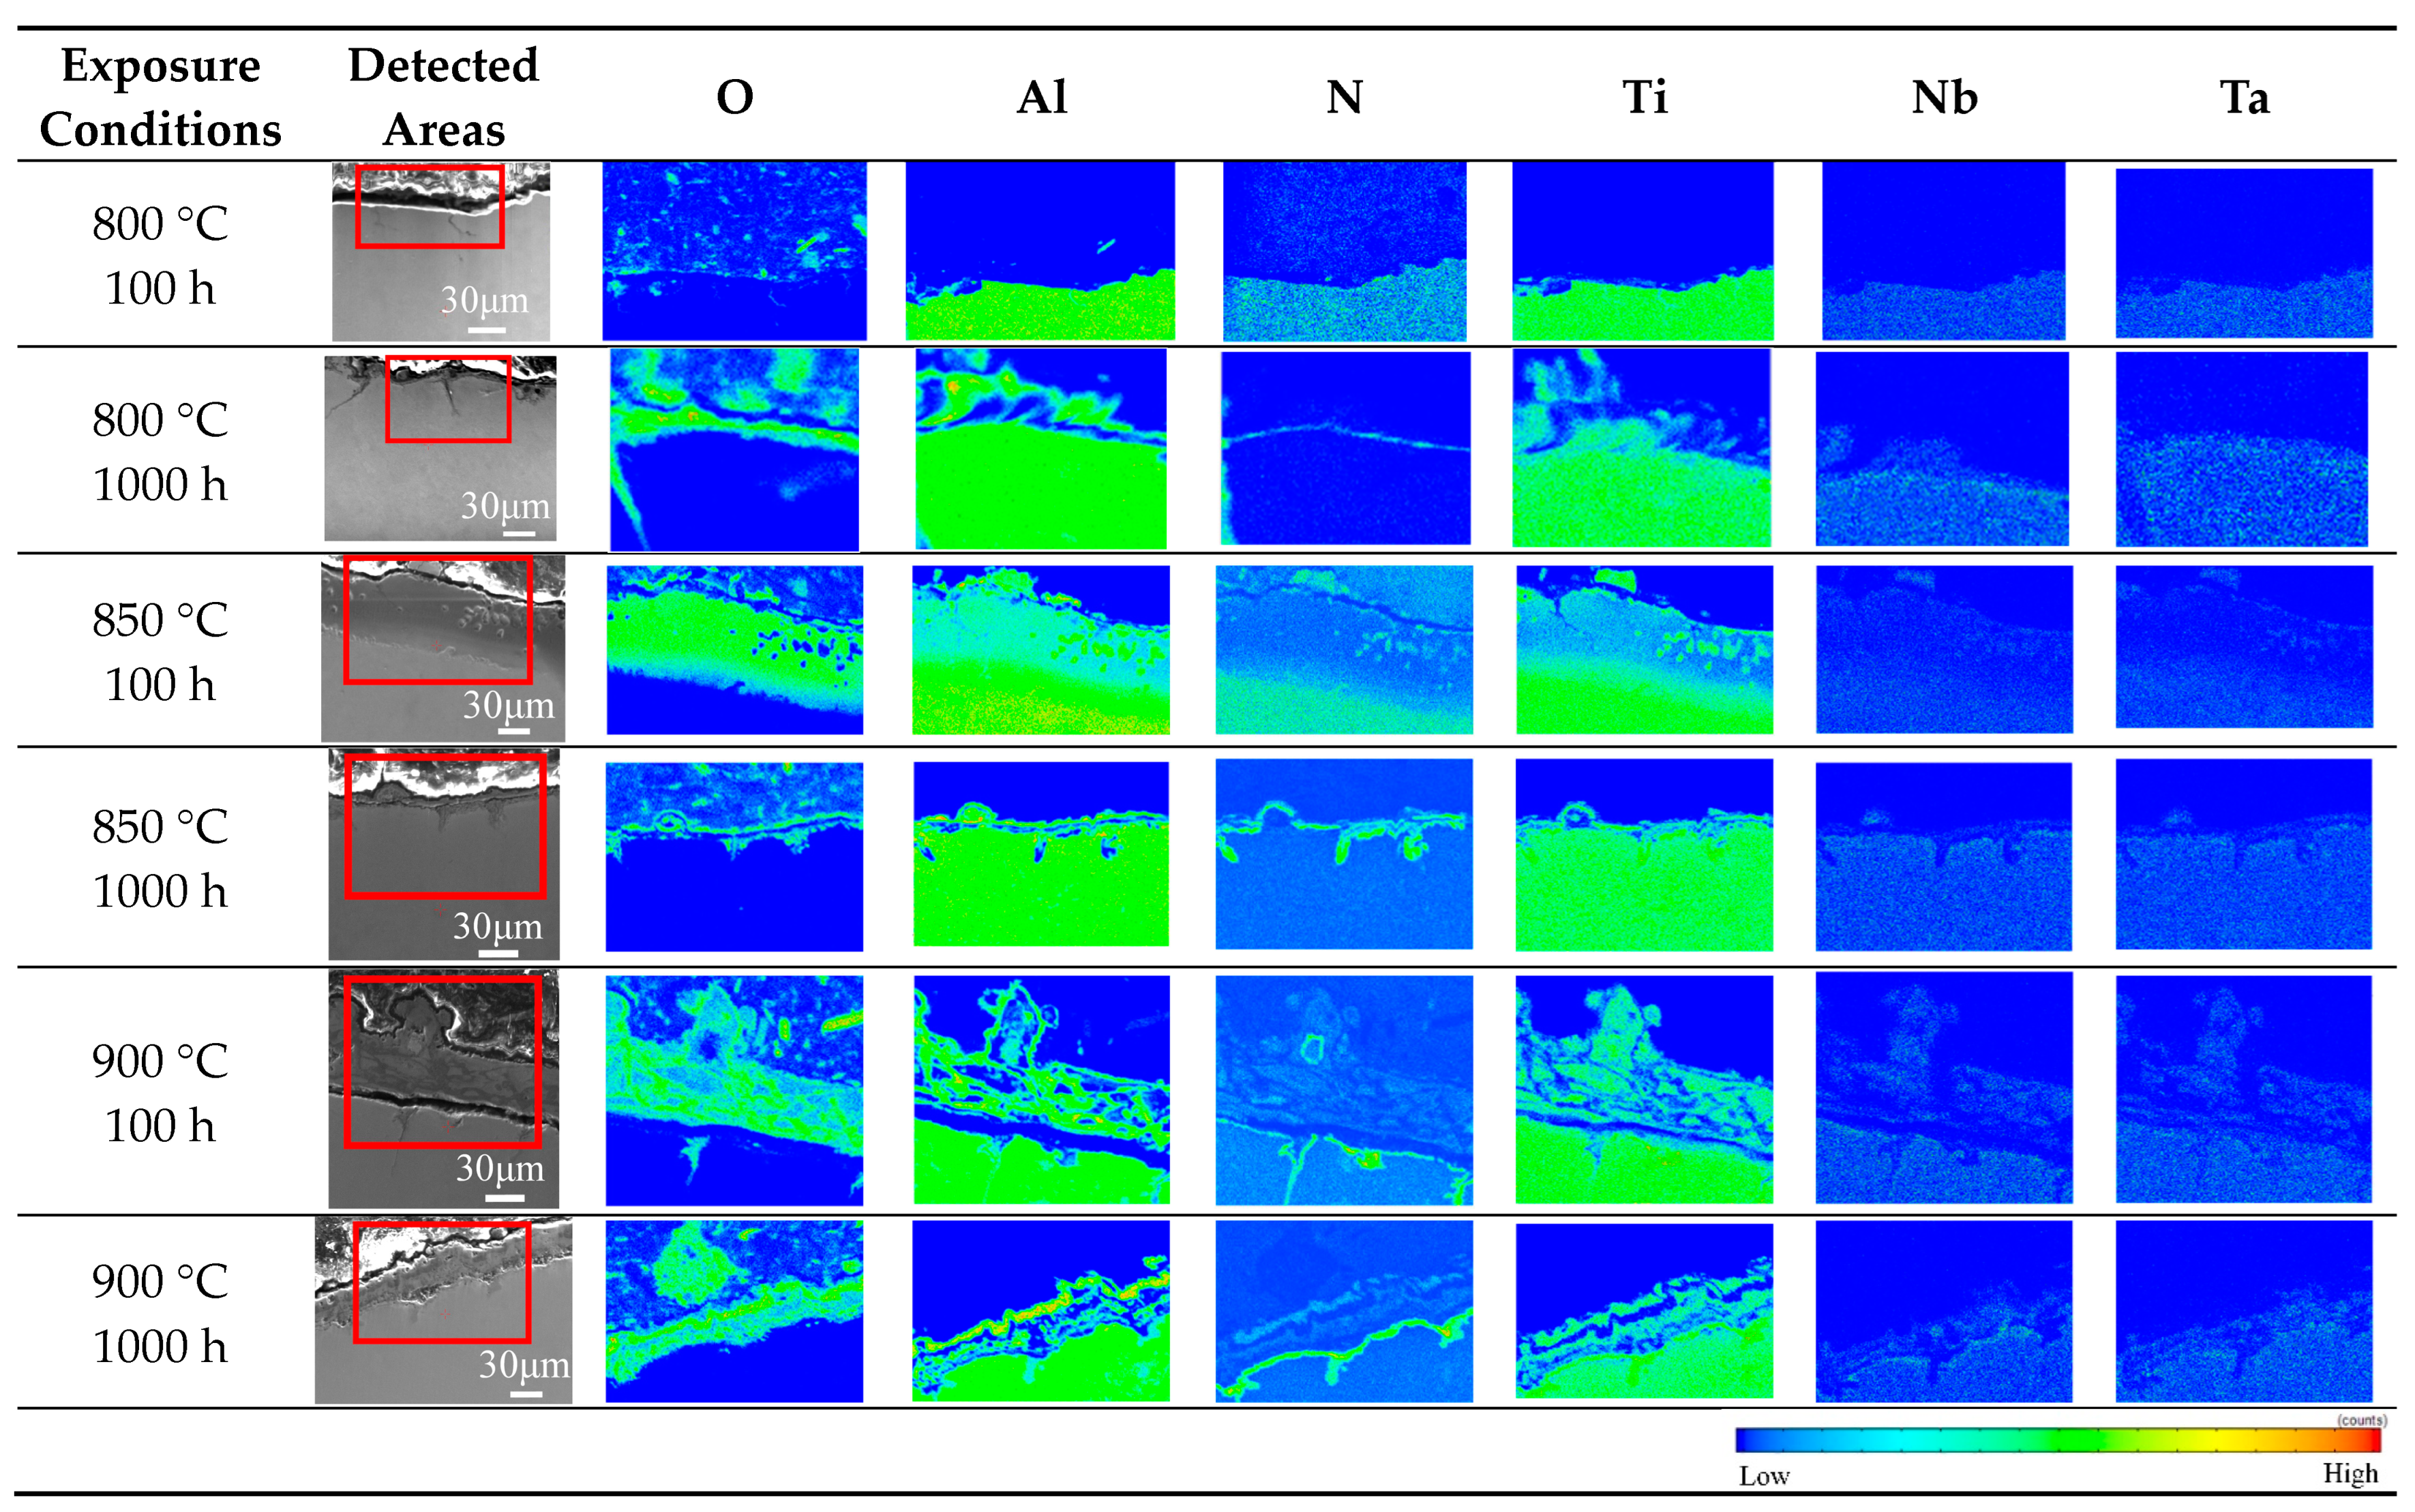
3.2. Characterization of the Surface Scale
3.3. Microstructure Stability
3.4. Mechanical Performance
4. Conclusions
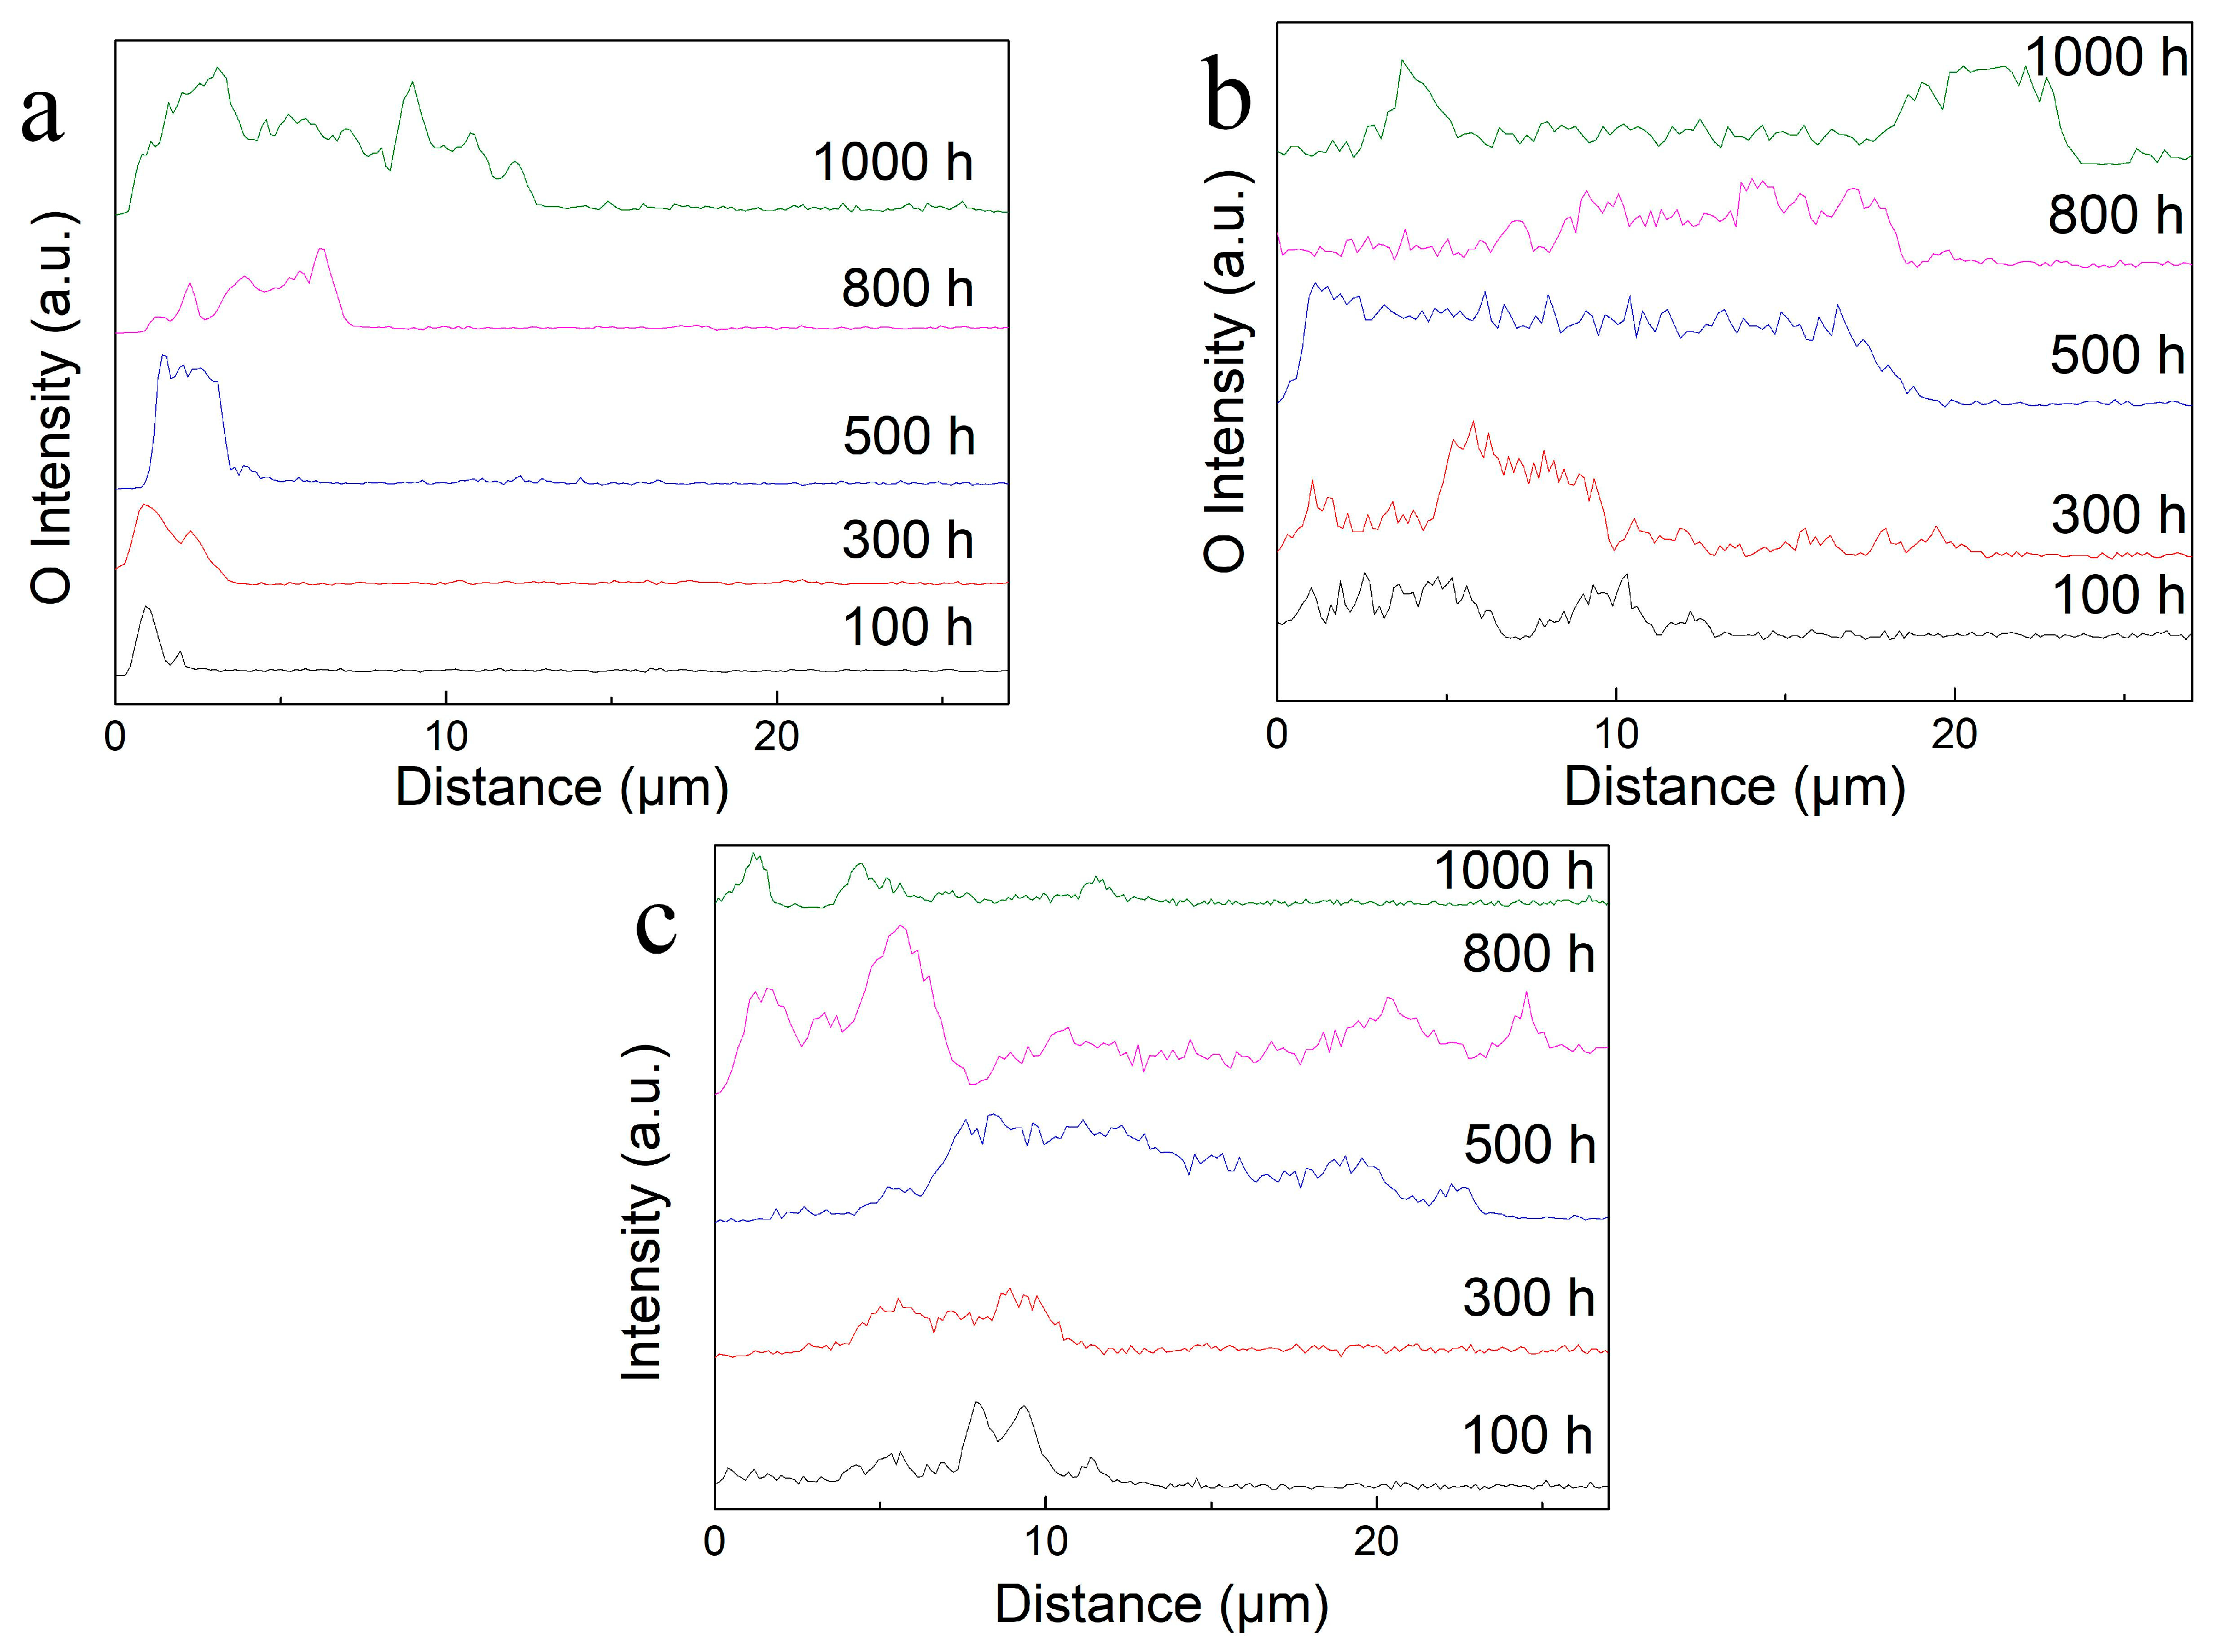
- The surface scale is composed of oxides and nitrides, mainly Al2O3, TiO2, TiN and Ti2AlN; among these, Al2O3 is preferentially generated and then covered by rapidly growing TiO2 as the thermal exposure duration increases. The nitrides appear later than the oxides and exist between the oxide layer and the substrate. With increasing thermal exposure temperature and duration, the surface scale becomes more continuous, the prismatic TiO2 particles grow larger, and the oxide layer thickens. The average size of the TiO2 particles increased from 1.74 μm to 4.02 μm while the maximum size increased from 4.96 μm to 12.70 μm, with the shape changing from equiaxed particles to elongated particles, as the exposure duration extended from 100 h to 1000 h at the exposure temperature of 900 °C;
- The addition of Ta and Nb can improve the oxidation resistance of TiAl alloys, and the oxidation resistance of Ti–48Al–3Nb–1.5Ta alloy is superior to that of the Ti–47.5Al–2.5V–1.0Cr–0.2Zr alloy, because Ta5+ and Nb5+ replace Ti4+ in the rutile lattice and weaken O diffusion, thus impeding the oxidation process;
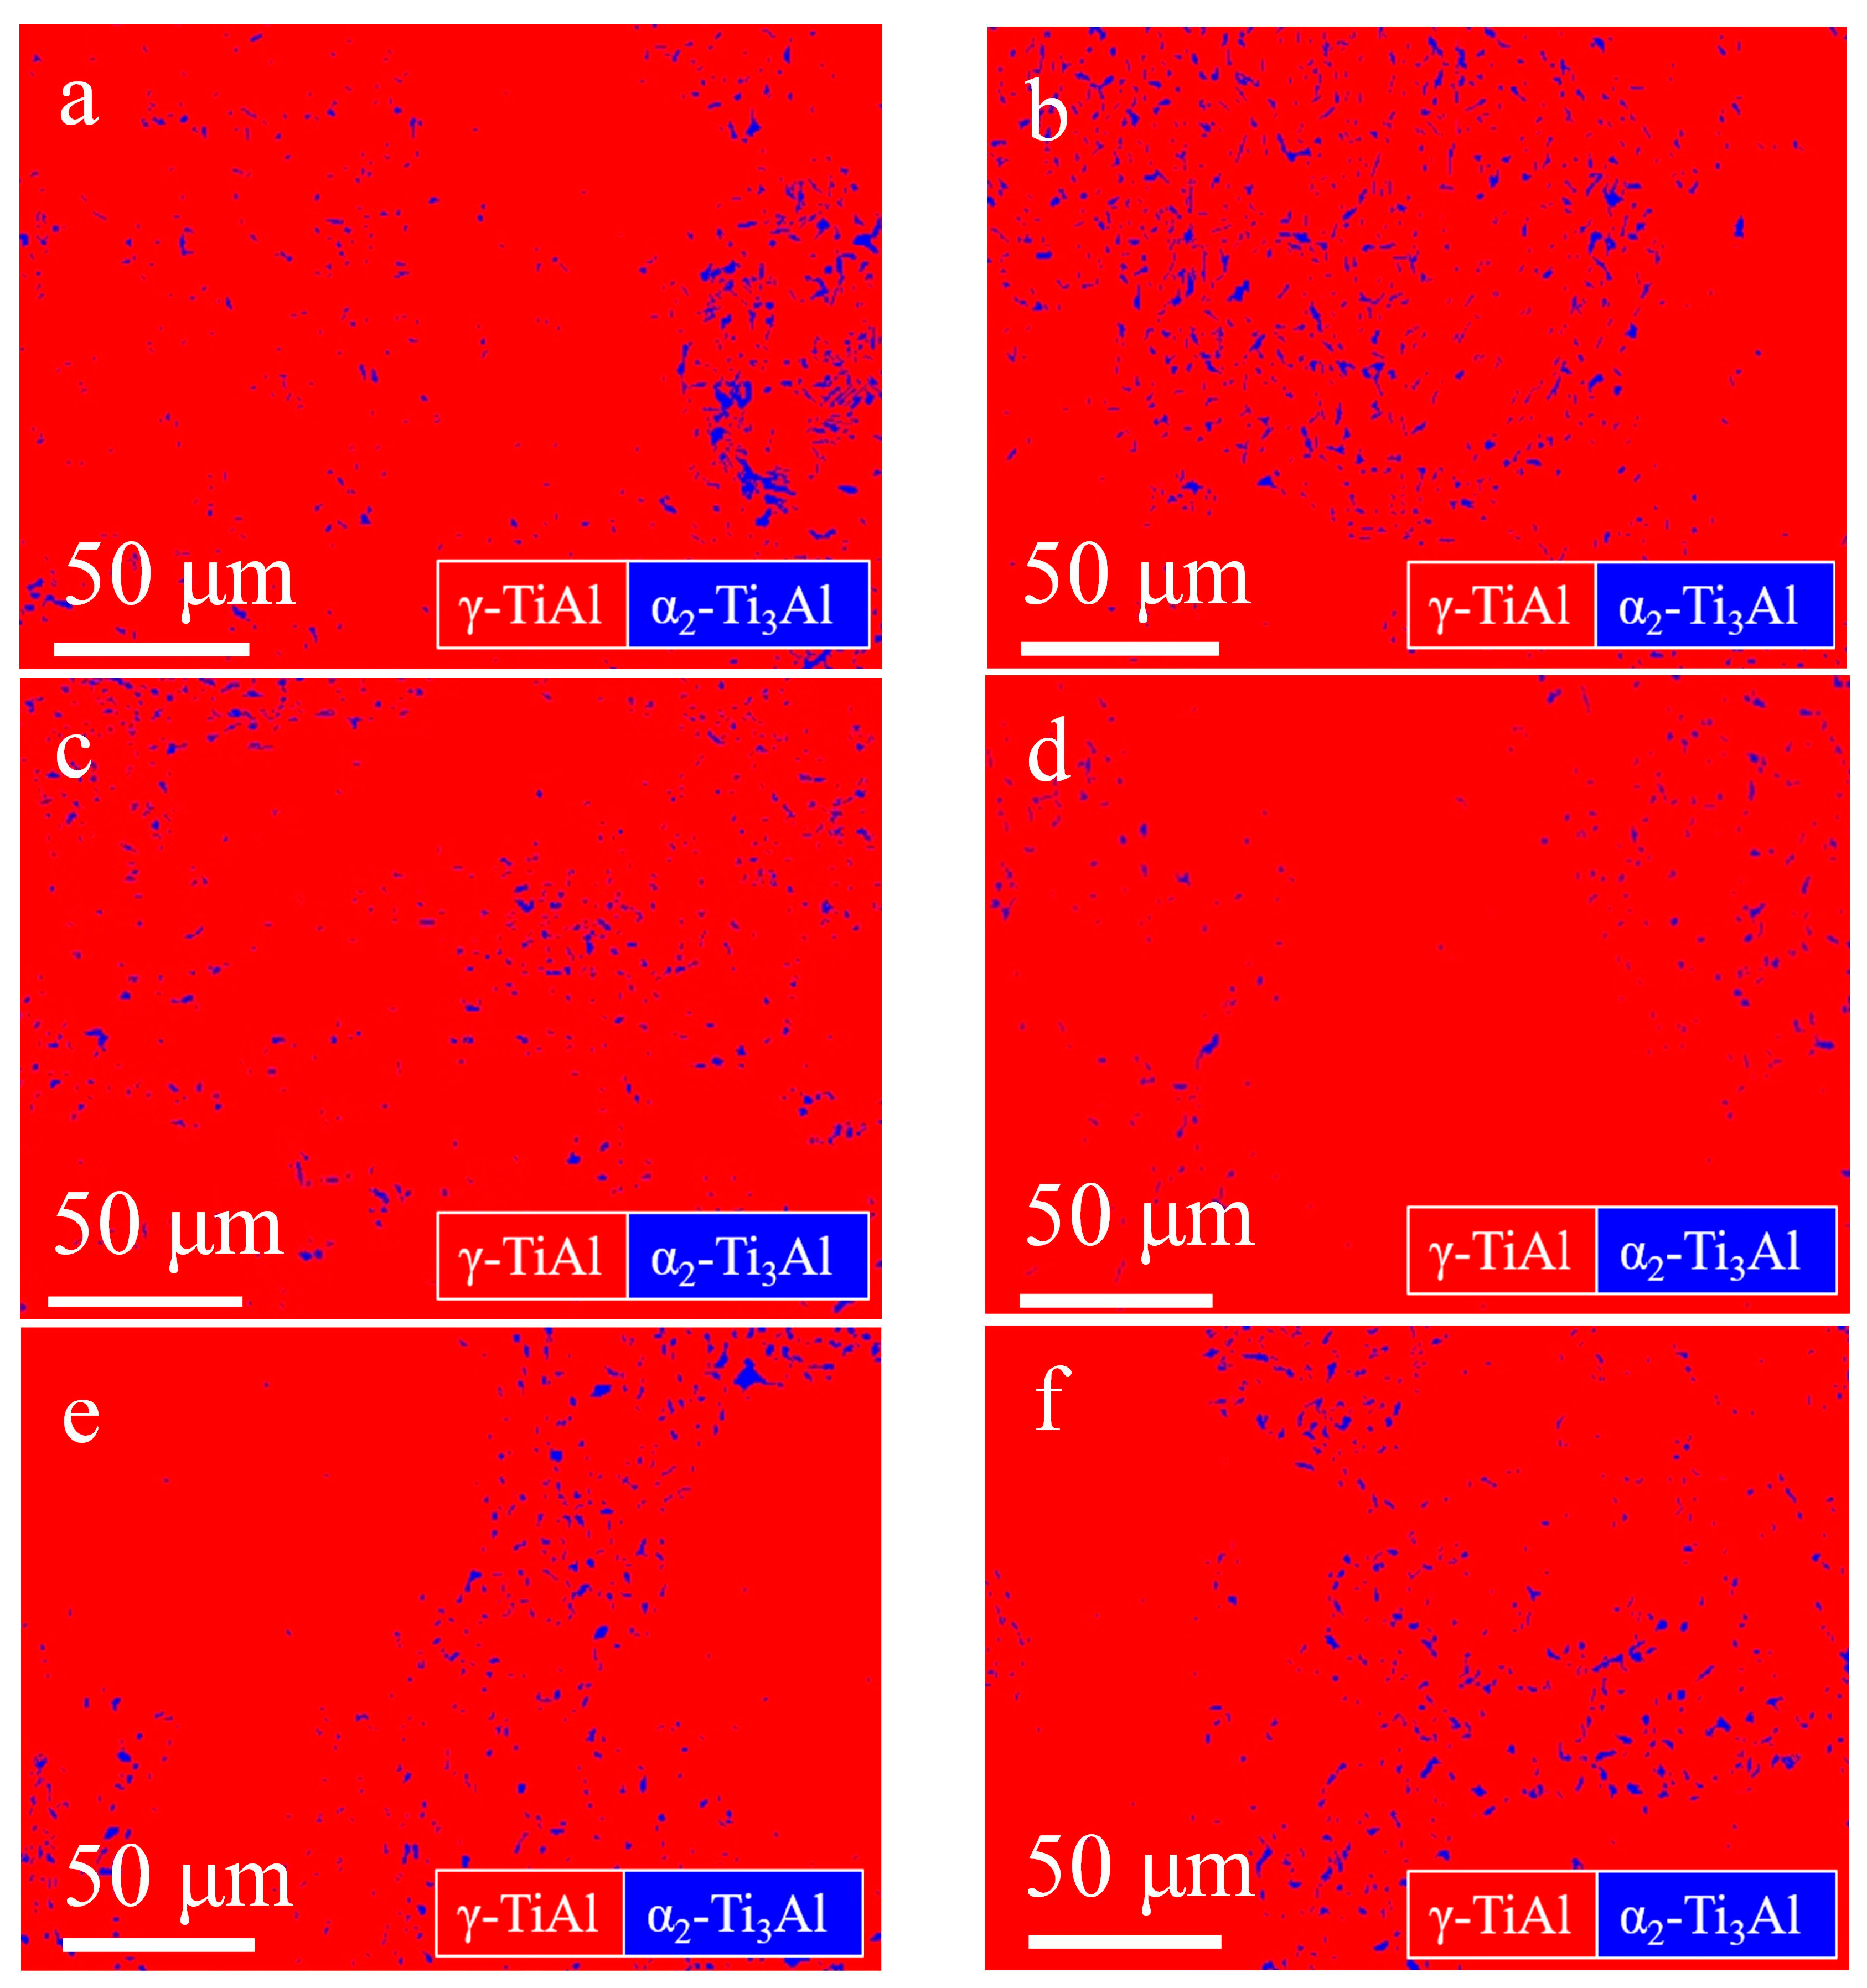
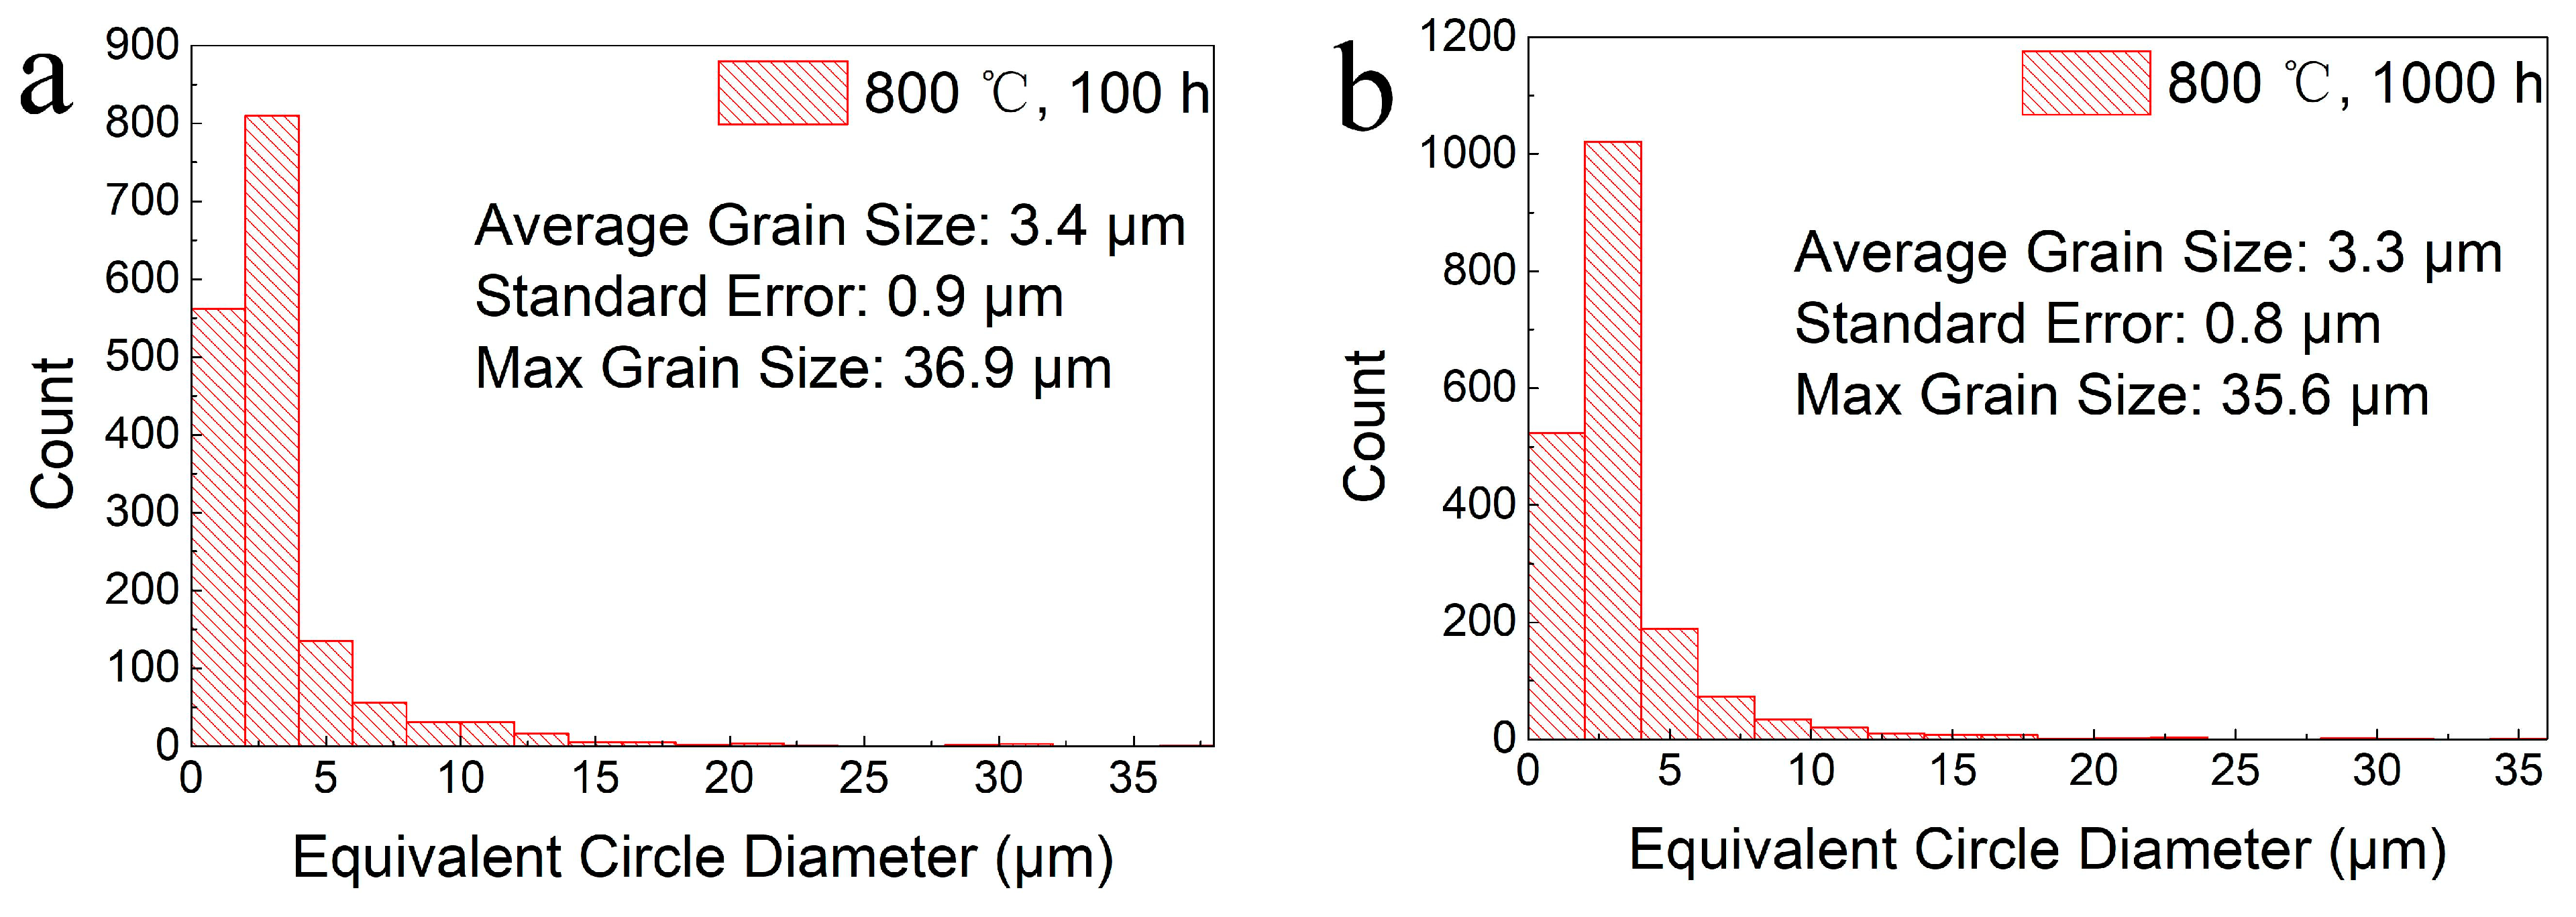
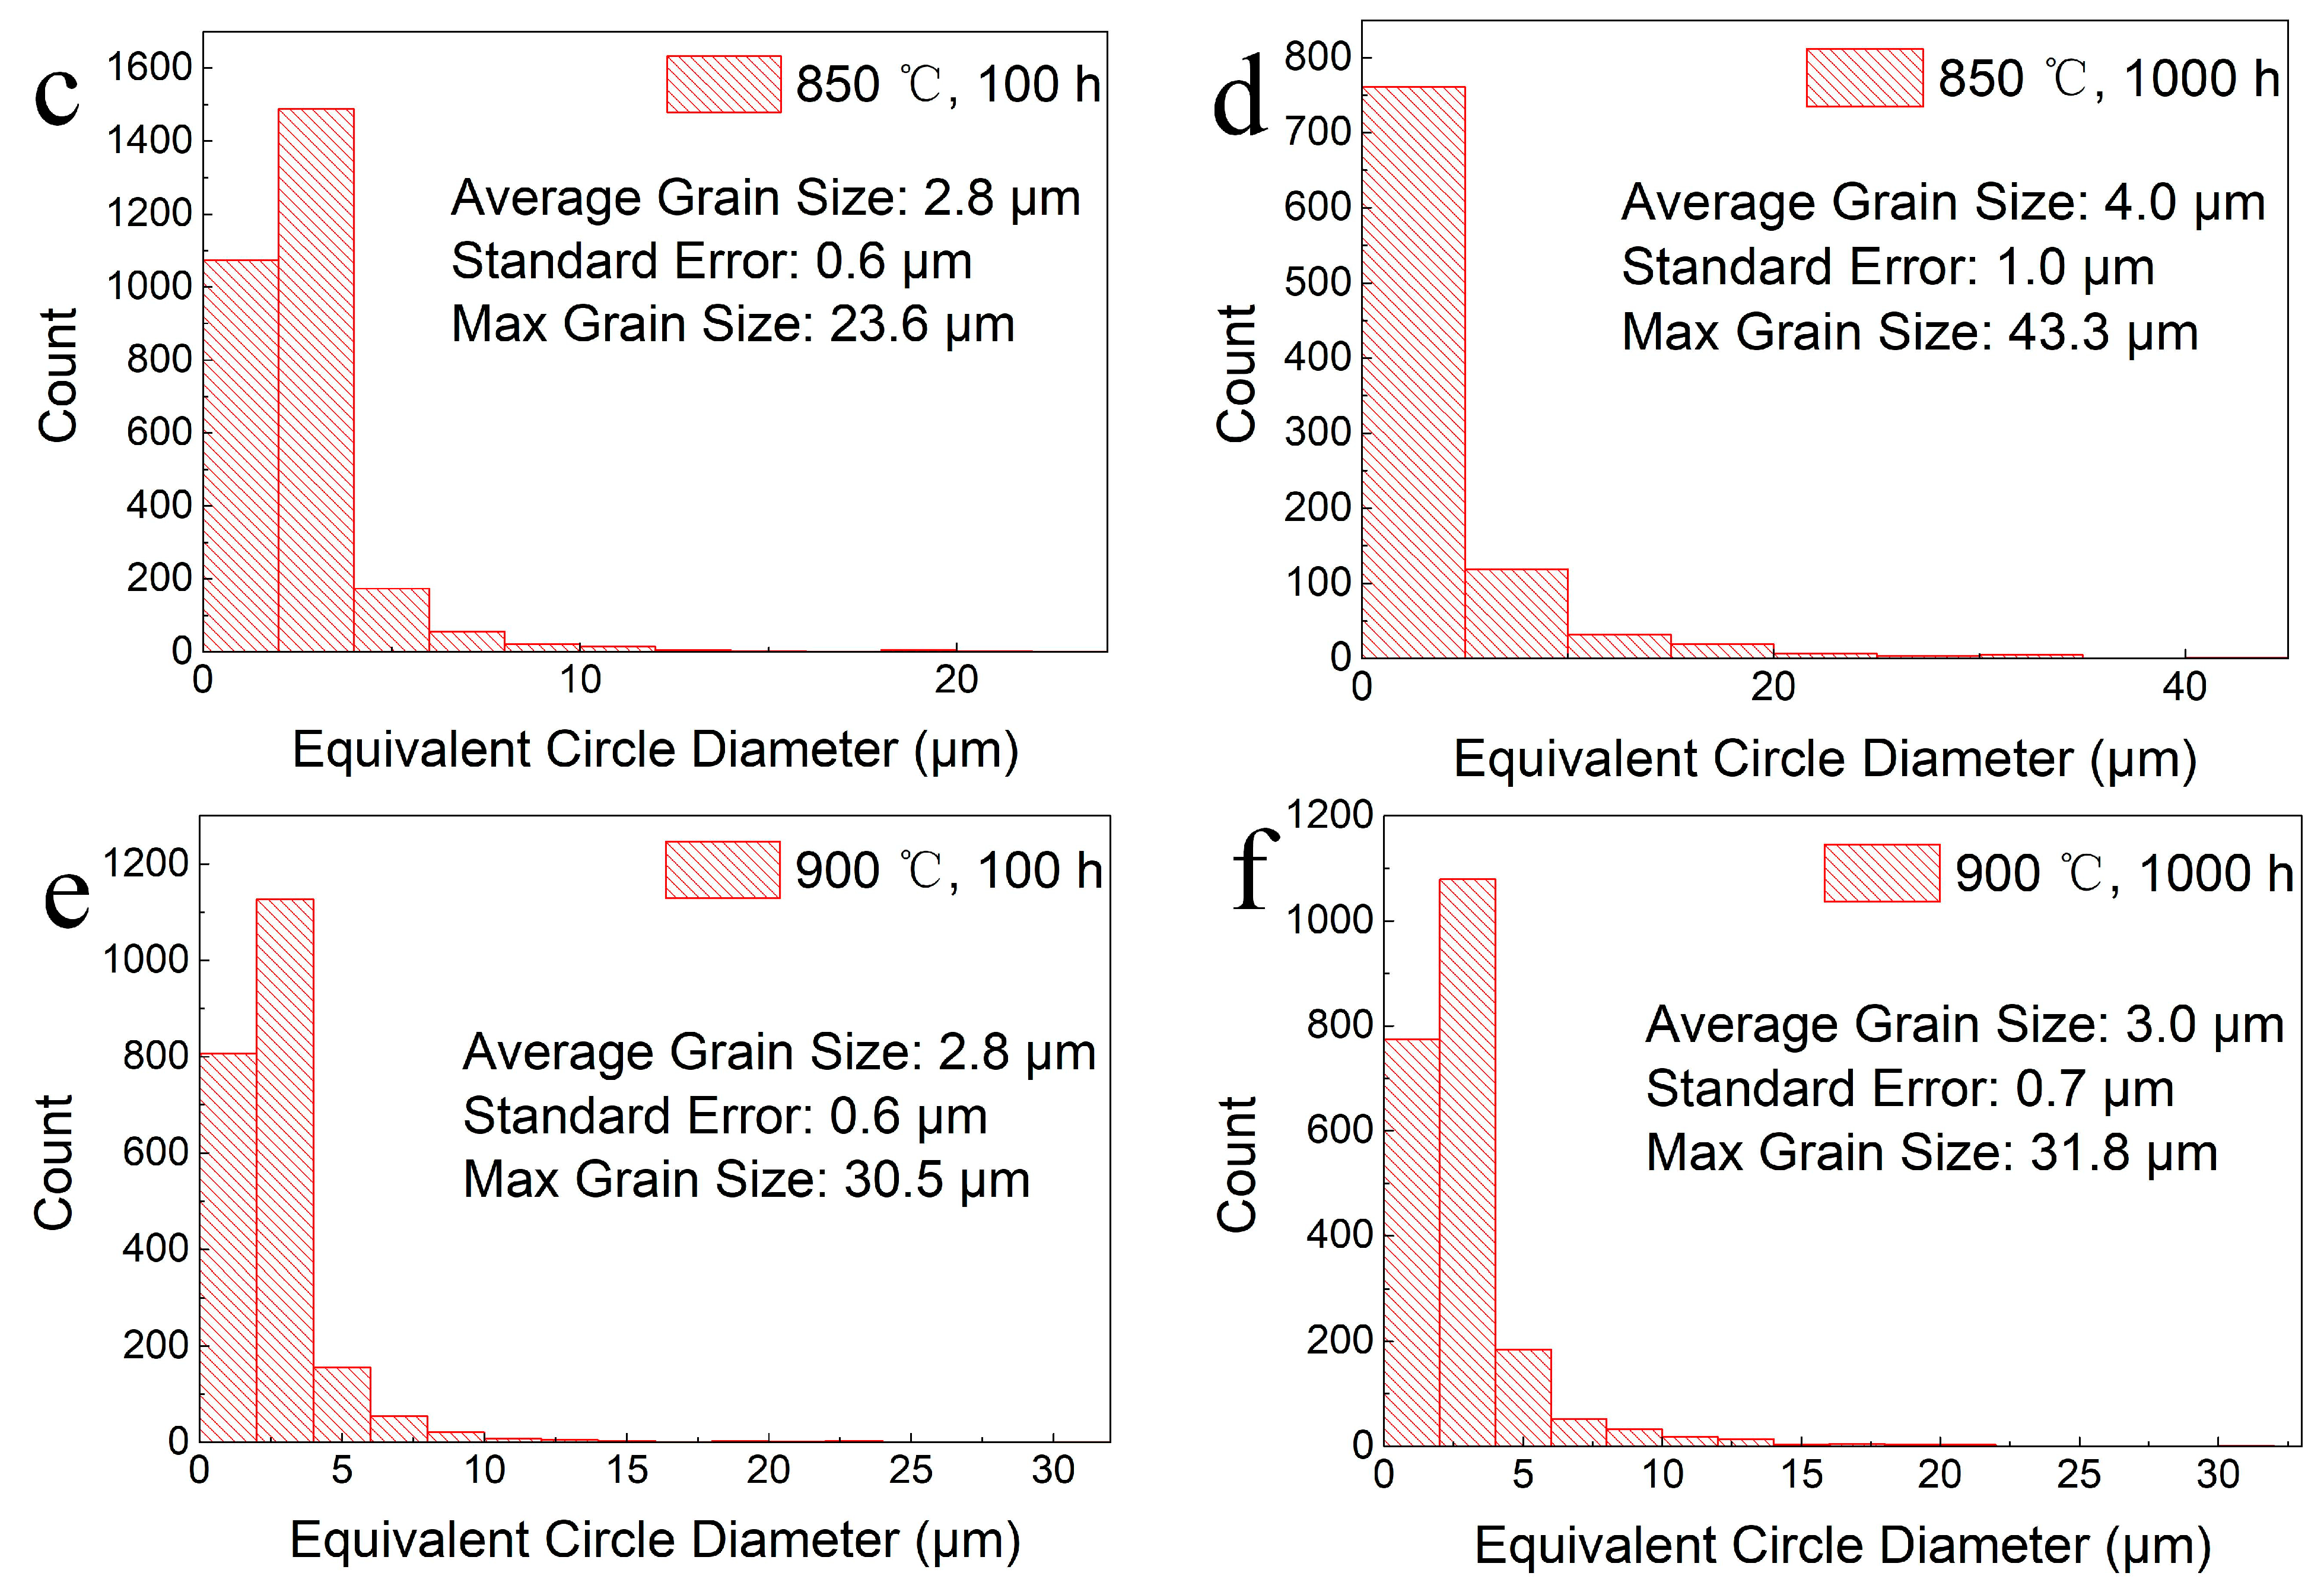
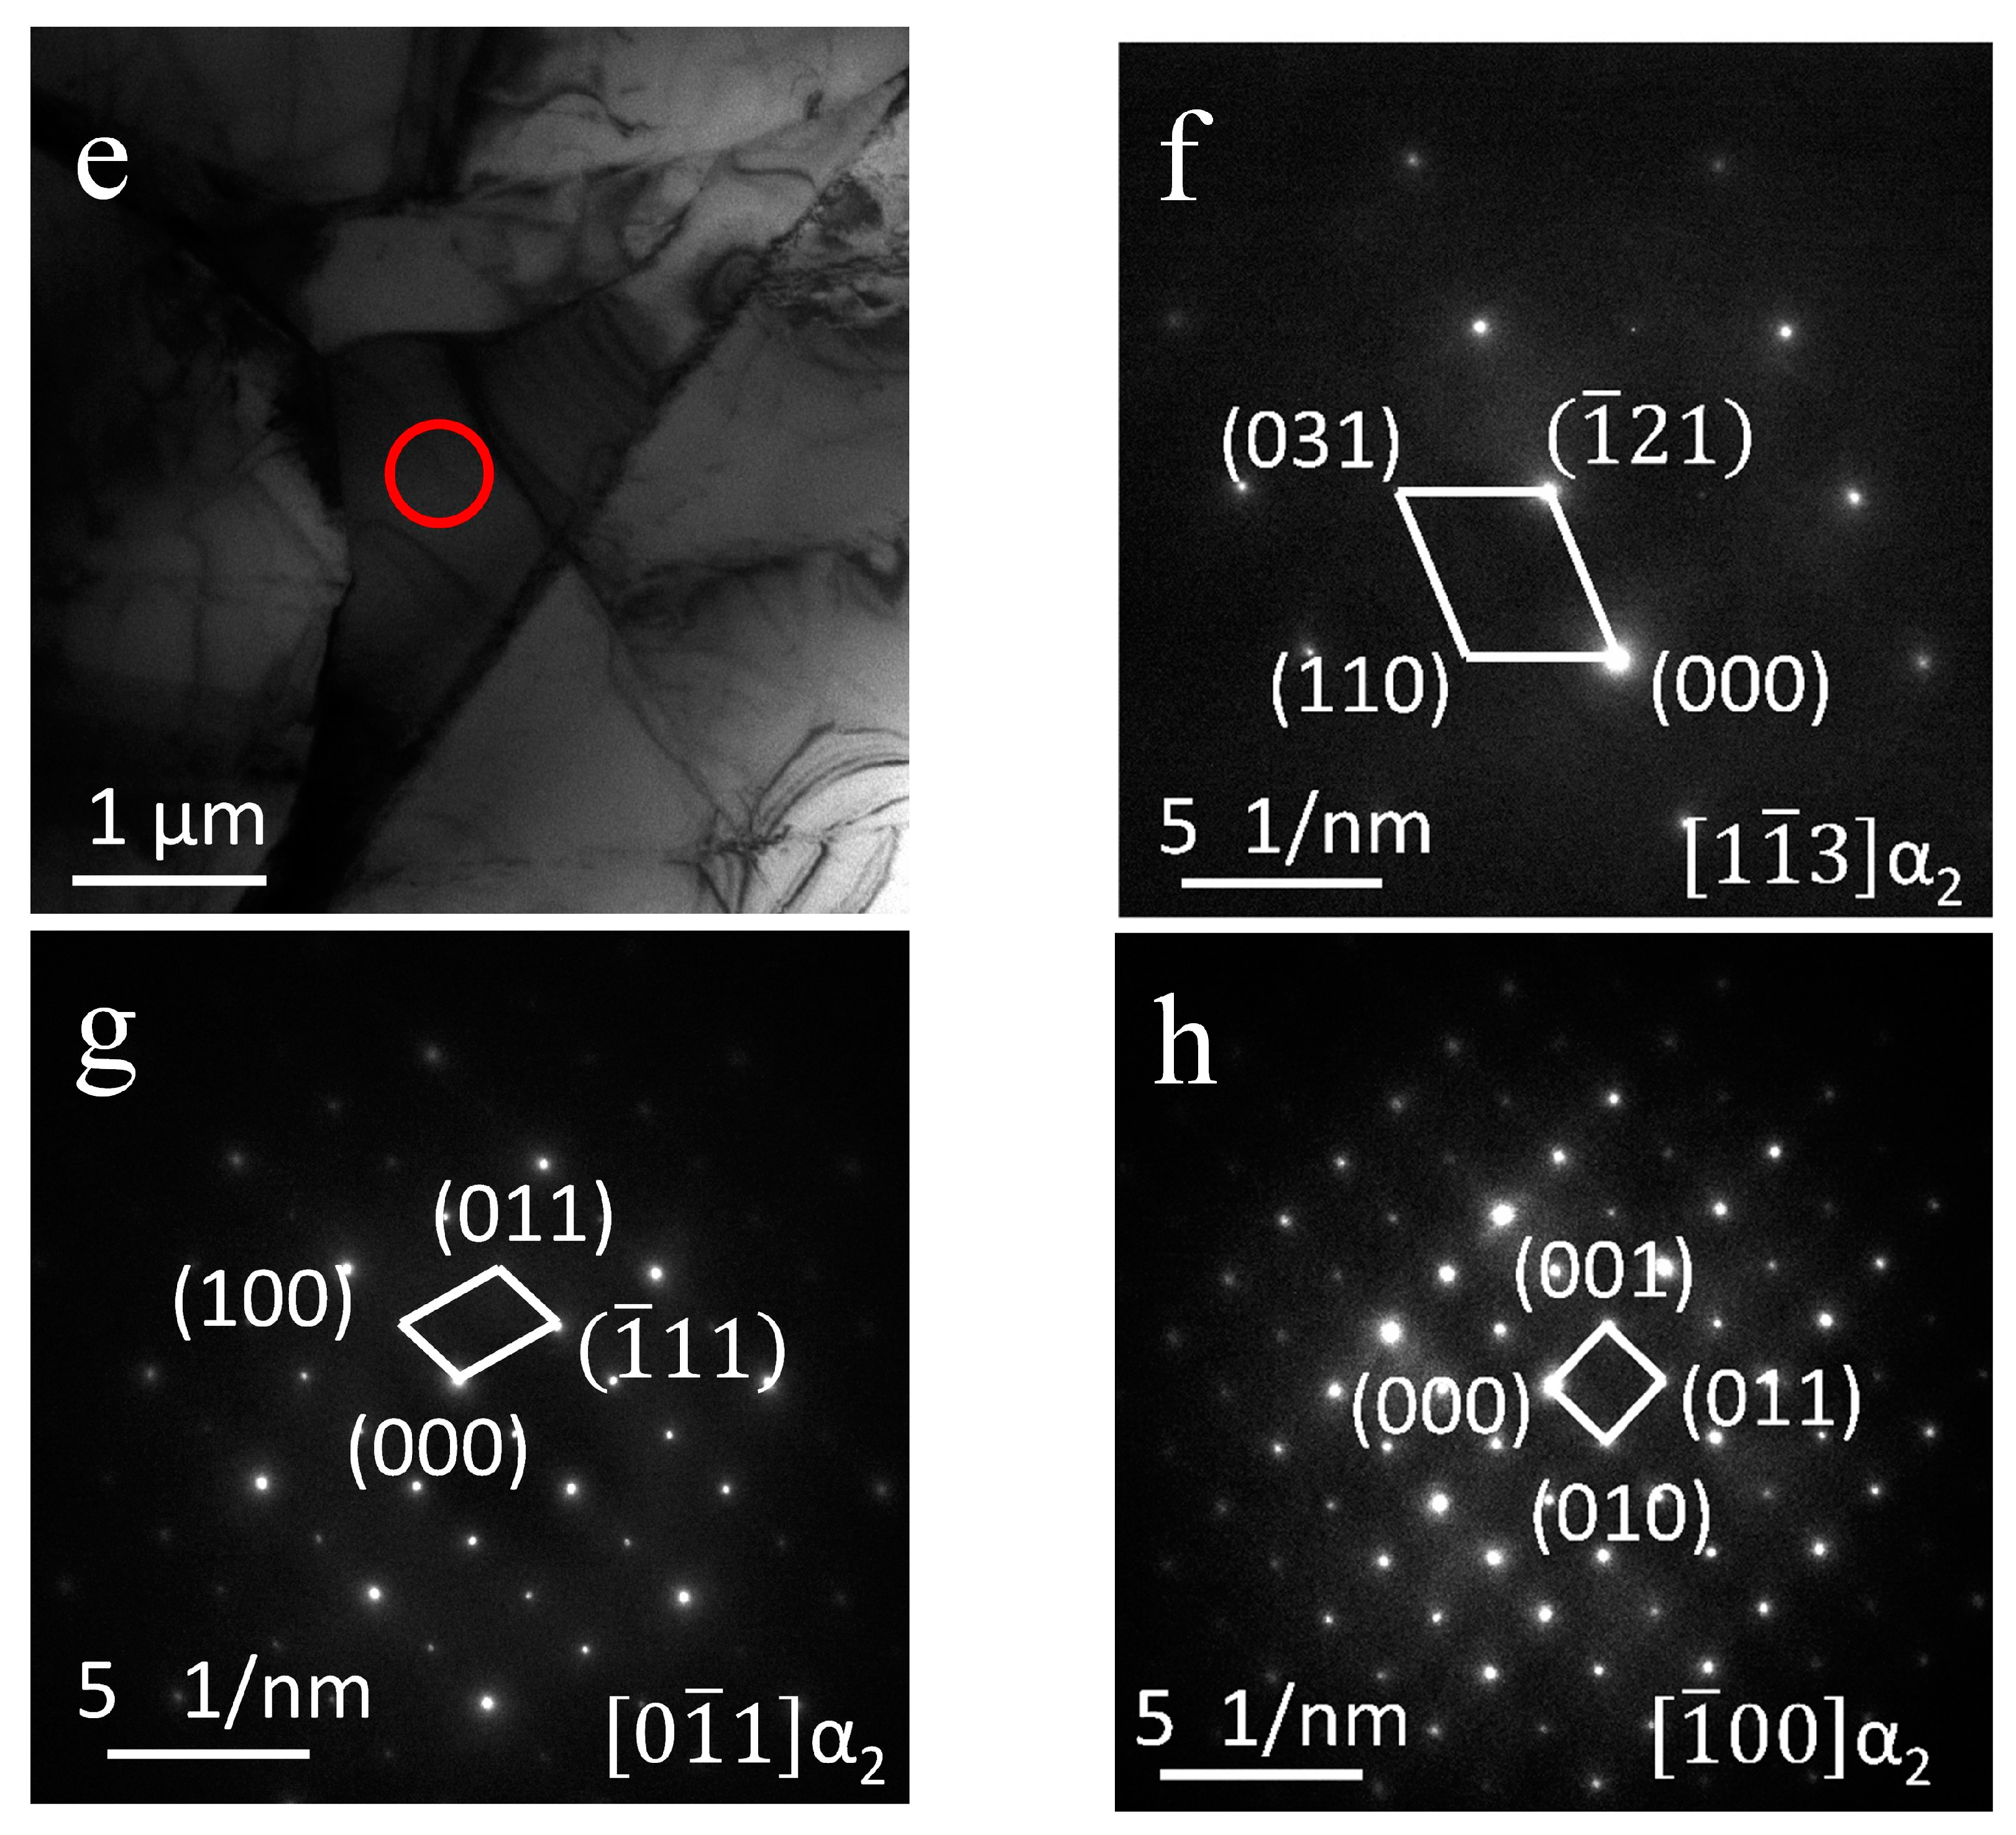
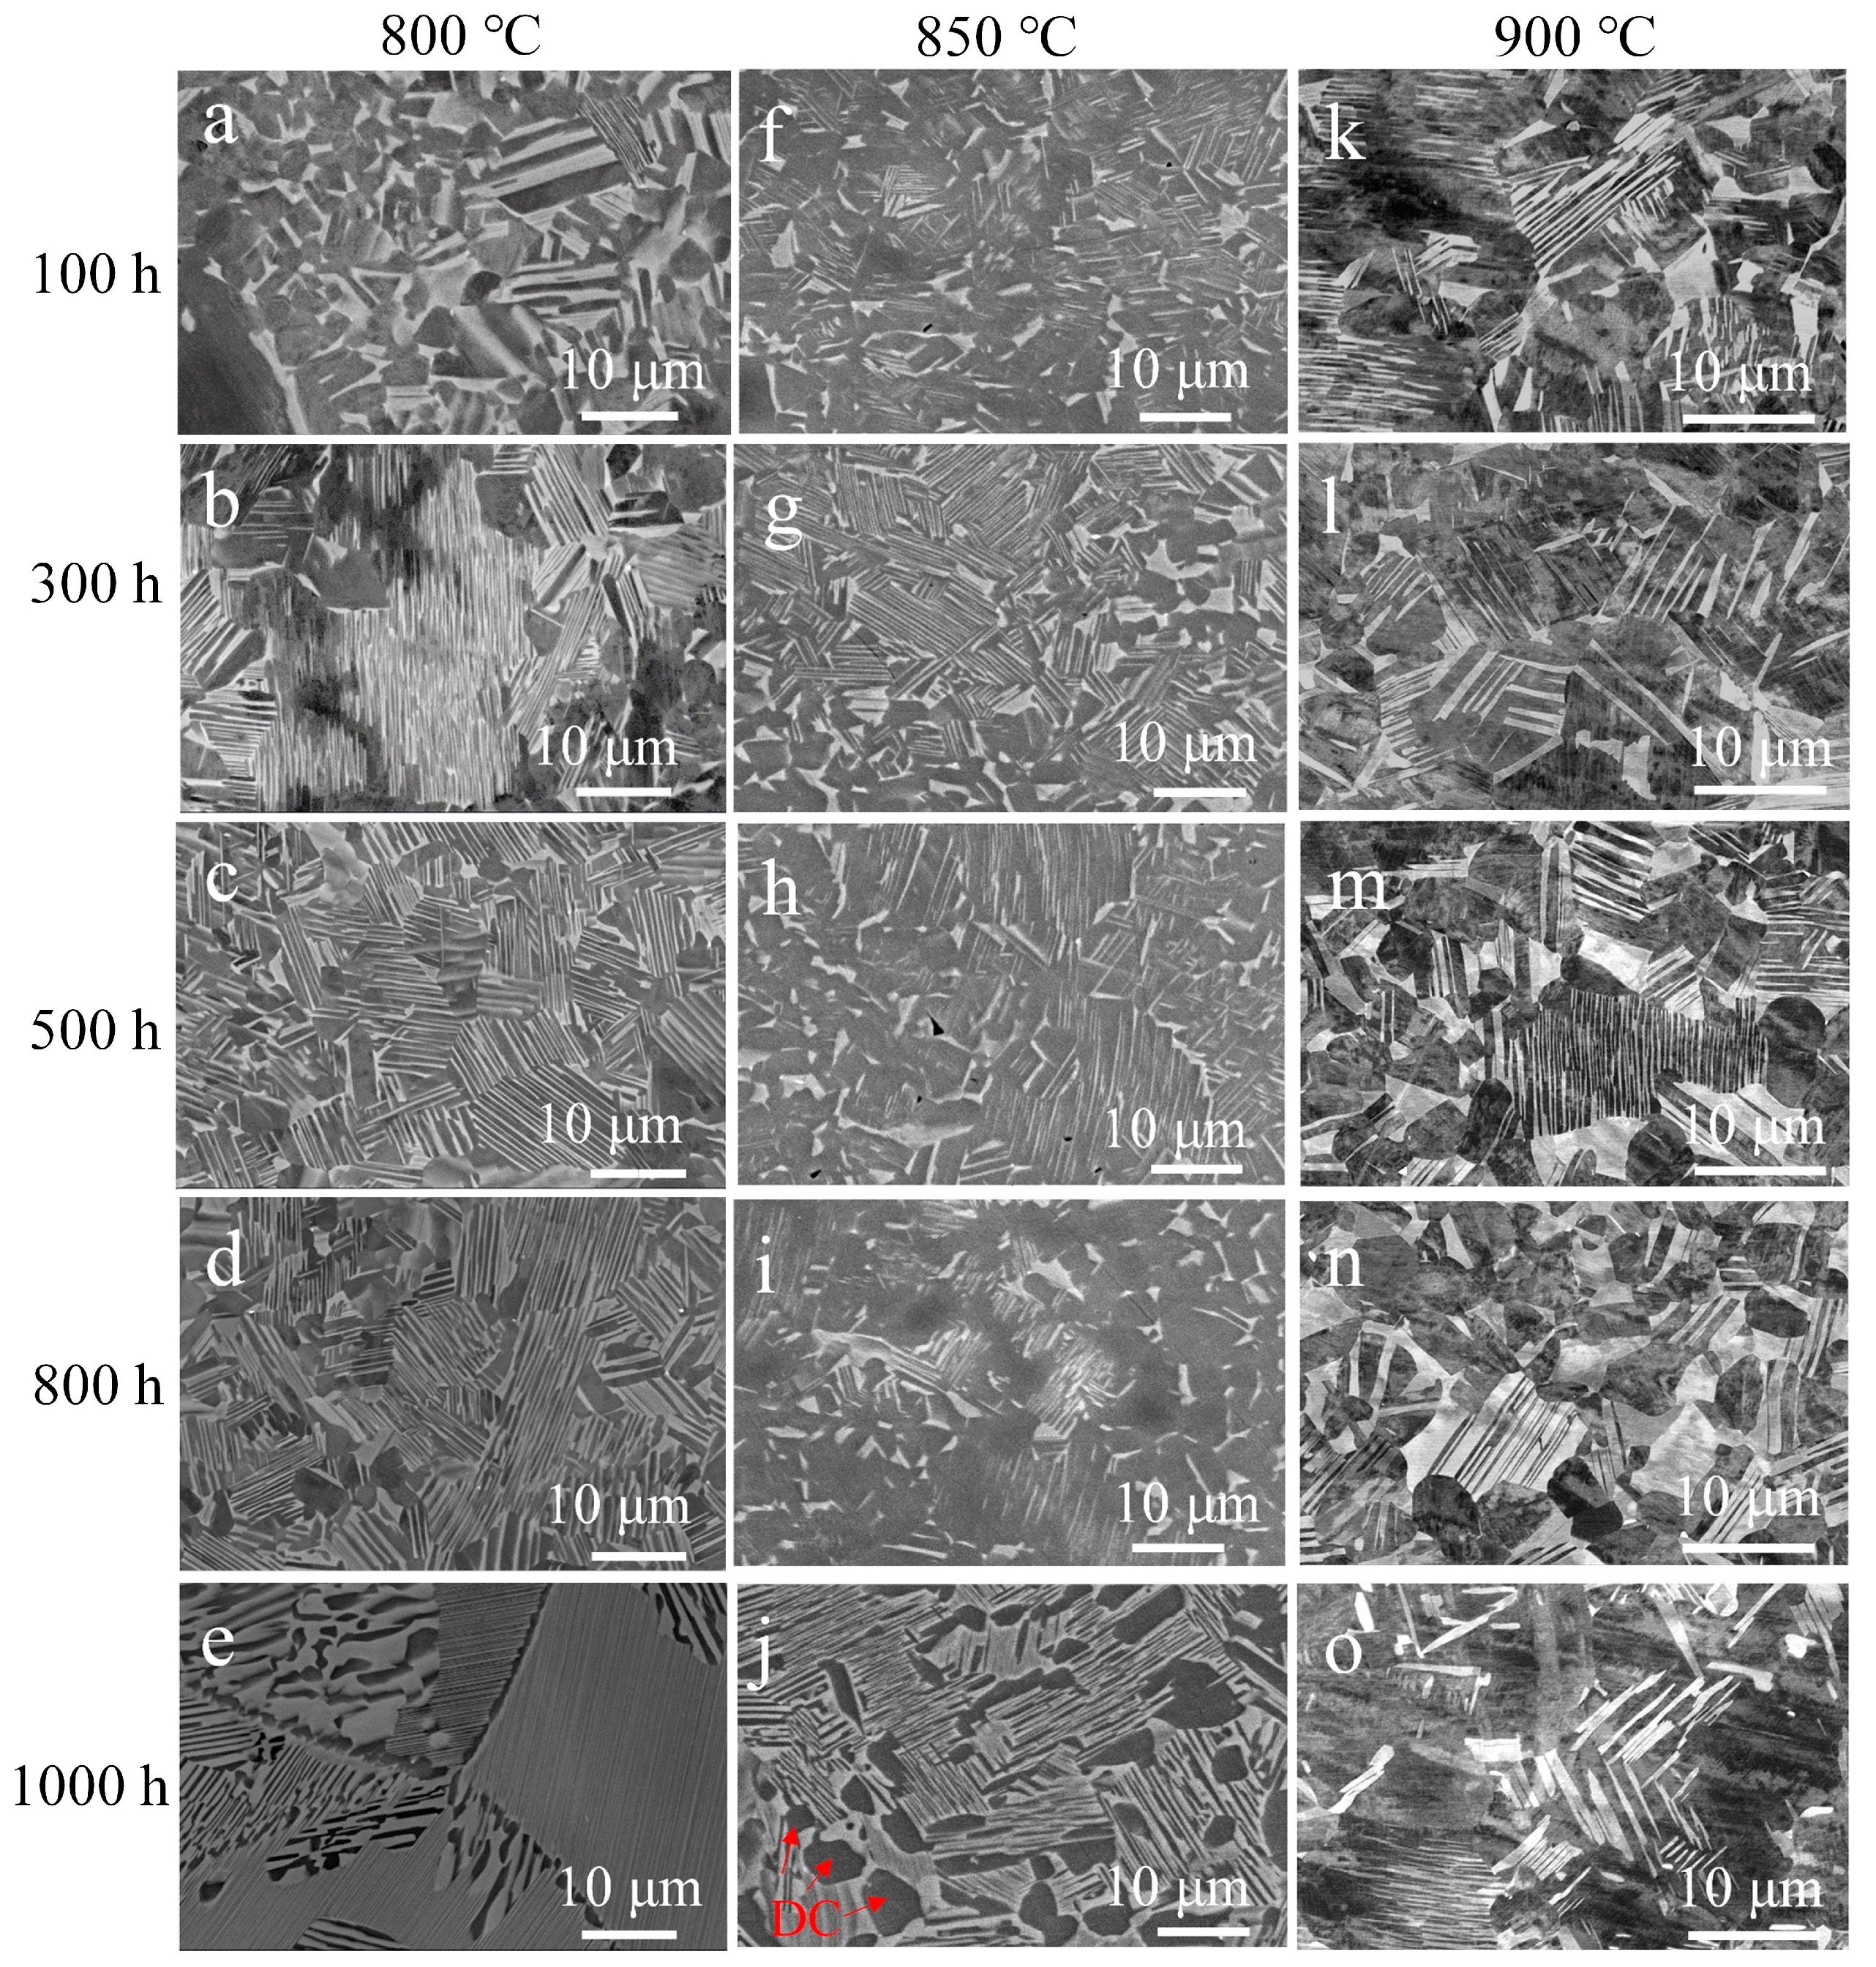
- Compared with the P–HIP Ti–48Al–3Nb–1.5Ta alloy, the grain size does not increase significantly, and the γ phase increases slightly (less than 3%) with the decomposition of the α2 phase after thermal exposure. With increasing thermal exposure duration, the γ phase initiates discontinuous coarsening (DC) due to the reduction in lamellae near the grain boundaries, which expands the γ-phase region;
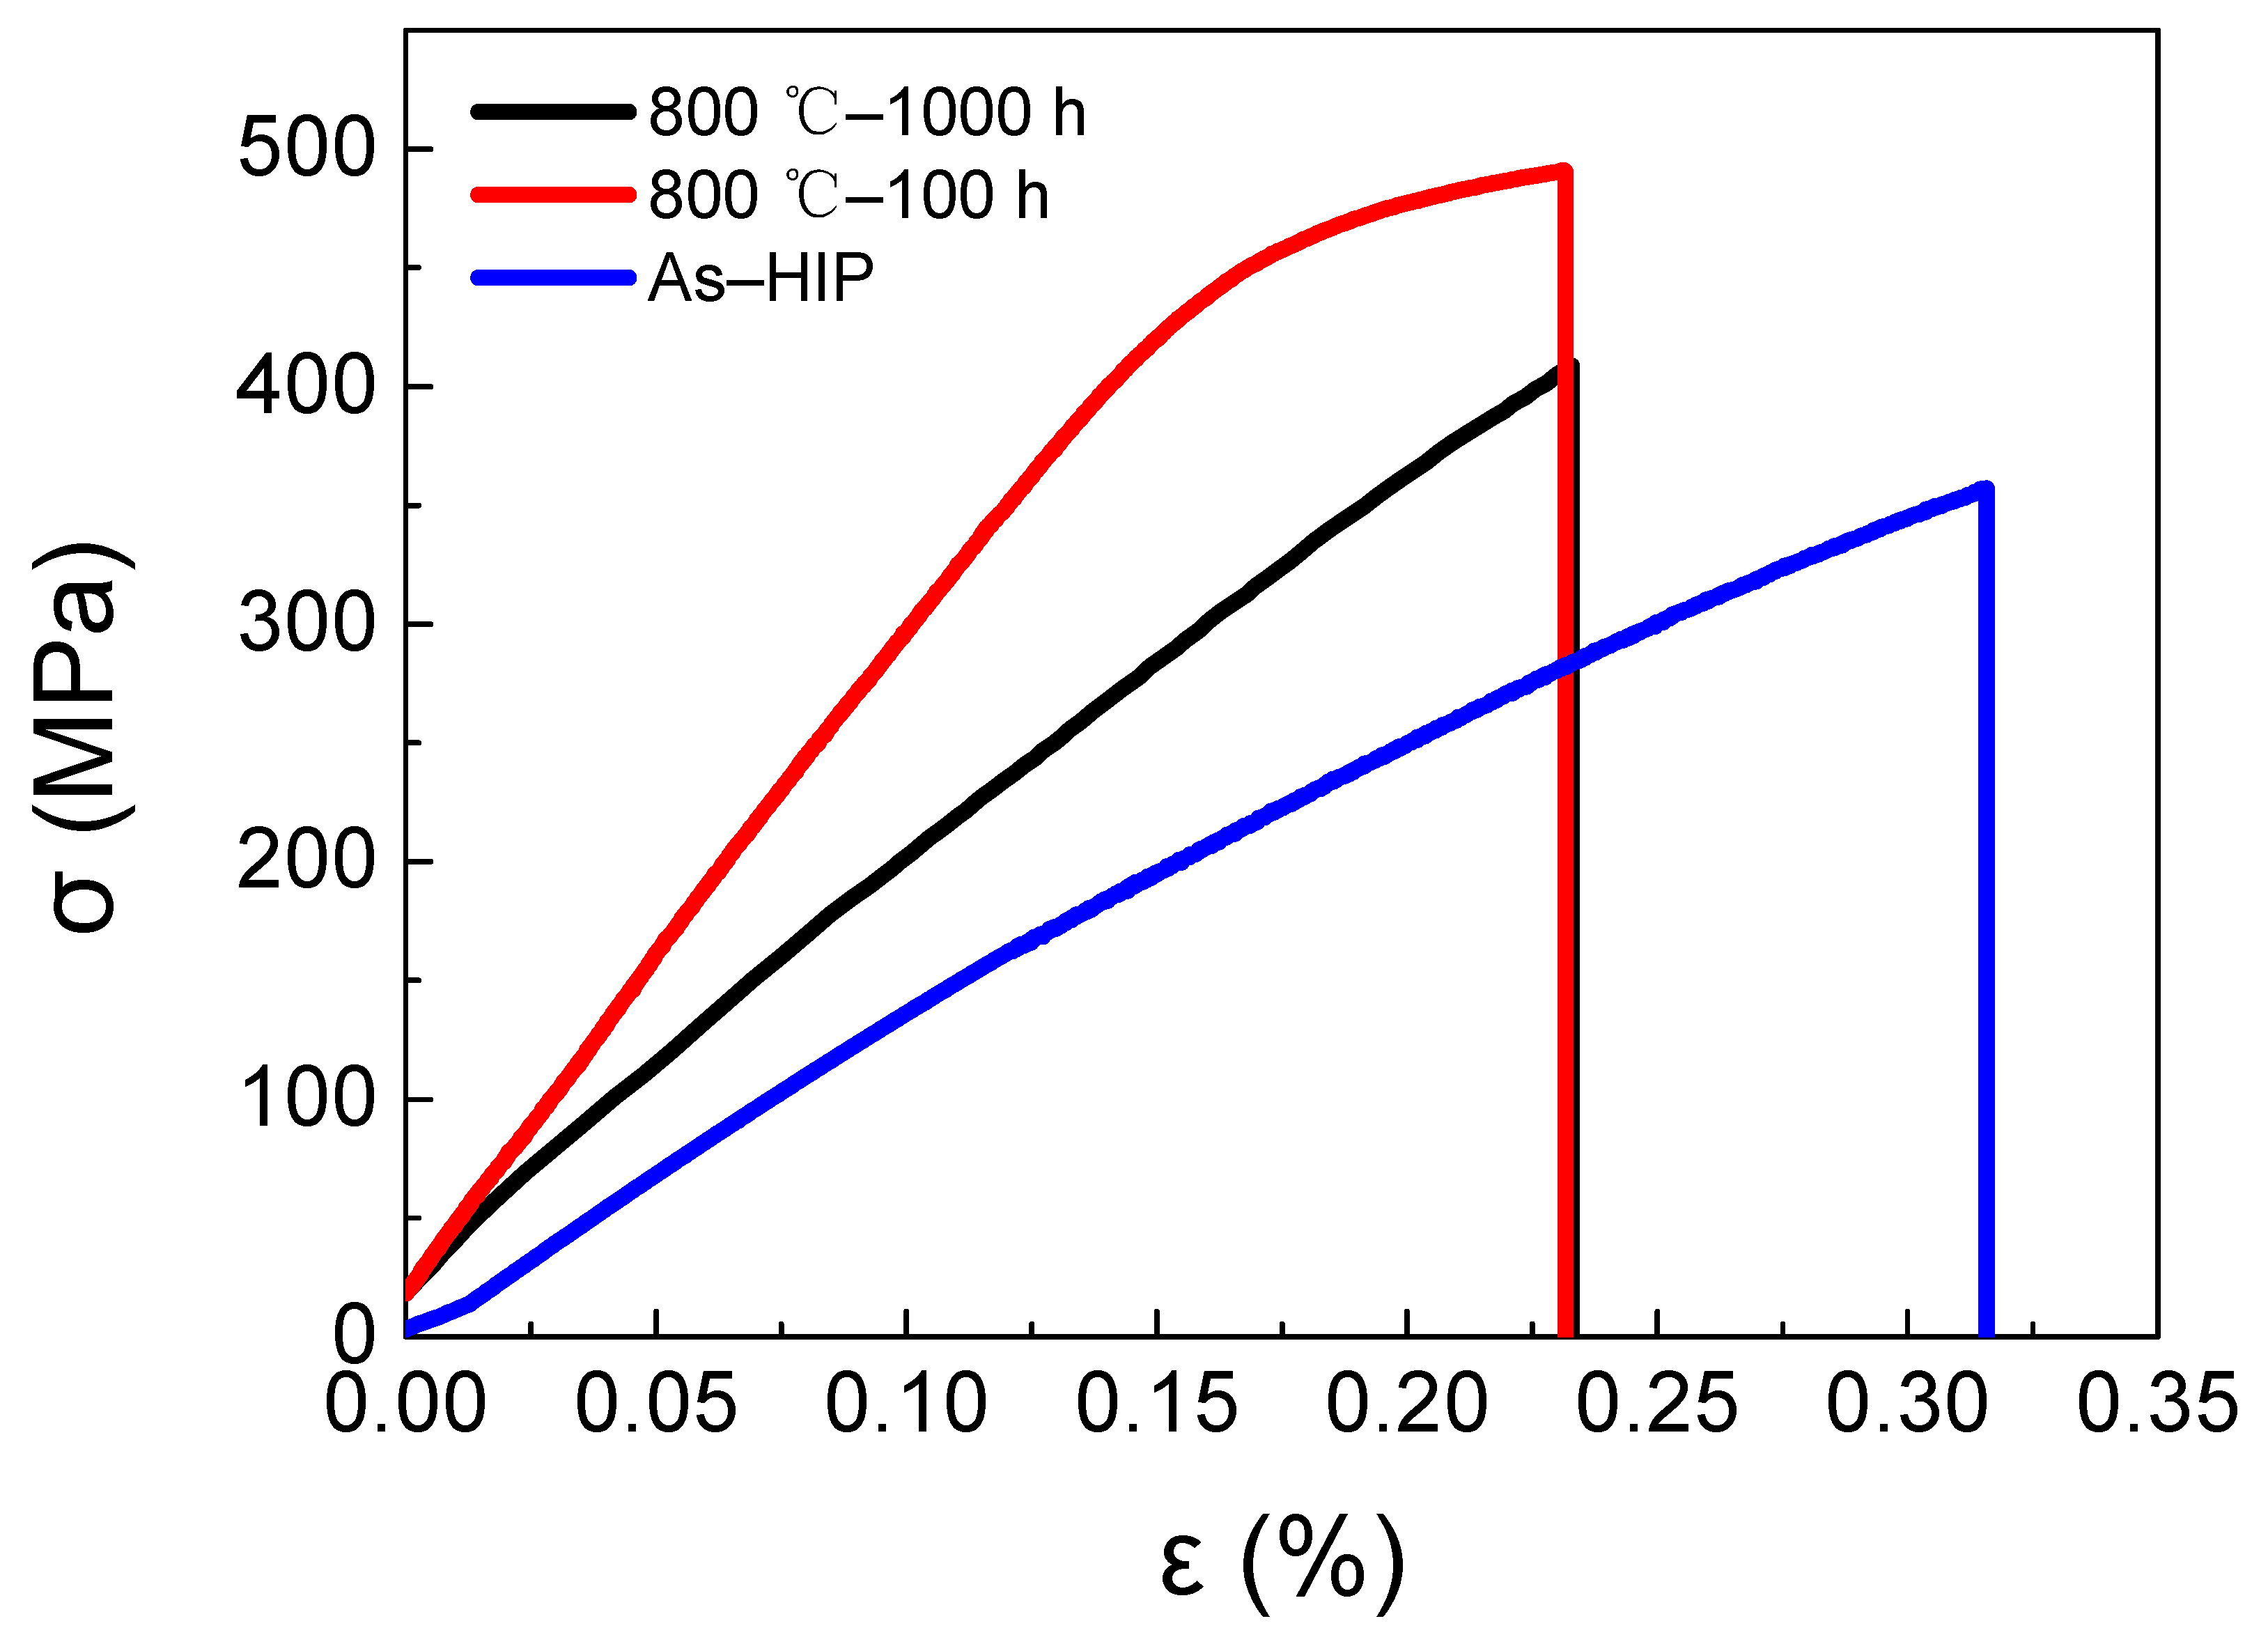
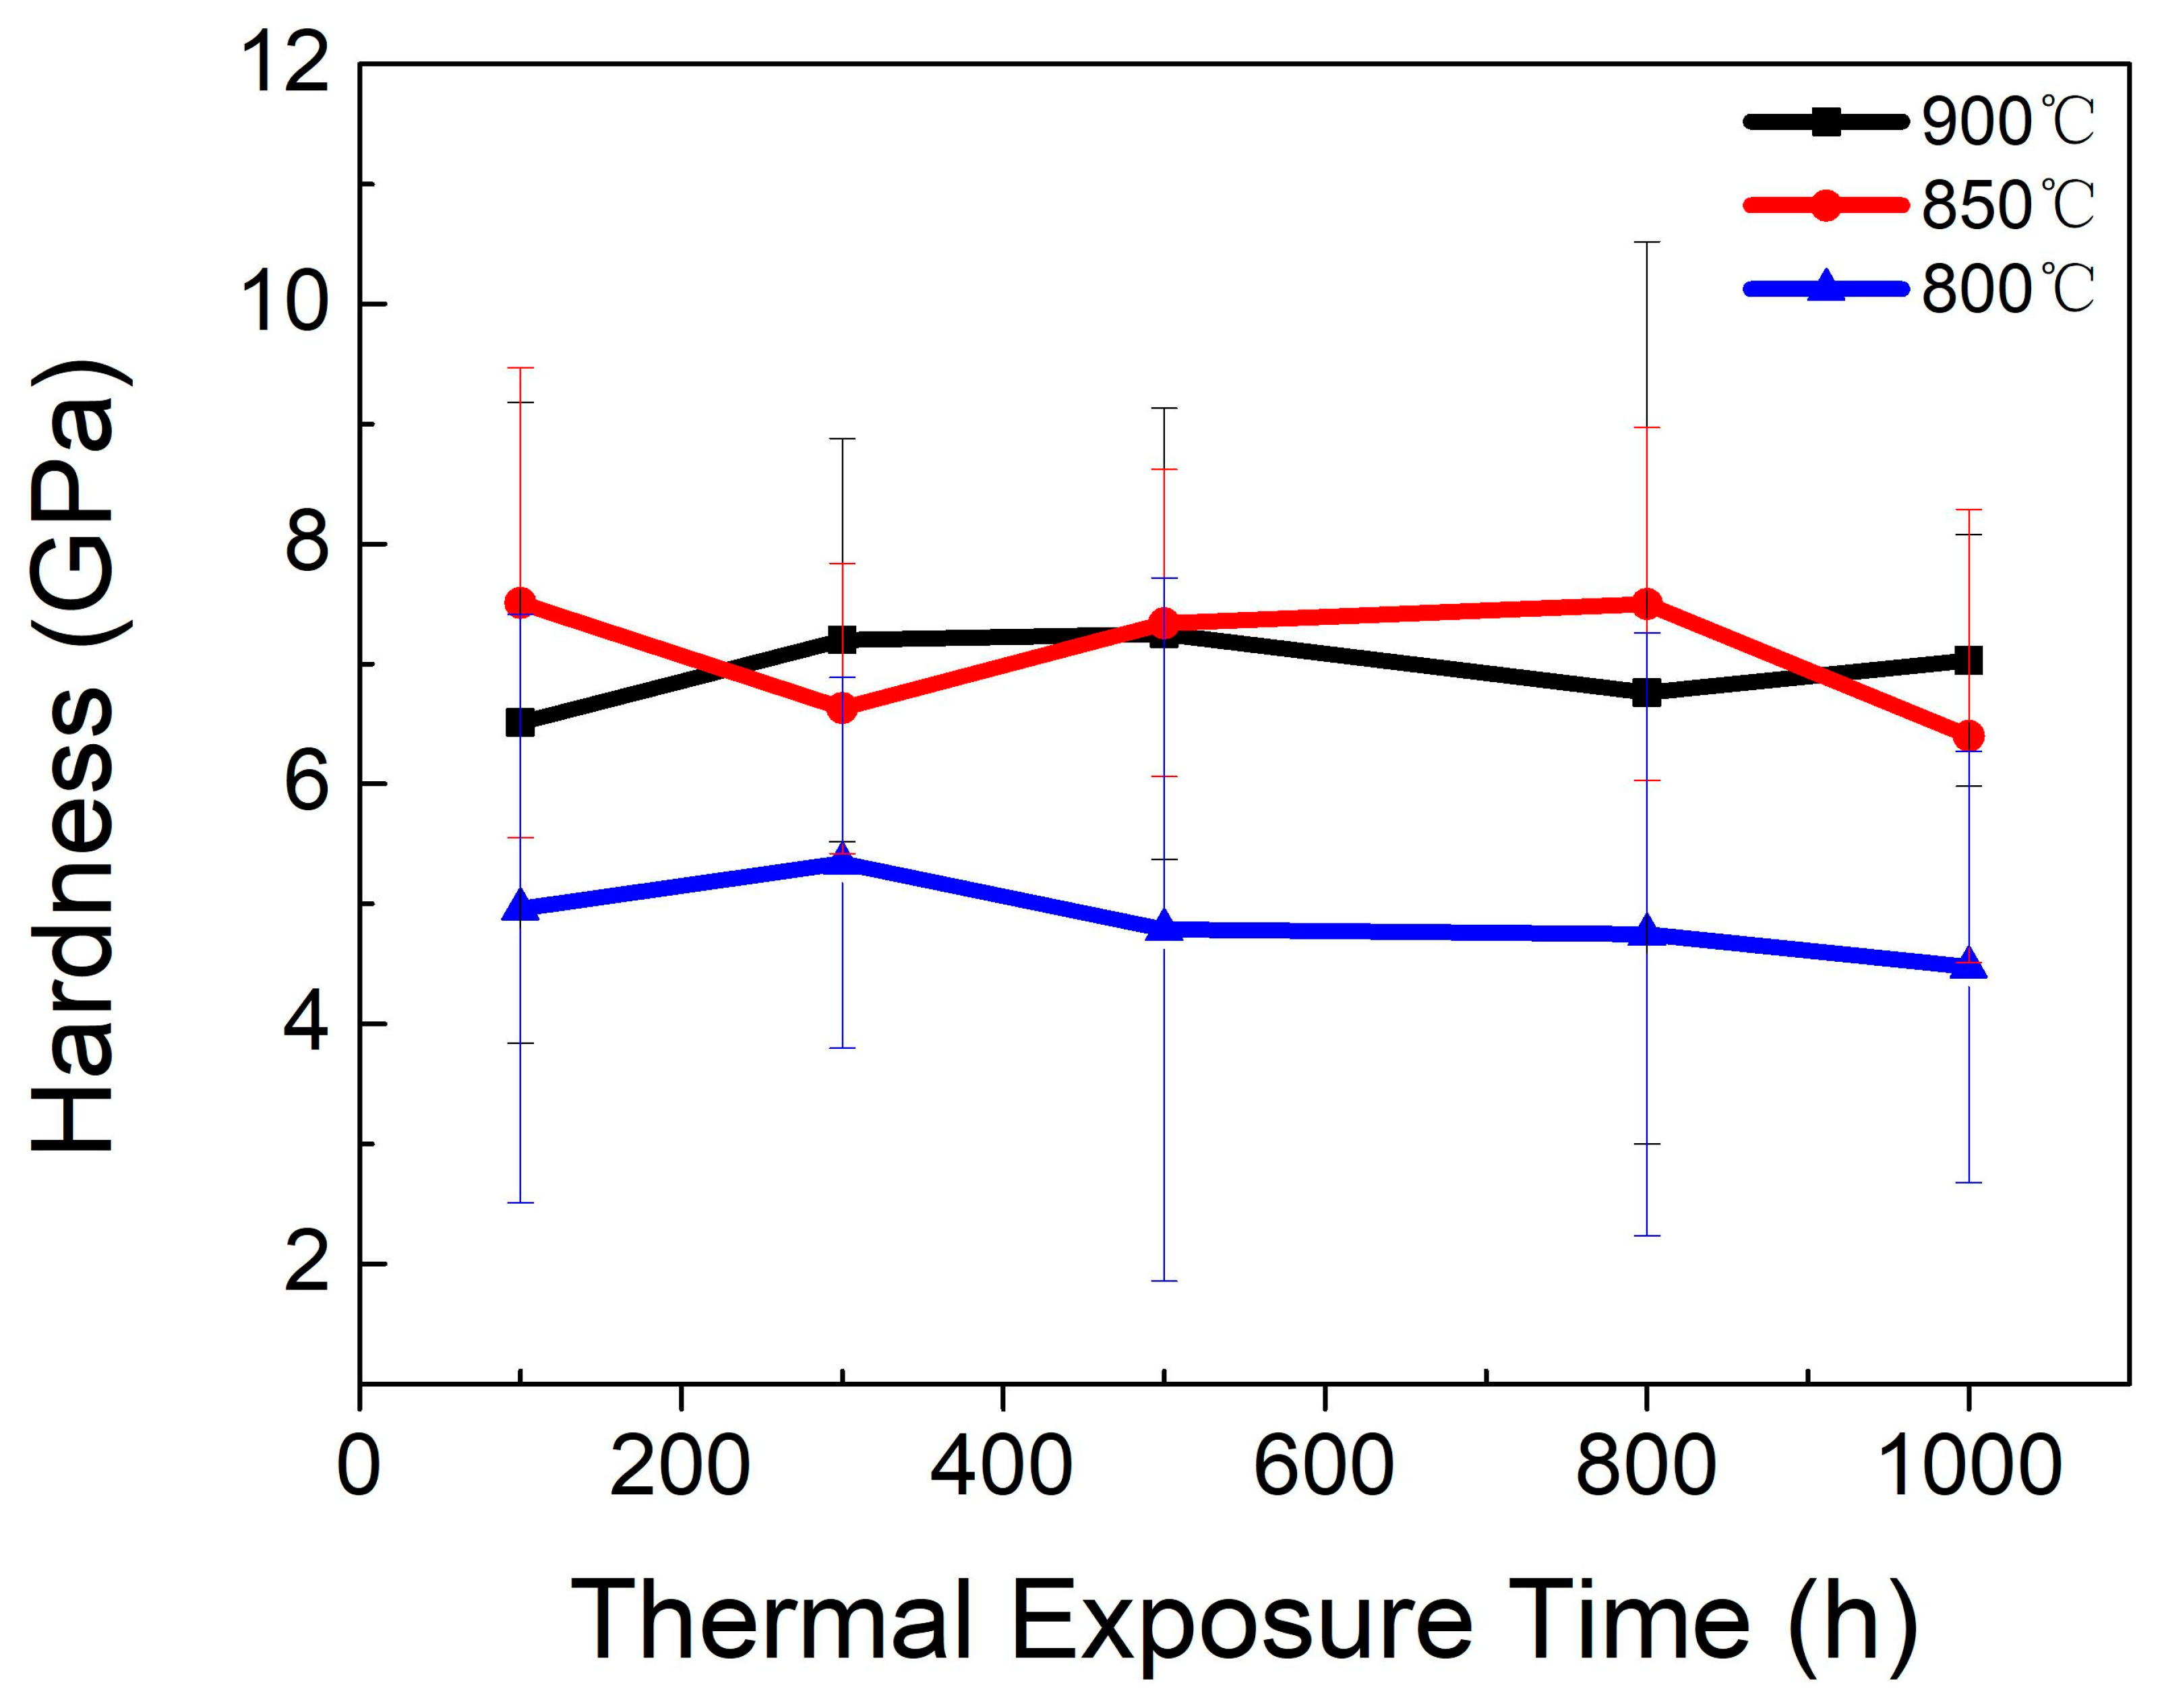
- Compared with the P–HIP Ti–48Al–3Nb–1.5Ta alloy, the hardness increases by about 2 GPa, the tensile strength increases by more than 50 MPa and the fracture strain decreases by about 0.1% after thermal exposure. With the extension of the thermal exposure duration, the hardness tends to decrease, because of the equiaxed γ grains increasing and growing continuously, the α2 phase decreasing and the lamellae coarsening. As the depth increases from the surface of the P–HIP Ti–48Al–3Nb–1.5Ta alloy after thermal exposure, the hardness decreases overall.
Author Contributions
Funding
Institutional Review Board Statement
Informed Consent Statement
Data Availability Statement
Acknowledgments
Conflicts of Interest
References
- Appel, H.F.; Paul, J.; Oehring, M. Gamma Titanium Aluminide Alloys Science and Technology; Wiley-VCH: Weinheim, Germany, 2011; p. 469. [Google Scholar] [CrossRef]
- Kim, Y.; Kim, S. Advances in Gammalloy Materials–Processes–Application Technology: Successes, Dilemmas, and Future. Jom 2018, 70, 553–560. [Google Scholar] [CrossRef]
- Kothari, K.; Radhakrishnan, R.; Wereley, N.M. Advances in gamma titanium aluminides and their manufacturing techniques. Prog. Aerosp. Sci. 2012, 55, 1–16. [Google Scholar] [CrossRef]
- Chandran, A.; Ganesan, H.; Cyron, C.J. Studying the effects of Nb on high-temperature deformation in TiAl alloys using atomistic simulations. Mater. Des. 2024, 237, 112596. [Google Scholar] [CrossRef]
- Guo, R.; Xiong, G.; Liu, J.; Wang, Y.; Davoodi, D.; Miri, R.; Tayebi, M. Tribological behavior of Ti-Al-Nb alloy with different Ta additions for high temperature applications. Mater. Lett. 2023, 330, 133324. [Google Scholar] [CrossRef]
- Chen, X.; Tang, B.; Wei, B.; Zhang, X.; Li, J. Investigation on recrystallization behavior of Ti-47Al-1.5Re-X (Cr, Mn, V, Nb) alloy during hot deformation. Mater. Lett. 2023, 331, 133484. [Google Scholar] [CrossRef]
- Hu, R.; Wang, X.; Yang, J.; Fu, H. Microstructures Thermal Stability and Evolution Mechanism of TiAl-Base Alloys and Their Effects on Mechanical Properties. Aerosp. Sci. Technol. 2017, 23, 30–39. [Google Scholar] [CrossRef]
- Pather, R.; Mitten, W.A.; Holdway, P.; Ubhi, H.; Wisbey, A.; Brooks, J. The effect of high temperature exposure on the tensile properties of γ TiAl alloys. Intermetallics 2003, 11, 1015–1027. [Google Scholar] [CrossRef]
- Huang, Z.W.; Cong, T. Microstructural instability and embrittlement behaviour of an Al-lean, high-Nb γ-TiAl-based alloy subjected to a long-term thermal exposure in air. Intermetallics 2010, 18, 161–172. [Google Scholar] [CrossRef]
- Huang, Z.W.; Voice, W.; Bowen, P. The effects of long-term air exposure on the stability of lamellar TiAl alloys. Intermetallics 2000, 8, 417–426. [Google Scholar] [CrossRef]
- Huang, Z.W. Thermal stability of Ti–44Al–4Nb–4Zr–0.2Si–1B alloy. Intermetallics 2013, 42, 170–179. [Google Scholar] [CrossRef]
- Zhou, L.Z.; Lupinc, V.; Guo, J.T. Microstructural stability of the intermetallic Ti–45Al–2W–0.5Si–0.5B in the 800–980 °C temperature range. Mater. Sci. Eng. A 2003, 354, 97–105. [Google Scholar] [CrossRef]
- Seo, D.Y.; Zhao, L.; Beddoes, J. Microstructural evolution during heat treatments in Ti-45 and 47Al–2Nb–2Mn + 0.8vol.%TiB2 XDTM alloys. Mater. Sci. Eng. A 2002, 329, 130–140. [Google Scholar] [CrossRef]
- Leyens, C.; Braun, R.; Frohlich, M.; Hovsepian, P. Recent progress in the coating protection of gamma titanium-aluminides. Jom 2006, 58, 17–21. [Google Scholar] [CrossRef]
- Pan, Y.; Han, D.; Huang, S.; Niu, Y.; Liang, B.; Zheng, X. Thermal insulation performance and thermal shock resistance of plasma-sprayed TiAlCrY/Gd2Zr2O7 thermal barrier coating on γ-TiAl alloy. Surf. Coat. Technol. 2023, 468, 129715. [Google Scholar] [CrossRef]
- Zhang, K.; Xin, L.; Ma, T.; Chang, H.; Lu, Y.; Feng, C.; Zhu, S.; Wang, F. Investigation of the role of silicon in TiAlSiN coating deposited on TiAl alloys during long-term oxidation. Corros. Sci. 2022, 204, 110394. [Google Scholar] [CrossRef]
- Haanappel, V.A.C.; Clemens, H.; Stroosnijder, M.F. The high temperature oxidation behaviour of high and low alloyed TiAl-based intermetallics. Intermetallics 2002, 10, 293–305. [Google Scholar] [CrossRef]
- Xiang, L.L.; Zhao, L.L.; Wang, Y.L.; Zhang, L.; Lin, J. Synergistic effect of Y and Nb on the high temperature oxidation resistance of high Nb containing TiAl alloys. Intermetallics 2012, 27, 6–13. [Google Scholar] [CrossRef]
- Hadi, M.; Bayat, O.; Meratian, M.; Shafyer, A.; Ebrahimzadeh, I. Oxidation Properties of a Beta-Stabilized TiAl Alloy Modified by Rare Earth Elements. Oxid. Met. 2018, 90, 421–434. [Google Scholar] [CrossRef]
- Du, H.L.; Aljarany, A.; Datta, P.K.; Burnell, J. Oxidation behaviour of Ti–46.7Al–1.9W–0.5Si in air and Ar–20%O2 between 750 and 950 °C. Corros. Sci. 2005, 47, 1706–1723. [Google Scholar] [CrossRef]
- Pilone, D.; Felli, F. Isothermal oxidation behaviour of TiAl–Cr–Nb–B alloys produced by induction melting. Intermetallics 2012, 26, 36–39. [Google Scholar] [CrossRef]
- Wendler, B.G.; Kaczmarek, Ł. Oxidation resistance of nanocrystalline microalloyed γ-TiAl coatings under isothermal conditions and thermal fatigue. J. Mater. Process. Technol. 2005, 164, 947–953. [Google Scholar] [CrossRef]
- Haanappel, V.A.C.; Clemens, H.; Stroosnijder, M.F. The effect of microstructure on the oxidation behaviour of Ti-46.5Al-4(Cr,Nb,Ta,B) and Ti-47 Al-4(Cr,Nb,Mo,B). Mater. High Temp. 2002, 19, 19–24. [Google Scholar] [CrossRef]
- Przybylski, K.; Prazuch, J.; Brylewski, T.; Durda, E. High Temperature Oxidation Behaviour of Tial8Nb Alloy. Arch. Metall. Mater. 2013, 58, 477–480. [Google Scholar] [CrossRef]
- Mengis, L.; Ulrich, A.S.; Watermeyer, P.; Liebscher, C.; Galetz, M. Oxidation behaviour and related microstructural changes of two β0–phase containing TiAl alloys between 600 °C and 900 °C. Corros. Sci. 2021, 178, 109085. [Google Scholar] [CrossRef]
- Banumathy, S.; Sruti Neelam, N.; Chandravanshi, V.; Bhattacharjee, A.; Ravi, K. The Effect of Nb addition on microstructure, oxidation behavior and strength of some γ-TiAl alloys. Mater. Today Proc. 2018, 5, 5514–5520. [Google Scholar] [CrossRef]
- Małecka, J. Resistance to High-Temperature Oxidation of Ti-Al-Nb Alloys. Materials 2022, 15, 2137. [Google Scholar] [CrossRef]
- Mitoraj, M.; Godlewska, E.; Heintz, O.; Geoffroy, N.; Fontana, S.; Chevalier, S. Scale composition and oxidation mechanism of the Ti–46Al–8Nb alloy in air at 700 and 800 °C. Intermetallics 2011, 19, 39–47. [Google Scholar] [CrossRef]
- Fergus, J.W. Review of the effect of alloy composition on the growth rates of scales formed during oxidation of gamma titanium aluminide alloys. Mater. Sci. Eng. A 2002, 338, 108–125. [Google Scholar] [CrossRef]
- Li, X. Research on Microstructure and Mechanical Properties of Ti-45Al-10Nb Alloy Prepared by Powder Metallurgy. Ph.D. Thesis, Harbin Institute of Technology, Harbin, China, 2014. [Google Scholar]
- Pfeiler, M.; Scheu, C.; Hutter, H.; Schnöller, J.; Michotte, C.; Mitterer, C.; Kathrein, M. On the effect of Ta on improved oxidation resistance of Ti–Al–Ta–N coatings. J. Vac. Sci. Technol. A 2009, 27, 554–560. [Google Scholar] [CrossRef]
- Pan, H.; Zhang, K.; Chen, J.; Zhang, X.; Zhao, H.; Hu, R. Variant selection of massive γ subgrains and corresponding mechanical properties in Ta containing γ-TiAl-based alloys. Mater. Lett. 2023, 333, 133689. [Google Scholar] [CrossRef]
- Chen, S.; Tan, Y.; Wang, X.; Cao, F.; Wang, L.; Su, Y.; Guo, J. Individual and synergistic effects of Ta and Mn on optimizing the microstructures and mechanical properties of TiB reinforced high Nb–TiAl composites. J. Mater. Res. Technol. 2023, 23, 209–220. [Google Scholar] [CrossRef]
- Liu, Z.; Wang, C.; Wang, W.; Xu, G.; Liu, X. Effects of Tantalum on the microstructure and properties of Ti-48Al-2Cr-2Nb alloy fabricated via laser additive manufacturing. Mater. Charact. 2021, 179, 111317. [Google Scholar] [CrossRef]
- Gao, Z.; Hu, R.; Huang, Z.; Wu, Y.; Li, J.; Zhou, M. Metastable transformation behavior in a Ta-containing TiAl-Nb alloy during continuous cooling. J. Alloy Compd. 2022, 904, 164088. [Google Scholar] [CrossRef]
- Zhang, K.; Hu, R.; Lei, T.; Yang, J. Refinement of massive γ phase with enhanced properties in a Ta containing γ-TiAl-based alloys. Scr. Mater. 2019, 172, 113–118. [Google Scholar] [CrossRef]
- Zhang, K.; Hu, R.; Li, J.; Yang, J.; Gao, Z. Grain refinement of 1 at.% Ta-containing cast TiAl-based alloy by cyclic air-cooling heat treatment. Mater. Lett. 2020, 274, 127940. [Google Scholar] [CrossRef]
- Hu, D.; Huang, A.J.; Wu, X. On the massive phase transformation regime in TiAl alloys: The alloying effect on massive/lamellar competition. Intermetallics 2007, 15, 327–332. [Google Scholar] [CrossRef]
- Lapin, J.; Pelachová, T.; Dománková, M. Long-term creep behaviour of cast TiAl-Ta alloy. Intermetallics 2018, 95, 24–32. [Google Scholar] [CrossRef]
- Saage, H.; Huang, A.J.; Hu, D.; Loretto, M.H.; Wu, X. Microstructures and tensile properties of massively transformed and aged Ti46Al8Nb and Ti46Al8Ta alloys. Intermetallics 2009, 17, 32–38. [Google Scholar] [CrossRef]
- Loretto, M.H.; Wu, Z.; Chu, M.Q.; Saage, H.; Hu, D.; Attallah, M.M. Deformation of microstructurally refined cast Ti46Al8Nb and Ti46Al8Ta. Intermetallics 2012, 23, 1–11. [Google Scholar] [CrossRef]
- Lapin, J.; Gabalcová, Z. Solidification behaviour of TiAl-based alloys studied by directional solidification technique. Intermetallics 2011, 19, 797–804. [Google Scholar] [CrossRef]
- Yan, M.; Yang, F.; Lu, B.; Chen, C.; Sui, Y.; Guo, Z. Microstructure and Mechanical Properties of High Relative Density γ-TiAl Alloy Using Irregular Pre-Alloyed Powder. Metals 2021, 11, 635. [Google Scholar] [CrossRef]
- GB/T 228.1; Metallic materials—Tensile testing—Part 1: Method of test at room temperature. Standardization Administration of China: Beijing, China, 2021.
- Bik, M.; Galetz, M.; Mengis, L.; White, E.; Wieczorek, W.; Łyszczarz, K.; Mroczka, K.; Marchewka, J.; Sitarz, M. Oxidation behaviour of uncoated and PDC-SiAlOC glass-coated TiAl at 750 °C in dry and humid air. Appl. Surf. Sci. 2023, 632, 157601. [Google Scholar] [CrossRef]
- Pérez, P. Influence of nitriding on the oxidation behaviour of titanium alloys at 700 °C. Surf. Coat. Technol. 2005, 191, 293–302. [Google Scholar] [CrossRef]
- Vojtěch, D.; Popela, T.; Kubásek, J.; Maixner, J.; Novák, P. Comparison of Nb- and Ta-effectiveness for improvement of the cyclic oxidation resistance of TiAl-based intermetallics. Intermetallics 2011, 19, 493–501. [Google Scholar] [CrossRef]
- Kovács, K.; Perczel, I.V.; Josepovits, V.K.; Kiss, G.; Réti, F.; Deák, P. In situ surface analytical investigation of the thermal oxidation of Ti–Al intermetallics up to 1000 °C. Appl. Surf. Sci. 2002, 200, 185–195. [Google Scholar] [CrossRef]
- Gale, W.F.; Totemeier, T.C. 8—Thermochemical data. In Smithells Metals Reference Book, 8th ed.; Gale, W.F., Totemeier, T.C., Eds.; Butterworth-Heinemann: Oxford, UK, 2004; pp. 1–8. ISBN 978-0-7506-7509-3. [Google Scholar]
- Dudziak, T.; Rząd, E.; Morgiel, J.; Wytrwal-Sarna, M.; Kirchner, A.; Pomorska, M.; Boron, L.; Polczyk, T.; Moskal, G.; Toboła, D.; et al. Scale mass gain, morphology and phase composition of air and steam oxidized electron beam melted and cast Ti–48Al–2Nb–0.7Cr–0.3Si alloys. Intermetallics 2022, 145, 107553. [Google Scholar] [CrossRef]
- Pan, Y.; Yang, Y.; Zhou, Q.; Qu, X.; Cao, P.; Lu, X. Achieving synergy of strength and ductility in powder metallurgy commercially pure titanium by a unique oxygen scavenger. Acta Mater. 2024, 263, 119485. [Google Scholar] [CrossRef]
- Taylor, T.N.; Paffett, M.T. Oxide properties of a γ-TiAl: A surface science study. In High Temperature Aluminides and Intermetallics; Whang, S.H., Pope, D.P., Liu, C.T., Eds.; Elsevier: Oxford, UK, 1992; pp. 584–590. ISBN 978-1-85166-822-9. [Google Scholar]
- Huang, H.; Yan, H.; Duan, M.; Ji, J.; Liu, X.; Jiang, H.; Liu, B.; Sajid, S.; Cui, P.; Li, Y.; et al. TiO2 surface oxygen vacancy passivation towards mitigated interfacial lattice distortion and efficient perovskite solar cell. Appl. Surf. Sci. 2021, 544, 148583. [Google Scholar] [CrossRef]
- Ping, F.; Hu, Q.; Bakulin, A.V.; Kulkova, S.E.; Yang, R. Alloying effects on properties of Al2O3 and TiO2 in connection with oxidation resistance of TiAl. Intermetallics 2016, 68, 57–62. [Google Scholar] [CrossRef]
- Vojtech, D.; Cizkovsky, J.; Novak, P.; Serak, J.; Fabian, T. Effect of niobium on the structure and high-temperature oxidation of TiAl–Ti5Si3 eutectic alloy. Intermetallics 2008, 16, 896–903. [Google Scholar] [CrossRef]
- Wang, H.; Zhu, C.; Zhang, J.; Cao, R. Influence of Thermal Exposure at Different Temperatures on Room Temperature Tensile Ductility of Cast TiAl Alloy. J. Mater. Eng. 2018, 46, 151–156. [Google Scholar] [CrossRef]
- Narayana, P.L.; Kim, J.H.; Yun, D.W.; Kim, S.; Reddy, N.S.; Yeom, J.; Seo, D.; Hong, J. High temperature isothermal oxidation behavior of electron beam melted multi-phase γ-TiAl alloy. Intermetallics 2022, 141, 107424. [Google Scholar] [CrossRef]
- Panin, P.V.; Zavodov, A.V.; Lukina, E.A. Effect of thermal exposure on microstructure evolution and mechanical properties of cast beta-solidifying TiAl-based alloy doped with Gd. Intermetallics 2022, 145, 107534. [Google Scholar] [CrossRef]
- Li, D.; Zhang, G.; Lu, G.; Liu, Y.; Wang, J.; Liu, C. Precipitation of Ti2Al phases at lamellar interfaces in a high-Nb-containing TiAl alloy during thermal exposure. J. Mater. Sci. Technol. 2022, 126, 132–140. [Google Scholar] [CrossRef]
- Wang, Y.; Xue, X.; Kou, H.; Qiang, F.; Yu, Y.; Yin, Z.; Li, J. Microstructure Characterization and Thermal Stability of TNM Alloy Fabricated by Powder Hot Isostatic Pressing. Metals 2021, 11, 1720. [Google Scholar] [CrossRef]
- Zheng, G.; Tang, B.; Zhao, S.; Wang, W.Y.; Ding, Y.; Zhao, Z.; Zhu, L.; Li, J. Revealing cellular reaction mechanisms and high-temperature structure stability in β-stabilized TiAl alloy. Mater. Charact. 2023, 203, 113110. [Google Scholar] [CrossRef]
- Karadge, M.; Gouma, P.I. A structural aspect of α(α2) → lamellar α2 + γ transformation in γ-TiAl. Phil. Mag. Lett. 2004, 84, 451–459. [Google Scholar] [CrossRef]
- Boehlert, C.J.; Dimiduk, D.M.; Hemker, K.J. The phase evolution, mechanical behavior, and microstructural instability of a fully-lamellar Ti–46Al(at.%) alloy. Scr. Mater. 2002, 46, 259–267. [Google Scholar] [CrossRef]
- Haase, C.; Barrales-Mora, L.A. Influence of deformation and annealing twinning on the microstructure and texture evolution of face-centered cubic high-entropy alloys. Acta Mater. 2018, 150, 88–103. [Google Scholar] [CrossRef]
- Brice, D.A.; Rahimi, R.M.; Bahr, D.F. Hardening Particulate Ti Media Through Controlled Oxidation. Metall. Mater. Trans. A 2019, 50, 3980–3984. [Google Scholar] [CrossRef]
- Gardner, H.M.; Gopon, P.; Magazzeni, C.M.; Radecka, A.; Fox, K.; Rugg, D.; Wade, J.; Armstrong, D.E.J.; Moody, M.P.; Bagot, P.A.J. Quantifying the effect of oxygen on micro-mechanical properties of a near-alpha titanium alloy. J. Mater. Res. 2021, 36, 2529–2544. [Google Scholar] [CrossRef]
- Göken, M.; Kempf, M.; Nix, W.D. Hardness and modulus of the lamellar microstructure in PST-TiAl studied by nanoindentations and AFM. Acta Mater. 2001, 49, 903–911. [Google Scholar] [CrossRef]
- Kienl, C.; León-Cázares, F.D.; Rae, C.M.F. Deformation twinning during high temperature compression tests of the Ni-base superalloy ATI 718Plus®. Acta Mater. 2022, 225, 115743. [Google Scholar] [CrossRef]
- Amann, F.; Poulain, R.; Delannoy, S.; Couzinié, J.P.; Clouet, E.; Guillot, I.; Prima, F. An improved combination of tensile strength and ductility in titanium alloys via oxygen ordering. Mater. Sci. Eng. A. 2023, 867, 144720. [Google Scholar] [CrossRef]
- Zhu, C.L.; Li, S.; Li, H.Z.; Zhang, J. Effect of Thermal Exposure at 750 °C on Room Temperature Tensile Ductility of Cast Tial Alloy with Directional Lamellar Microstructure. Acta Metall. Sin. 2014, 50, 1478–1484. [Google Scholar] [CrossRef]


| Position | Ti | Al | O | Nb | Ta | C |
|---|---|---|---|---|---|---|
| 1 | 27.57 | - | 68.71 | - | - | 3.72 |
| 2 | 39.58 | 0.43 | 56.89 | - | - | 3.11 |
| 3 | 27.61 | - | 68.21 | - | - | 4.18 |
| 4 | 33.13 | 5.86 | 61.01 | - | - | - |
| 5 | 17.43 | 7.35 | 48.23 | 0.99 | 0.43 | 25.58 |
| 6 | 26.34 | 0.72 | 69.68 | - | - | 3.25 |
| 7 | 6.50 | 26.73 | 66.78 | - | - | - |
| 8 | 2.67 | 25.89 | 58.14 | - | - | 13.30 |
| Temperature (°C) | Duration (h) | γ Phase (%) | α2 Phase (%) |
|---|---|---|---|
| 800 | 100 | ||
| 1000 | |||
| 850 | 100 | ||
| 1000 | |||
| 900 | 100 | ||
| 1000 |
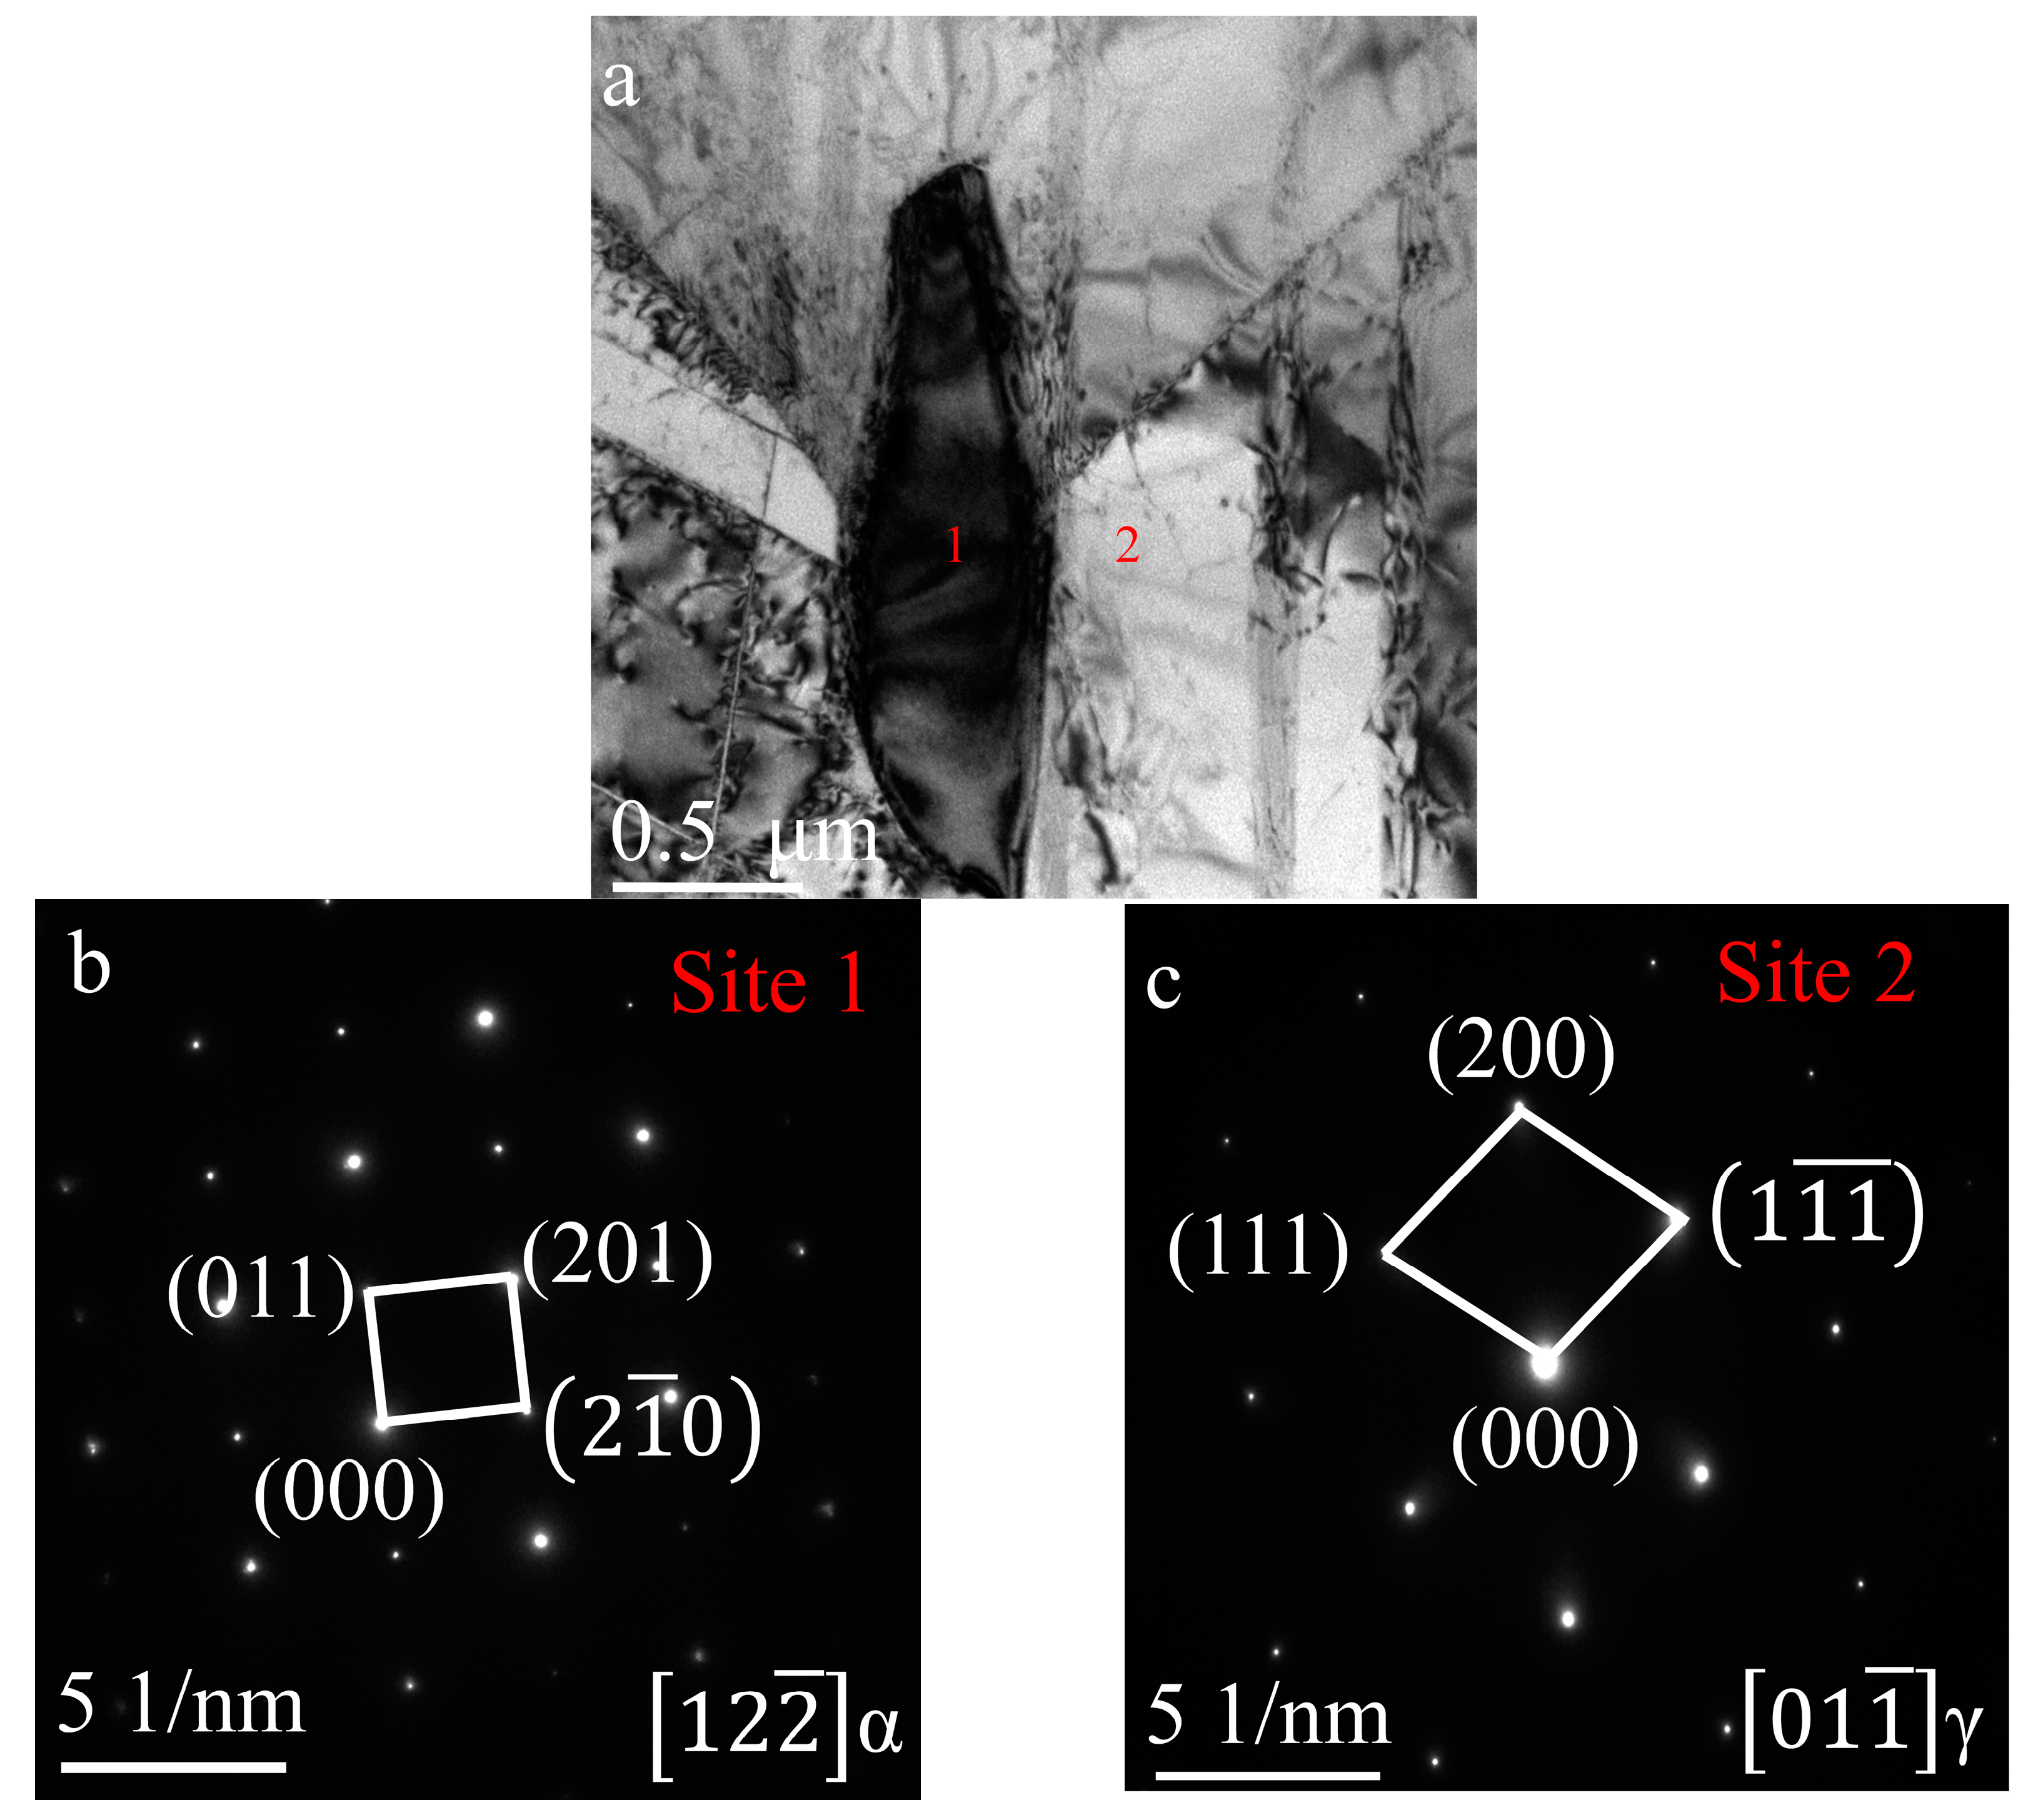
| Element | Al | Ti | Nb | Ta |
|---|---|---|---|---|
| 1 | 31.62 | 65.32 | 1.53 | 1.50 |
| 2 | 49.88 | 45.61 | 2.94 | 1.55 |
Disclaimer/Publisher’s Note: The statements, opinions and data contained in all publications are solely those of the individual author(s) and contributor(s) and not of MDPI and/or the editor(s). MDPI and/or the editor(s) disclaim responsibility for any injury to people or property resulting from any ideas, methods, instructions or products referred to in the content. |
© 2024 by the authors. Licensee MDPI, Basel, Switzerland. This article is an open access article distributed under the terms and conditions of the Creative Commons Attribution (CC BY) license (https://creativecommons.org/licenses/by/4.0/).
Share and Cite
Zuo, Z.; Hu, R.; Wang, Q.; Gao, Z.; Luo, X.; Lai, Y.; Xue, S.; Xiang, M.; Zhao, X.; Li, S. Effects of Thermal Exposure on the Microstructure and Mechanical Properties of a Ti–48Al–3Nb–1.5Ta Alloy via Powder Hot Isostatic Pressing. Materials 2024, 17, 794. https://doi.org/10.3390/ma17040794
Zuo Z, Hu R, Wang Q, Gao Z, Luo X, Lai Y, Xue S, Xiang M, Zhao X, Li S. Effects of Thermal Exposure on the Microstructure and Mechanical Properties of a Ti–48Al–3Nb–1.5Ta Alloy via Powder Hot Isostatic Pressing. Materials. 2024; 17(4):794. https://doi.org/10.3390/ma17040794
Chicago/Turabian StyleZuo, Zhenbo, Rui Hu, Qingxiang Wang, Zitong Gao, Xian Luo, Yunjin Lai, Sa Xue, Min Xiang, Xiaohao Zhao, and Shaoqiang Li. 2024. "Effects of Thermal Exposure on the Microstructure and Mechanical Properties of a Ti–48Al–3Nb–1.5Ta Alloy via Powder Hot Isostatic Pressing" Materials 17, no. 4: 794. https://doi.org/10.3390/ma17040794
APA StyleZuo, Z., Hu, R., Wang, Q., Gao, Z., Luo, X., Lai, Y., Xue, S., Xiang, M., Zhao, X., & Li, S. (2024). Effects of Thermal Exposure on the Microstructure and Mechanical Properties of a Ti–48Al–3Nb–1.5Ta Alloy via Powder Hot Isostatic Pressing. Materials, 17(4), 794. https://doi.org/10.3390/ma17040794