
Dynamic Response Mechanism of Bedding Slopes with Alternatively Distributed Soft and Hard Rock Layers Under Different Seismic Excitation Directions: Insights from Numerical Simulations


Abstract
1. Introduction
2. Methodology
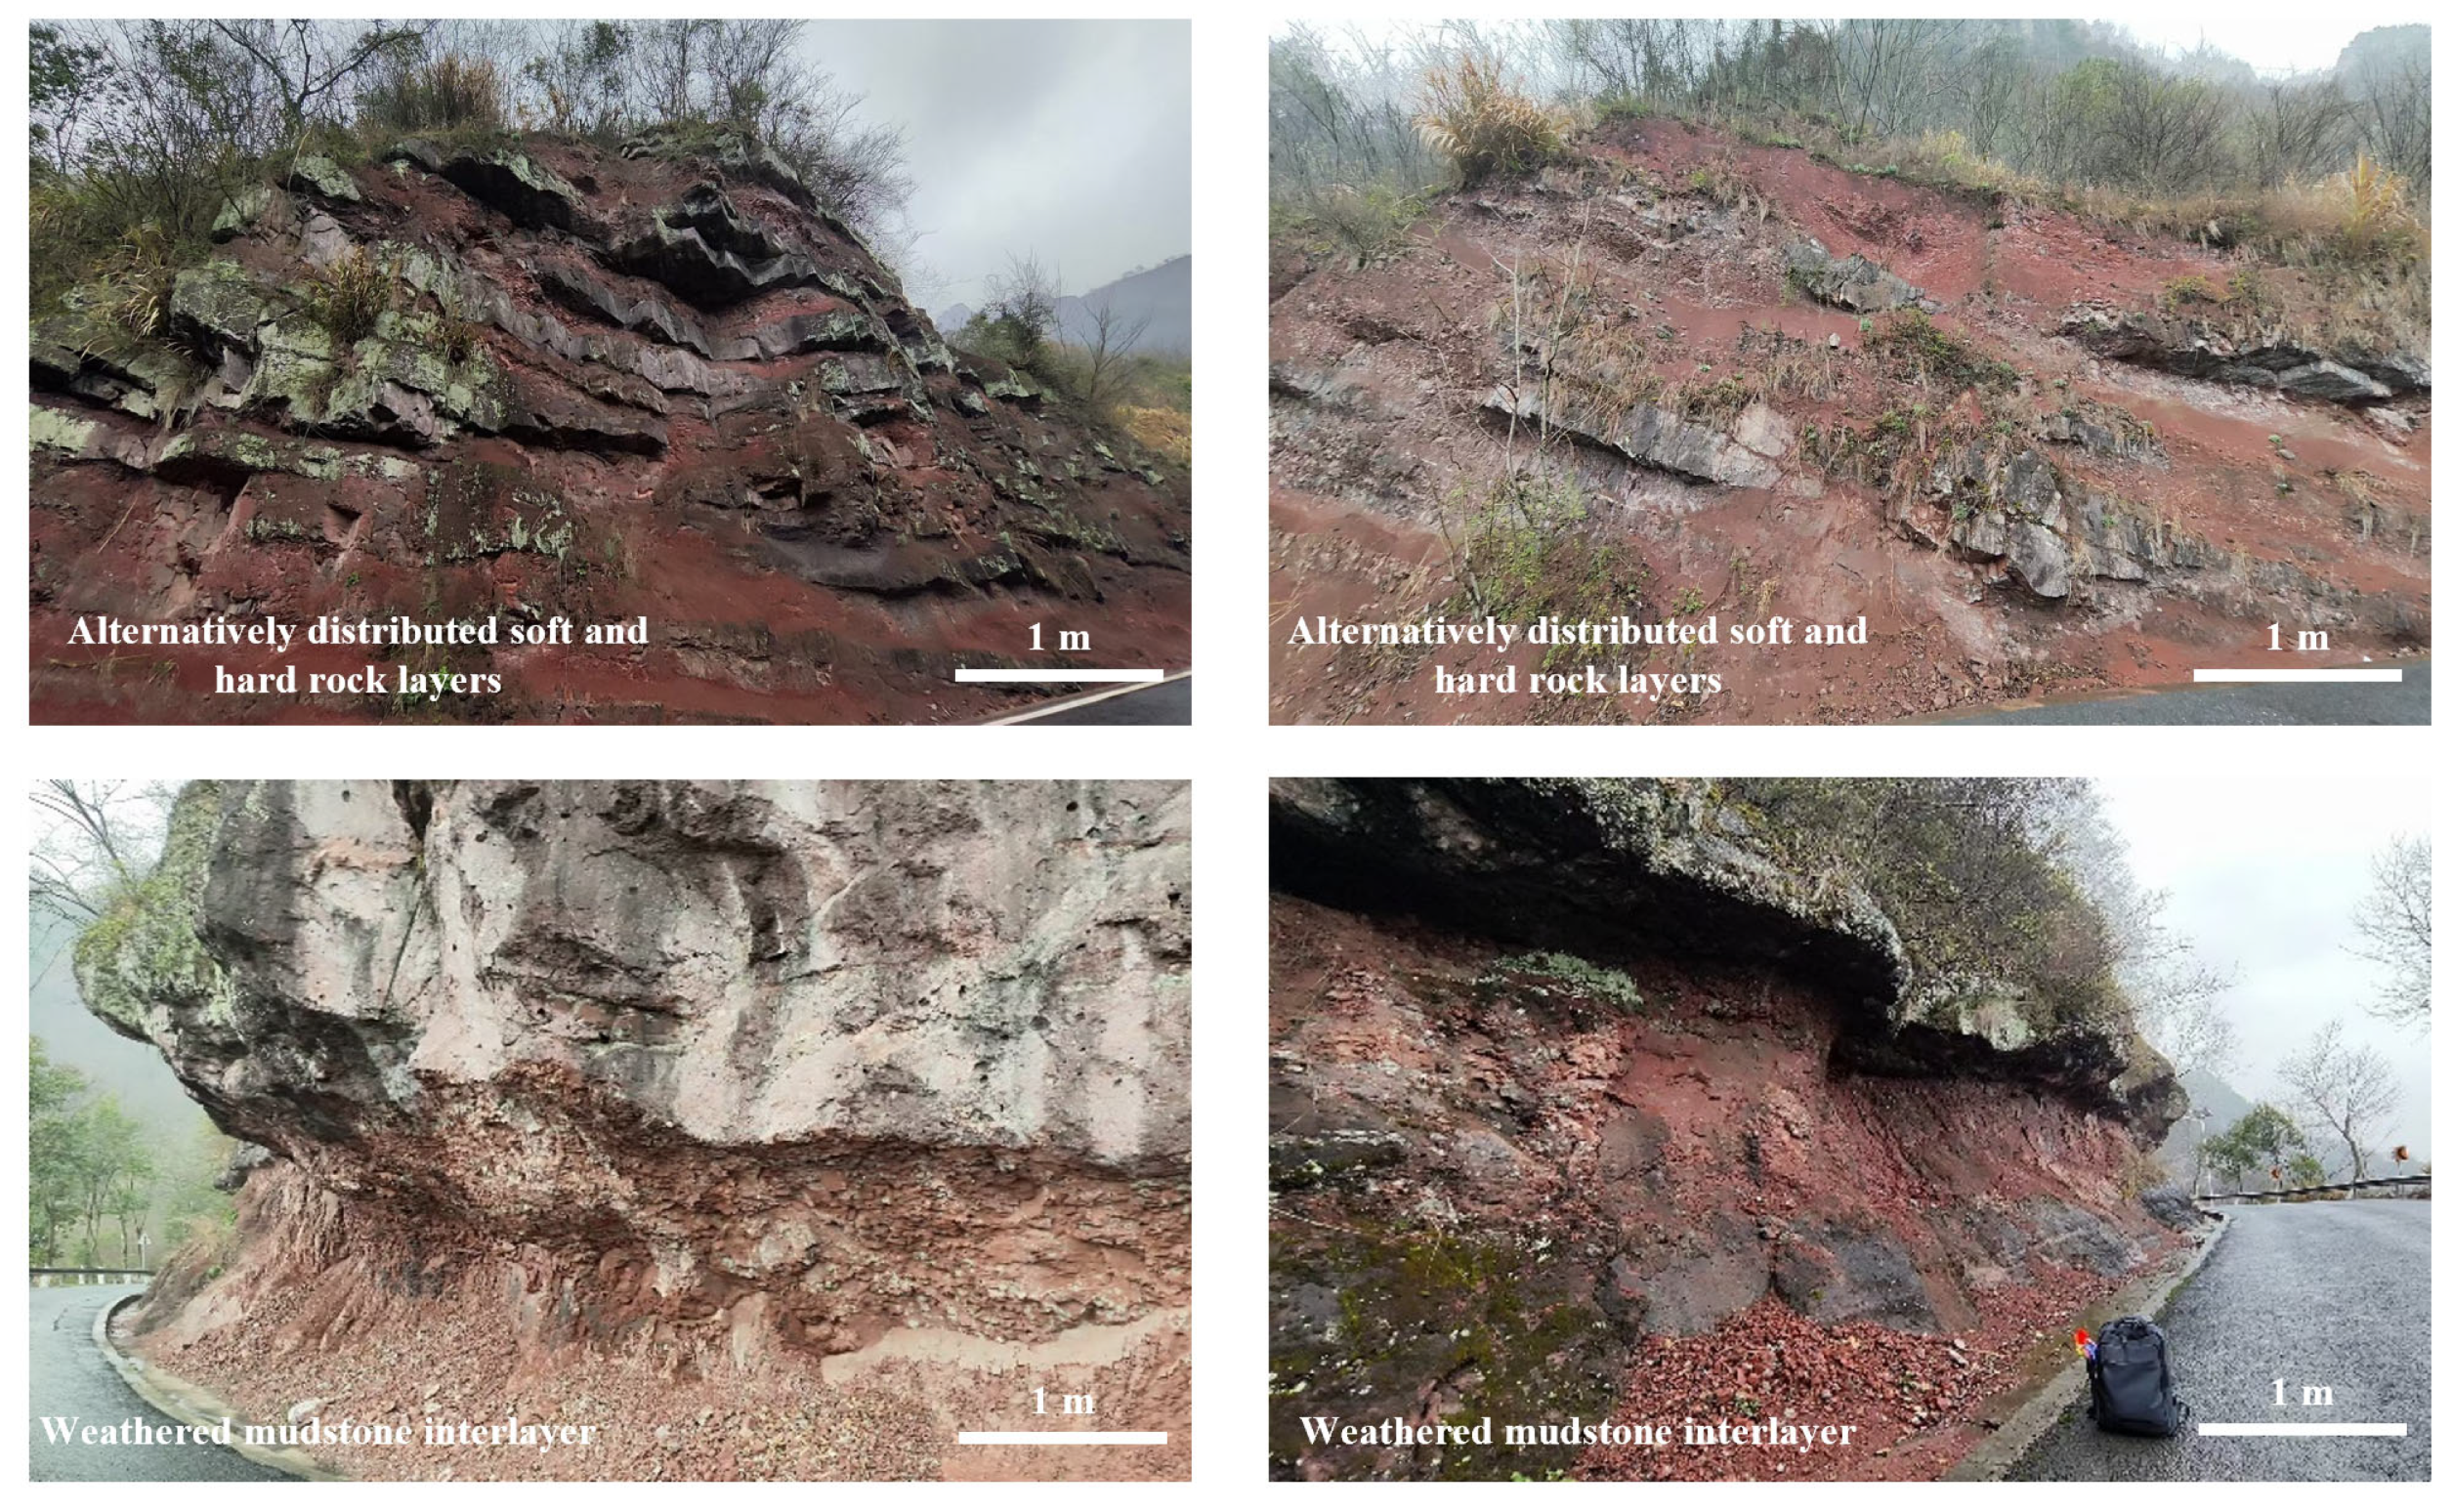
2.1. Slope Models
2.2. Monitoring Points
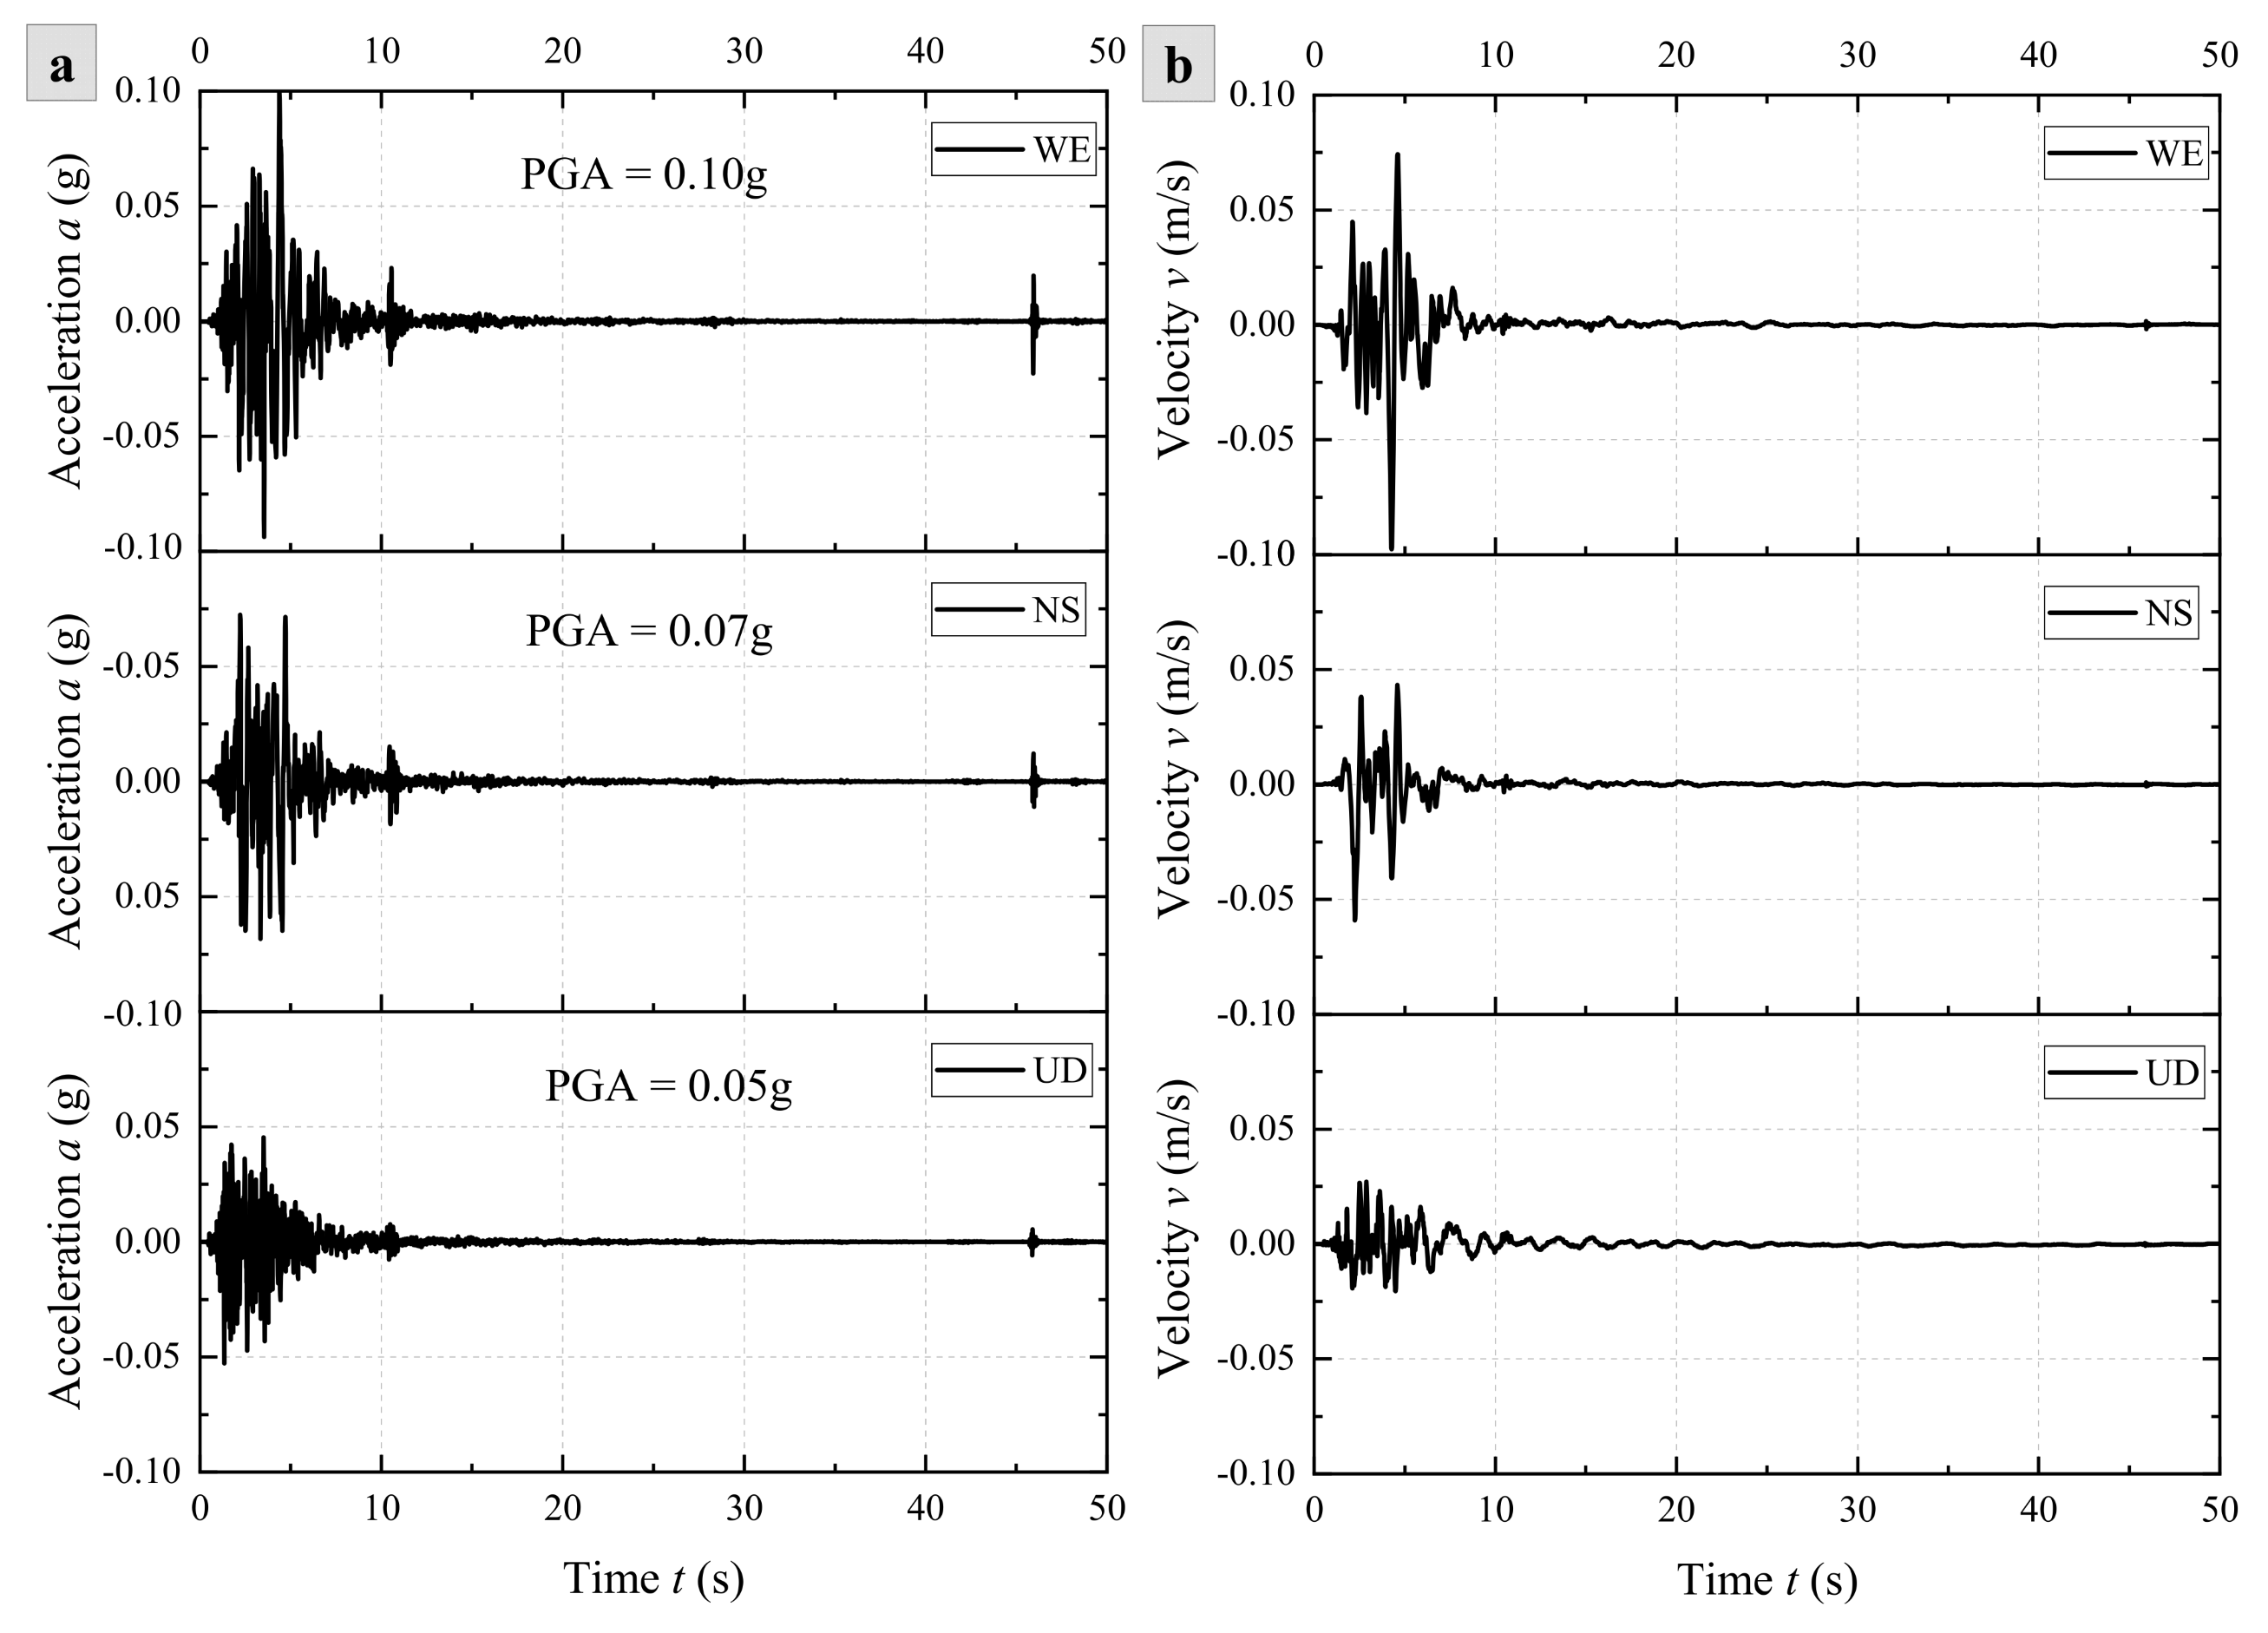
2.3. Seismic Waves
2.4. Simulation Conditions
3. Results
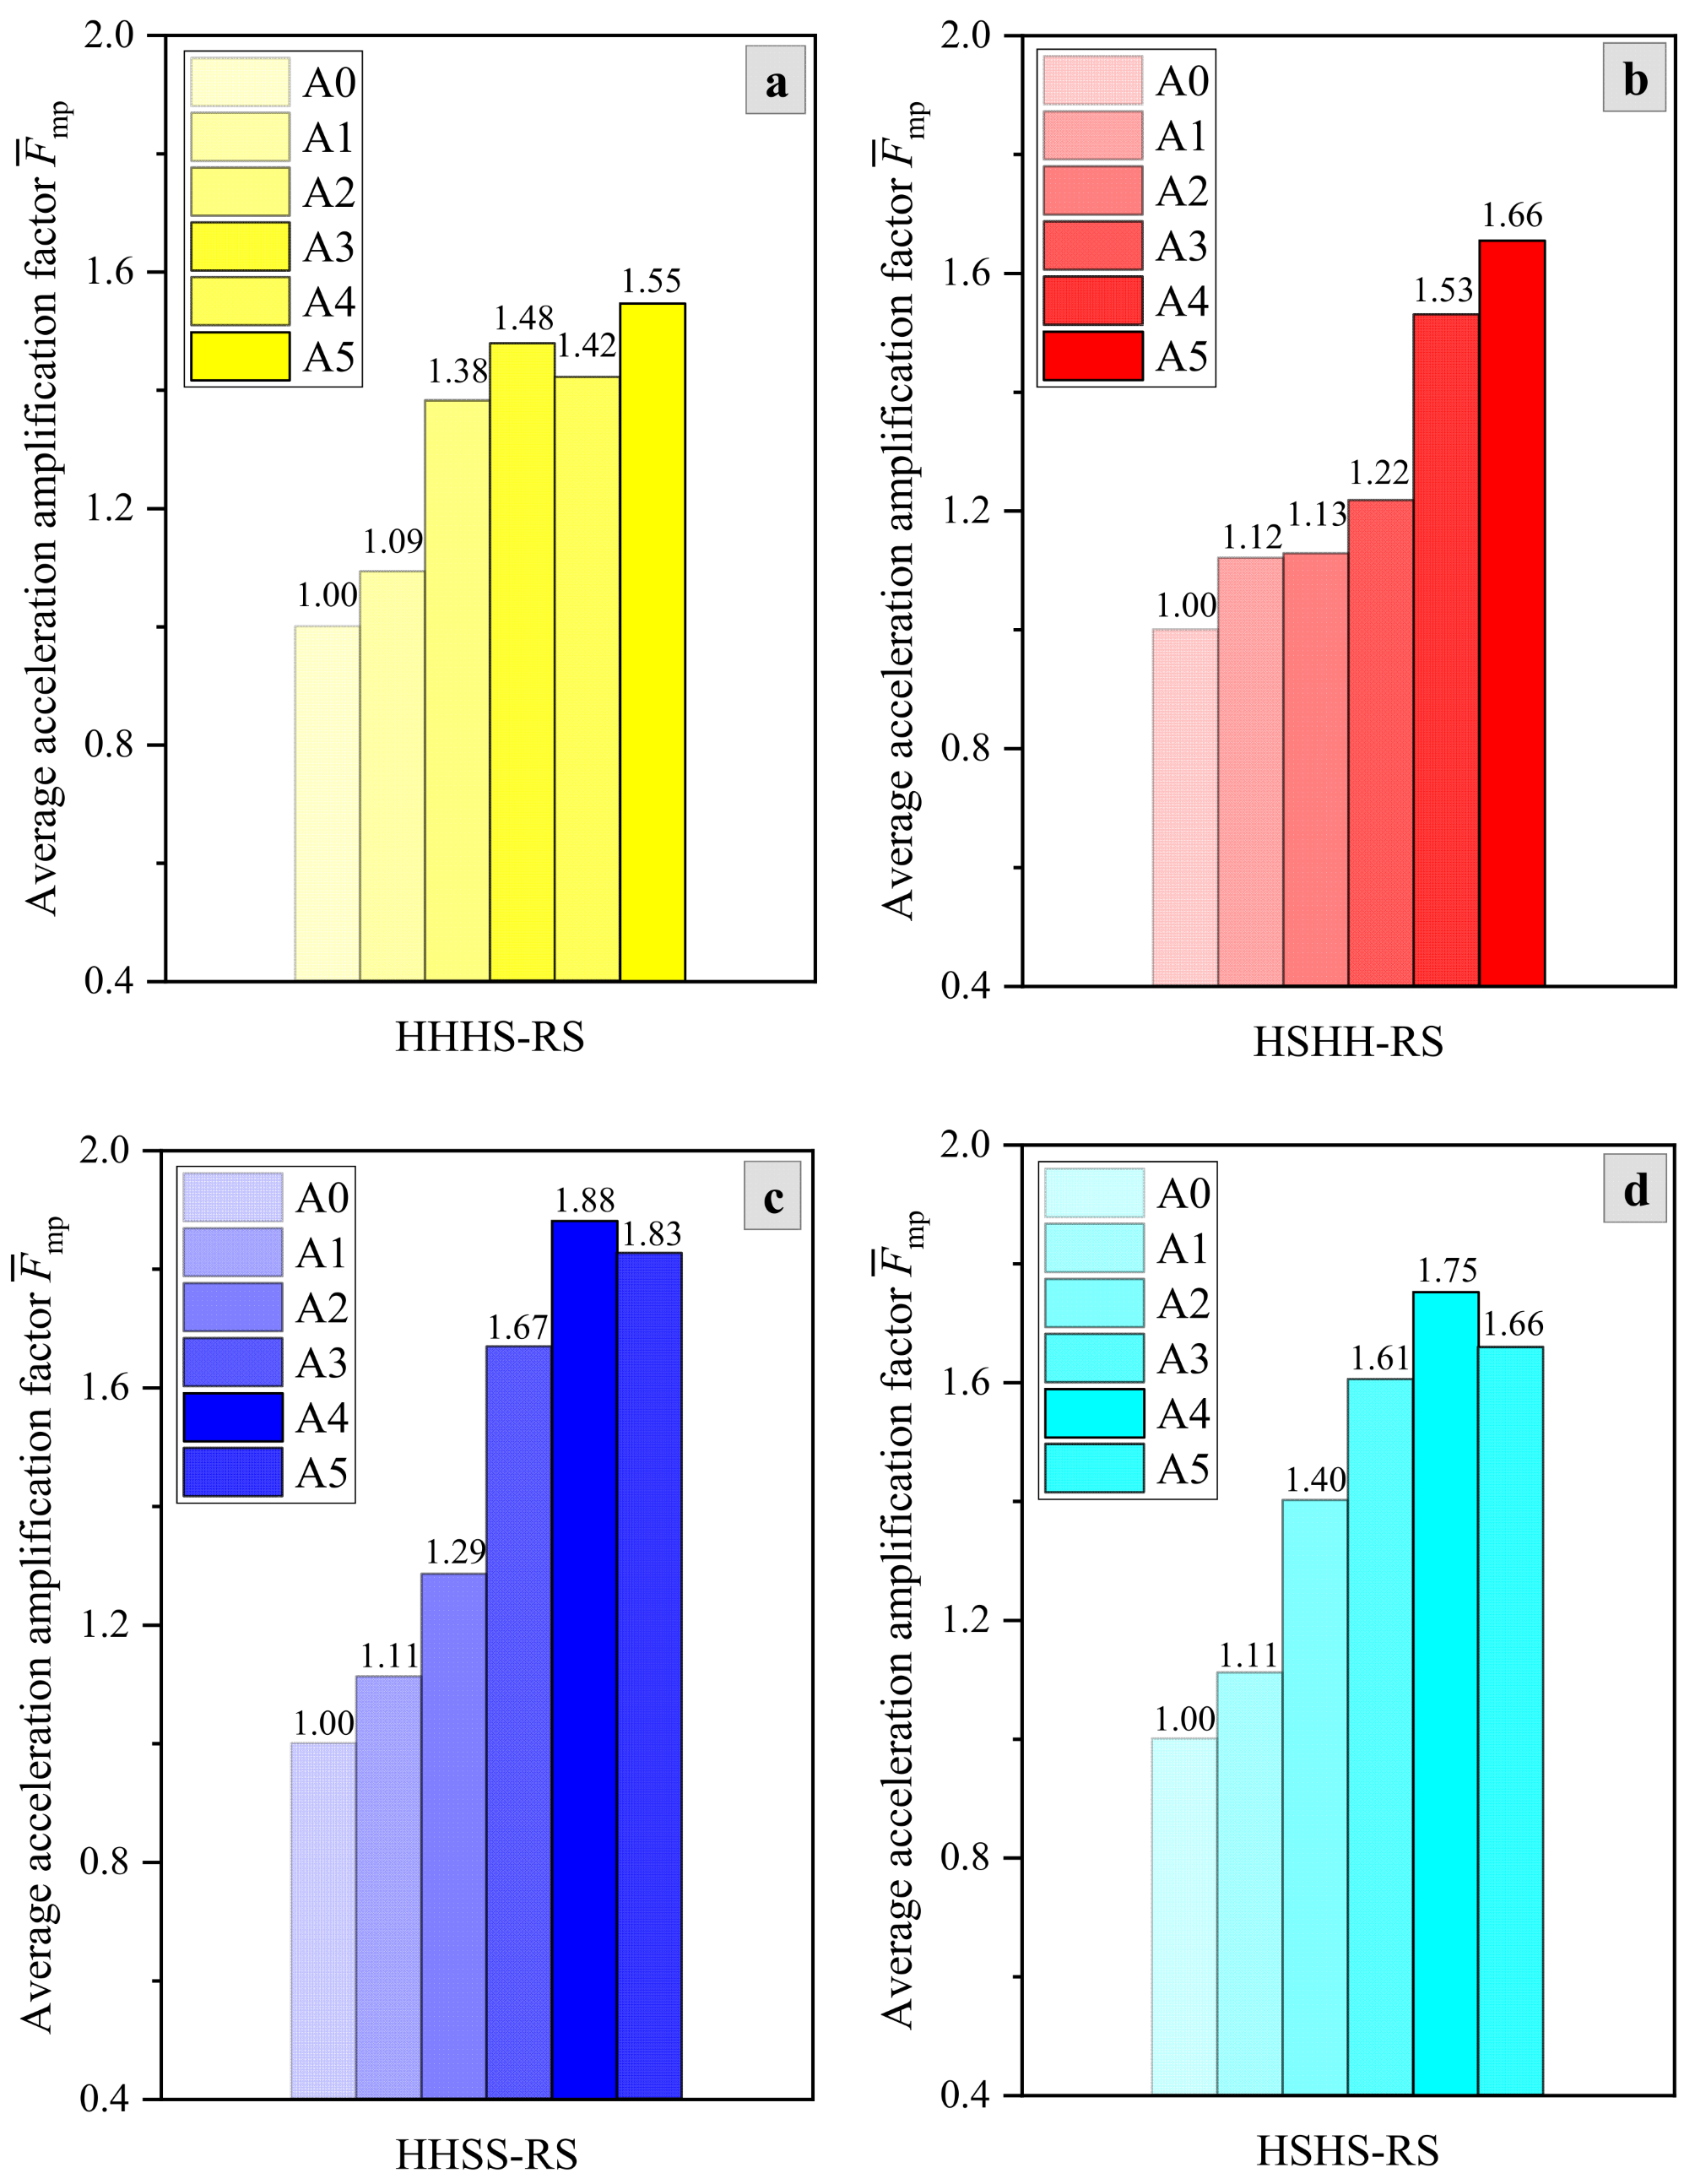
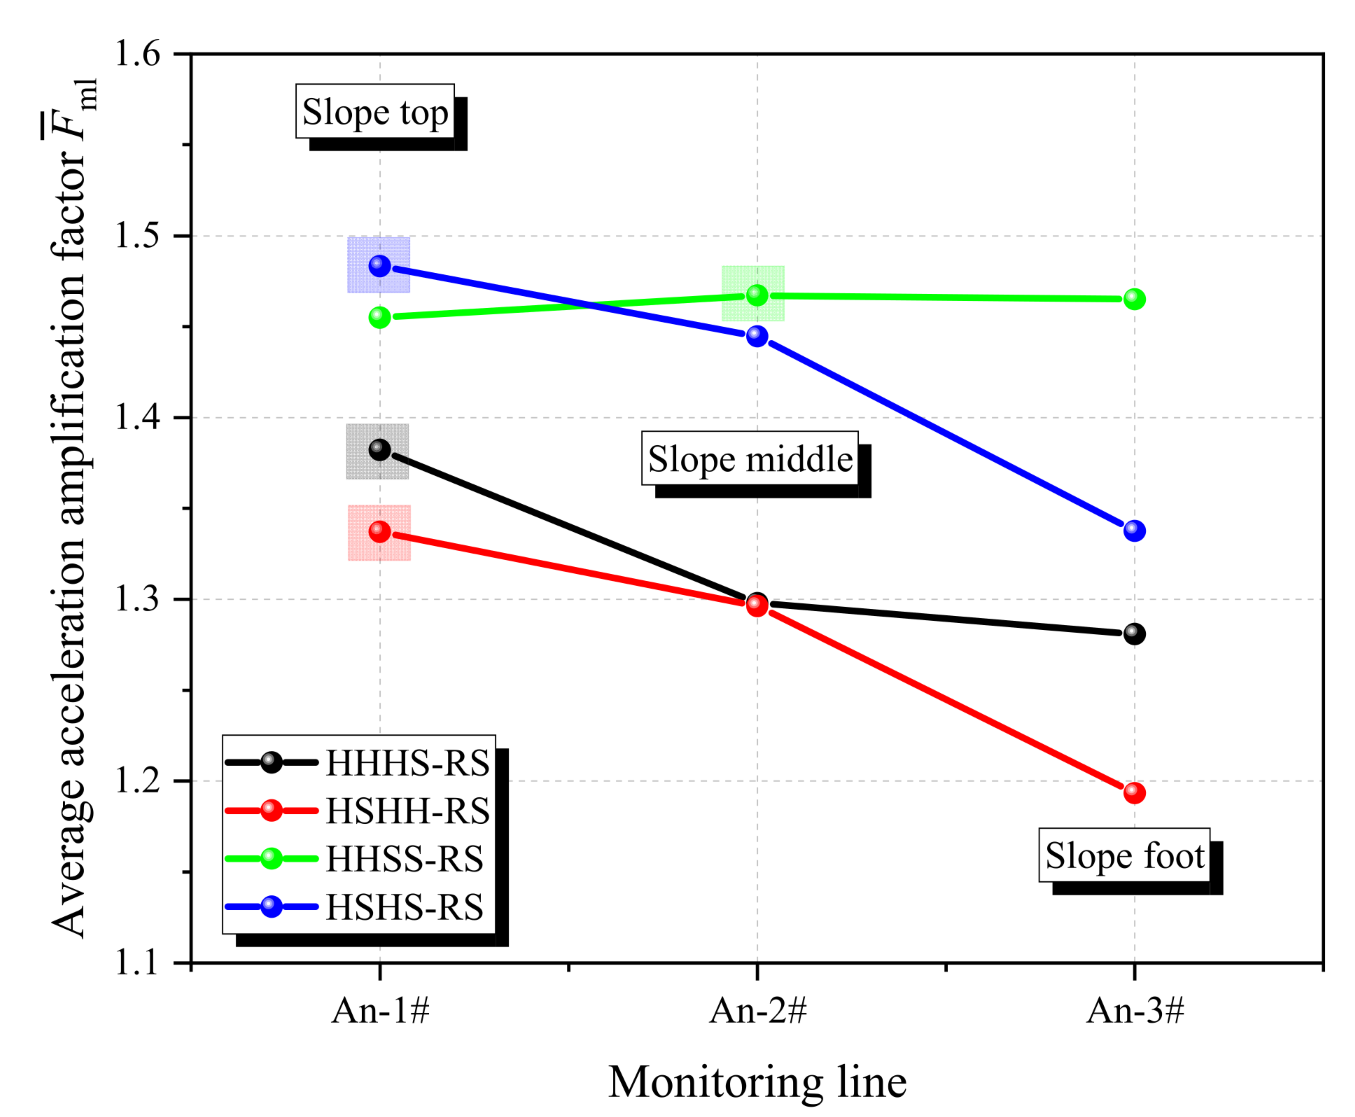
3.1. Effect of Slope Structures
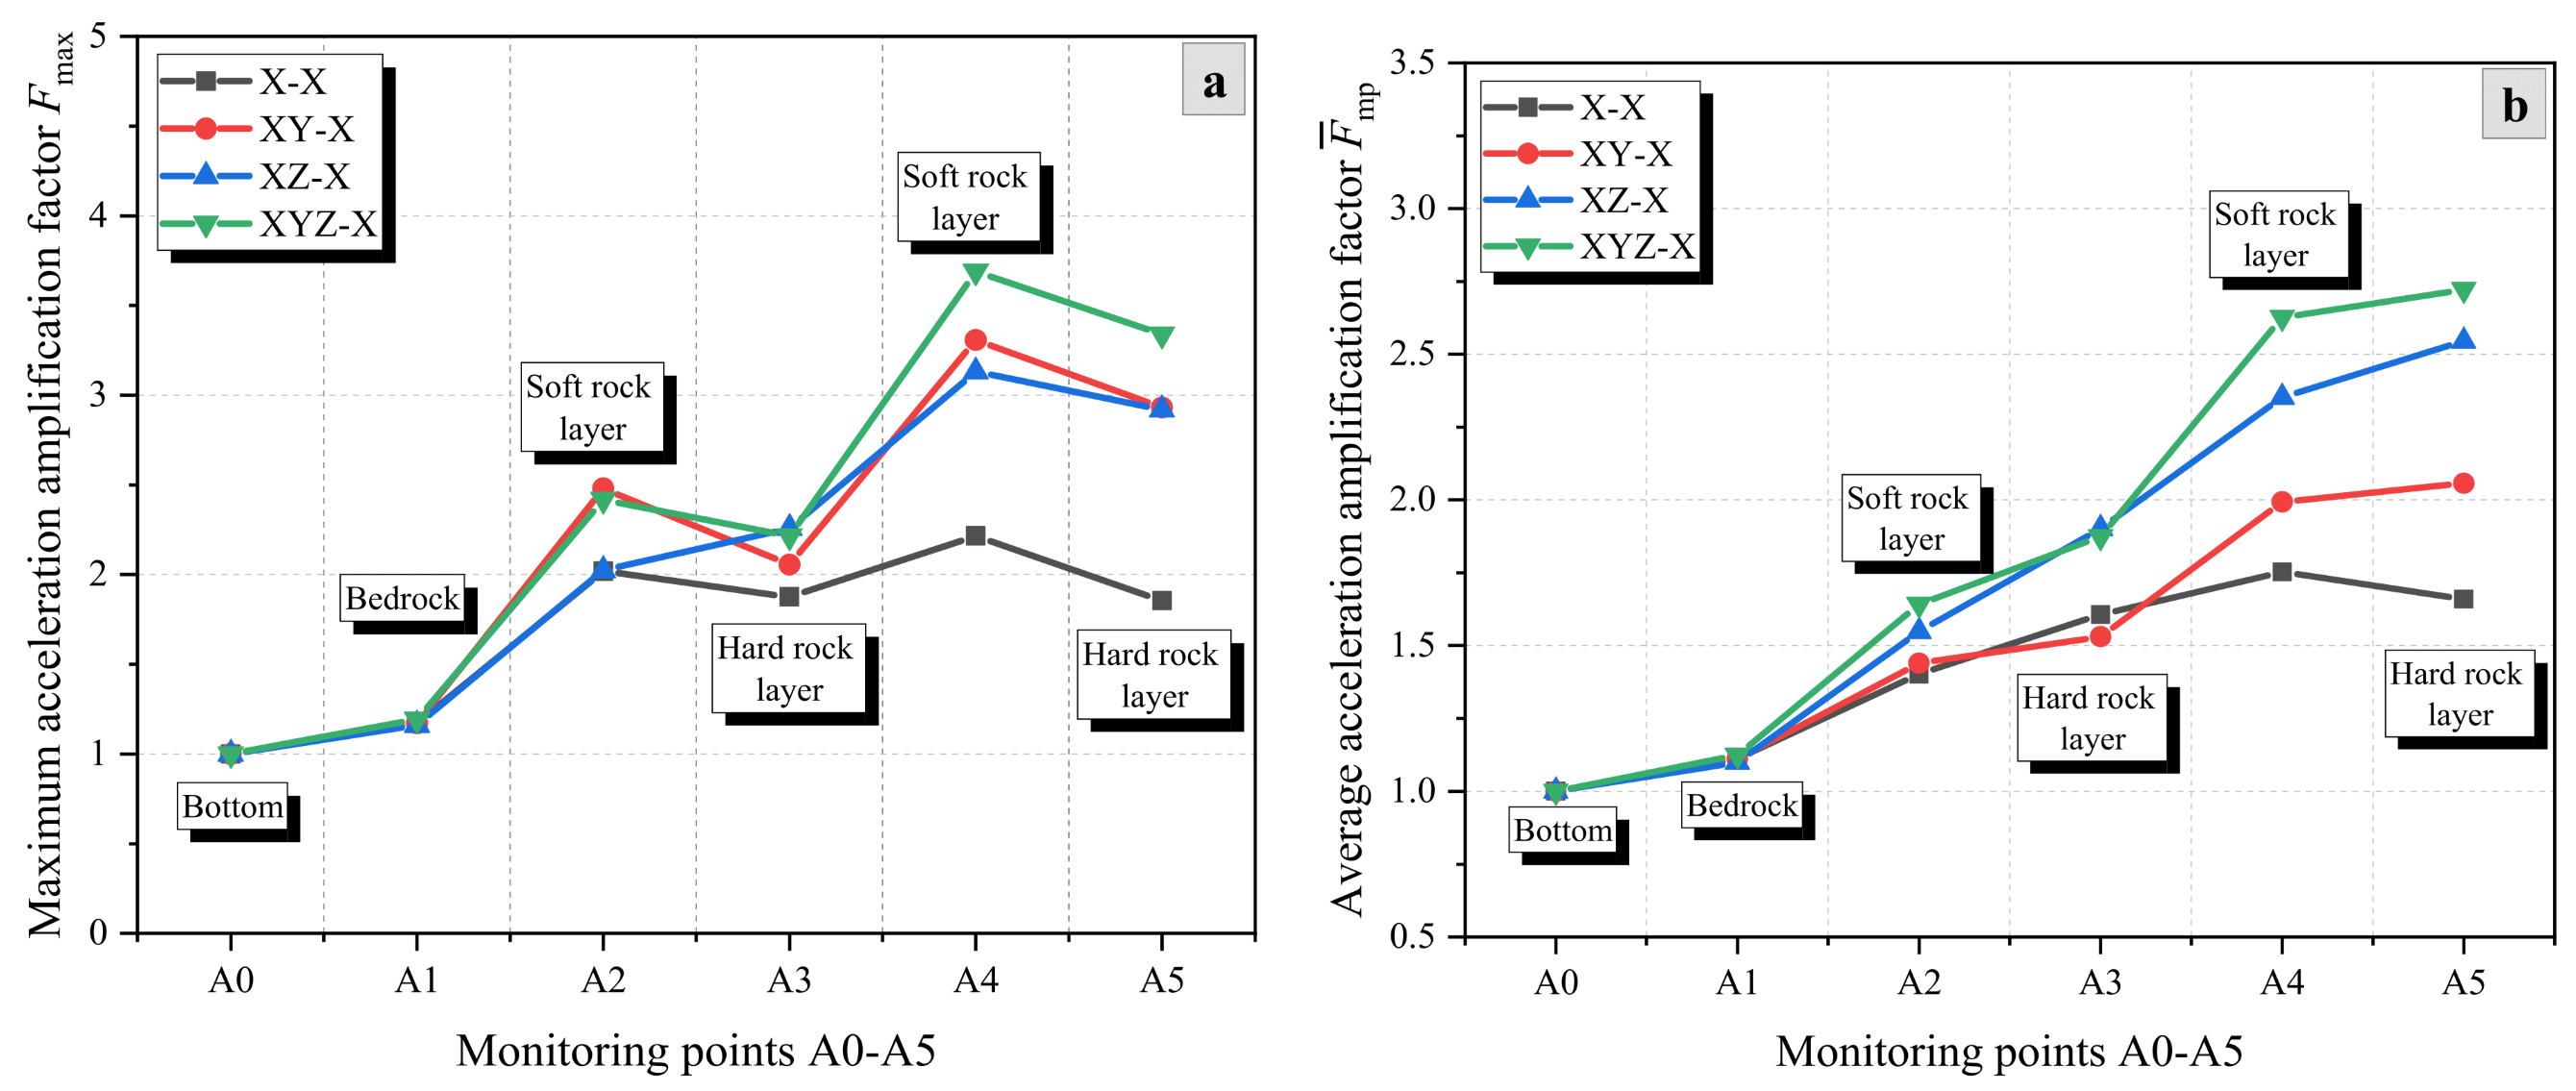
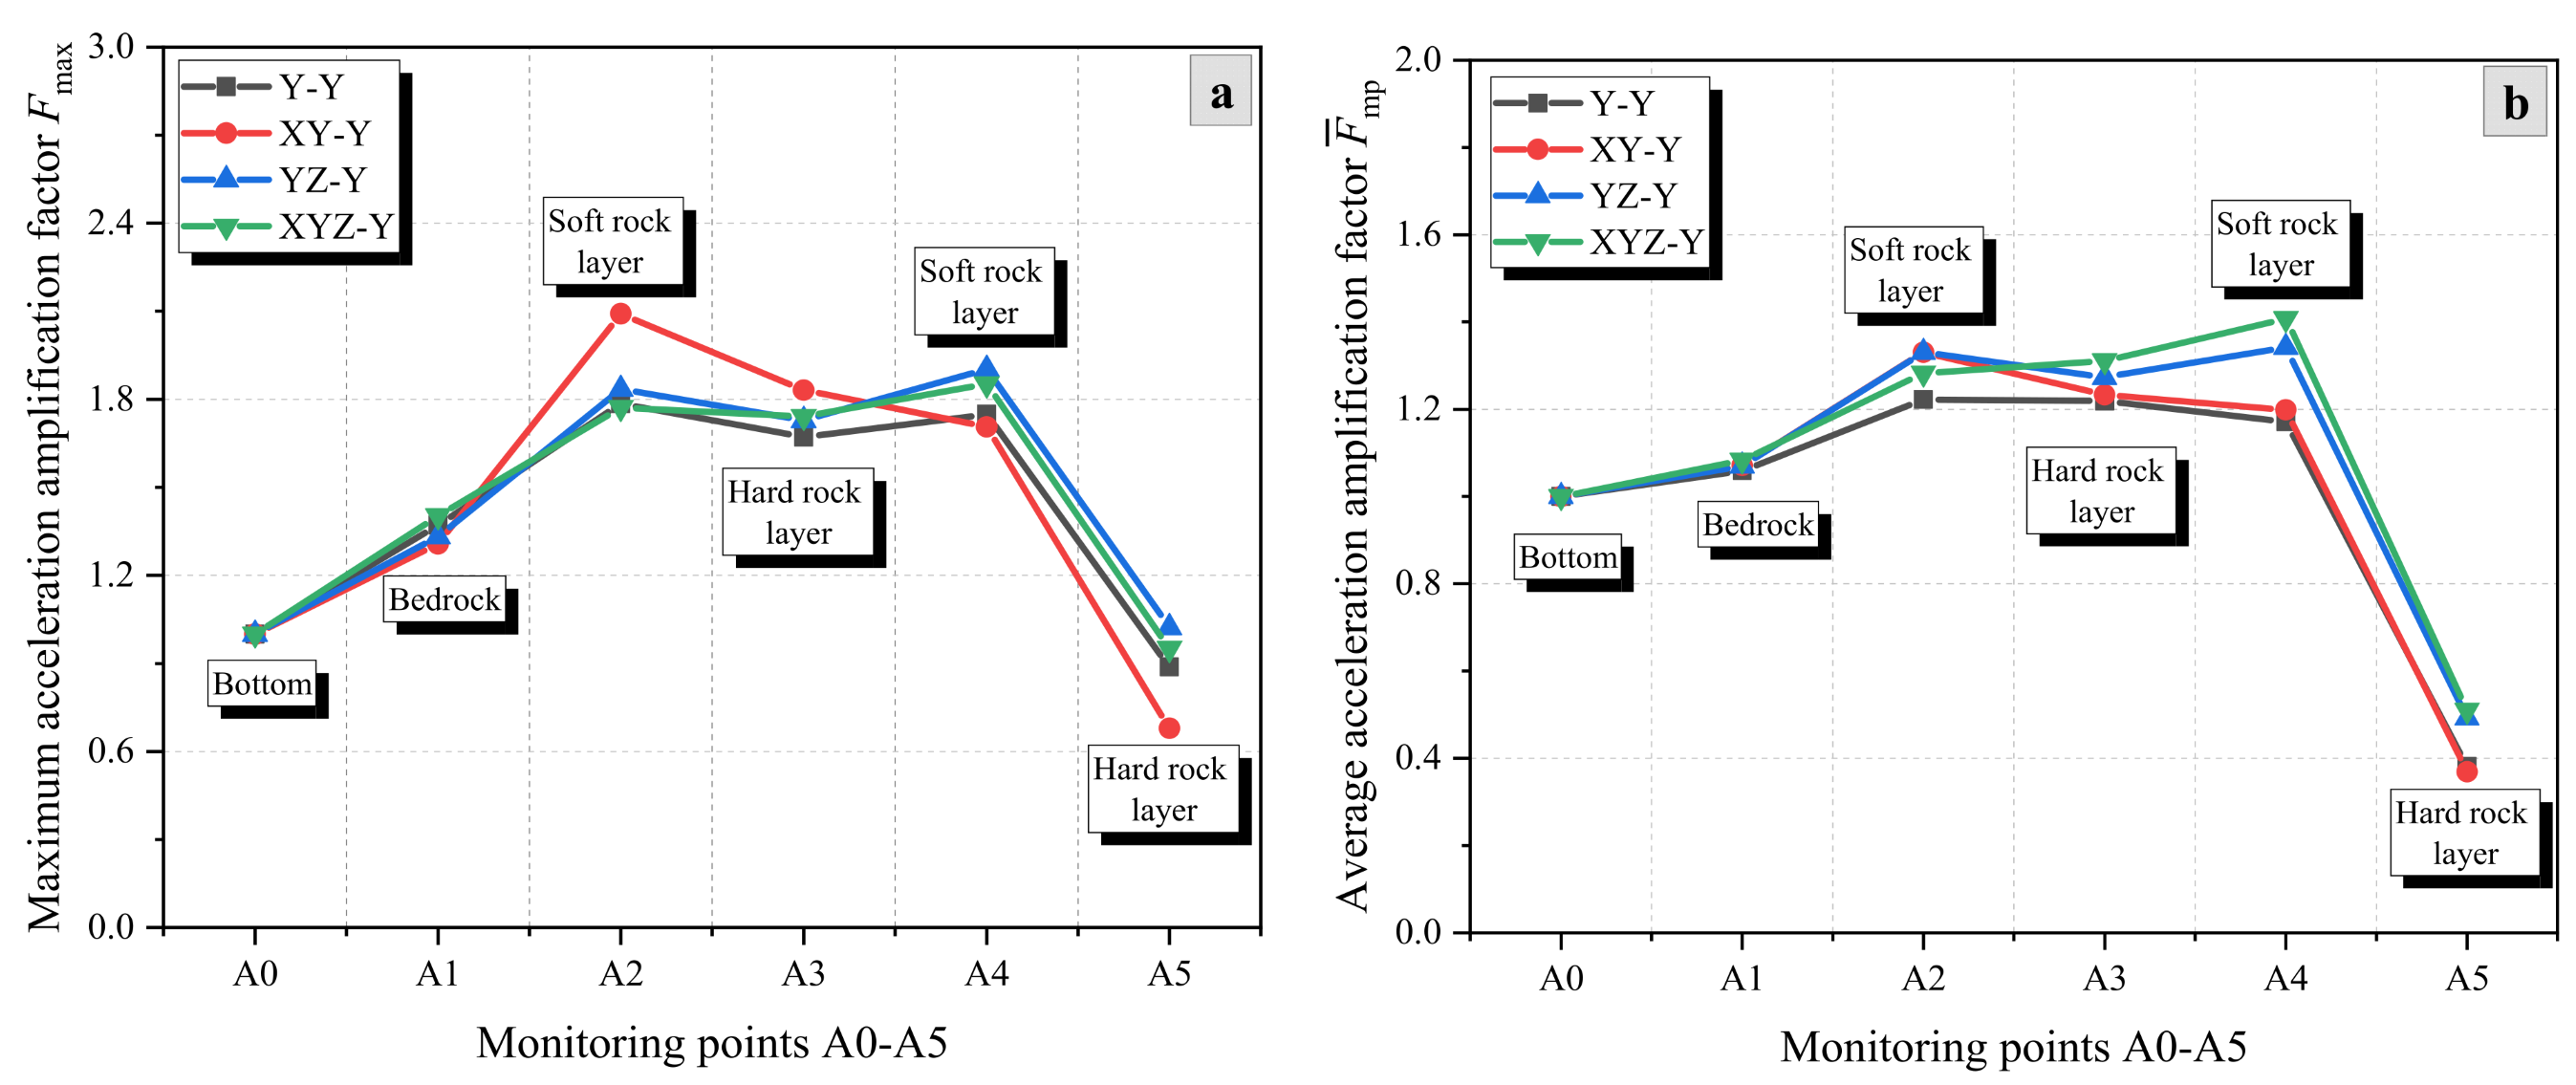
3.2. Effect of Excitation Directions
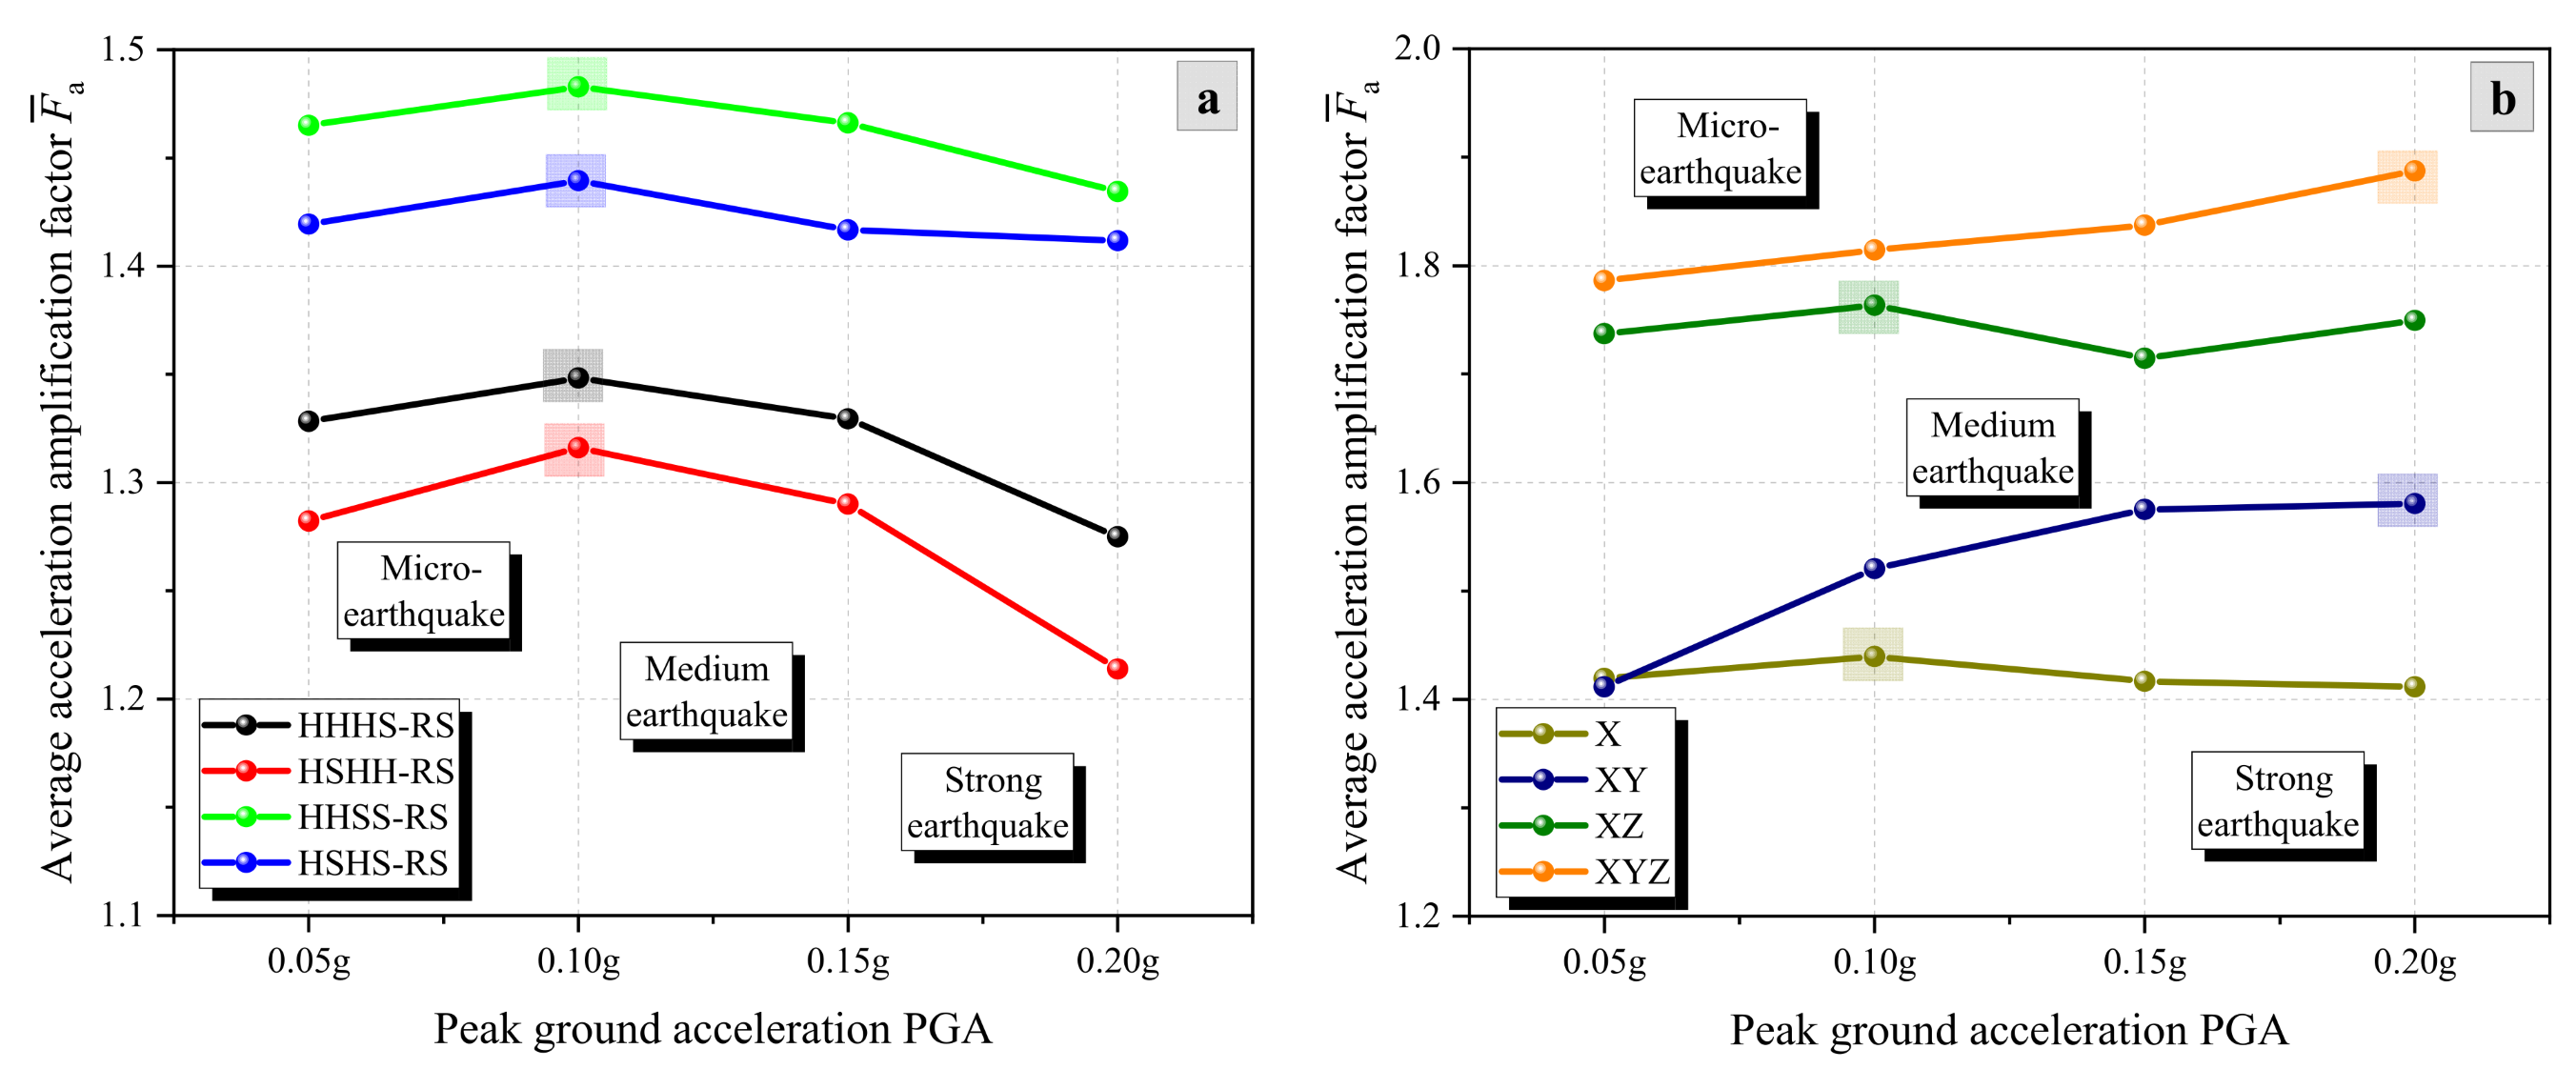
3.3. Effect of Seismic Intensity
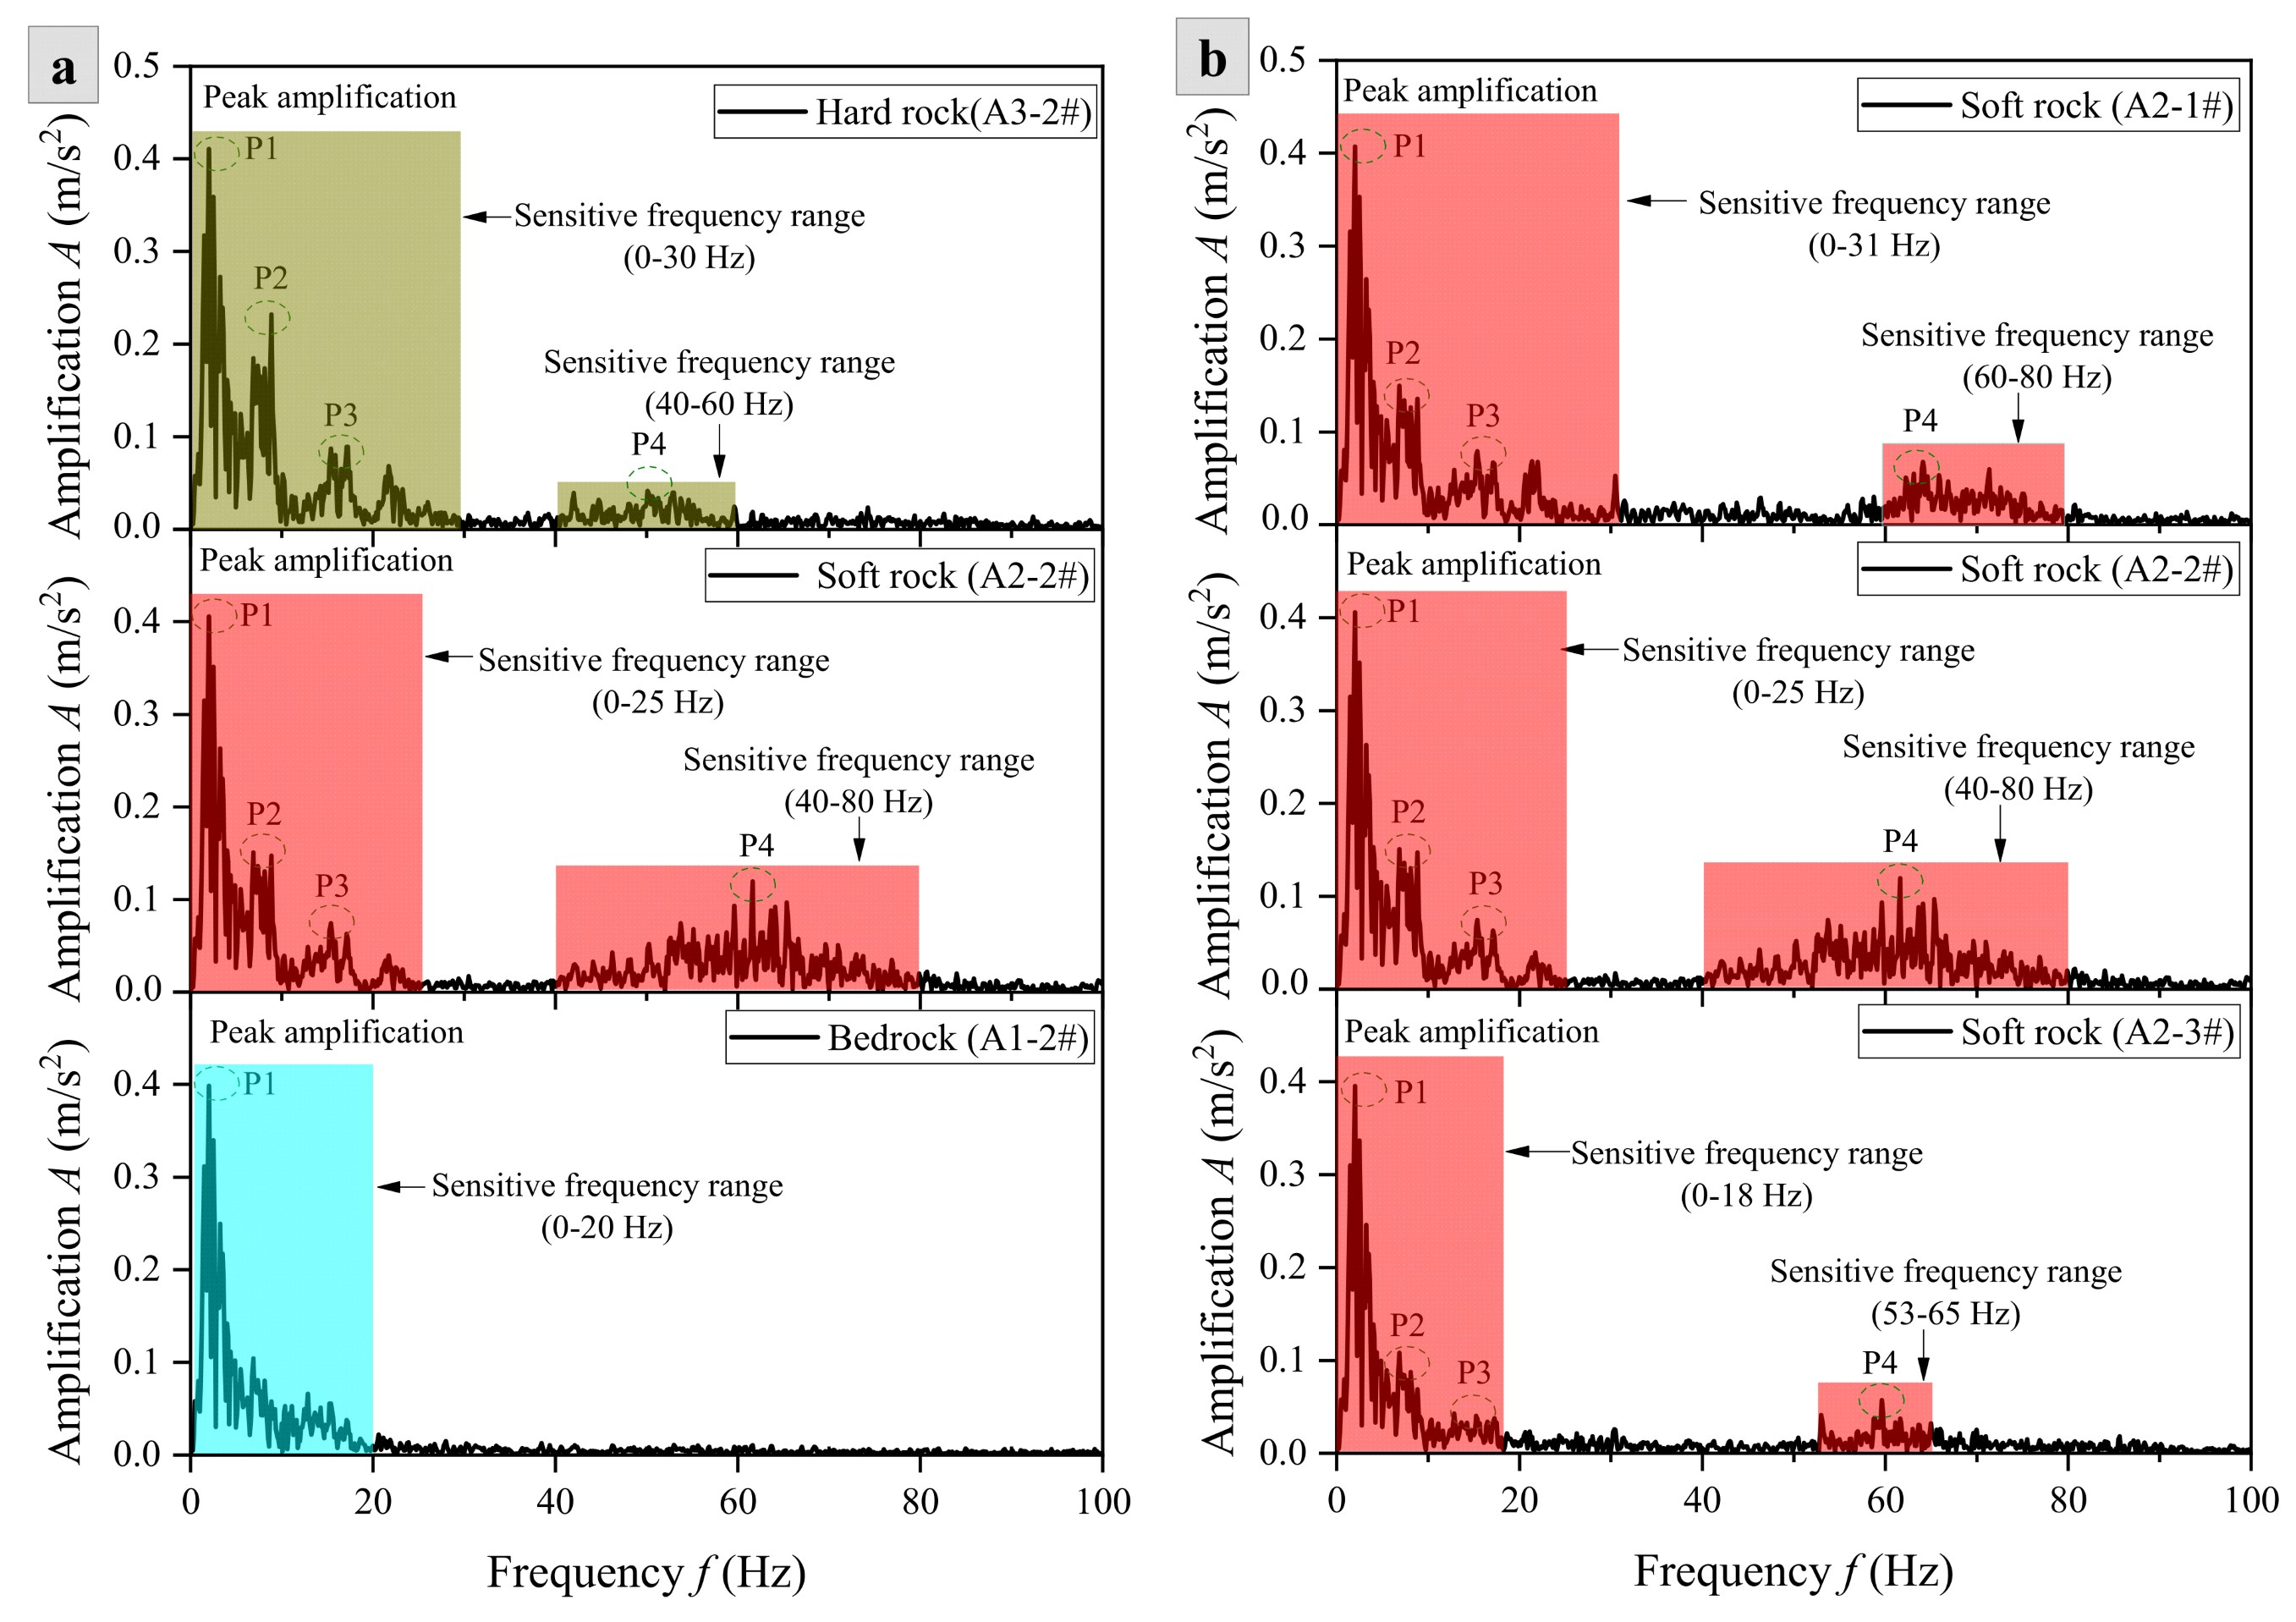
4. Discussion
5. Conclusions
Author Contributions
Funding
Institutional Review Board Statement
Informed Consent Statement
Data Availability Statement
Conflicts of Interest
References
- Gischig, V.; Preisig, G.; Eberhardt, E. Numerical investigation of seismically induced rock mass fatigue as a mechanism contributing to the progressive failure of deep-seated landslides. Rock. Mech. Rock. Eng. 2016, 49, 2457–2478. [Google Scholar] [CrossRef]
- Peng, C.; Regmi, A.D.; Qiang, Z.; Yu, L.; Xiaoqing, C.; Deqiang, C. Natural Hazards and Disaster Risk in One Belt One Road Corridors. In Advancing Culture of Living with Landslides; Mikos, M., Tiwari, B., Yin, Y., Sassa, K., Eds.; WLF 2017; Springer: Cham, Switzerland, 2017. [Google Scholar] [CrossRef]
- Fang, K.; Tang, H.; Li, C.; Su, X.; An, P.; Sun, S. Centrifuge modelling of landslides and landslide hazard mitigation: A review. Geosci. Front. 2023, 14, 101493. [Google Scholar] [CrossRef]
- Wu, Q.; Liu, Y.; Tang, H.; Kang, J.; Wang, L.; Li, C.; Wang, D.; Liu, Z. Experimental study of the influence of wetting and drying cycles on the strength of intact rock samples from a red stratum in the Three Gorges Reservoir area. Eng. Geol. 2023, 314, 107013. [Google Scholar] [CrossRef]
- Lei, H.; Qian, J.; Wu, H. Dynamic response and failure mode of the twin tunnel-landslide using shaking table tests. Acta Geotech. 2023, 18, 4329–4351. [Google Scholar] [CrossRef]
- Zhao, F.; Shi, Z.M.; Yu, S.B. Research on Application of New Combined Support Structures in Reinforcing Rocky Slopes Containing Weak Interlayers. In Proceedings of the 15th ISRM Congress, Salzburg, Austria, 9–14 October 2023. [Google Scholar]
- Latha, G.M.; Garaga, A. Seismic stability analysis of a Himalayan rock slope. Rock. Mech. Rock. Eng. 2010, 43, 831–843. [Google Scholar] [CrossRef]
- Xiao, S.; Feng, W.; Zhang, J. Analysis of the effects of slope geometry on the dynamic response of a near-field mountain from the Wenchuan earthquake. J. Mt. Sci. 2010, 7, 353–360. [Google Scholar] [CrossRef]
- Feng, W.K.; Huang, R.Q.; Xu, Q. Seismic response analysis of horizontal layer slope with soft and hard rock combination. Appl. Mech. Mater. 2011, 90–93, 1326–1333. [Google Scholar] [CrossRef]
- Huang, R.; Zhao, J.; Ju, N.; Li, G.; Lee, M.L.; Li, Y. Analysis of an anti-dip landslide triggered by the 2008 Wenchuan earthquake in China. Nat. Hazards 2013, 68, 1021–1039. [Google Scholar] [CrossRef]
- Li, W.C.; Deng, G.; Cao, W.; Xu, C.; Chen, J.; Lee, M.L. Discrete element modeling of the Hongshiyan landslide triggered by the 2014 Ms 6. 5 Ludian earthquake in Yunnan, China. Environ. Earth Sci. 2019, 78, 1–18. [Google Scholar] [CrossRef]
- Sepúlveda, S.A.; Murphy, W.; Jibson, R.W.; Petley, D.N. Seismically induced rock slope failures resulting from topographic amplification of strong ground motions: The case of Pacoima Canyon, California. Eng. Geol. 2005, 80, 336–348. [Google Scholar] [CrossRef]
- Che, A.; Yang, H.; Wang, B.; Ge, X. Wave propagations through jointed rock masses and their effects on the stability of slopes. Eng. Geol. 2015, 201, 45–56. [Google Scholar] [CrossRef]
- Li, X.P.; Su, L.J.; He, S.M.; Xue, J. Limit equilibrium analysis of seismic stability of slopes reinforced with a row of piles. Int. J. Numer. Anal. Methods Géoméch. 2016, 40, 1241–1250. [Google Scholar] [CrossRef]
- Li, L.Q.; Ju, N.P.; Zhang, S.; Deng, X.X. Shaking table test to assess seismic response differences between steep bedding and toppling rock slopes. Bull. Eng. Geol. Environ. 2019, 78, 519–531. [Google Scholar] [CrossRef]
- Guo, M.Z.; Gu, K.S.; Wang, C. Dynamic response and failure process of a counter-bedding rock slope under strong earthquake conditions. Symmetry 2022, 14, 103. [Google Scholar] [CrossRef]
- Feng, J.; Zhang, Y.; He, J.; Zhu, H.; Huang, L.; Mao, W.; Fu, H.; Li, D. Dynamic response and failure evolution of low-angled interbedding soft and hard stratum rock slope under earthquake. Bull. Eng. Geol. Environ. 2022, 81, 400. [Google Scholar] [CrossRef]
- Miao, S.; Su, L.; Zhang, C.; Liu, Z.; Wang, B.; Dong, Z. Dynamic response characteristics and damage failure process of bedding rock slope in shaking table test. Bull. Eng. Geol. Environ. 2024, 83, 358. [Google Scholar] [CrossRef]
- Li, L. Seismic stability of steep consequent rockslides with different lithology assemblies: A comparative Study. Bull. Eng. Geol. Environ. 2024, 83, 353. [Google Scholar] [CrossRef]
- Graizer, V. Low-velocity zone and topography as a source of site amplification effect on Tarzana hill, California. Soil Dyn. Earthq. Eng. 2009, 29, 324–332. [Google Scholar] [CrossRef]
- Pal, S.; Kaynia, A.M.; Bhasin, R.K.; Paul, D.K. Earthquake stability analysis of rock slopes: A case study. Rock. Mech. Rock. Eng. 2012, 45, 205–215. [Google Scholar] [CrossRef]
- Fan, X.M.; Xu, Q.; Scaringi, G.; Dai, L.X.; Li, W.L.; Dong, X.J.; Zhu, X.; Pei, X.J.; Dai, K.; Havenith, H.B. Failure mechanism and kinematics of the deadly June 24th 2017 Xinmo landslide, Maoxian, Sichuan, China. Landslides 2017, 14, 2129–2146. [Google Scholar] [CrossRef]
- Song, D.; Chen, Z.; Chao, H.; Ke, Y.; Nie, W. Numerical study on seismic response of a rock slope with discontinuities based on the time-frequency joint analysis method. Soil Dyn. Earthq. Eng. 2020, 133, 106112. [Google Scholar] [CrossRef]
- Dong, M.; Zhang, F.; Lv, J.; Hu, M.; Li, Z. Study on deformation and failure law of soft-hard rock interbedding toppling slope base on similar test. Bull. Eng. Geol. Environ. 2020, 79, 4625–4637. [Google Scholar] [CrossRef]
- He, J.X.; Qi, S.W.; Zhan, Z.F.; Guo, S.F.; Li, C.L.; Zheng, B.W.; Huang, X.L.; Zou, Y.; Yang, G.X.; Liang, N. Seismic response characteristics and deformation evolution of the bedding rock slope using a large-scale shaking table. Landslides 2021, 18, 2835–2853. [Google Scholar] [CrossRef]
- Zhu, L.; Cui, S.; Pei, X.; Wang, S.; He, S.; Shi, X. Experimental investigation on the seismically induced cumulative damage and progressive deformation of the 2017 Xinmo landslide in China. Landslides 2021, 18, 1485–1498. [Google Scholar] [CrossRef]
- Guo, M.; Wang, C.; Zhang, H.; Gu, K.; Liu, H. Shaking table test study on dynamic response of bedding rock slope with weak rock. KSCE J. Civ. Eng. 2022, 26, 3342–3354. [Google Scholar] [CrossRef]
- Chen, G.P.; Yang, C.W.; Qu, L.M.; Tong, X.H.; Zhang, K.W.; Zhang, L. Shaking table test and numerical analysis of dynamic response and damage mechanism of a deposit slope with a weak interlayer reinforced by a pile–anchor structure. Structures 2024, 59, 105728. [Google Scholar] [CrossRef]
- Liu, H.X.; Xu, Q.; Zou, W.; Xu, H.B. Shaking table test study on the vertical seismic behavior for the layered rock slopes. J. Vib. Shock 2012, 31, 13–19+28. [Google Scholar] [CrossRef]
- Chen, Z.L.; Hu, X.; Xu, Q. Experimental study of motion characteristics of rock slopes with weak intercalation under seismic excitation. J. Mt. Sci. 2016, 13, 546–556. [Google Scholar] [CrossRef]
- Liu, H.X.; Qiu, T.; Xu, Q. Dynamic acceleration response of a rock slope with a horizontal weak interlayer in shaking table tests. PLoS ONE 2021, 16, e0250418. [Google Scholar] [CrossRef]
- Song, Z.; Liu, Y. Dynamic response differences between bedding and counter-tilt rock slopes with intercalated weak layers. J. Disaster Res. 2007, 11, 681–690. [Google Scholar] [CrossRef]
- Fan, G.; Zhang, J.; Wu, J.; Yan, K. Dynamic response and dynamic failure mode of a weak intercalated rock slope using a shaking table. Rock. Mech. Rock. Eng. 2016, 49, 3243–3256. [Google Scholar] [CrossRef]
- Cao, L.C.; Zhang, J.J.; Liu, F.C.; Liu, Y.; Wu, J.B.; Wang, Z.J. Dynamic response and failure mode of the complex site with tilting strongly weathered layer and local slopes. Chin. J. Rock. Mech. Eng. 2017, 36, 2238–2250. [Google Scholar]
- Yang, C.; Zhang, L.; Liu, Y.; Tian, D.; Guo, X. Shaking table test on dynamic response of bedding rock slopes with weak structural plane under earthquake. Front. Phys. 2020, 8, 556714. [Google Scholar] [CrossRef]
- Bouckovalas, G.D.; Papadimitriou, A.G. Numerical evaluation of slope topography effects on seismic ground motion. Soil Dyn. Earthq. Eng. 2005, 25, 547–558. [Google Scholar] [CrossRef]
- Lin, M.L.; Wang, K.L. Seismic slope behavior in a large-scale shaking table model test. Eng. Geol. 2006, 86, 118–133. [Google Scholar] [CrossRef]
- Zhan, Z.F.; Qi, S.W.; He, N.W.; Zheng, B.W.; Ge, C.F. Shaking table test study of homogeneous rock slope model under strong earthquake. J. Eng. Geol. 2019, 27, 946–954. [Google Scholar] [CrossRef]
- Fu, X.; Fan, G.; Liu, F.C.; Zhang, J.J. Shaking table tests on the acceleration response of anti-dip stratified rock slope with composite retaining structure. China Earthq. Eng. J. 2015, 37, 823–828. [Google Scholar] [CrossRef]
- Jiang, X.L.; Niu, J.Y.; Yang, H.; Zhu, Z.L.; Lian, P.Y. Large-scale shaking table model test study of seismic response characteristics on layered rock slope with tunnel. Chin. J. Appl. Mech. 2018, 35, 762–768. [Google Scholar] [CrossRef]
- Itasca Consulting Group, Inc. Fast Language Analysis of Continua in 3 Dimensions, Version 6.0, User’s Mannual; Itasca Consulting Group, Inc.: Minneapolis, MN, USA, 2018. [Google Scholar]
- Olemskoi, A.I. Theory of elastic waves. Russ. Phys. J. 1980, 23, 988–991. [Google Scholar] [CrossRef]
- Kennett, B. Seismic Wave Propagation in Stratified Media. Geophys. J. Int. 1986, 24, 69–70. [Google Scholar] [CrossRef]
- Yan, K.M.; Liu, F.C.; Zhu, C.H.; Wang, Z.J.; Zhang, J.J. Dynamic responses of slopes with intercalated soft layers under seismic excitations. Chin. J. Rock. Mech. Eng. 2017, 36, 2686–2698. [Google Scholar] [CrossRef]


| Index | Lithology | ||
|---|---|---|---|
| Hard Rock | Soft Rock | Bedrock | |
| Density ρ (kg·m−3) | 2470 | 2070 | 2470 |
| Elastic modulus E (GPa) | 5.92 | 0.065 | 5.92 |
| Poisson’s ratio μ | 0.22 | 0.33 | 0.22 |
| Cohesion c (MPa) | 7.52 | 0.21 | 7.52 |
| Internal friction angle φ (°) | 31 | 22 | 31 |
| Slope Structures | Excitation Direction and Intensity | ||||||
|---|---|---|---|---|---|---|---|
| No. | Qs | Ts | Ls | X | Y | Z | |
| Model 1 | HHHS-RS | 1 | 0.88 m | Lower | 0.05–0.20 g | / | / |
| Model 2 | HSHH-RS | 1 | 0.88 m | Upper | 0.05–0.20 g | / | / |
| Model 3 | HHSS-RS | 1 | 2.64 m | Lower | 0.05–0.20 g | / | / |
| Model 4 | HSHS-RS | 2 | 0.88 m | / | 0.05–0.20 g | / | / |
| Model 4 | HSHS-RS | 2 | 0.88 m | / | / | 0.05–0.20 g | / |
| 2 | 0.88 m | / | / | / | 0.05–0.20 g | ||
| 2 | 0.88 m | / | 0.05–0.20 g | 0.05–0.20 g | / | ||
| 2 | 0.88 m | / | 0.05–0.20 g | / | 0.05–0.20 g | ||
| 2 | 0.88 m | / | / | 0.05–0.20 g | 0.05–0.20 g | ||
| 2 | 0.88 m | / | 0.05–0.20 g | 0.05–0.20 g | 0.05–0.20 g | ||
| No. | Monitoring Points | Slope Top (1#) | Slope Middle (2#) | Slope Foot (3#) | |||||||||
|---|---|---|---|---|---|---|---|---|---|---|---|---|---|
| 0.05 g | 0.10 g | 0.15 g | 0.20 g | 0.05 g | 0.10 g | 0.15 g | 0.20 g | 0.05 g | 0.10 g | 0.15 g | 0.20 g | ||
| HHHS-RS | A0 | 1.00 | 1.00 | 1.00 | 1.00 | 1.00 | 1.00 | 1.00 | 1.00 | 1.00 | 1.00 | 1.00 | 1.00 |
| A1 | 1.14 | 1.12 | 1.01 | 1.14 | 1.12 | 1.02 | 1.14 | 1.11 | 1.03 | 1.13 | 1.12 | 1.03 | |
| A2 | 1.51 | 2.15 | 1.40 | 1.22 | 1.68 | 1.16 | 1.27 | 1.40 | 1.10 | 1.34 | 1.26 | 1.09 | |
| A3 | 1.39 | 1.77 | 1.70 | 1.30 | 1.49 | 1.62 | 1.34 | 1.42 | 1.51 | 1.29 | 1.57 | 1.33 | |
| A4 | 1.38 | 1.60 | 1.52 | 1.41 | 1.42 | 1.30 | 1.37 | 1.48 | 1.40 | 1.34 | 1.52 | 1.34 | |
| A5 | 1.52 | 1.55 | 1.83 | 1.51 | 1.42 | 1.40 | 1.49 | 1.50 | 1.80 | 1.48 | 1.39 | 1.67 | |
| HSHH-RS | A0 | 1.00 | 1.00 | 1.00 | 1.00 | 1.00 | 1.00 | 1.00 | 1.00 | 1.00 | 1.00 | 1.00 | 1.00 |
| A1 | 1.13 | 1.18 | 1.07 | 1.15 | 1.16 | 1.05 | 1.15 | 1.14 | 1.05 | 1.15 | 1.17 | 1.04 | |
| A2 | 1.13 | 1.14 | 1.24 | 1.14 | 1.13 | 1.08 | 1.15 | 1.13 | 1.07 | 1.14 | 1.14 | 1.06 | |
| A3 | 1.16 | 1.30 | 1.55 | 1.16 | 1.31 | 1.26 | 1.16 | 1.24 | 1.07 | 1.16 | 1.17 | 1.07 | |
| A4 | 1.60 | 1.95 | 1.82 | 1.37 | 1.75 | 1.77 | 1.33 | 1.34 | 1.35 | 1.33 | 1.48 | 1.29 | |
| A5 | 1.98 | 1.62 | 1.81 | 1.59 | 1.66 | 2.21 | 1.45 | 1.64 | 1.53 | 1.35 | 1.53 | 1.49 | |
| HHSS-RS | A0 | 1.00 | 1.00 | 1.00 | 1.00 | 1.00 | 1.00 | 1.00 | 1.00 | 1.00 | 1.00 | 1.00 | 1.00 |
| A1 | 1.15 | 1.15 | 1.03 | 1.18 | 1.14 | 1.03 | 1.17 | 1.14 | 1.04 | 1.17 | 1.11 | 1.03 | |
| A2 | 1.31 | 1.27 | 1.08 | 1.44 | 1.30 | 1.09 | 1.33 | 1.28 | 1.19 | 1.58 | 1.38 | 1.16 | |
| A3 | 1.47 | 1.58 | 1.96 | 1.45 | 1.68 | 1.69 | 1.56 | 1.55 | 2.06 | 1.70 | 1.74 | 1.59 | |
| A4 | 1.94 | 1.93 | 1.75 | 1.90 | 1.91 | 1.97 | 1.73 | 1.98 | 1.73 | 2.04 | 1.93 | 1.76 | |
| A5 | 1.90 | 1.84 | 1.81 | 1.76 | 1.95 | 1.77 | 1.96 | 1.98 | 1.60 | 1.88 | 1.85 | 1.62 | |
| HSHS-RS | A0 | 1.00 | 1.00 | 1.00 | 1.00 | 1.00 | 1.00 | 1.00 | 1.00 | 1.00 | 1.00 | 1.00 | 1.00 |
| A1 | 1.17 | 1.13 | 1.06 | 1.17 | 1.13 | 1.04 | 1.17 | 1.12 | 1.03 | 1.16 | 1.11 | 1.04 | |
| A2 | 1.58 | 2.02 | 1.13 | 1.59 | 1.70 | 1.11 | 1.56 | 1.41 | 1.08 | 1.29 | 1.26 | 1.09 | |
| A3 | 1.73 | 1.56 | 1.54 | 1.77 | 1.55 | 1.56 | 1.77 | 1.67 | 1.48 | 1.88 | 1.31 | 1.44 | |
| A4 | 1.76 | 1.65 | 1.93 | 1.87 | 1.76 | 1.72 | 2.22 | 1.61 | 1.55 | 1.78 | 1.58 | 1.60 | |
| A5 | 1.79 | 1.85 | 1.63 | 1.67 | 1.72 | 1.58 | 1.56 | 1.71 | 1.52 | 1.58 | 1.67 | 1.65 | |
Disclaimer/Publisher’s Note: The statements, opinions and data contained in all publications are solely those of the individual author(s) and contributor(s) and not of MDPI and/or the editor(s). MDPI and/or the editor(s) disclaim responsibility for any injury to people or property resulting from any ideas, methods, instructions or products referred to in the content. |
© 2024 by the authors. Licensee MDPI, Basel, Switzerland. This article is an open access article distributed under the terms and conditions of the Creative Commons Attribution (CC BY) license (https://creativecommons.org/licenses/by/4.0/).
Share and Cite
Zhou, Y.; Zhao, F.; Shi, Z. Dynamic Response Mechanism of Bedding Slopes with Alternatively Distributed Soft and Hard Rock Layers Under Different Seismic Excitation Directions: Insights from Numerical Simulations. Materials 2024, 17, 5939. https://doi.org/10.3390/ma17235939
Zhou Y, Zhao F, Shi Z. Dynamic Response Mechanism of Bedding Slopes with Alternatively Distributed Soft and Hard Rock Layers Under Different Seismic Excitation Directions: Insights from Numerical Simulations. Materials. 2024; 17(23):5939. https://doi.org/10.3390/ma17235939
Chicago/Turabian StyleZhou, Yuanyuan, Fei Zhao, and Zhenming Shi. 2024. "Dynamic Response Mechanism of Bedding Slopes with Alternatively Distributed Soft and Hard Rock Layers Under Different Seismic Excitation Directions: Insights from Numerical Simulations" Materials 17, no. 23: 5939. https://doi.org/10.3390/ma17235939
APA StyleZhou, Y., Zhao, F., & Shi, Z. (2024). Dynamic Response Mechanism of Bedding Slopes with Alternatively Distributed Soft and Hard Rock Layers Under Different Seismic Excitation Directions: Insights from Numerical Simulations. Materials, 17(23), 5939. https://doi.org/10.3390/ma17235939