3.1. Effect of Sulfur Amount with Rubber Particles and Micro-Filler
There have not been sufficient research results for the RSC used for sulfur as a binder and rubber particles obtained from used tires as an aggregate. Therefore, the proper range of sulfur for the RSC has not been revealed in the literature. Thus, in this study, the initial sulfur amount of 16% was adopted for the mixture proportion of the RSC and the sulfur amount was increased to 30%, according to the visual inspection of the workability and mixing appearance.
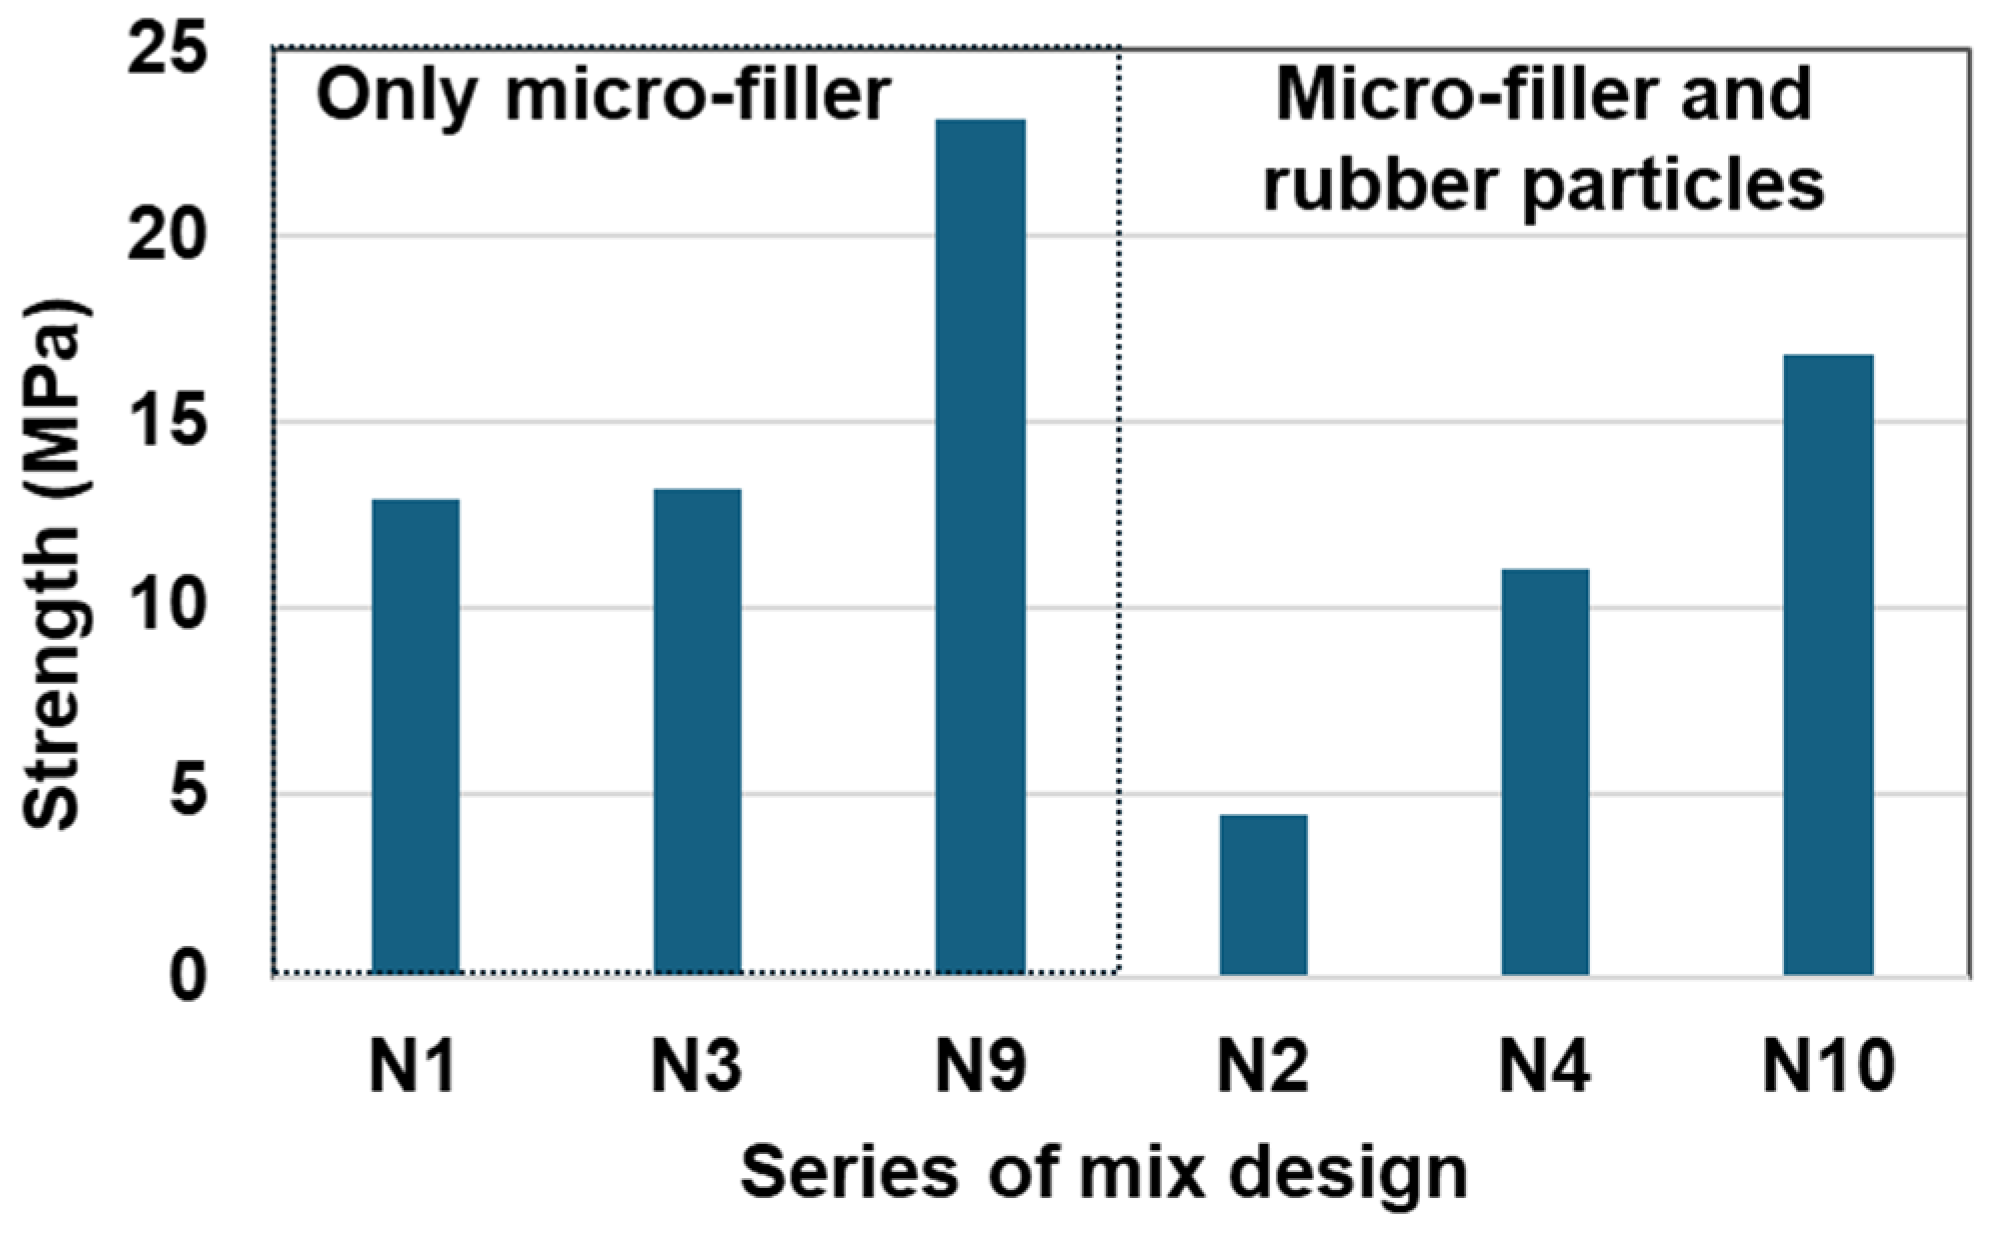
Table 3 and
Figure 4 show the effect of the sulfur amount on the compressive strength of the RSC, in terms of rubber particles and micro-filler. N1, N3, and N9 contained no rubber and had three different sulfur contents, 16%, 26%, and 30%, respectively (see
Table 3). N2, N4, and N10 contained the same amount of rubber particles, a 10% volumetric ratio of rubber to the aggregate (aggregate includes rubber, micro-filler, and sand), as well as had three different sulfur contents.
From N1 and N2, one can see that with the same amount of sulfur binder, when a part of the natural aggregates was replaced by rubber particles, the strength reduced by about a third. In fact, when the specimens of N1 and N2 were mixed, it was observed that the rubber aggregates were only partially covered by the sulfur cement and many voids existed in the matrix, which caused difficulty in mixing and placement. Therefore, sulfur content is a very important mix design parameter for the RSC. Without a sufficient sulfur amount, the strength of the RSC will be reduced by the soft rubber particles (as shown in
Figure 4) as well as by the low-quality sulfur paste matrix. N9 illustrates the better mixture with a sufficient sulfur amount and micro-filler.
In order to study the effect of sulfur cement content on the compressive strength of the RSC, the volumetric sulfur amount of N3 and N4 was increased to 63%, compared to the sulfur amount of N1 and N2. The volumetric ratio of rubber to sand for N1 and N3 was the same (0:100) and so was the ratio of N2 and N4 (10:90), as shown in
Table 3. From
Figure 4, one can see that with the same amount of rubber replacement (about 7%), the strength reduction from N3 to N4 with a 26% sulfur amount is not as high as that from N1 to N2 with 16% sulfur. This means that there must be a sufficient amount of sulfur as the binder, and 16% is not sufficient. Based on the present test data, the sulfur content of N3 and N4 may be considered sufficient, which is 26%. With sufficient binder, the addition of rubber particles still reduces the strength of the RSC, which is the strength reduction observed in N3 and N4. As shown in
Table 3 and
Figure 4, in case the rubber particles and micro-filler are mixed additionally as aggregates, the sulfur binder shall be increased for workability.
Based on the results of
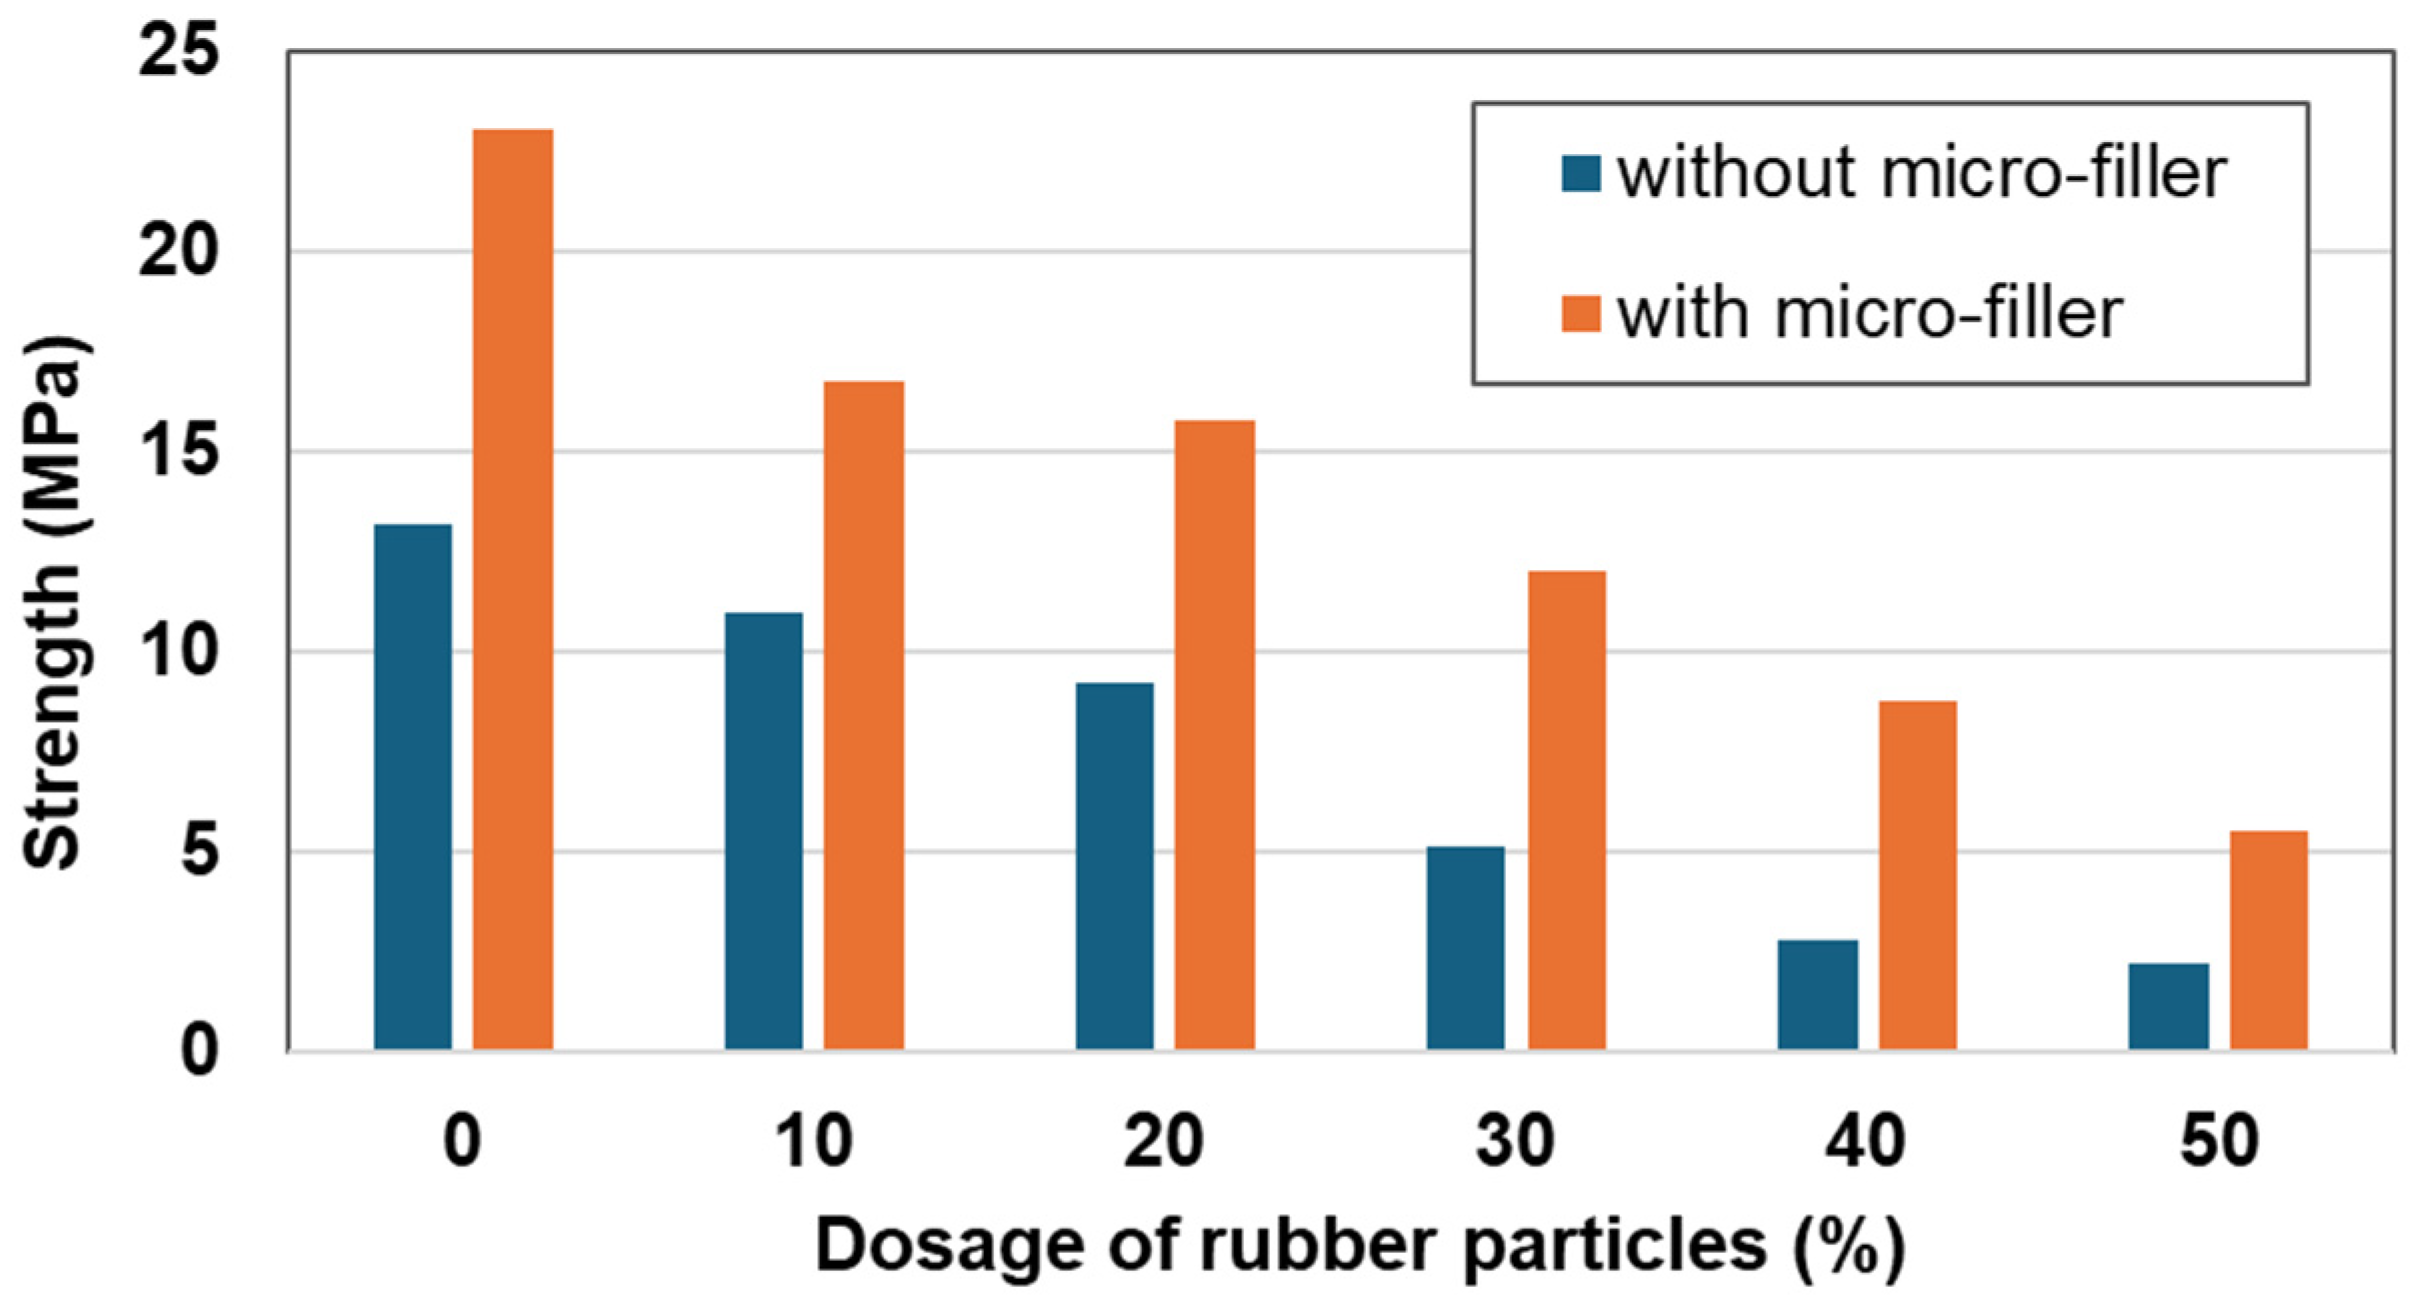
Figure 4, the effect of the rubber particles is investigated in
Table 4. The test series of N3 to N8 is demonstrated for the increment of rubber particles and that of N9 to N14 is added with a micro-filler of 7%. In
Figure 5, it is very clear that, with the increase in rubber content, the compressive strength of the RSC decreases considerably. This result is expected because the strength of the rubber particles is much lower than that of the sulfur concrete (without rubber). One important result shown in
Figure 5 is that with the addition of micro-filler, the compressive strength of the RSC is increased dramatically. In particular, for the high rubber contents from 30 to 50%, the compressive strengths of the RSC with micro-filler are doubled compared to those without the micro-filler. This means that the micro-filler reduces the porosity of the RSC and improves the strength of the material significantly.
The two test series in
Figure 5 are almost parallel with almost the same negative slope, which means that the micro-filler can improve only the properties of the sulfur matrix and cannot compensate the strength loss due to the addition of the rubber particles. It also means that the improvement of the matrix by the micro-filler is not affected by the rubber particles. In other words, the strengthening of the matrix by micro-filler and the reduction in strength by the added rubber particles are two independent mechanisms.
Based on the results of N9 in
Figure 4 and
Figure 5, additional tests were prepared to investigate the effect of sulfur content with micro-filler and rubber particles.
Figure 6 indicates the strength comparison among specimens N12, N15 and N16 in
Table 5. For these test series, the volumetric ratio of rubber to aggregate (aggregate includes cement, rubber, and sand) was kept as a constant 30%, while the sulfur contents were different, from 30% to 37%. The sulfur contents of N12, N15, and Nl6 were 1:1.1:1.23, respectively. The strength ratios of the three specimens were 1:0.84:0.78. It is important to see that the advantages of increasing the sulfur content are the compressive strength and workability of the RSC only in a certain range. If the sulfur content is beyond a critical value, the strength of the RSC will decrease. This indicates that the sulfur amount should be controlled within a proper range because excessive sulfur in the mixture has an adverse effect on its strength. Based on the results obtained in this study, the starting value for the sulfur proportion is about 30% of the total volume. A sulfur content that is less than the critical value may result in low workability, difficulty in mixing and placement, and low strength; a sulfur content that is higher than the critical value may lead to a reduction in the strength of the RSC.
3.2. Effect of Micro-Filler
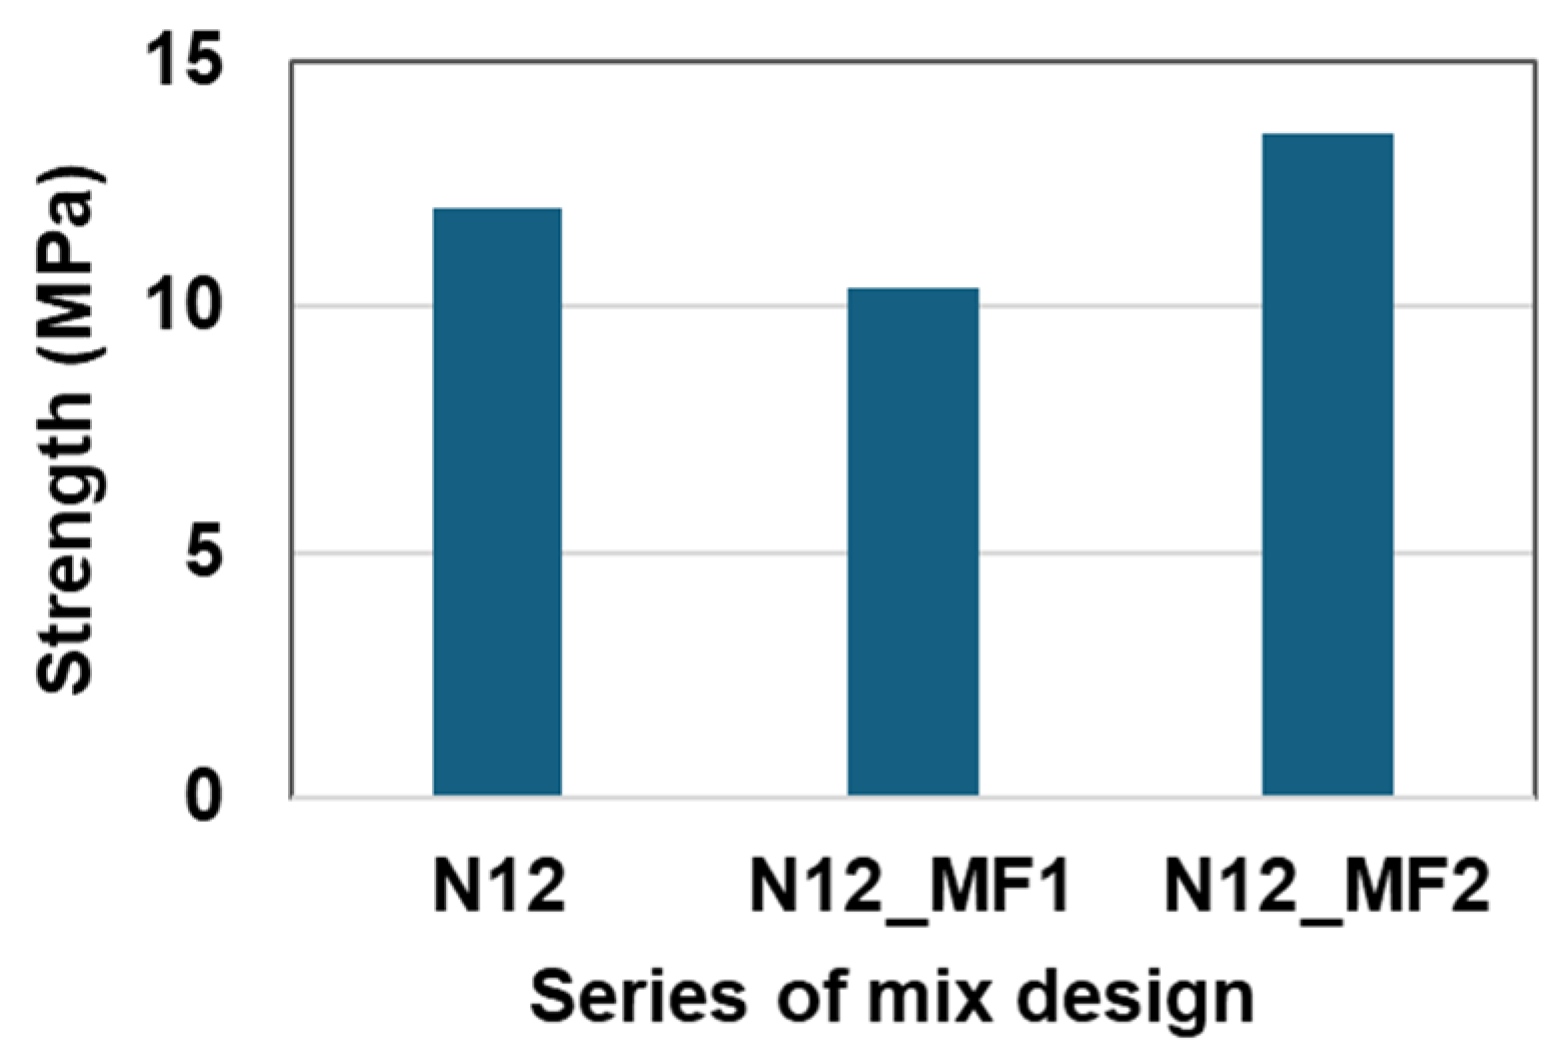
Table 6 was designated for the effect of micro-filler on the compressive strength of RSC. The content of the micro-filler was fixed at 7% of the total volume. In order to find the optimal micro-filler content, several micro-filler contents of 3% and 5% were applied to additional RSC mixture series and tested for their compressive strength. The mixture proportions of N12, N12_MF1, and N12_MF2 with different micro-filler contents are listed in
Table 6 and the test results are shown in
Figure 7. It can be seen that N12_MF2 is 13% higher than N12 in compression strength. The micro-filler content of N12_MF2 is about 5% of the total volume. Therefore, 5% micro-filler by volume can be considered the best content in this study.
While fixing the micro-filler content to 5%, the effects of the rubber content on RSC strength with increments of rubber content were investigated. The mixture series from N12_MF2 to N12_MF7 had the same sulfur and micro-filler contents and different rubber contents ranging from 0% to 50% of the rubber to aggregate ratio.
Figure 8 shows the effect of the rubber dosage on the compressive strength of the RSC. It can be seen that the strength decreases when the rubber content increases, similar to the trend shown in
Figure 5. The difference between
Figure 5 and
Figure 8 is the micro-filler content. In
Figure 8, among the mixture proportions of N12_MF2 to N12_MF7, the lowest reduced strength ratio is N12_MF5, with 20% rubber particle and 5% micro-filler.
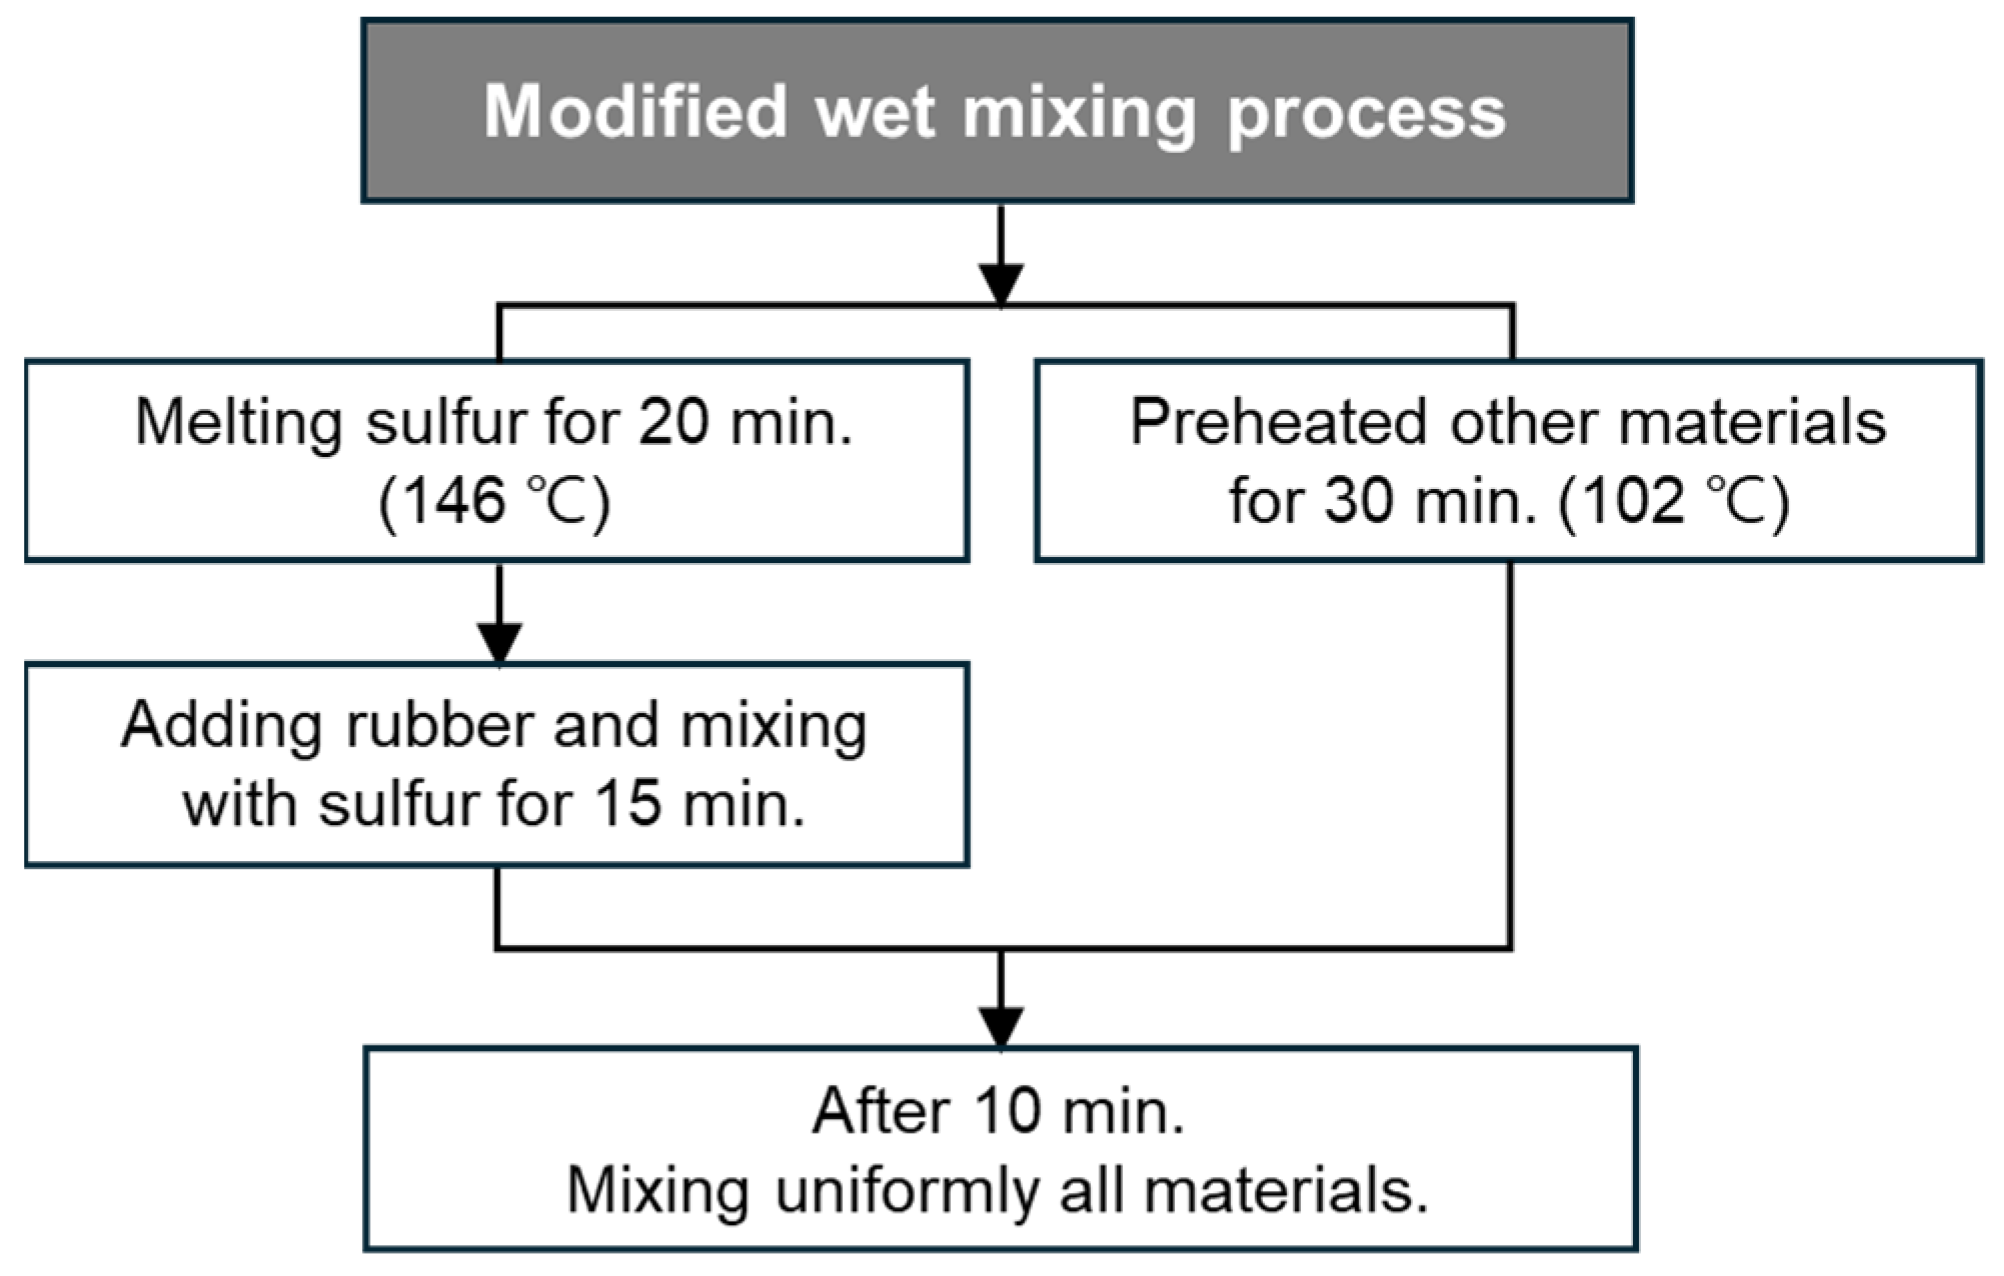
3.3. Effect of Wet Mixing Process
As previously mentioned regarding RSC, the main factor influencing compressive strength is the micro-filler, which fills the voids and gaps between the aggregates such as the sand and rubber particles. Another significant factor affecting mechanical properties is the mixing process, which can be either dry or wet. The differences between these two mixing processes were described in the previous chapter. To explore the differences between the dry and wet mixing processes, the baseline mixtures of N12 and N12_MF2 were used for comparison. For the wet mixing process, a series of mixtures from W1 to W5 was proposed, with the total aggregate content fixed at 70% and the sulfur content increased, as shown in
Table 7.
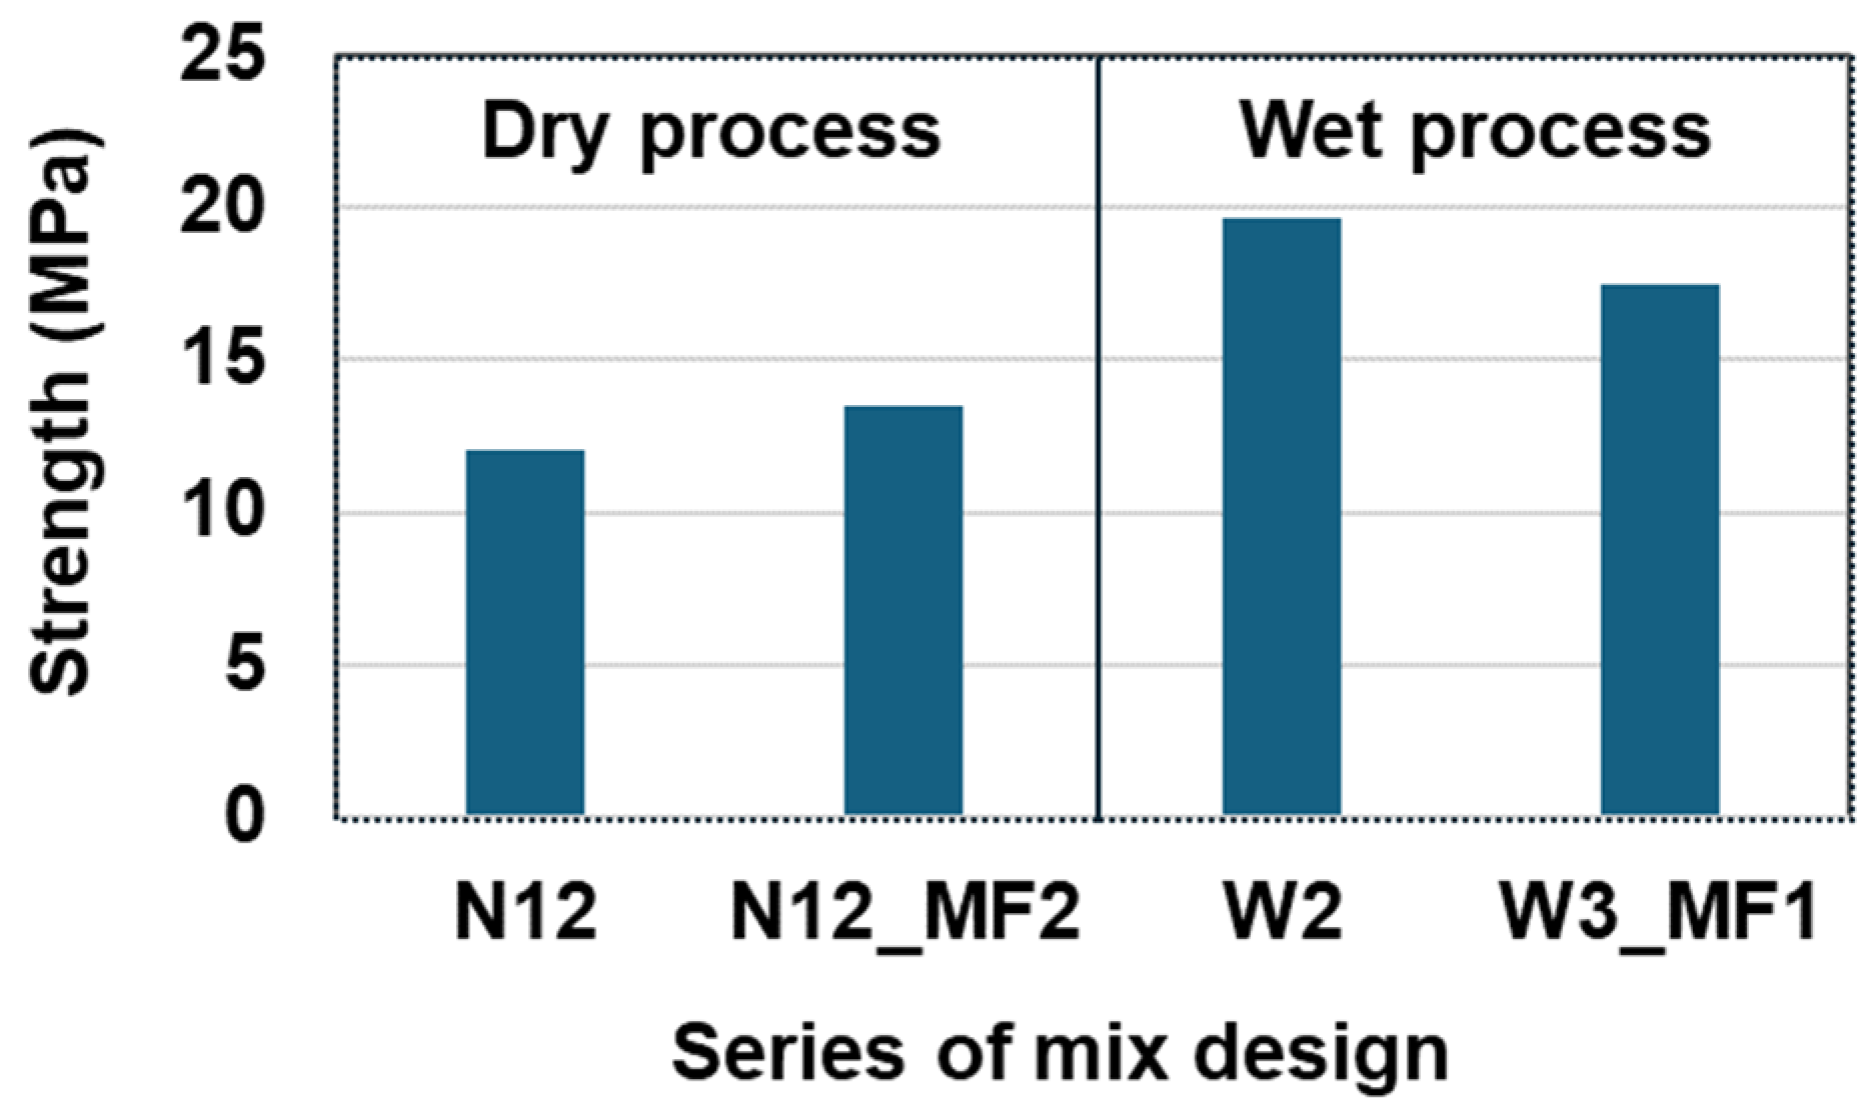
First of all,
Figure 9 illustrates the test results comparing the dry mixing process of N12 and N12_MF2 with the wet mixing process of W2 and W3_MF1. Based on these results, the wet mixing process demonstrates better performance than the dry mixing process when using the same mixture proportions. That is, the compressive strength of N12 is 64% higher than that of W2 because the melted sulfur and rubber particles were mixed together more effectively, resulting in better bonding with fewer voids and gaps between the sulfur matrix and the rubber particles.
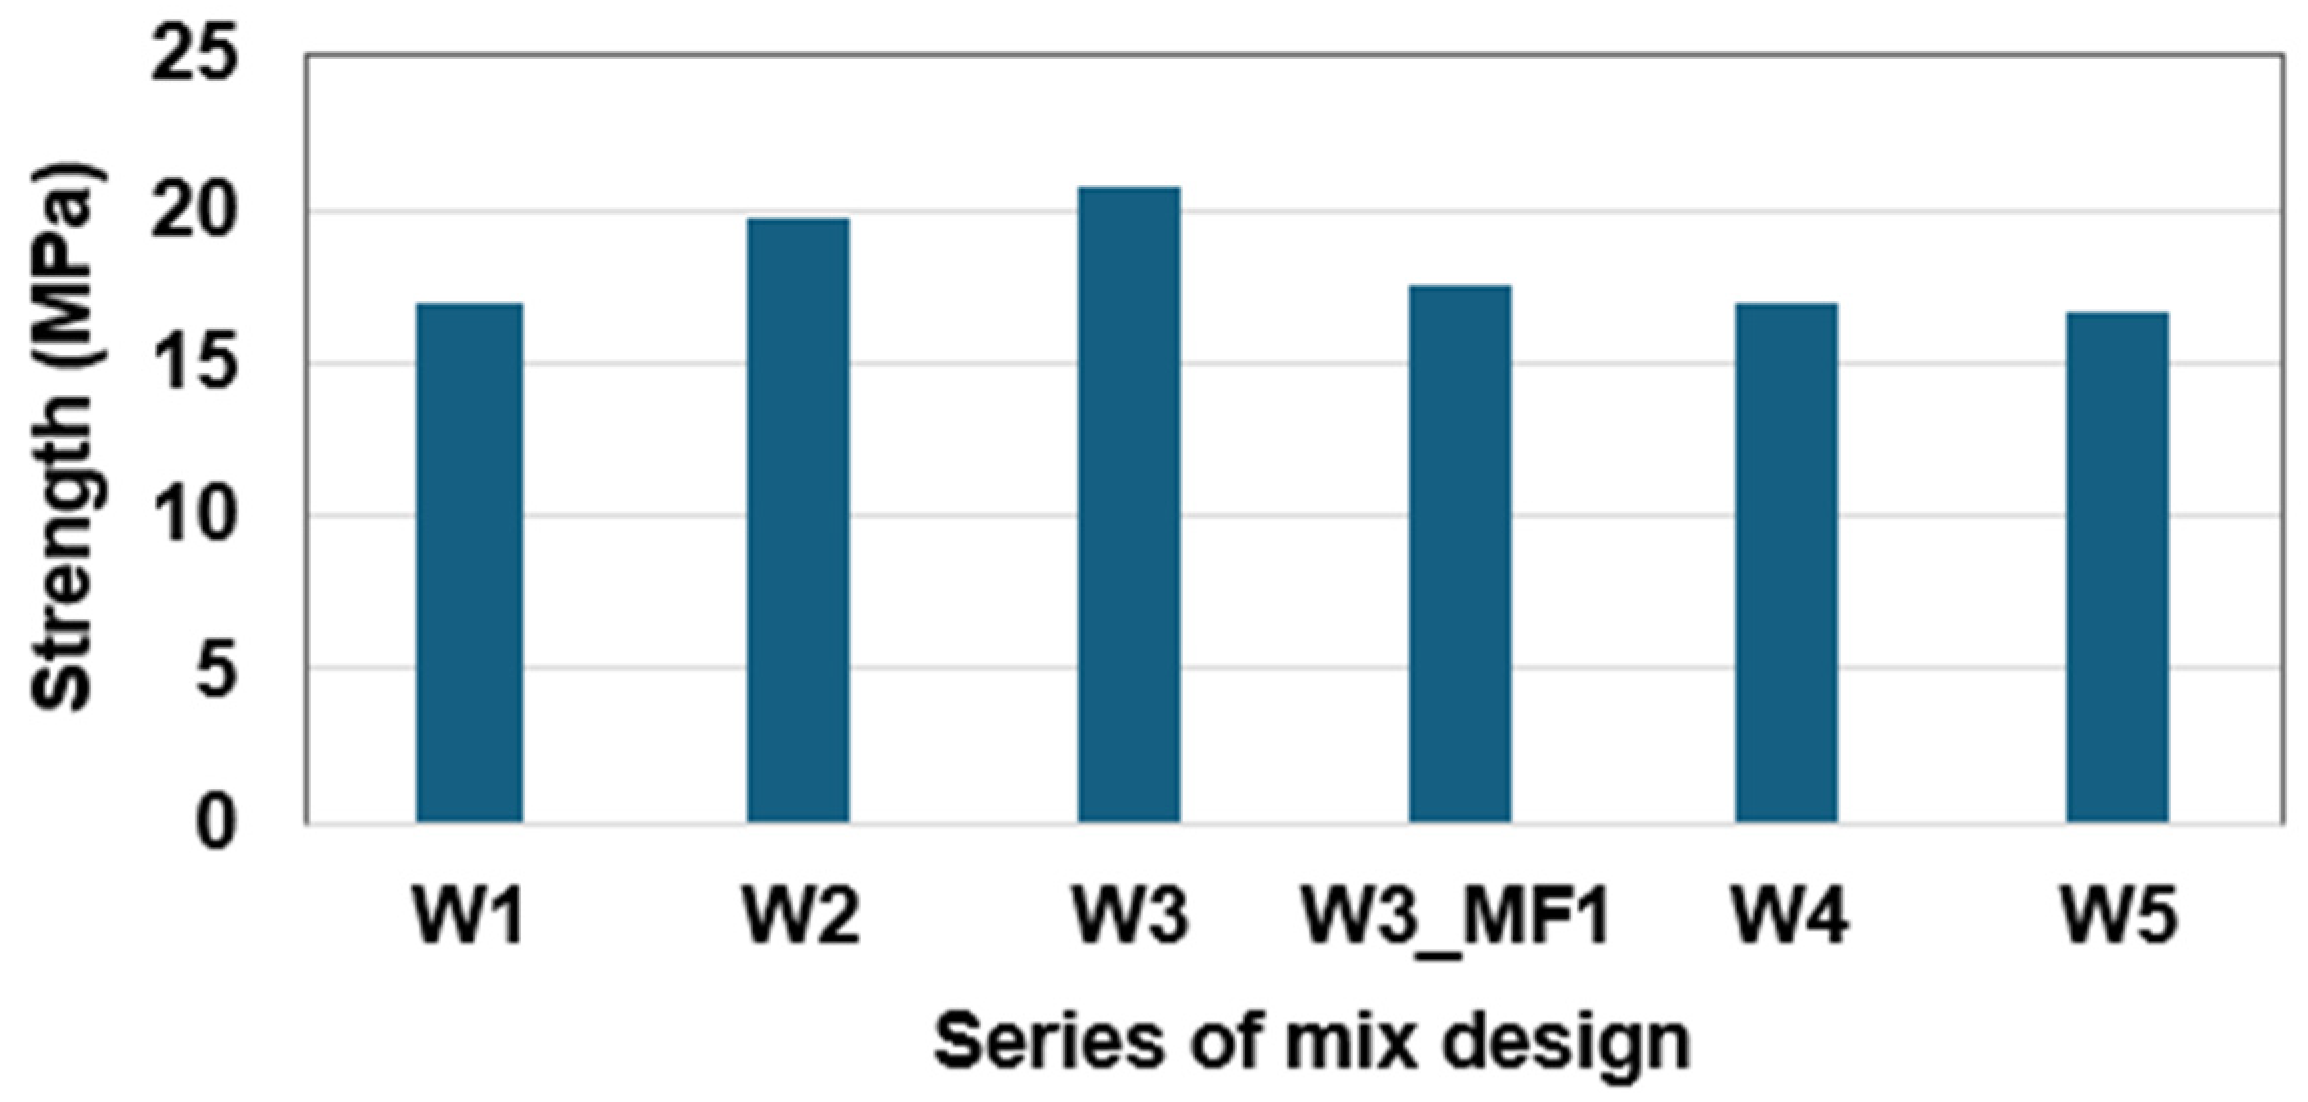
In
Figure 10, it can be seen that as the sulfur content increased from 32% to 37%, the compressive strength initially increased and then decreased. The maximum compressive strength, just above 20 MPa, can be observed in W3 in
Figure 10. This mixture has a sulfur content of approximately 34% by total volume, which can be considered the optimal sulfur content and will be used in the following sections.
3.5. Toughness of RSC According to Two Mixing Process
The toughness of a material can be determined from the area under the stress–strain curve. This allows for an understanding of the material’s brittleness and ductility, as well as its resistance to fatigue fracture.
Figure 14 illustrates the setting up for a compressive strength test, using MTS axial extensometers to obtain the stress–strain curve. Each extensometer is 114 mm long and it is attached to both sides of the specimen.
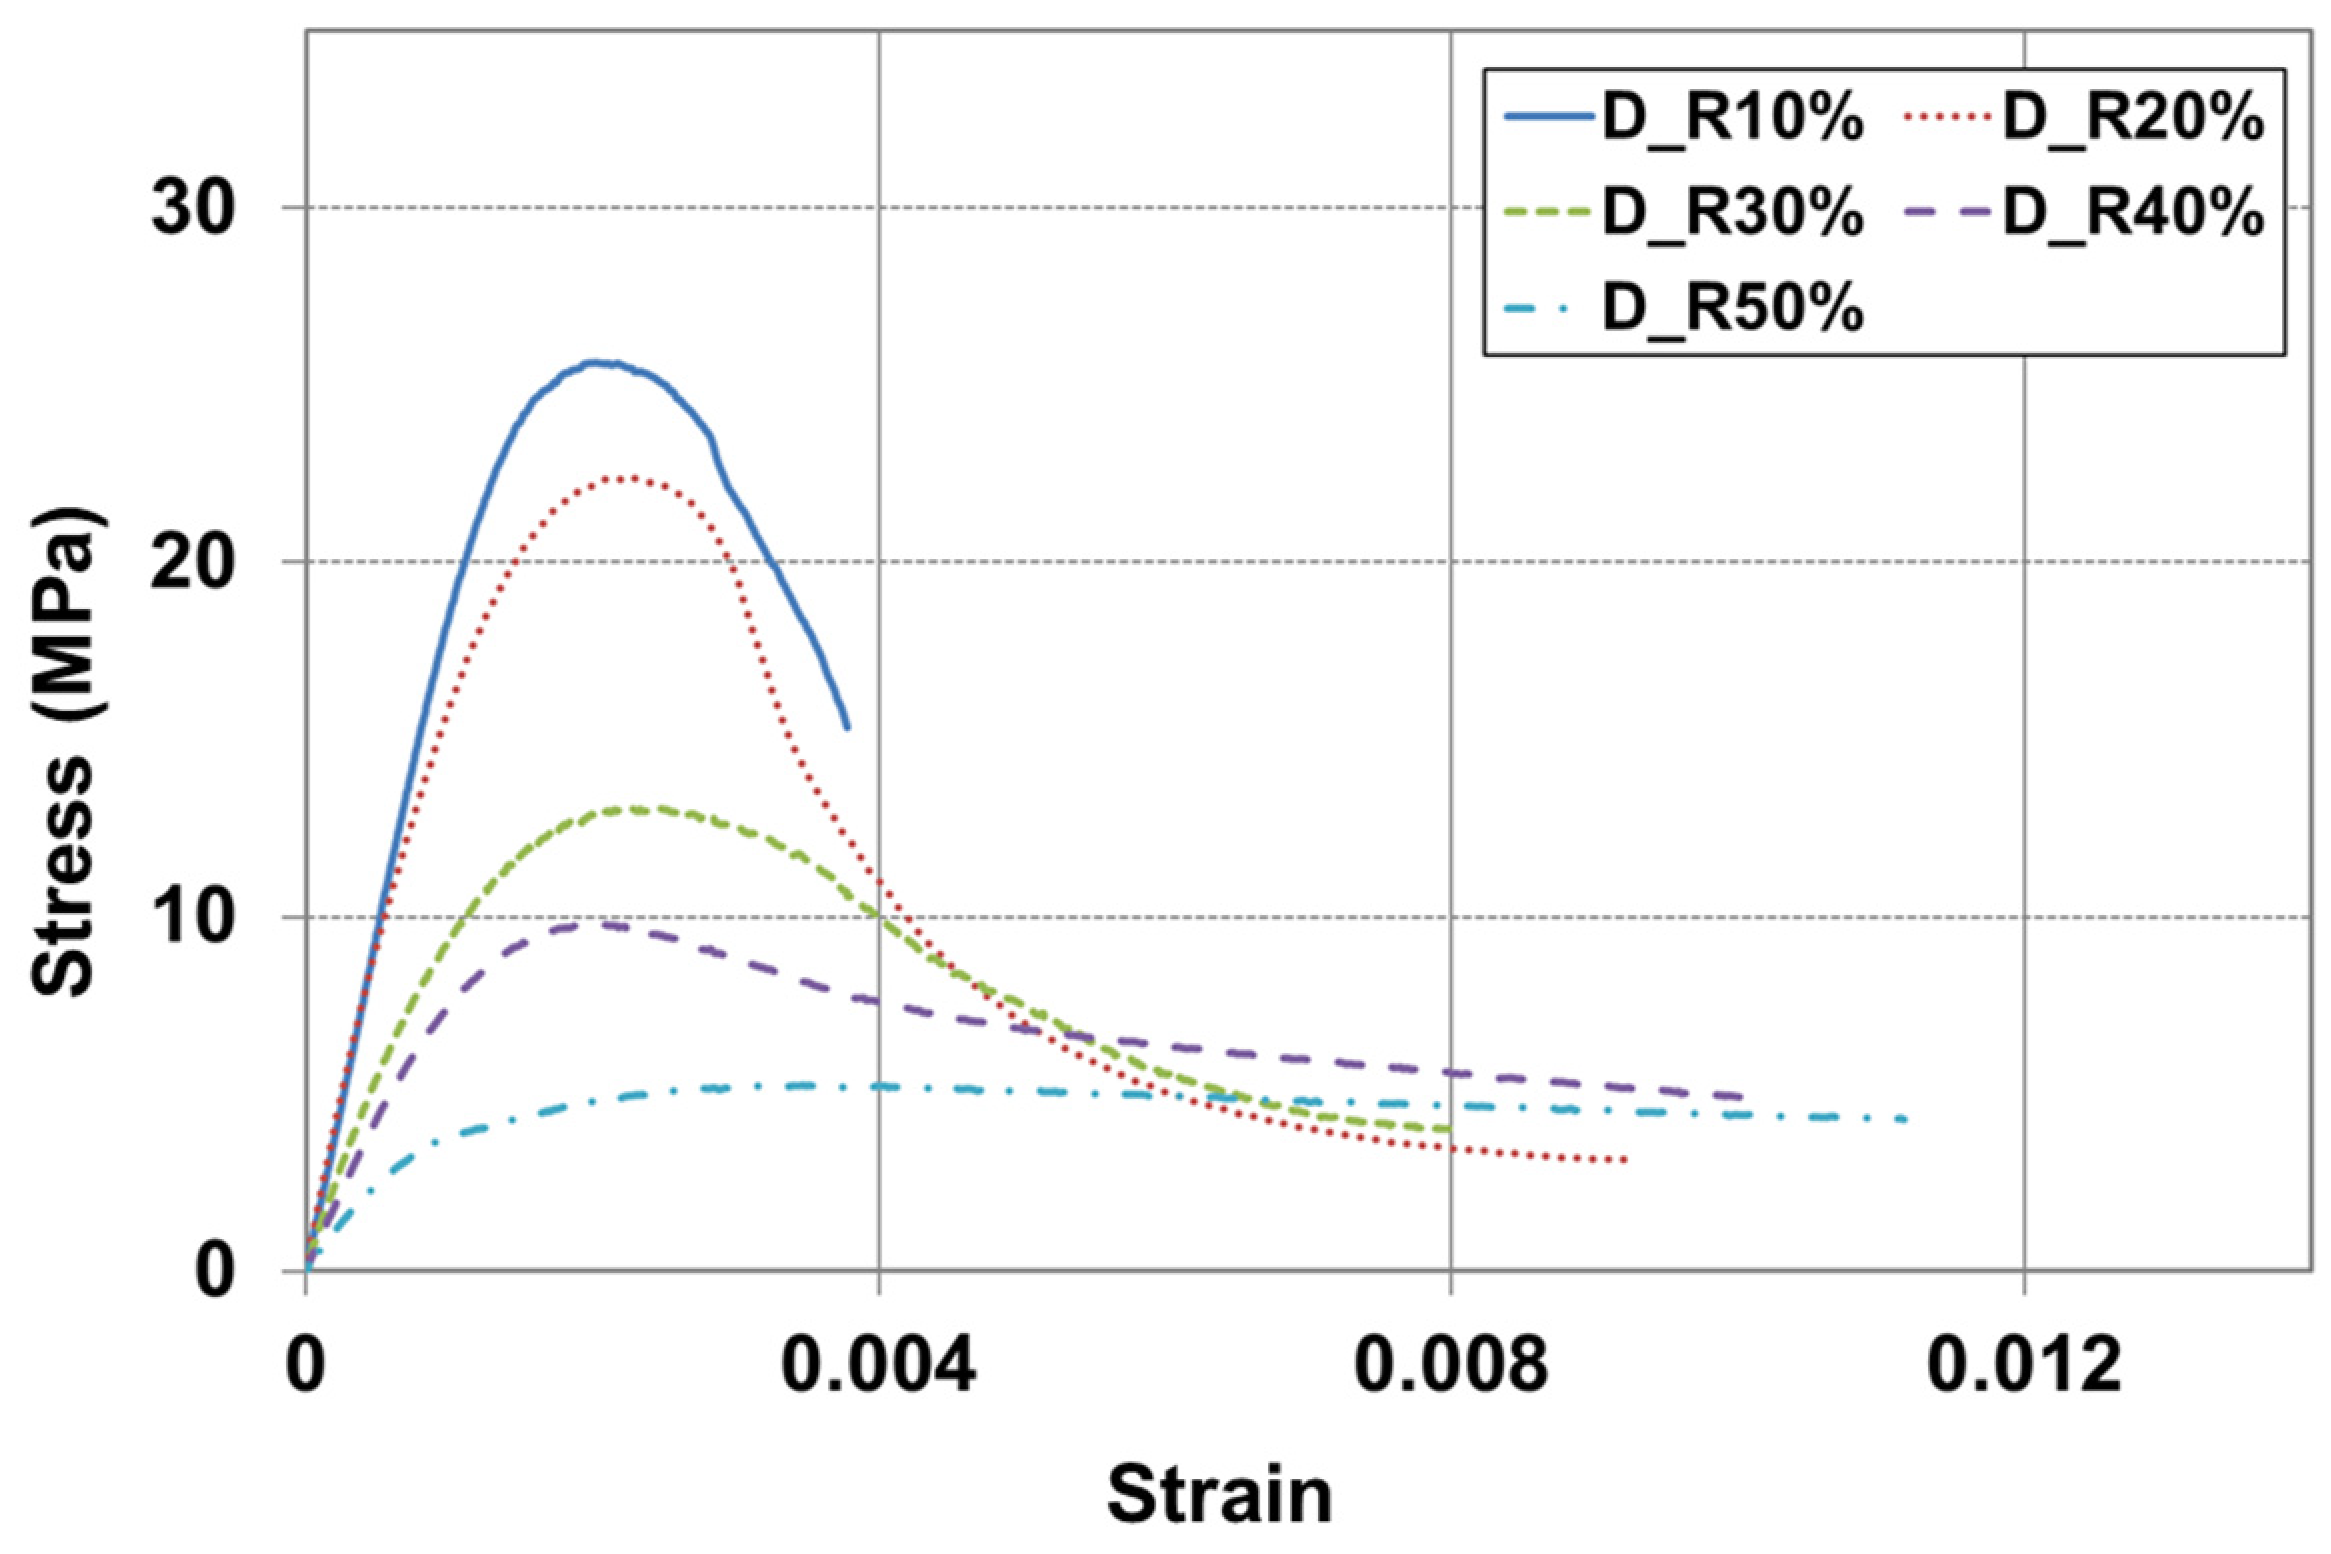
Figure 15 and
Figure 16 show the stress–strain curves for RSC specimens with varying rubber powder content (10% to 50%), tested under the optimal mix condition, using both dry and modified wet mixing processes. Under the same mixture proportion, the RSC specimens produced by the wet mixing process generally exhibited higher stress and longer strain.
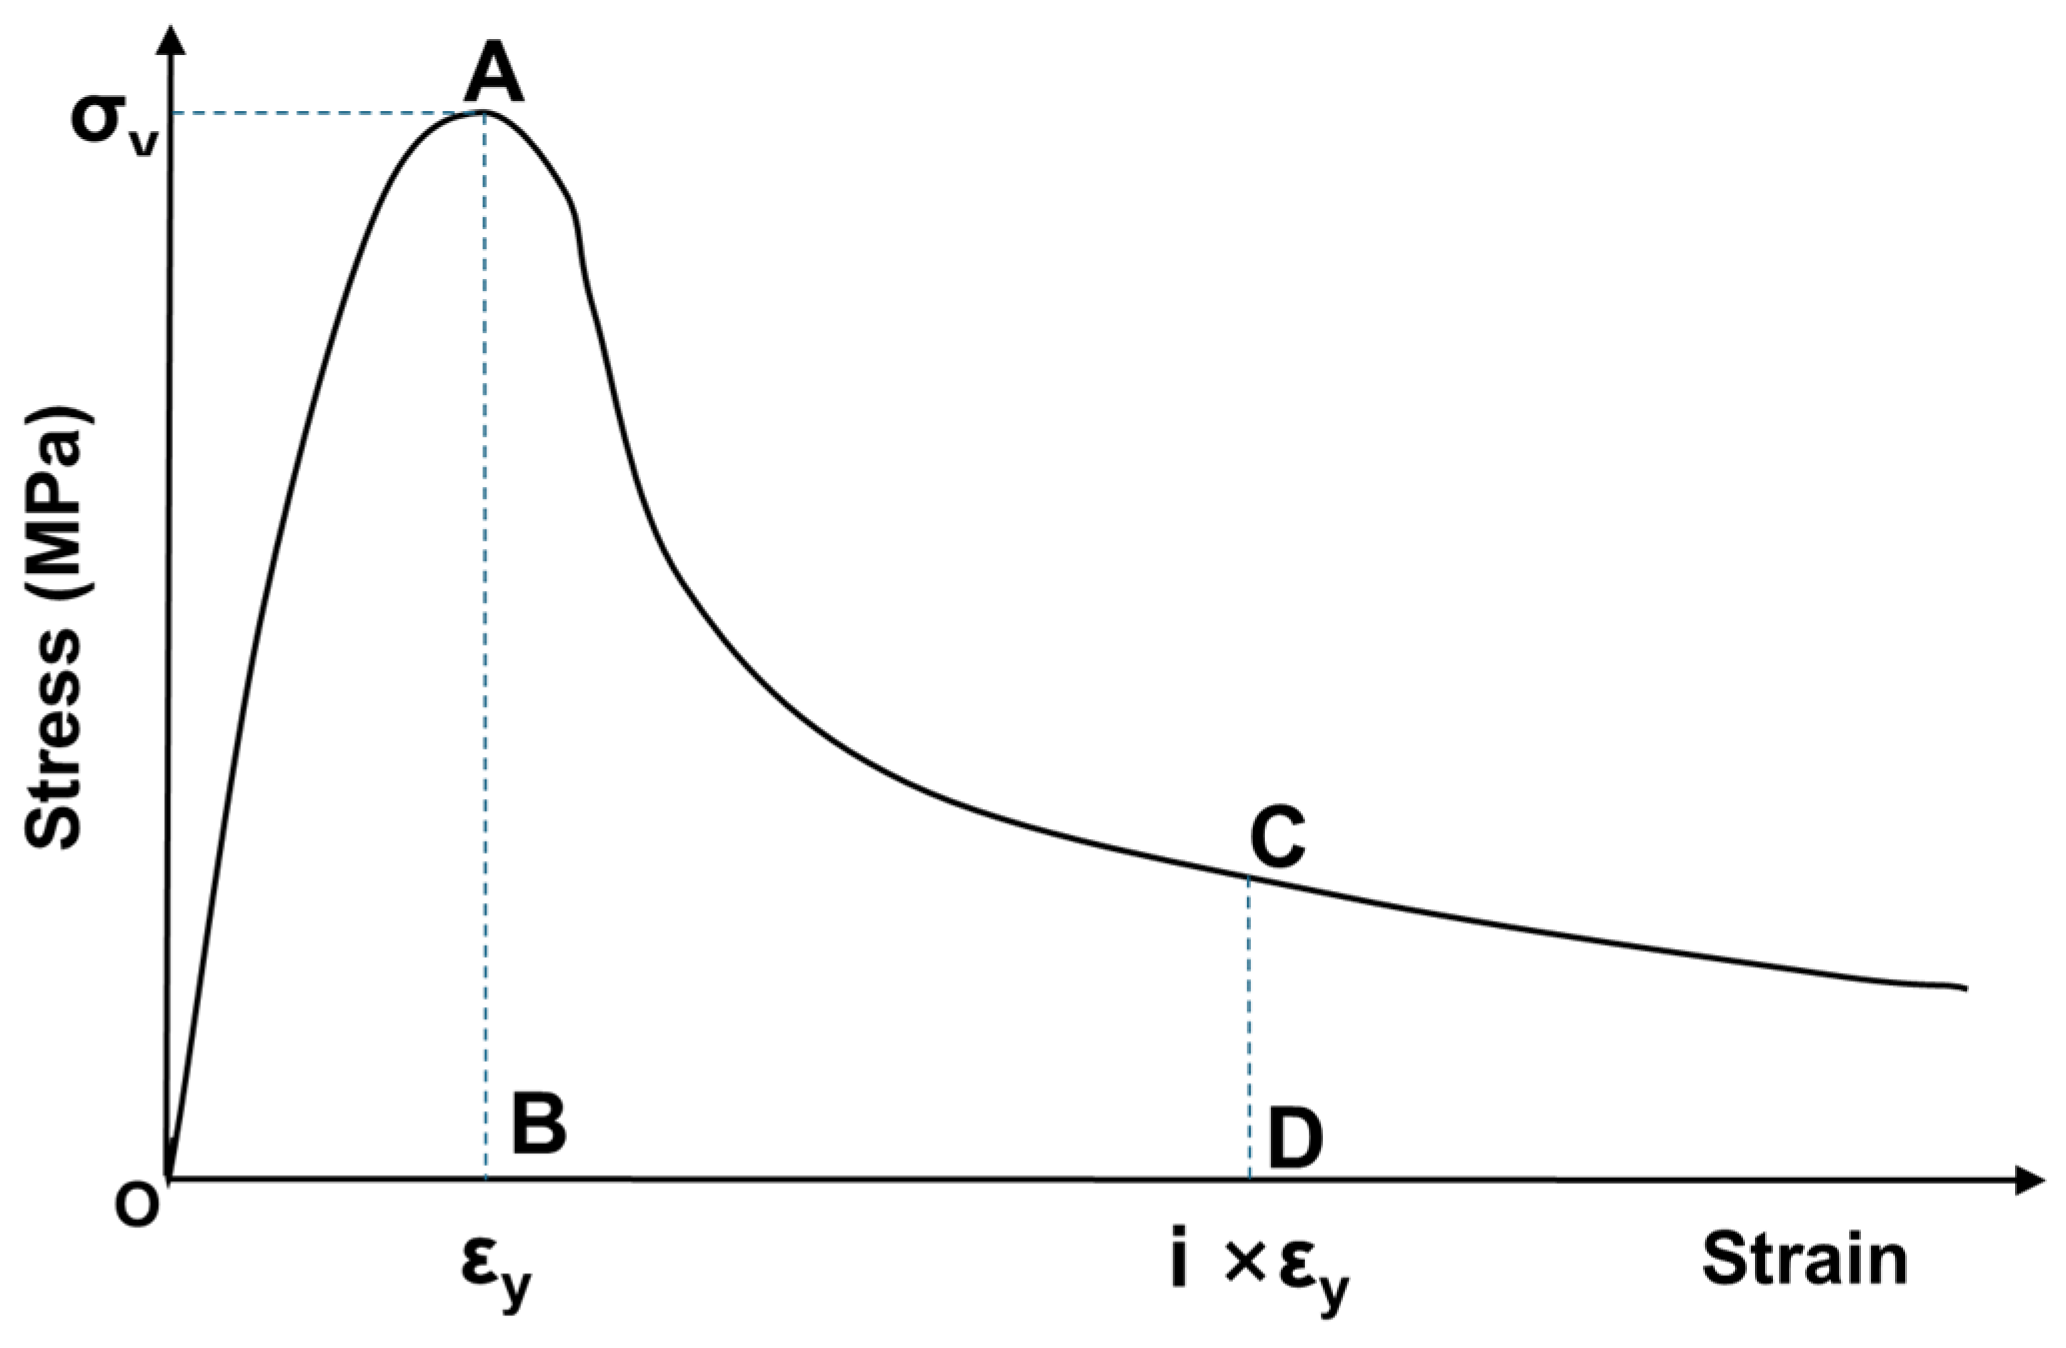
Figure 17 illustrates the method for calculating the toughness index. The toughness index can be expressed as the ratio of the area OAB up to the initial crack to the area OACD up to the comparative deformation [
38].
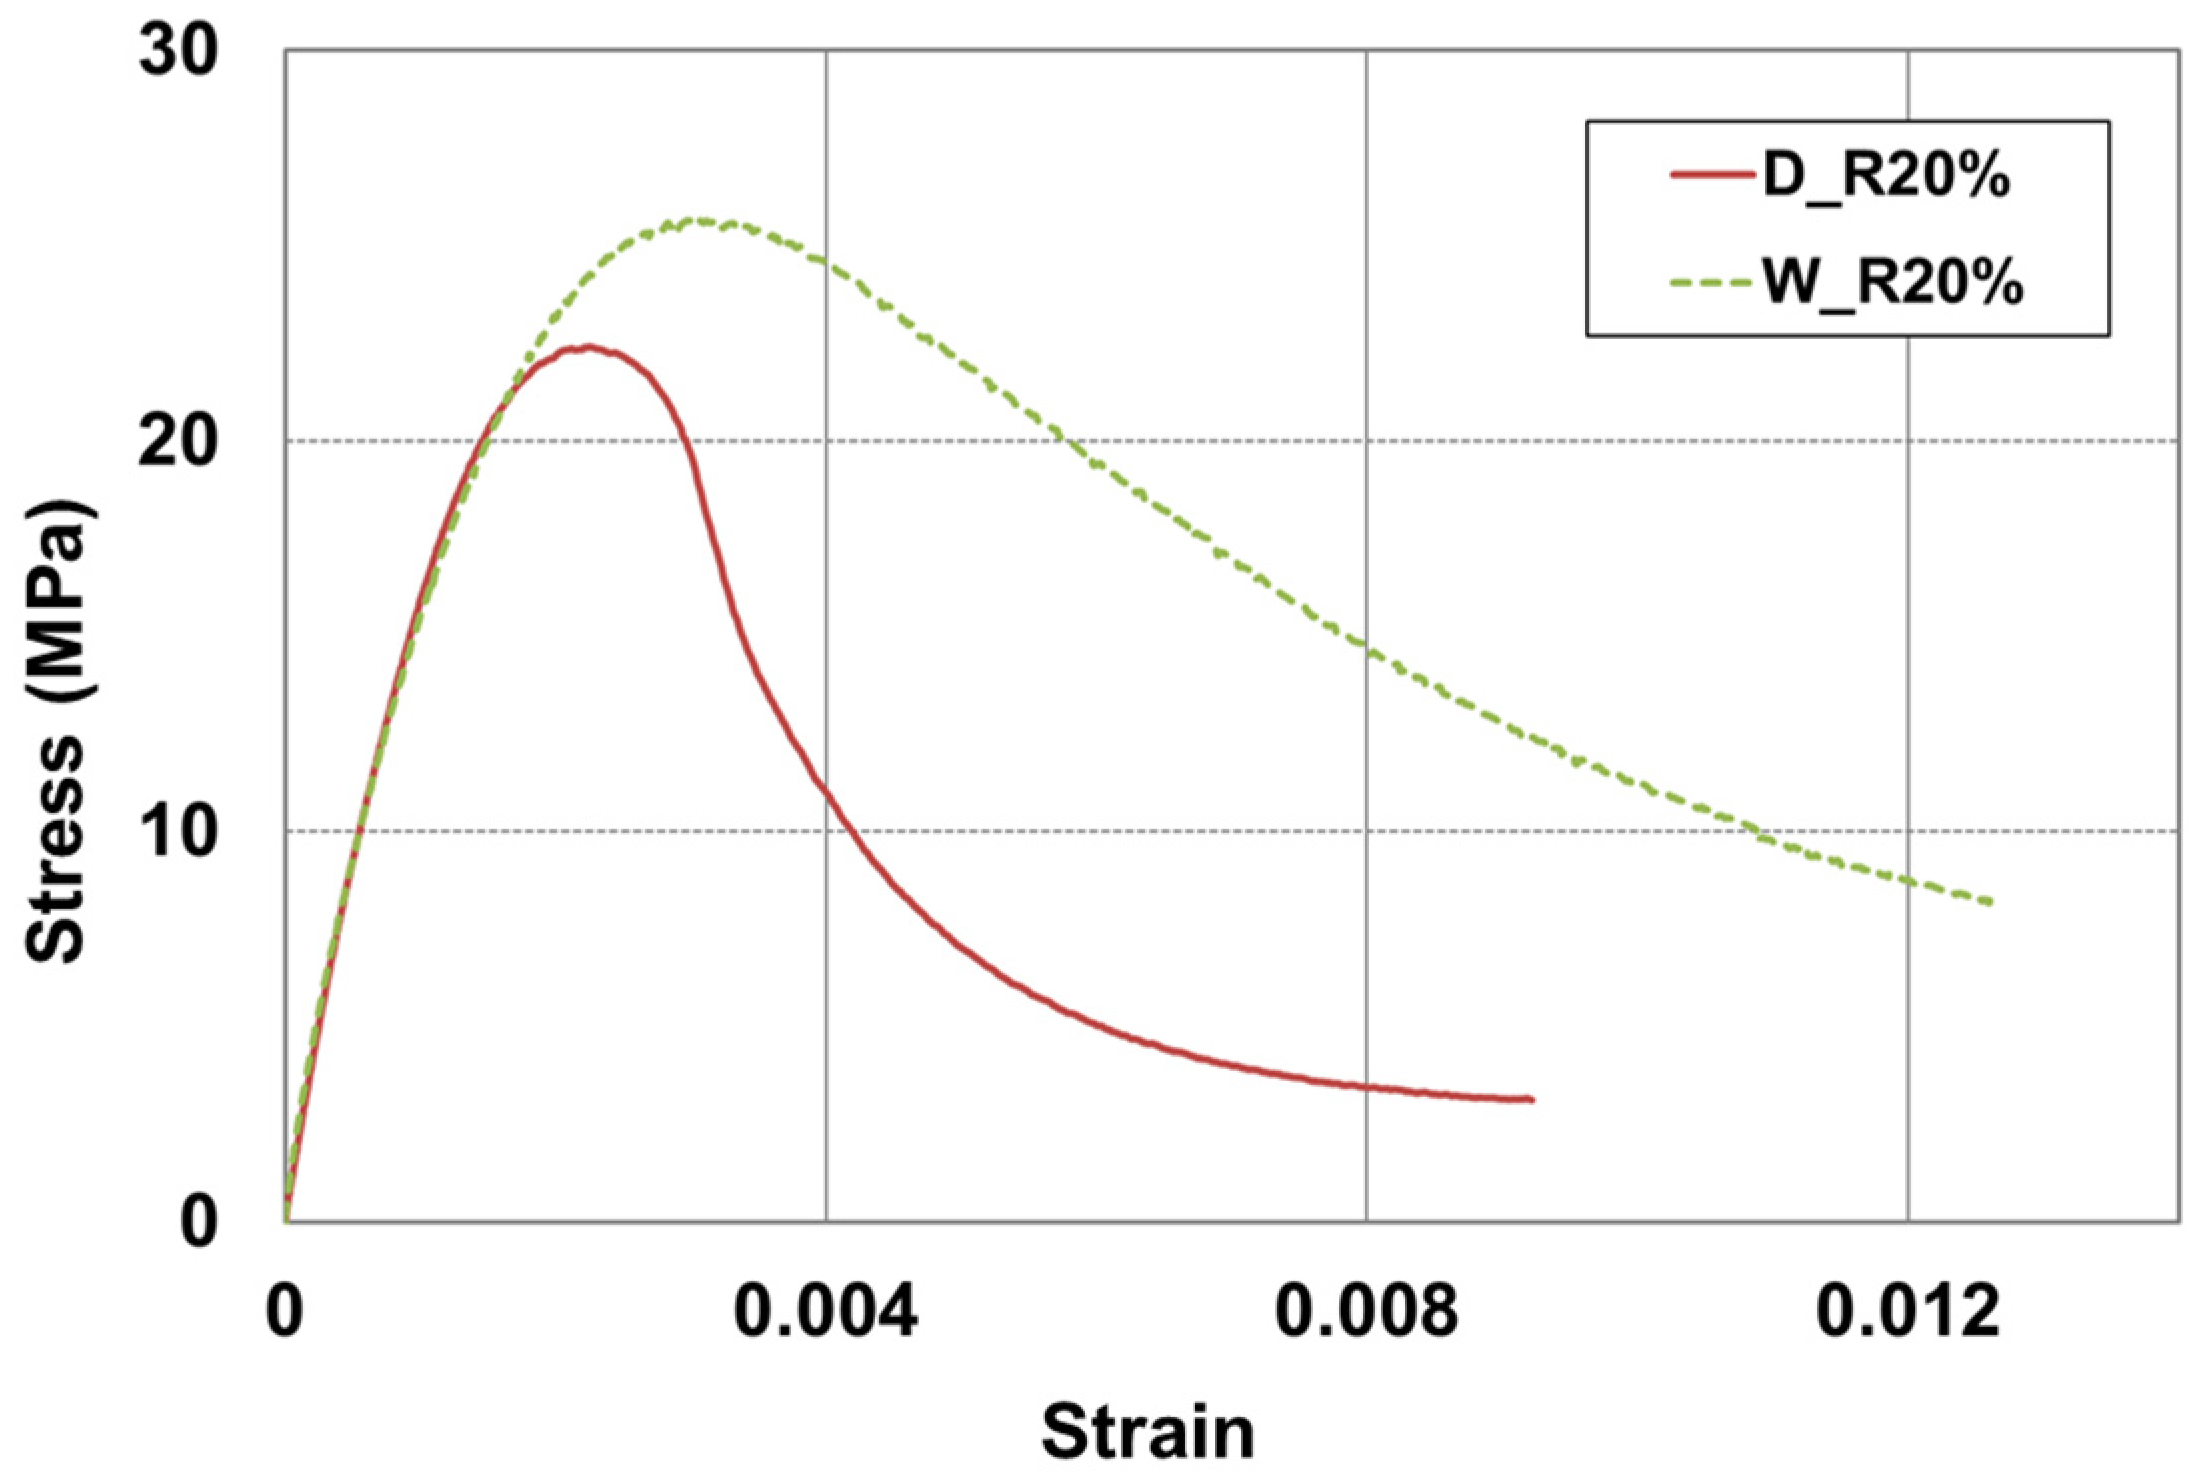
Figure 18 shows only the comparative result where 20% rubber particle was mixed, for the purpose of determining the toughness index of the RSC according to their manufacturing process, as seen in
Figure 15 and
Figure 16. In
Figure 18, the toughness index is represented as the area ratios for strains of 0.8% and 1.2%, which are four times the yield strain. For the calculation of the area underneath the strain-stress curve, Image J (ver. 1.46), a public domain Java-based image processing and analysis program, was used [
39]. As shown in
Table 9, it can be observed that the method using the wet mixing process exhibited a higher energy absorption capability of 40% and better resistance to fatigue impact compared to the dry mixing process.


