Article

A Multi-Scale Model for Predicting Physically Short Crack and Long Crack Behavior in Metals

1
Key Laboratory of Highway Construction Technology and Equipment of the Ministry of Education, Chang’an University, Xi’an 710064, China
2
China Construction First Group Corporation Limited, Xi’an 710075, China
*
Author to whom correspondence should be addressed.
Materials 2024, 17(21), 5163; https://doi.org/10.3390/ma17215163
Submission received: 9 September 2024 / Revised: 17 October 2024 / Accepted: 21 October 2024 / Published: 23 October 2024

Abstract

:
The fatigue behavior of metal specimens is influenced by defects, material properties, and loading. This study aims to establish a multi-scale fatigue crack growth model that describes physically short crack (PSC) and long crack (LC) behavior. The model allows the calculation of crack growth rates for uniaxial loading at different stress ratios based on the material properties and specimen geometry. Furthermore, the model integrates the Gaussian distribution theory to consider material heterogeneity and the experimental measurement errors that cause fatigue scatter. The crack growth rate and fatigue life of metal specimens with different notch geometry were predicted. The curves generated by the multi-scale model were mainly consistent with the test data from the published literature at the PSC and LC stages.

Graphical Abstract

1. Introduction

Fatigue failure is the most common type of fracture in metallic materials and plays a crucial role in engineering applications. [1]. Statistical data indicates that up to 80% of failures during engineering component service life can be attributed to the initiation of fatigue short cracks (SC) [2]. Predicting the fatigue behavior of SC is of paramount importance due to the inevitable presence of SC effects in structures or components during service; maintenance intervals are predicated on the assessment of crack growth rates. Traditional damage tolerance approaches based on long cracks (LC) may lead to inaccuracies in the estimation of fatigue crack growth (FCG) rate or fatigue life. Therefore, from the perspective of structural integrity and safety, incorporating SC behavior into crack growth models is of paramount importance.
Numerous experimental studies indicate that SC fatigue propagation can be composed of two different stages: microstructurally short crack (MSC) and physically short crack (PSC) [3]. These detailed characteristics can be described as follows: (1) In the MSC stage, the crack initiates and propagates through the maximum shear stress plane, and the crack length has the same scale as the grain size [4]. The MSC initiation and propagation behavior are mainly affected by microstructural factors such as grain size [5], crystal orientation [6], and grain boundary (GB) [7]; (2) In the PSC stage, the crack propagates in a plane perpendicular to the direction of applied tensile stress; the crack length is longer than MSC but empirically less than 1mm, or ten times the grain size [8]. Due to the size range of certain initial damage defects (such as voids, inclusions, and scratches) falling within the PSC stage, the initiation point of material fatigue life is often marked in most cases. Some studies suggest that the PSC stage accounts for a considerable part of total fatigue life [9,10]. Thus, the ultimate goal is to establish a unified multi-scale FCG model within the framework of fracture mechanics to elucidate the PSC and LC behaviors during the fatigue damage process.
Tremendous efforts have been dedicated to developing models that elucidate the propagation of both SC and LC. Based on linear elastic fracture mechanics (LEFM), the long crack phase can be effectively described by Paris’ law [11], which was the first to introduce fracture mechanics into the description of fatigue crack growth. However, Paris’ law only provides a correlation between fatigue and experimental data and lacks predictive capability for materials, rendering it unsuitable for direct application to SC. On the other hand, due to the failure of the similitude concept, the notion of the stress intensity factor based on LEFM cannot be directly applied to the SC stage. Thus, numerous research studies have been conducted to investigate the propagation behavior of SC. Some researchers attempted to extend crack growth models to the SC stage by modifying the LC driving force or resistance. Chan and Lankford [12] propose the microstructure dissimilitude model, which deduces the SC driving force by describing the local yield strengths of the crack tip. Based on the Zheng–Hirt model, Chapetti [13,14] proposed a PSC propagation model that incorporates the concept of crack closure. Bang [15] utilized a dual-parameter model with ΔK and Kmax to characterize the propagation behavior of SC and LC. Furthermore, several studies explored alternative driving parameters to replace the stress intensity factor (SIF), including the J-integral [16], strain energy density [17], and crack tip displacement [18].
In recent years, significant efforts have been made to investigate the multi-scale fatigue crack propagation behavior in metallic materials [19,20,21]. Notably, the propagation behavior of MSC is primarily influenced by microstructural features, while the propagation behavior of PSC/LC can be described using the LEFM theory [22,23]. Despite these advancements, current research still faces the following limitations: (i) Determining the transition criterion between SC and LC has seen limited theoretical investigation. This transition criterion, however, critically influences the accuracy of multi-scale model assessments of fatigue behavior; (ii) The material’s fatigue resistance performance is related to its fracture toughness; applied load, crack closure, and specimen geometry primarily influence the crack driving force. However, some experimental results [10,20] indicate that the FCG rate during the SC stage is also influenced by transition behavior and mechanical properties (e.g., yield strength). The comprehensive effects of these factors on FCG have not yet been thoroughly explained; (iii) For power-law forms of PSC/LC propagation models, there exist fitting parameters C, and m, based on experimental conditions, which lack a solid physical foundation. It is well known that fitting parameters can limit the application of the model. Therefore, a multi-scale analytical model is necessary.
In this study, the transition criterion between the PSC and LC stages was established by examining the FCG behavior of metal specimens. Building upon this, a unified multi-scale model for prediction of FCG rate during the total fatigue stages was formulated. This led to the proposal of a multi-scale FCG model influenced by strength, material characteristics, loading, and notch stress concentration factors. Additionally, based on the established multi-scale model, the physical meaning of parameters C and m has been discussed. Furthermore, considering the material heterogeneity and experimental measurement errors that contribute to FCG scatter, Gaussian distribution theory is incorporated with the multi-scale model. Additionally, based on experimental data for PSC and LC, predictions on crack growth rate and fatigue life under different stress ratios were provided.

2. Model Derivation

As shown in Figure 1, Phase II can be depicted by Paris’ law. Considering the value of SIF threshold variation from the PSC stage to the LC stage under the influence of crack closure, the modified Paris–Erdogan equation is used to predict the FCG rate of Phase I and Phase II [23].
da dN = C · Δ K · q Δ K th , SC m
where C and m are experimental fitting parameters, ∆Kth,sc is the SIF threshold of SC and LC stage [13], and q is the microstructural factor used to modify the driving force [12].
As illustrated in Figure 1, (∆KT, Vt) serves as a transition point from Phase I to Phase II. ∆KT can be calculated by considering the transition length l between the SC and LC stages.
Δ K T = F ( a ) · Δ σ · π l
where F(a) is the notch geometry corrector [24], determined by notch geometry, l is calculated by following equations [25]:
l = 4 π · 1 + ν 2 · D 3 · h b · σ eR σ a 2
where b is the Burgers vector, ν is Poisson’s ratio, the value of b/h ranges from 1.1547 for the fcc (facet-centered cubic) metals to 1.414 for bcc metals [26], D is equivalent grain size (the average grain size is usually used), σeR is fatigue limit at stress ratio R, and σa is applied stress amplitude (σa = ∆σ/2).
By substituting (∆KT, Vt) into Equation (1), the transition FCG rate Vt would be a certain value,
V t = C · Δ K T Δ K th , SC T m
Thus, parameter C can be calculated by:
C = V t / Δ K T Δ K th , SC T m
The aim in this paper is to find the physical meaning of parameters C and m and also explore the correlation between mechanical properties and the FCG rate. Based on Equation (4), we can obtain the following equation:
da dN = V t · Δ K · q Δ K th , SC Δ K T Δ K th , SC T m
It should be mentioned that Vt is a characteristic parameter in fatigue experiments. The fatigue life at the SC stage accounts for an important part of total fatigue stages; thus, the study on the transition zone between SC and LC is an important part of the complete problem in FCG. Based on the near-threshold model [27] and transition FCG model [28,29], the transition FCG rate Vt can be expressed as:
V t = γ   σ , Y , M
where σ is applied stress, such as ∆σ and σmax, M represents the material mechanical properties parameters, such as yield strength, tensile strength, fatigue strength, etc., and Y is a specimen parameter related to specimen geometry, such as notch type, notch depth, notch root radius, etc. Furthermore, in reference [28], the authors developed a model for the transitional crack growth rate between the second stage (stable propagation) and the third stage (rapid propagation) of long cracks. In the proposed model, the transitional crack growth rate is predominantly influenced by tensile strength and Young’s modulus; the transitional crack growth rate is accentuated with respect to the increasing in tensile strength; and the transitional crack growth rate is reduced with respect to the increasing in Young’s modulus. Thus, we hypothesize that the transition FCG rate Vt would be regarded as a characteristic parameter associated with material properties.
It is well known that the applied load and the notch geometry of the specimen significantly affect the FCG rate. Specifically, higher applied loads and sharper notches lead to increased crack growth rates. Additionally, Poisson’s ratio is positively correlated with the transverse strain perpendicular to the load. Therefore, in this study, the product of the maximum stress, notch stress concentration factor, and Poisson’s ratio is considered a positive correlating factor with the transition FCG rate. According to research in the literature [30], the yield strength and fatigue strength of materials respond to the localization of fatigue damage, and these two performance indicators also represent the material’s resistance to FCG. This implies that an increase in yield strength and tensile strength would reduce the transitional FCG rate. Consequently, based on the above discussion, and inspired by reference [28], it is reasonable to hypothesize that the transition crack growth rate can be expressed as follows:
V t = 12 · V 0 · exp ν · K t 2 · σ max 2 σ y · σ eR
where V0 is the initial SC growth rate during ideal conditions (∆K = E√b [29], da/dn = b, and b is the Burgers vector), and Kt is the stress concentration factor of the specimen.
As schematically shown in Figure 2, FCG data of four kinds of materials (Al alloy 2024, Al alloy 7075, 4340 steel, and 30CrMnSiNi2A steel) at R from −2 to 0.5 were selected to compare the predicted curves [31,32,33,34,35,36]; the FCG data are distinguished by symbol and color, respectively. It is obvious that the test data are close to the predicted curve, and the coefficient of determination R2 = 0.97, which demonstrates the prediction of Equation (7) is in better agreement with the experimental data.
Therefore, combining Equations (2) and (7), the transition point (∆KT, Vt) between SC and LC under da/dN-∆K relation can be expressed by
F ( a ) · Δ σ eR · 16 π 2 · 1 + ν 2 h · d 3 M 2 · b , 12 · V 0 · exp ν · K t 2 · σ max 2 σ y · σ eR  
As discussed above, (∆KT, Vt) would be a characteristic value related to loading, material properties, and specimen geometry. Thus, substituting Equation (7) into Equation (5), the multi-scale FCG rate model can be driven as below:
da dN = V t · Δ K · q Δ K th , SC Δ K T Δ K th , SC T m = 12 · b · exp ν · K t 2 · σ max 2 σ y · σ eR · Δ K · q Δ K th , SC Δ K T Δ K th , SC T m
In most fatigue experimental studies, the fitted value of m varies from 1.4 to 4 [37]. To elucidate the relationship between m and material properties as well as experimental conditions, reference [38] is considered, which determines that the initiation FCG rate (∆K = Eb) is equal to the Burgers vector b; substituting (Eb, b) into Equation (9), the parameter m is expressed by:
m = ln b V t / ln E b · q Δ K th , SC Δ K T Δ K th , SC T

3. Model Validation and Discussion

FCG data on notched specimens from four kinds of materials with R from −2 to 0.5 in the literature are digitized and used to validate Equation (9). The corresponding parameters of material properties are listed in Table 1, and the experiment details of loading and specimen geometry are listed in Table 2.
Figure 3, Figure 4, Figure 5 and Figure 6 show the predicted da/dN-∆K curves using Equation (9) with different R together with experimental results. The predicted curves and FCG data are distinguished by symbol and color. It is obvious that the proposed model successfully predicts the FCG behavior from PSC to LC under different stress ratios. To validate the accuracy of the proposed model, we compared it with a power-law fitting curve (black line). As shown in Figure 3, Figure 4, Figure 5 and Figure 6, the correlation coefficient values for the predicted and fitted curves of four materials under different stress ratios were calculated. It is noteworthy that the fitted curves were derived using the power-law form of the Paris model, and the results indicate that the predicted curves (in orange) exhibit accuracy close to that of the fitted curves. The proposed model (orange line) demonstrated precision comparable to the power-law curve. The results indicate that Equation (12) can serve as a viable alternative to traditional fitting methods for accurately predicting the FCG behavior of metallic materials under different R values. Additionally, the predicted transition point (∆KT, Vt) between PSC and LC is highlighted in Figure 3, Figure 4, Figure 5 and Figure 6. It can be seen that the fluctuation of the FCG data decreases after the transition point, which indicates that the scatter of test data differs significantly between the PSC and LC stages.
According to Equations (4b) and (10), C is analytically linked to transition conditions (Vt, ∆KT, and ∆KTth,sc), and m is independent of stress ratio R and related to the Burgers vector, elasticity modulus, and threshold SIF range. In the calculations of this paper, most values of m fall between 1.8 and 3.5. For the same material, when the value of m is fixed, the variation in the value of C is primarily influenced by the transition crack growth rate.
Figure 3, Figure 4, Figure 5 and Figure 6 also show the fluctuation of crack propagation, which weakens with the crack length increase. Considering the influence of material heterogeneity and machining errors on experimental measurements of specimens, fatigue scatter is inevitable. Accordingly, to reconcile the discrepancy between the measured and theoretical FCG rate, a nondimensional parameter β is introduced by logarithmically transforming the Equation (9):
ln da dN = β · ln V t · Δ K · q Δ K th , SC Δ K T Δ K th , SC T m
As shown in Figure 7, Figure 8, Figure 9, Figure 10 and Figure 11, four groups of da/dN-∆K data are analyzed to show β fluctuation. Figure 7 shows the histogram and normal distribution analysis of four materials. Observations reveal that normal distribution curves align well with corresponding histograms, suggesting that the Gaussian distribution theory aptly describes the variability in experimental data. Subsequently, a probabilistic multi-scale model, achieving 96% reliability, is presented as follows:
da dN = exp ( μ β ± 2 × γ β ) · ln V t · Δ K · q Δ K th , SC Δ K T Δ K th , SC T m
where μβ is the mean value of β, and γβ is the standard deviation of β.
Figure 8 shows predicted da/dN-∆K curves of AISI 4340 steel at stress ratios from −1 to 0.5 by Equation (12) using the transition crack growth rate Vt. Similarly, predicted da/dN-∆K curves are shown in Figure 9 for Al alloy 2024 at R from −1 to 0.5, Figure 10 for Al alloy 7075 at R from −1 to 0.5, and Figure 11 for 30CrMnSiNi2A steel at R = 0. As shown in Figure 8, Figure 9, Figure 10 and Figure 11, the scattered FCG data are mostly covered in the envelope area between the upper and lower boundaries. This implies that the nondimensional parameter β can effectively reflect the scatter of crack growth.
In Section 2, ∆KT is calculated by transition crack length l. Considering the maximum stress, fatigue limit, yield strength, and notch geometry influences, the explicit equation related to transition FCG rate Vt is proposed, as shown in Equation (7). Based on this, parameter C is linked to the transition FCG rate Vt, and m is determined by (∆KT, Vt,) and (∆KT, Vt,). In this study, we utilized the semi-empirical FCG model [23] as a framework, validating the universality of the theoretical parameters C and m using 17 groups of FCG data across four metals with R from −2 to 0.5. The error bands predicted by Equation (12) can cover the majority of the experimental data. Consequently, this model serves as a unified framework for predicting the FCG behavior of different metallic materials.
According to the above discussion, the proposed model eliminates the need for curve fitting, allowing for direct estimation of FCG behavior by using relatively accessible material property parameters, obviating the need for fatigue experiments. This advancement offers insights into the fatigue design of critical aerospace structures such as aircraft wings and fuselage structures. Furthermore, its predictions regarding the transition FCG rate provide valuable references for design and maintenance.

4. Conclusions

This study presents a multi-scale model for predicting fatigue cracks for four kinds of materials, incorporating both PSC and LC. The main conclusions are as follows:
(1)
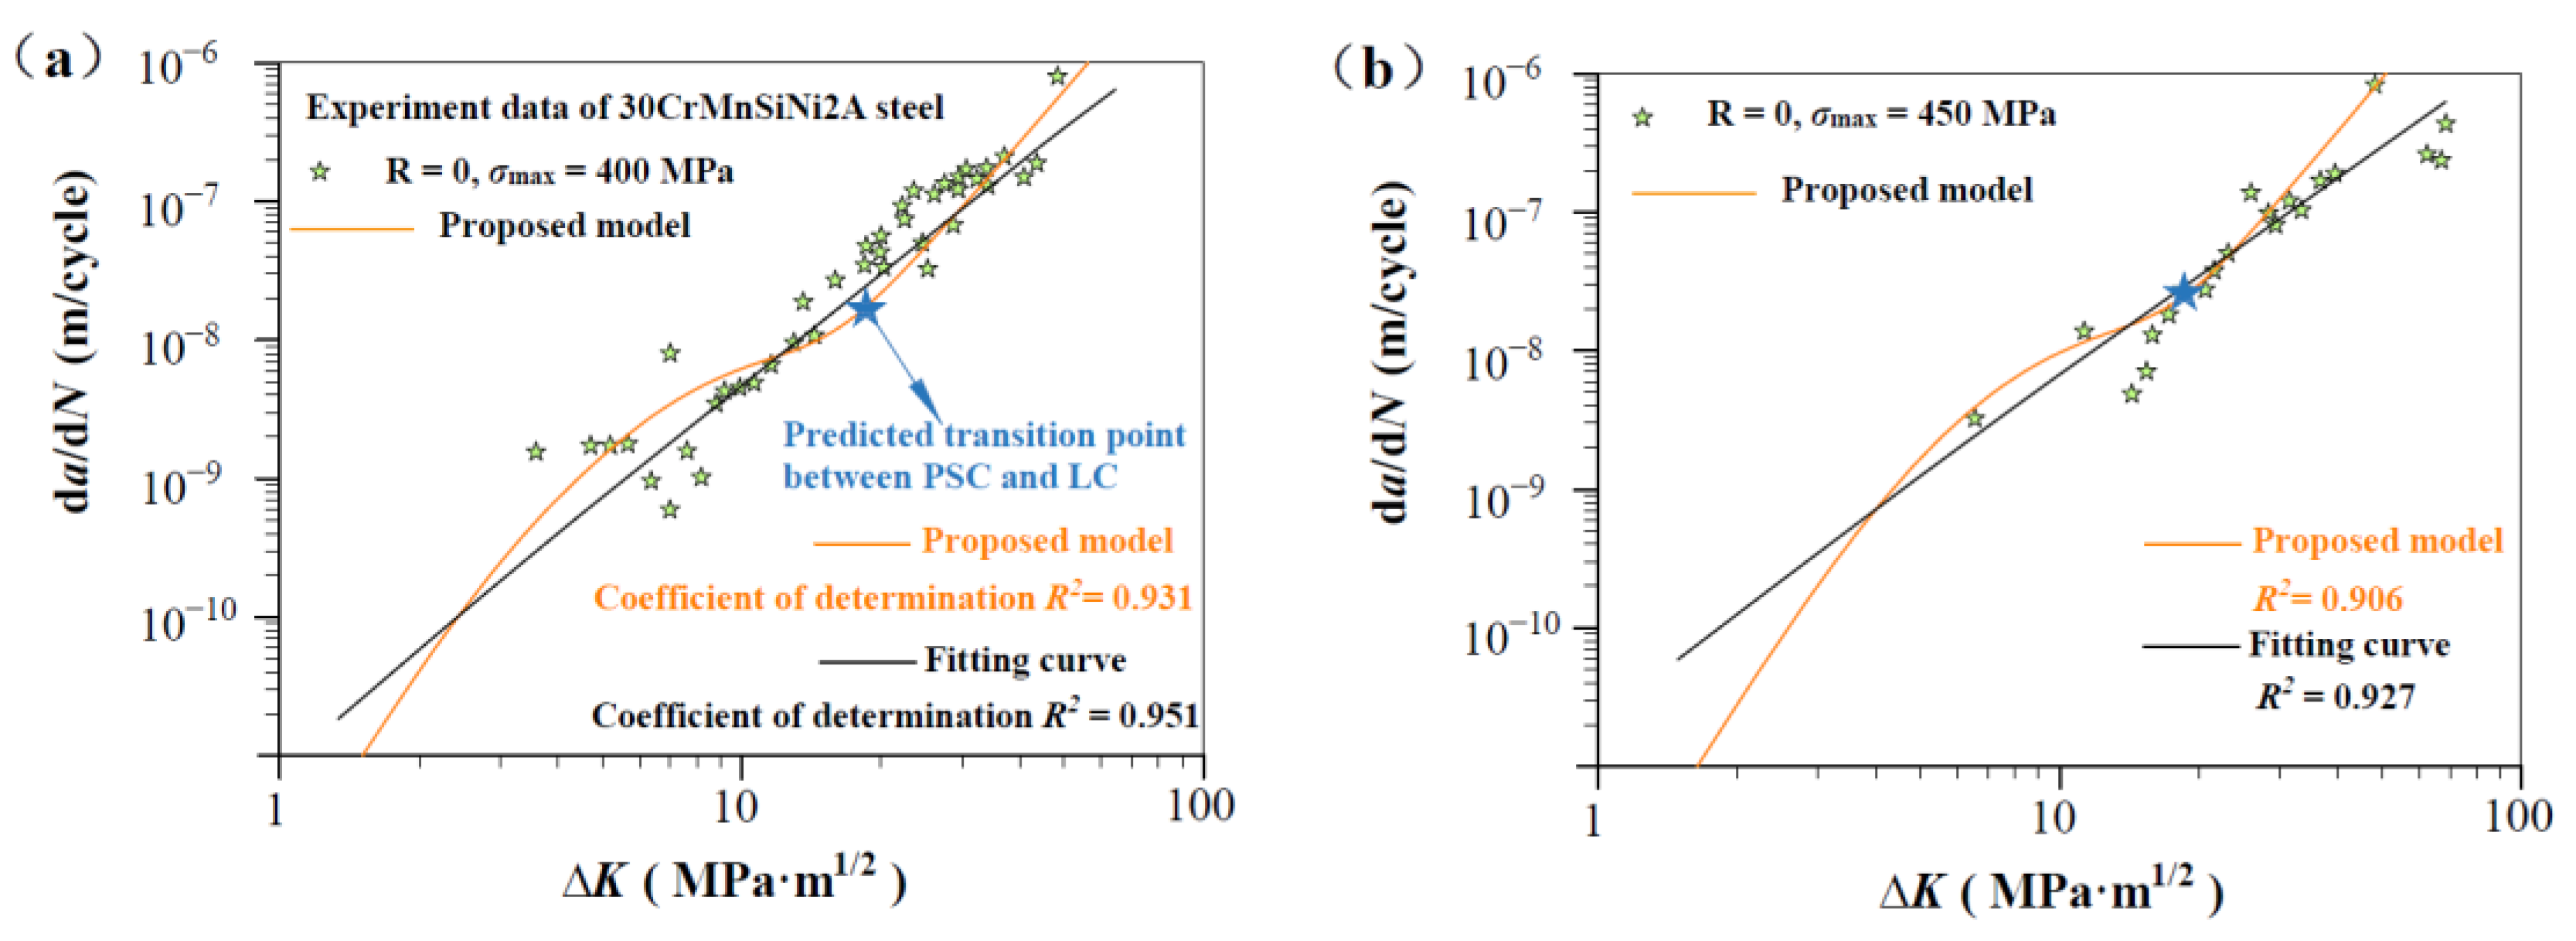
The proposed multi-scale model avoids the curve fittings of different stress ratios in the PSC and LC stages, exhibiting predictive capabilities comparable to the fitting curves.
(2)
In the multi-scale model, parameter C is predominantly influenced by the transition crack growth rate Vt, and m is independent of stress ratio R, and related to the Burgers vector, elasticity modulus, and threshold SIF range.
(3)
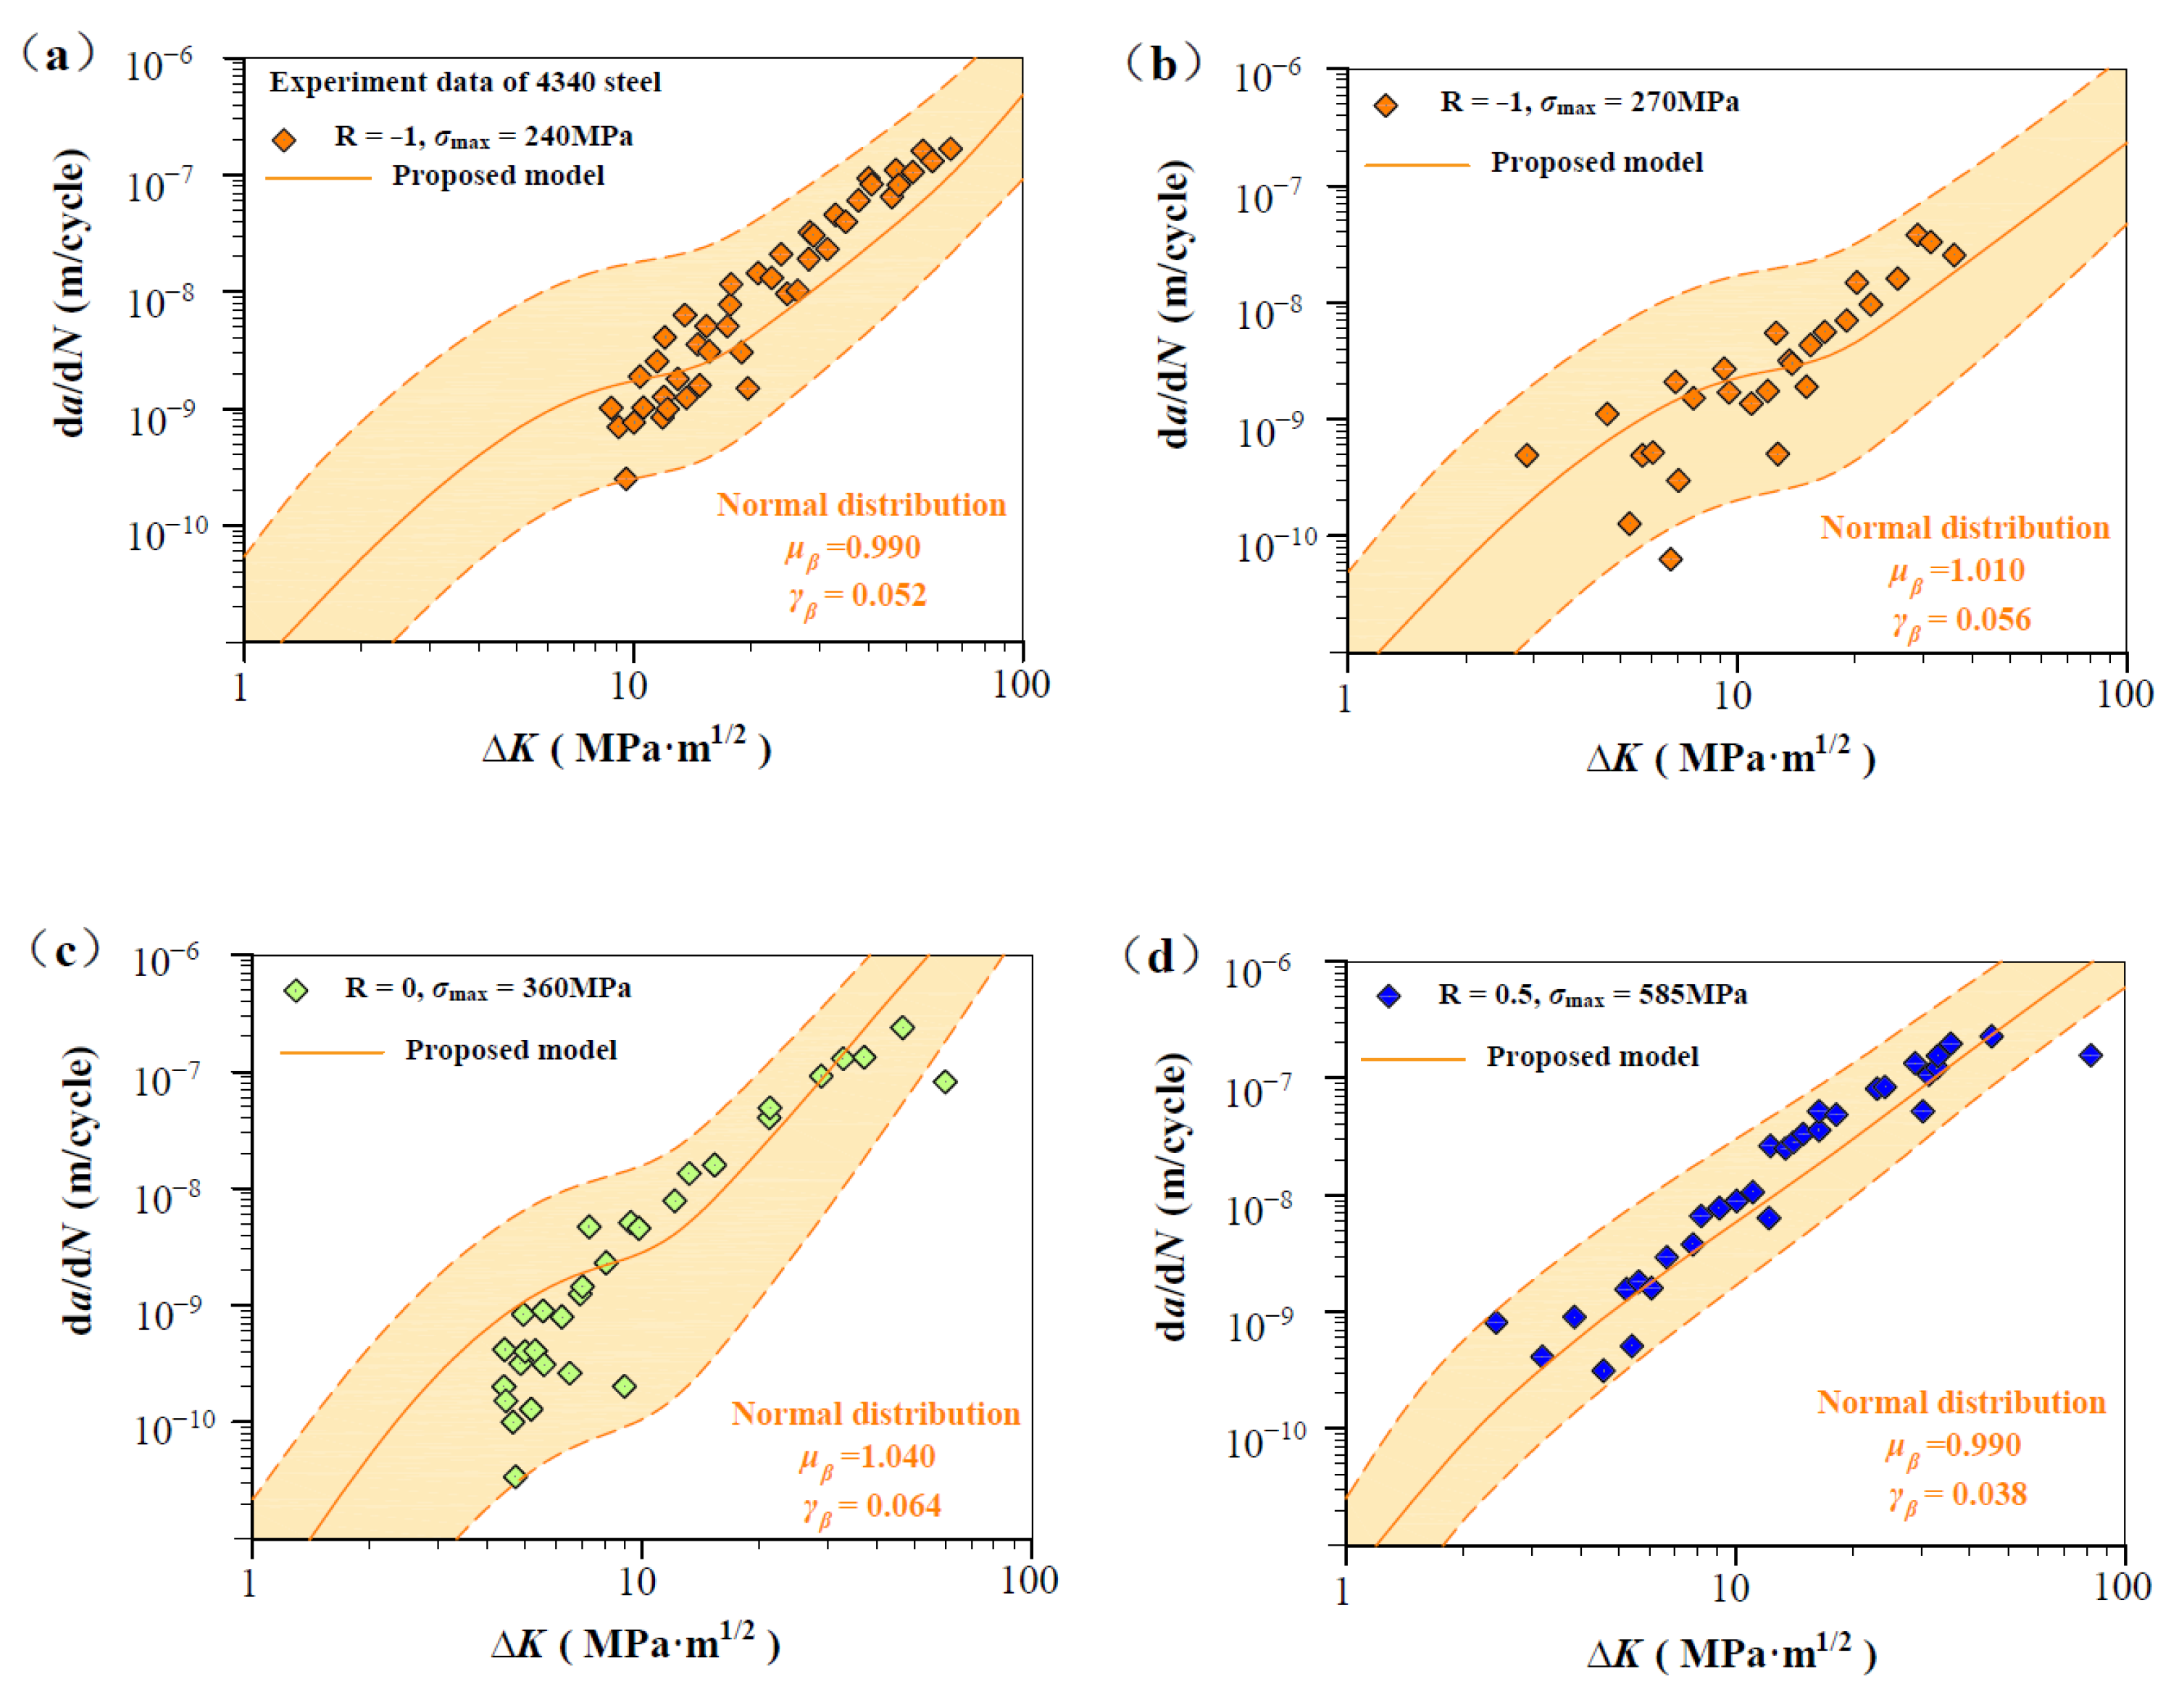
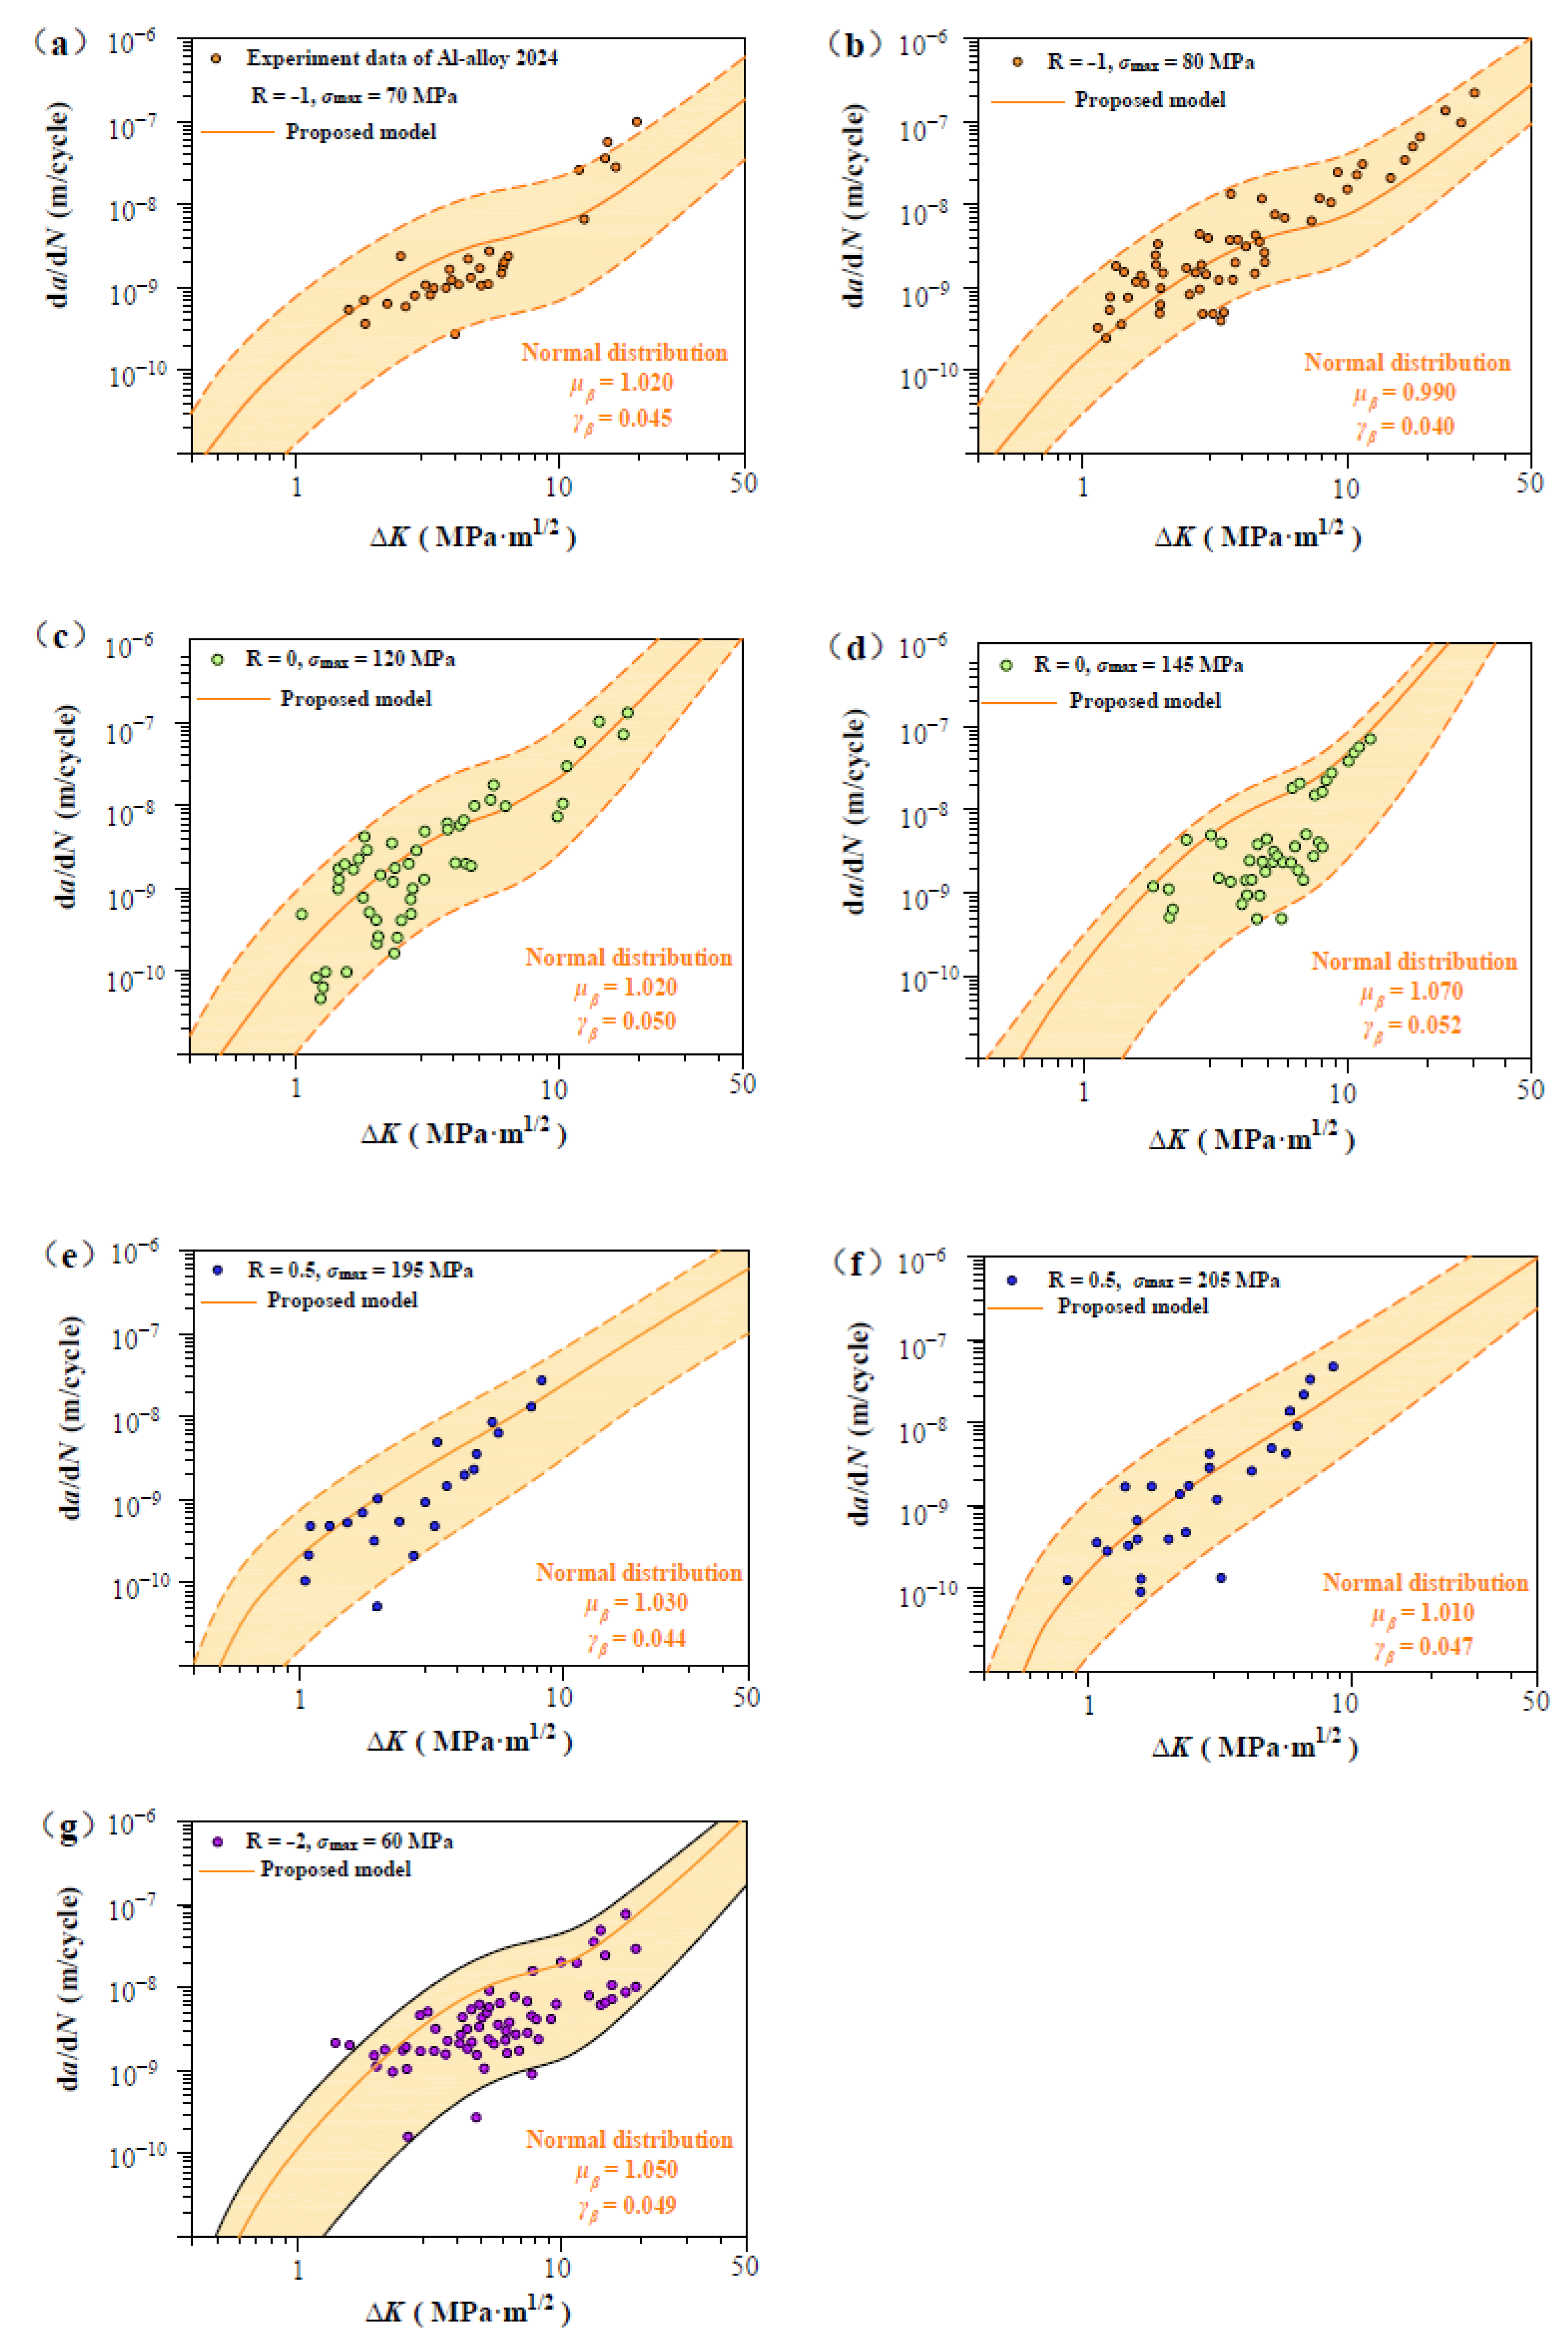
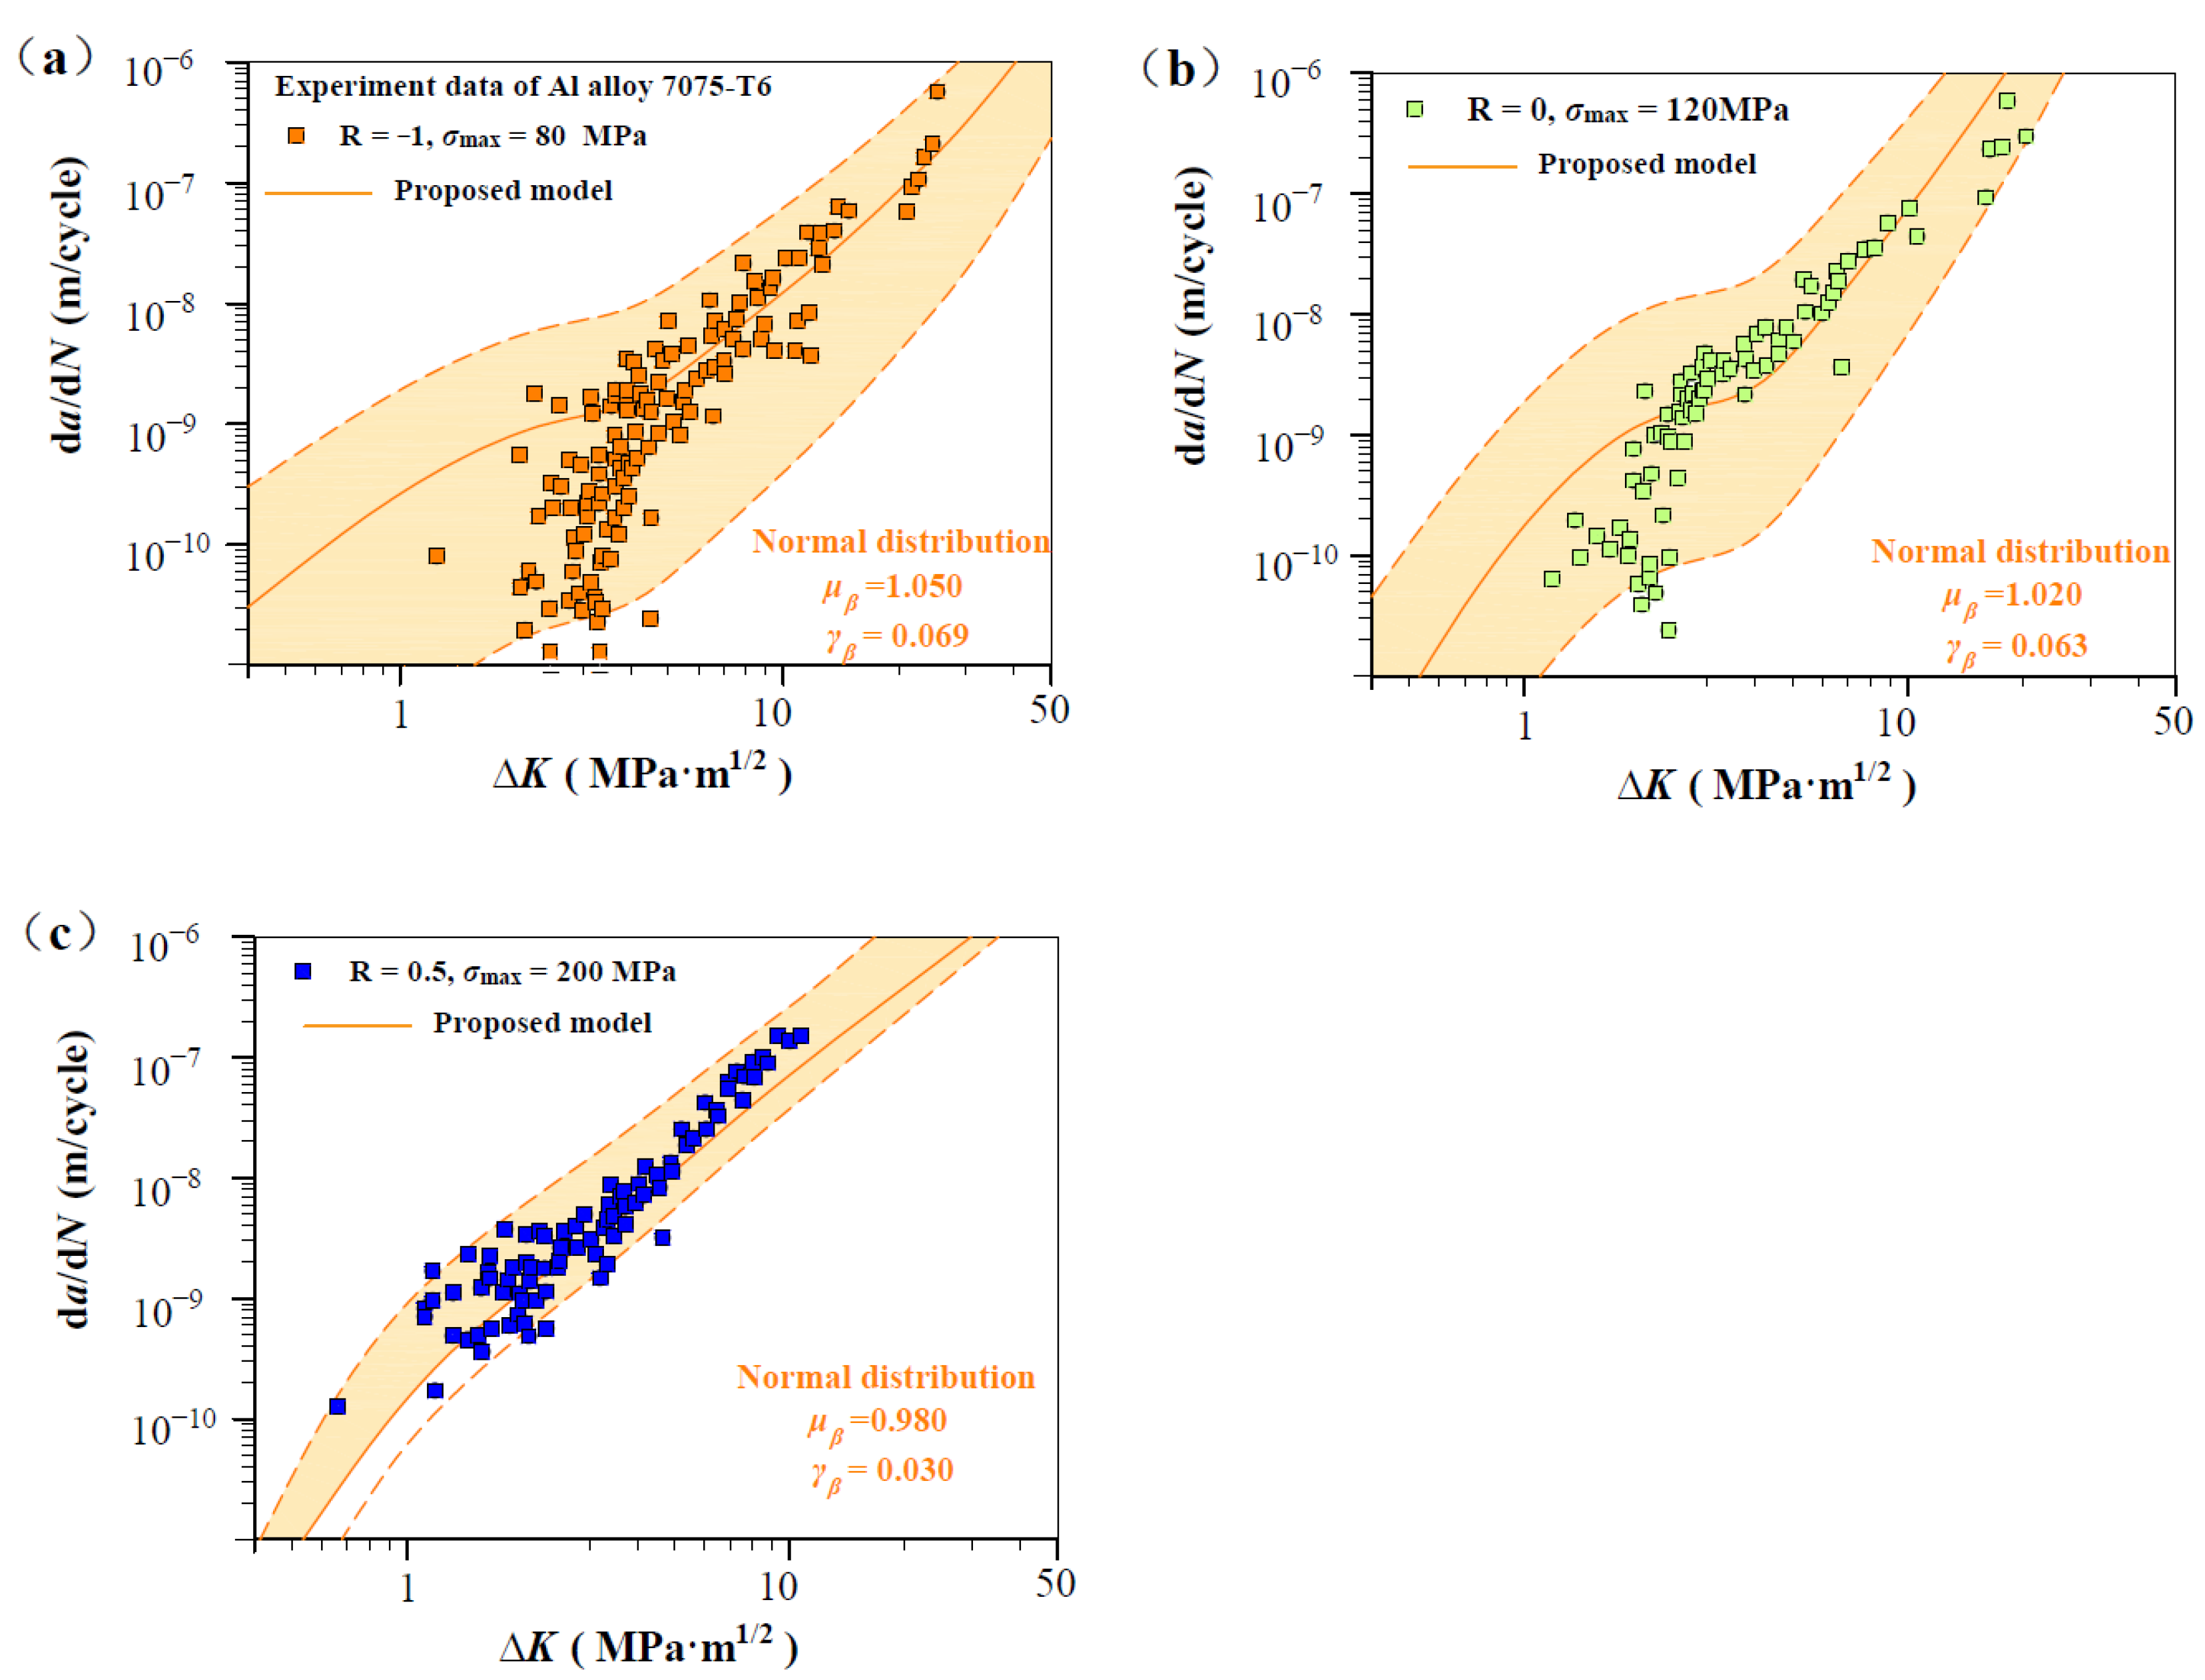
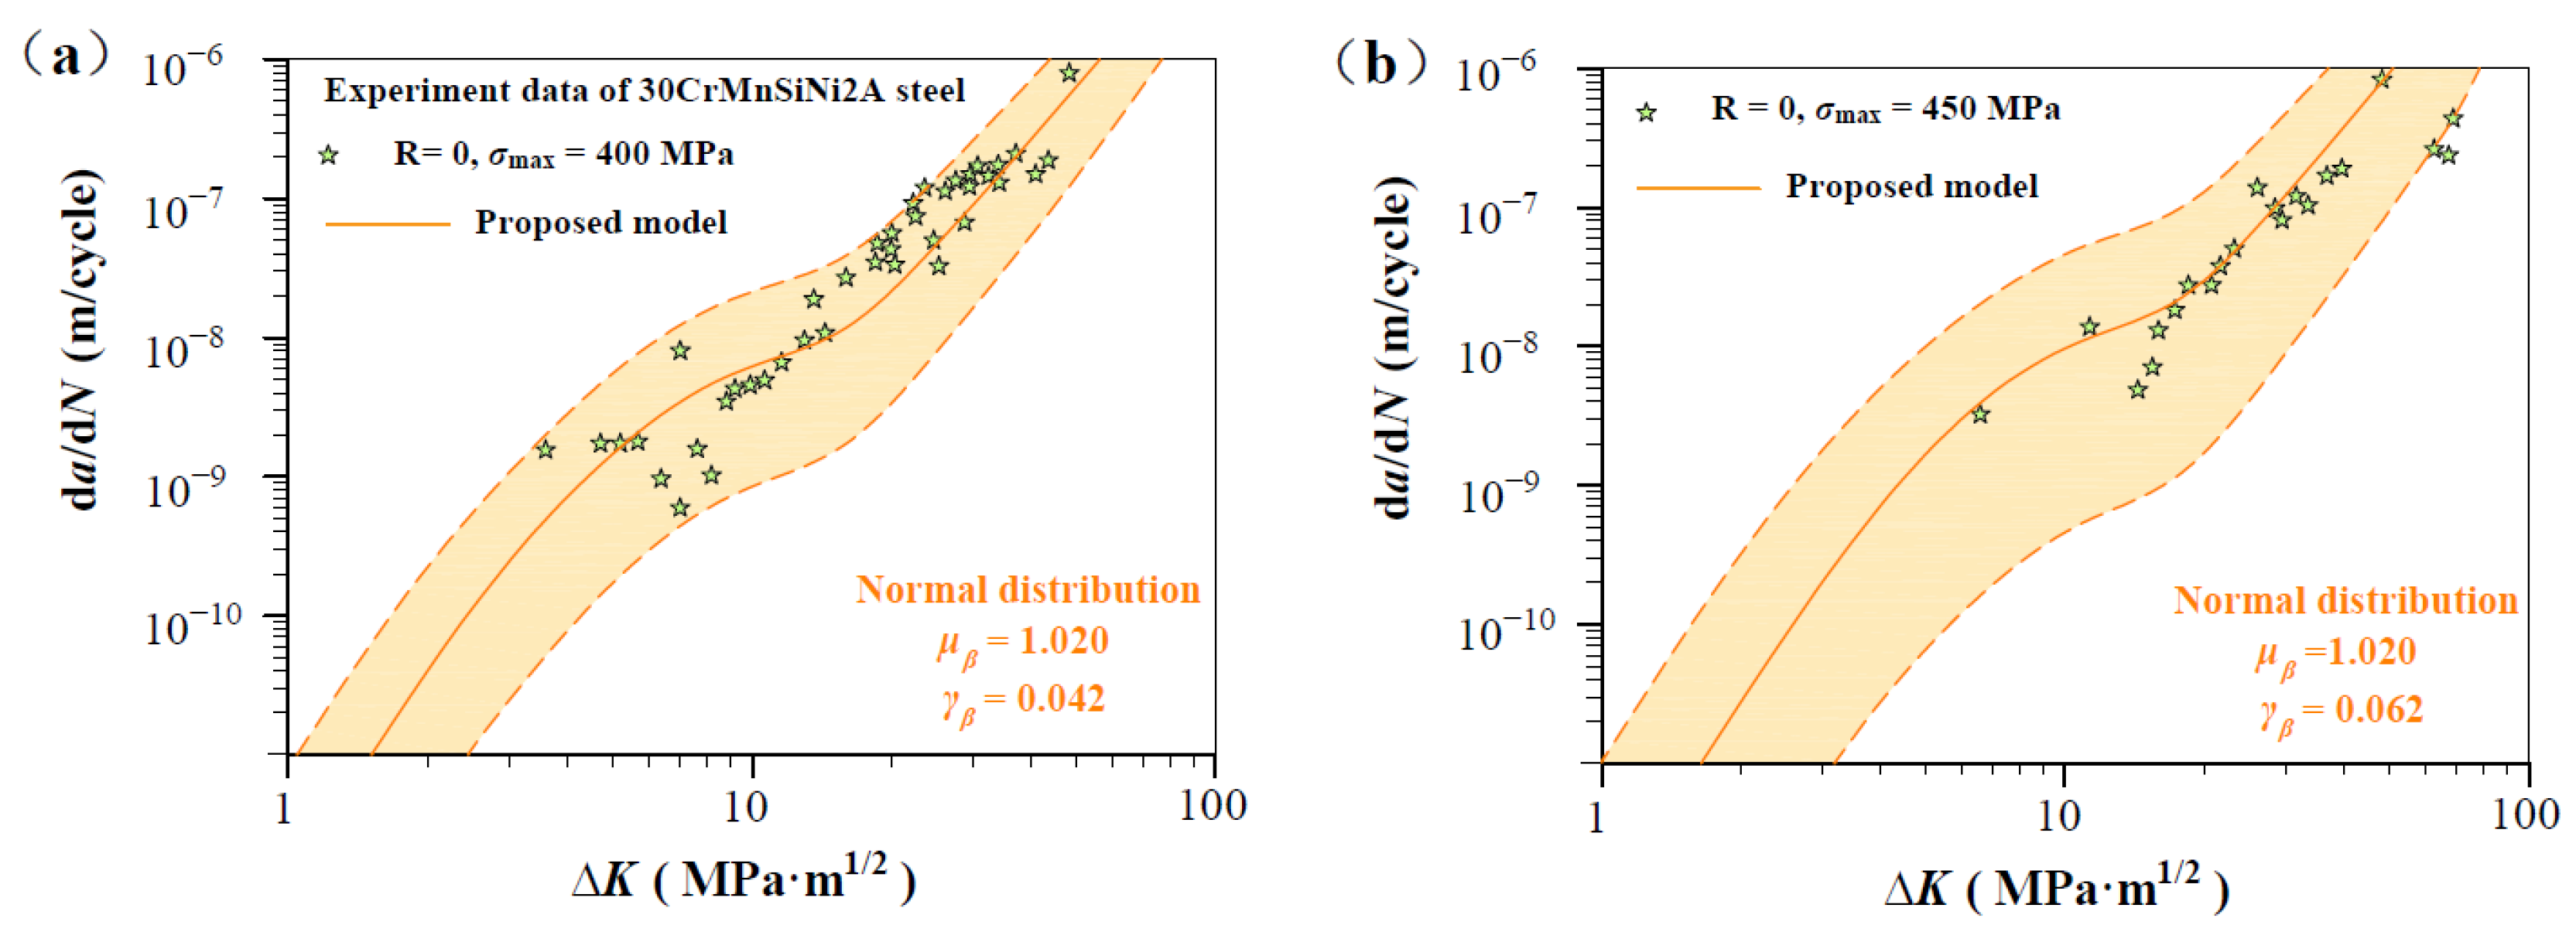
By integrating the theory of normal distribution with Equation (9), a probabilistic model with 96% reliability for assessing the FCG rate was developed, which reflects the inevitability of fatigue scatter.

Author Contributions

Conceptualization, X.Y.; Methodology, X.Y. and P.W.; Validation, X.Y.; Formal analysis, C.Z., P.W. and A.X.; Investigation, X.Y. and P.J.; Data curation, X.Y. and D.Y.; Writing—original draft, X.Y.; Writing—review & editing, X.Y. and C.Z.; Supervision, Z.D.; Project administration, Z.D.; Funding acquisition, P.J. and D.Y. All authors have read and agreed to the published version of the manuscript.

Funding

This research was funded by Science and Technology Project of Guangdong Province Traffic Group, grant number JT2021YB15.

Institutional Review Board Statement

Not applicable.

Informed Consent Statement

Not applicable.

Data Availability Statement

The data presented in this study are available in a publicly accessible repository. The original data presented in the study are openly available in [NASA Technical Reports Server] at [Search—NASA Technical Reports Server (NTRS)].

Conflicts of Interest

Authors Pengfei Ju and Dandan Yang were employed by China Construction First Group Corporation Limited. The remaining authors declare that the research was conducted in the absence of any commercial or financial relationships that could be construed as a potential conflict of interest.

Nomenclature

bBurgers vector
νPoisson’s ratio
hSlip band width
lTransition length between PSC and LC
aCrack length
a0Notch depth
ρNotch root radius
βNondimensional parameter
μβMean value of β
γβStandard deviation of β
σaStress amplitude
σmaxMaximum stress
σeRPlain fatigue limit at stress ratio R
YGeometry factor
RStress ratio
EElasticity modulus
DGrain size
ΔσStress range
ΔKStress intensity factor range
KTStress intensity factor range for physically short crack to long crack
Kth,scFatigue threshold stress intensity factor range for short crack
∆KTth,scFatigue threshold stress intensity factor range for physically short crack to long crack

Abbreviations

MSCMicrostructurally short crack
PSCPhysically short crack
SCShort crack
LCLong crack
FCGFatigue crack growth
LEFMLinear elastic fracture mechanics
SIFStress intensity factor
AXAxial loading
SENTSingle edge notch tension

References

  1. Salvati, E. Evaluating fatigue onset in metallic materials: Problem, current focus and future perspectives. Int. J. Fatigue 2024, 188, 108487. [Google Scholar] [CrossRef]
  2. Wanhill, R.J.H.; Stanzl-Tschegg, S.E. Short/small fatigue crack growth, thresholds and environmental effects: A tale of two engineering paradigms. Corros. Rev. 2021, 39, 165–175. [Google Scholar] [CrossRef]
  3. Hou, J.; Tang, K.; Wu, H. Short review on multiscale short fatigue crack growth model. Mater. Des. Process. Commun. 2019, 2, e93. [Google Scholar] [CrossRef]
  4. Zheng, Z.; Zhan, M.; Fu, M. Microstructural and geometrical size effects on the fatigue of metallic materials. Int. J. Mech. Sci. 2022, 218, 107058. [Google Scholar] [CrossRef]
  5. Wang, T.; Bin, J.; Renaud, G.; Liao, M. Probabilistic method for fatigue crack growth prediction with hybrid prior. Int. J. Fatigue 2022, 157, 106686. [Google Scholar] [CrossRef]
  6. Zerbst, U.; Vormwald, M.; Pippan, R.; Gänser, H.-P.; Sarrazin-Baudoux, C.; Madia, M. About the fatigue crack propagation threshold of metals as a design criterion—A review. Eng. Fract. Mech. 2016, 153, 190–243. [Google Scholar] [CrossRef]
  7. Natkowski, E.; Durmaz, A.R.; Sonnweber-Ribic, P.; Münstermann, S. Fatigue lifetime prediction with a validated micromechanical short crack model for the ferritic steel EN 1.4003. Int. J. Fatigue 2021, 152, 106418. [Google Scholar] [CrossRef]
  8. Nishikawa, H.; Furuya, Y.; Kasuya, T.; Enoki, M. Microstructurally small fatigue crack initiation behavior of fine and coarse grain simulated heat-affected zone microstructures in low carbon steel. Mater. Sci. Eng. A 2021, 832, 142363. [Google Scholar] [CrossRef]
  9. Mao, J.; Xu, Y.; Hu, D.; Liu, X.; Pan, J.; Sun, H.; Wang, R. Microstructurally short crack growth simulation combining crystal plasticity with extended finite element method. Eng. Fract. Mech. 2022, 275, 108786. [Google Scholar] [CrossRef]
  10. Wilson, D.; Zheng, Z.; Dunne, F.P. A microstructure-sensitive driving force for crack growth. J. Mech. Phys. Solids 2018, 121, 147–174. [Google Scholar] [CrossRef]
  11. Paris, P.; Erdogan, F. A Critical Analysis of Crack Propagation Laws. J. Basic Eng. 1963, 85, 528–533. [Google Scholar] [CrossRef]
  12. Chan, K.; Lankford, J. The role of microstructural dissimilitude in fatigue and fracture of small cracks. Acta Met. 1988, 36, 193–206. [Google Scholar] [CrossRef]
  13. Chapetti, M.D. Fatigue propagation threshold of short cracks under constant amplitude loading. Int. J. Fatigue 2003, 25, 1319–1326. [Google Scholar] [CrossRef]
  14. Chapetti, M.D. Fracture mechanics for fatigue design of metallic components and small defect assessment. Int. J. Fatigue 2022, 154, 106550. [Google Scholar] [CrossRef]
  15. Bang, D.; Ince, A. A short and long crack growth model based on 2-parameter driving force and crack growth thresholds. Int. J. Fatigue 2020, 141, 105870. [Google Scholar] [CrossRef]
  16. Chow, C.; Lu, T. Cyclic J-integral in relation to fatigue crack initiation and propagation. Eng. Fract. Mech. 1991, 39, 1–20. [Google Scholar] [CrossRef]
  17. Xing, S.; Pei, X.; Mei, J.; Dong, P.; Zhen, C.; Li, X.; Lu, F.; Liu, P. A novel elastic strain energy density approach for fatigue evaluation of welded components. Eng. Fract. Mech. 2023, 293, 109713. [Google Scholar] [CrossRef]
  18. Antunes, F.; Ferreira, M.; Branco, R.; Prates, P.; Gardin, C.; Sarrazin-Baudoux, C. Fatigue crack growth versus plastic CTOD in the 304L stainless steel. Eng. Fract. Mech. 2019, 214, 487–503. [Google Scholar] [CrossRef]
  19. Qi, J.; Deng, C.; Liu, Y.; Gong, B.; Wang, D. A short and long crack growth model with mean stress correction based on cyclic resistance curve. Theor. Appl. Fract. Mech. 2023, 124, 103785. [Google Scholar] [CrossRef]
  20. Ye, S.; Zhang, C.-C.; Zhang, P.-Y.; Zhang, X.-C.; Tu, S.-T.; Wang, R.-Z. Fatigue life prediction of nickel-based GH4169 alloy on the basis of a multi-scale crack propagation approach. Eng. Fract. Mech. 2018, 199, 29–40. [Google Scholar] [CrossRef]
  21. Tang, K.; Du, Z.; Ferro, P.; Berto, F. Crack initiation and propagation from geometric microdefects: Experiment and transition fatigue behavior. Fatigue Fract. Eng. Mater. Struct. 2021, 44, 2323–2336. [Google Scholar] [CrossRef]
  22. Santus, C.; Taylor, D. Physically short crack propagation in metals during high cycle fatigue. Int. J. Fatigue 2009, 31, 1356–1365. [Google Scholar] [CrossRef]
  23. Tang, K.; Du, Z.; Wu, B.; Hou, J. Fatigue behavior prediction of metal alloys based on a unified multiscale crack growth model. Eng. Fract. Mech. 2020, 235, 107132. [Google Scholar] [CrossRef]
  24. Tanaka, K.; Nakai, Y. Prediction of Fatigue Threshold of Notched Components. J. Eng. Mater. Technol. 1984, 106, 192–199. [Google Scholar] [CrossRef]
  25. Herasymchuk, O. Microstructurally-dependent model for predicting the kinetics of physically small and long fatigue crack growth. Int. J. Fatigue 2015, 81, 148–161. [Google Scholar] [CrossRef]
  26. Chan, K.S. Variability of large-crack fatigue-crack-growth thresholds in structural alloys. Met. Mater. Trans. A 2004, 35, 3721–3735. [Google Scholar] [CrossRef]
  27. Fukumura, N.; Li, B.; Koyama, M.; Suzuki, T.; Hamada, S.; Tsuzaki, K.; Noguchi, H. Material property controlling non-propagating fatigue crack length of mechanically and physically short-crack based on Dugdale-model analysis. Theor. Appl. Fract. Mech. 2017, 90, 193–202. [Google Scholar] [CrossRef]
  28. Li, H.; Zhang, P.; Wang, B.; Zhang, Z. Predictive fatigue crack growth law of high-strength steels. J. Mater. Sci. Technol. 2021, 100, 46–50. [Google Scholar] [CrossRef]
  29. Zhu, M.-L.; Xuan, F.-Z.; Tu, S.-T. Effect of load ratio on fatigue crack growth in the near-threshold regime: A literature review, and a combined crack closure and driving force approach. Eng. Fract. Mech. 2015, 141, 57–77. [Google Scholar] [CrossRef]
  30. Liu, R.; Zhang, P.; Wang, B.; Zhang, Z. A practical model for efficient anti-fatigue design and selection of metallic materials: II. Parameter analysis and fatigue strength improvement. J. Mater. Sci. Technol. 2021, 70, 250–267. [Google Scholar] [CrossRef]
  31. Newman, J.C.; Wu, X.R.; Venneri, S.L.; Li, C.G. Small-Crack Effects in High-Strength Aluminum Alloys. Available online: https://ntrs.nasa.gov/citations/19940029793 (accessed on 29 March 2023).
  32. Newman, I.; Edwards, P.R. Short Crack Growth Behavior in an Aluminium Alloy an AGARD Cooperative test Program. Available online: https://ntrs.nasa.gov/citations/19890007917 (accessed on 29 March 2023).
  33. Akiniwa, Y.; Tanaka, K.; Matsui, E. Statistical characteristics of propagation of small fatigue cracks in smooth specimens of aluminium alloy 2024-T3. Mater. Sci. Eng. A 1988, 104, 105–115. [Google Scholar] [CrossRef]
  34. Chong-Myong, P.; Ji-Ho, S. Crack growth and closure behavior of short fatigue cracks. Eng. Fract. Mech. 1994, 47, 327–343. [Google Scholar] [CrossRef]
  35. Ding, C.; Hui, Y.; Wu, R. Growth behaviour of small fatigue crack and fatigue-life prediction for high-strength steel 30CrMnSiNi2A. Acta Metall. Sin. 1997, 33, 277–286. Available online: https://www.ams.org.cn/CN/Y1997/V33/I3/277 (accessed on 1 October 2023).
  36. Edwards, P.R.; Newmann, J.C. Short-Crack Growth Behaviour in Various Aircraft Materials. Available online: https://ntrs.nasa.gov/citations/19910001927 (accessed on 29 March 2023).
  37. Mann, T. The influence of mean stress on fatigue crack propagation in aluminium alloys. Int. J. Fatigue 2007, 29, 1393–1401. [Google Scholar] [CrossRef]
  38. Marines-Garcia, I.; Paris, P.C.; Tada, H.; Bathias, C.; Lados, D. Fatigue crack growth from small to large cracks on very high cycle fatigue with fish-eye failures. Eng. Fract. Mech. 2007, 75, 1657–1665. [Google Scholar] [CrossRef]
Figure 1. Fatigue crack growth curves of short crack and long crack.
Materials 17 05163 g001
Figure 2. Predicted curves of Equation (7) at different stress ratios (color distinguished).
Materials 17 05163 g002
Figure 3. Prediction da/dN-∆K curves at R = −1, 0, and 0.5 for 4340 steel specimens [36]: (a,b) predicted da/dN-∆K curves at R = −1, σmax = 240 MPa, and R = −1, σmax = 270 MP; (c) predicted da/dN-∆K curves at R = 0, σmax = 360 MPa; and (d) predicted da/dN-∆K curves at R = 0.5, σmax = 585 MPa.
Materials 17 05163 g003
Figure 4. Prediction da/dN-∆K curves at R = −1, 0, 0.5, and −2 for Al alloy 2024 specimens [32]: (a,b) predicted da/dN-∆K curves at R = −1, σmax = 70 MPa, and R = −1, σmax = 80 MP; (c,d) predicted da/dN-∆K curves at R = 0, σmax = 120 MPa, and R = 0, σmax = 145 MP; (e,f) predicted da/dN-∆K curves at R = 0.5, σmax = 195 MPa, and R = 0.5, σmax = 205 MP; and (g) predicted da/dN-∆K curves at R = −2, σmax = 60MPa.
Materials 17 05163 g004
Figure 5. Prediction da/dN-∆K curves at R = −1, 0, and 0.5 for Al alloy 7075 specimens [31]: (a) predicted da/dN-∆K curves at R = −1, σmax = 80 MP; (b) predicted da/dN-∆K curves at R = 0, σmax = 120 MPa; and (c) predicted da/dN-∆K curves at R = 0.5, σmax = 200 MP.
Materials 17 05163 g005
Figure 6. Prediction da/dN-∆K curves at R = 0 for 30CrMnSiNi2A steel specimens [35]: (a,b) predicted da/dN-∆K curves at R = 0, σmax = 400 MPa, and R = 0, σmax = 450 MP.
Materials 17 05163 g006
Figure 7. Histogram and normal distribution analysis of β values: (a) FCG data analysis of 4340 steel specimens; (b) FCG data analysis of Al alloy 2024 specimens; (c) FCG data analysis of Al alloy 7075, specimens. (d) FCG data analysis of 30CrMnSiNi2A steel specimens.
Materials 17 05163 g007
Figure 8. Normal distribution analysis of measurements on 4340 steel specimens. (a,b) Normal distribution analysis at R = −1, σmax = 240 MPa, and R = −1, σmax = 270 MP; (c) Normal distribution analysis at R = 0, σmax = 360 MPa; and (d) Normal distribution analysis at R = 0.5, σmax = 585 MPa.
Materials 17 05163 g008
Figure 9. Normal distribution analysis of measurements on Al alloy 2024 specimens (a,b) Normal distribution analysis at R = −1, σmax = 70 MPa, and R = −1, σmax = 80 MP; (c,d) Normal distribution analysis at R = 0, σmax = 120 MPa, and R = 0, σmax = 145 MP; (e,f) Normal distribution analysis at R = 0.5, σmax = 195 MPa, and R = 0.5, σmax = 205 MP; and (g) Normal distribution analysis at R = −2, σmax = 60 MPa.
Materials 17 05163 g009
Figure 10. Normal distribution analysis of measurements on Al alloy 7075 specimens. (a) Normal distribution analysis at R = −1, σmax = 80 MP; (b) Normal distribution analysis at R = 0, σmax = 120 MPa; and (c) Normal distribution analysis at R = 0.5, σmax = 200 MP.
Materials 17 05163 g010
Figure 11. Normal distribution analysis of measurements on 30CrMnSiNi2A steel specimens. (a,b) Normal distribution analysis at R = 0, σmax = 400 MPa, and R = 0, σmax = 450 MP.
Materials 17 05163 g011
Table 1. Material characteristic parameters were used in this study.
MaterialsGrain Size (μm)Burgers Vector b (m)Poisson’s RatioYield Strength (MPa)
Al alloy 2024 [32]252.86 × 10−100.33355
Al alloy 7075 [31]72.86 × 10−100.33520
AISI 4340 Steel [36]162.48 × 10−100.27–0.31413
30CrMnSiNi2A steel [35]102.52 × 10−100.31189
Table 2. The experimental parameters used in this study.
Materials RLoad Typeσmax (MPa)a0 (mm)ρ (mm)KtσeR (MPa)Notch
Geometry
AISI4340 [36]−1AX2403.183.183.3218SENT
2703.183.183.3
0AX3603.183.183.3285
0.5AX5853.183.183.3526
Al alloy 2024 [32]−1AX703.183.183.1762.5SENT
803.183.183.17
0AX1203.183.183.17104
1453.183.183.17
0.5AX1953.183.183.17193
2053.183.183.17
−2AX603.183.183.1748.4
Al alloy 7075 [31]−1AX803.23.23.1570.4SENT
0AX1203.23.23.15107
0.5AX2003.23.23.15183
30CrMnSiNi2A steel [35]0AX4003.23.23.3265SENT
4503.23.23.3
Disclaimer/Publisher’s Note: The statements, opinions and data contained in all publications are solely those of the individual author(s) and contributor(s) and not of MDPI and/or the editor(s). MDPI and/or the editor(s) disclaim responsibility for any injury to people or property resulting from any ideas, methods, instructions or products referred to in the content.

