Article

Damage Evolution Mechanism of Railway Wagon Bogie Adapter 1035 Steel and Damage Parameter Calibration Based on Gursone–Tvergaarde–Needleman Model

1
College of Mechanical Engineering, North China University of Science and Technology, Tangshan 063210, China
2
Yanching Institute of Technology, Langfang 065201, China
3
China MCC22 Group Corporation Ltd., Tangshan 063035, China
4
State Key Laboratory of Materials Processing and Die & Mould Technology, Huazhong University of Science and Technology, 1037 Luoyu Road, Wuhan 430074, China
*
Authors to whom correspondence should be addressed.
Materials 2024, 17(20), 5070; https://doi.org/10.3390/ma17205070
Submission received: 13 September 2024 / Revised: 6 October 2024 / Accepted: 14 October 2024 / Published: 17 October 2024
(This article belongs to the Special Issue Research on Metal Cutting, Casting, Forming, and Heat Treatment)

Abstract

:
As a critical component of a train, the railway wagon bogie adapter has higher quality requirements. During the forging process, external loads can induce voids, cracks, and other defects in the forging, thereby reducing its service life. Hence, studying the damage behavior of the forging material, specifically AISI 1035 steel, becomes crucial. This study involved obtaining stress–strain curves for AISI 1035 steel through uniaxial tensile tests at temperatures of 900 °C, 1000 °C, and 1100 °C, with strain rates of 0.1 s−1, 1 s−1, and 10 s−1. Subsequently, SEM was used to observe samples at various deformation stages. The damage parameters, q 1 ,   q 2 and q 3 in the GTN model “a computational model used to analyze and simulate material damage which can effectively capture the damage behavior of materials under different loading conditions” were then calibrated using the Ramberg–Osgood model and stress–strain curve fitting. Image Pro Plus software v11.1 quantified the sample porosity as f 0 , f n , f c and f F . A finite element model was established to simulate the tensile behavior of the AISI 1035 steel samples. By comparing the damage parameters of f 0 , f n , f c and f F obtained by the finite element method and experimental method, the validity of the damage parameters obtained by the finite element inverse method could be verified.

1. Introduction

The railway wagon bogie adapter is usually connected to the car body and the chassis, which is used to disperse and transfer the weight of the train car so as to reduce the local pressure on the track. This ensures the train is evenly distributed on the track and its stability during operation, avoids the car shaking or falling off, and extends the service life of the track through a solid connection. In the aerospace, automotive and medical device fields, as well as in other demanding manufacturing areas, especially those requiring custom and complex parts, single-point incremental forming (SPIF) will play an increasingly important role in the future of manufacturing as a flexible and efficient manufacturing technology. Single-point incremental forming belongs to the category of additive manufacturing and plastic forming. The basic principle is to gradually apply force to the material through a controlled tool (usually a conical or spherical tool), which causes plastic deformation of the material at each point of application, and finally forms the desired three-dimensional shape. Many scholars have also carried out much of research on this technology.
Liu et al. [1] have assessed the sustainability of advancements in progressive sheet metal forming technology. Their research indicated that when evaluating mold costs and mass production within the single-point progressive forming process, significant advantages and promising prospects emerge for batch sizes under 1000. Kumar et al. [2] investigated the formability of dissimilar aluminum alloy sheets AA5083 and AA7075 welded using friction stirring in single-point incremental forming. Using ultimate tensile strength (UTS) and elongation (PE) as key metrics, their findings revealed that a combination of lower rotation speed, increased welding speed, and an appropriately sized tool head enhances the forming accuracy of the workpiece. Wu et al. [3] introduced a novel parametric multi-step machining path, demonstrating that adjusting various influencing factors can achieve higher geometric accuracy within ±0.6 mm.
As an important force part of the bogie, the quality of the railway wagon bogie adapter directly determines the safety, reliability and stability of the train operation. However, during the process of high temperature forming, the external load will nucleate microvoids in the vicinity of grain boundaries, form second-phase particles and inclusions, and generate new voids [4]. The accumulation of these voids can ultimately result in fracture failure of the forging. Therefore, understanding the evolution mechanism of meso-damage in AISI 1035 steel during thermal deformation holds significant importance in enhancing the quality and performance of forgings.
The macroscopic properties of the material are determined by its microstructure, and the microstructure characteristics of the steel will also change correspondingly under high temperature and external load. Therefore, neither macroscopic damage mechanics nor microscopic damage mechanics [5,6] can be applied to properly analyze its mechanical behavior.
The mesoscopic damage mechanics approach takes into account the advantages of the above two methods. Mesoscopic damage mechanics can be divided into two main mechanisms: for brittle materials, it is mainly micro-crack damage [7]; for ductile materials, it is microvoid damage. In the realm of mesoscopic damage mechanics, the GTN model is widely adopted in academic research. From a microscopic standpoint, the damage process involves the nucleation, growth, and aggregation of voids [8].
The Gursone–Tvergaarde–Needleman (GTN) [9] model of ductile damage has a unique advantage in the research of material forming processes. Numerous scholars have conducted research on the void damage model. Gurson [10] first proposed two finite size cell models, cylindrical and three-dimensional. However, the Gurson model is only suitable for ideal isotropic elastoplastic materials. Then, Needleman and Tvergaard [11,12,13] improved the Gurson model, forming a classical porous plastic damage model, called the Gursone–Tvergaarde–Needleman (GTN) model. In this model, parameters are introduced into the constitutive equation, and the influences of stress, strain and void interaction in the plastic damage process are fully considered. The GTN model has a good prediction effect on metal ductile damage [14,15,16,17], providing a new way for studying the toughness of material damage.
Many scholars have predicted the material damage behavior well through the GTN model. Yin et al. [18] conducted a tensile test on a notched round bar sample of Q355D steel and utilized the calibrated GTN model to simulate the tensile behavior of the steel plate. They found that the results agree well and that the fracture of the steel plate was predicted accurately. Yoshida et al. [19] set GTN model parameters for 316L stainless steel cold-working materials and simulated the fracture behavior of plate samples. The results showed that toughness fracture assessment and the GTN model were suitable for BWR reactors affected by neutron irradiation. In Wu’s study [20], negative stress triaxiality and fracture effects were incorporated into a modified GTN model. This modified model was subsequently implemented in finite element software to simulate spinning processes on 2024-T351 aluminum alloy. By comparing simulation results with experimental data, an error of only 8.36% in maximum thinning rates was observed, validating the enhanced GTN model’s suitability for spinning applications. Yan et al. [21] used the GTN damage model to study the ductile failure of S700 material under cold forming, and calibrated the parameters q1, q2 and q3 in the yield surface of the GTN model. Brahim [22] proposed an optimization method that utilizes the maximum stress at various notch depths to predict fracture initiation. The GTN model was employed to simulate tensile fractures in samples with varying notch depths, confirming the model’s accuracy. Yildiz [23] effectively utilized the GTN model to forecast the ductile fracture of 6061 aluminum alloy during the forming process. Quan Sun et al. [24] introduced a novel approach for determining the shear-modified GTN parameters proposed by Nahshon and Hutchinson, integrating neural network algorithms with small punch tests. Li et al. [25] employed the GTN model to investigate the evolution of damage in AA7075-T6 aluminum alloy during hot forming. Using the GTN model, Gao et al. [26] investigated the mechanical behavior and material loss during the hot small punch test (T-SPT), and predicted both damage evolution and distribution in automobile B-pillars during hot forming.
With the research and modification of damage models, the application range of GTN model continues to expand. However, the application of the GTN model to AISI 1035 steel has been limited. Therefore, the GTN mesodamage model is introduced into the tensile simulation of AISI 1035 steel to explore the application of the GTN model on the saddle-bearing hot-forging material AISI 1035 steel.

2. Experimental Methods

2.1. Materials

The experimental material is AISI 1035 steel. The main components are shown in Table 1, and the dimensions of the tensile sample are illustrated in Figure 1. The total length is 130 mm, the diameter of the bar is 25 mm, the length of the parallel part in the middle is 30 mm, and the diameter is 10 mm.

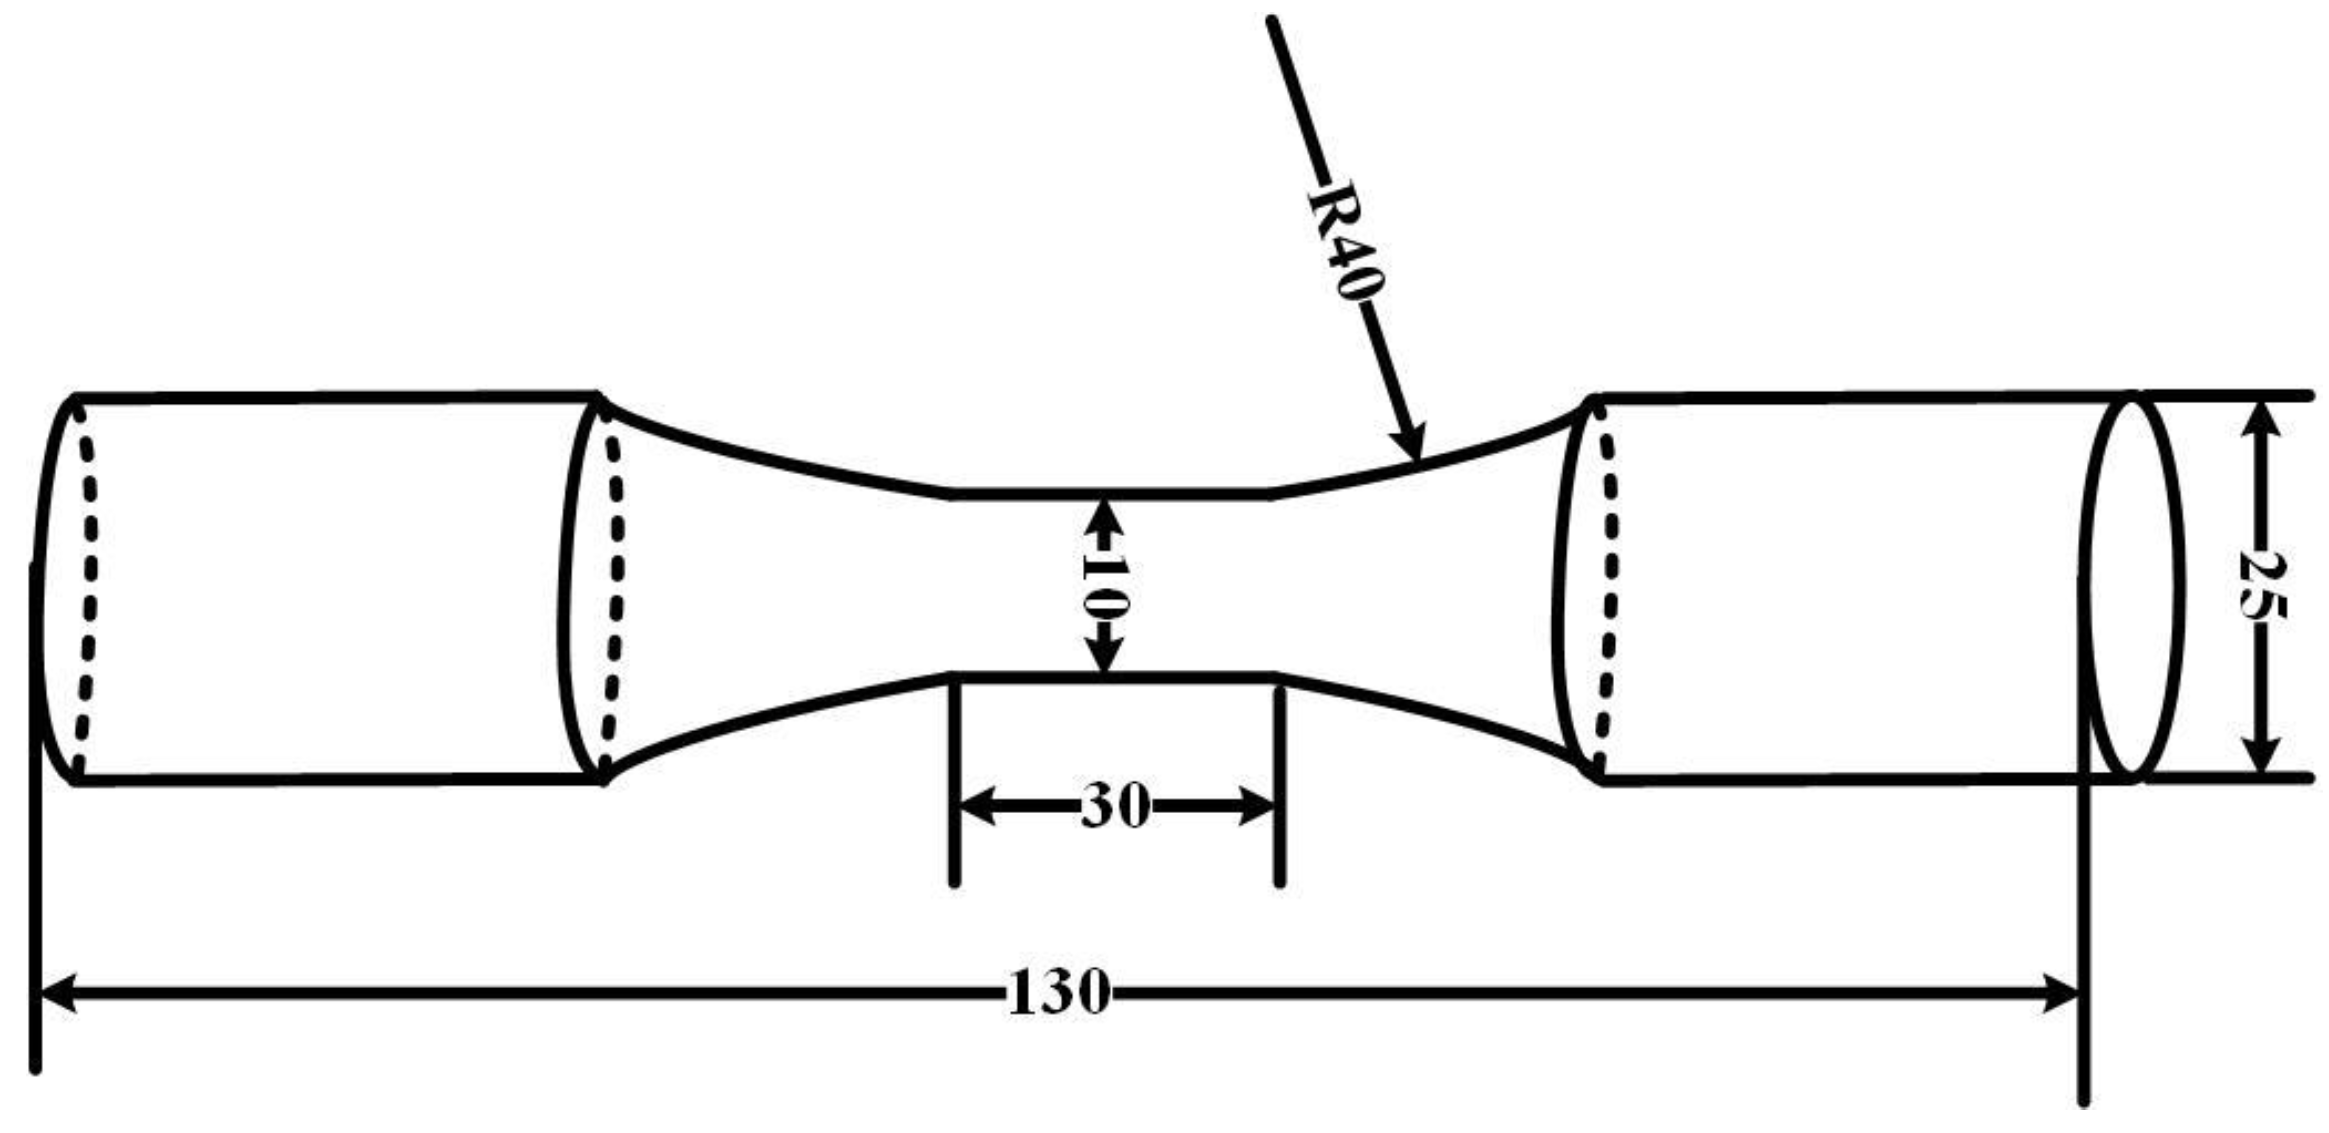
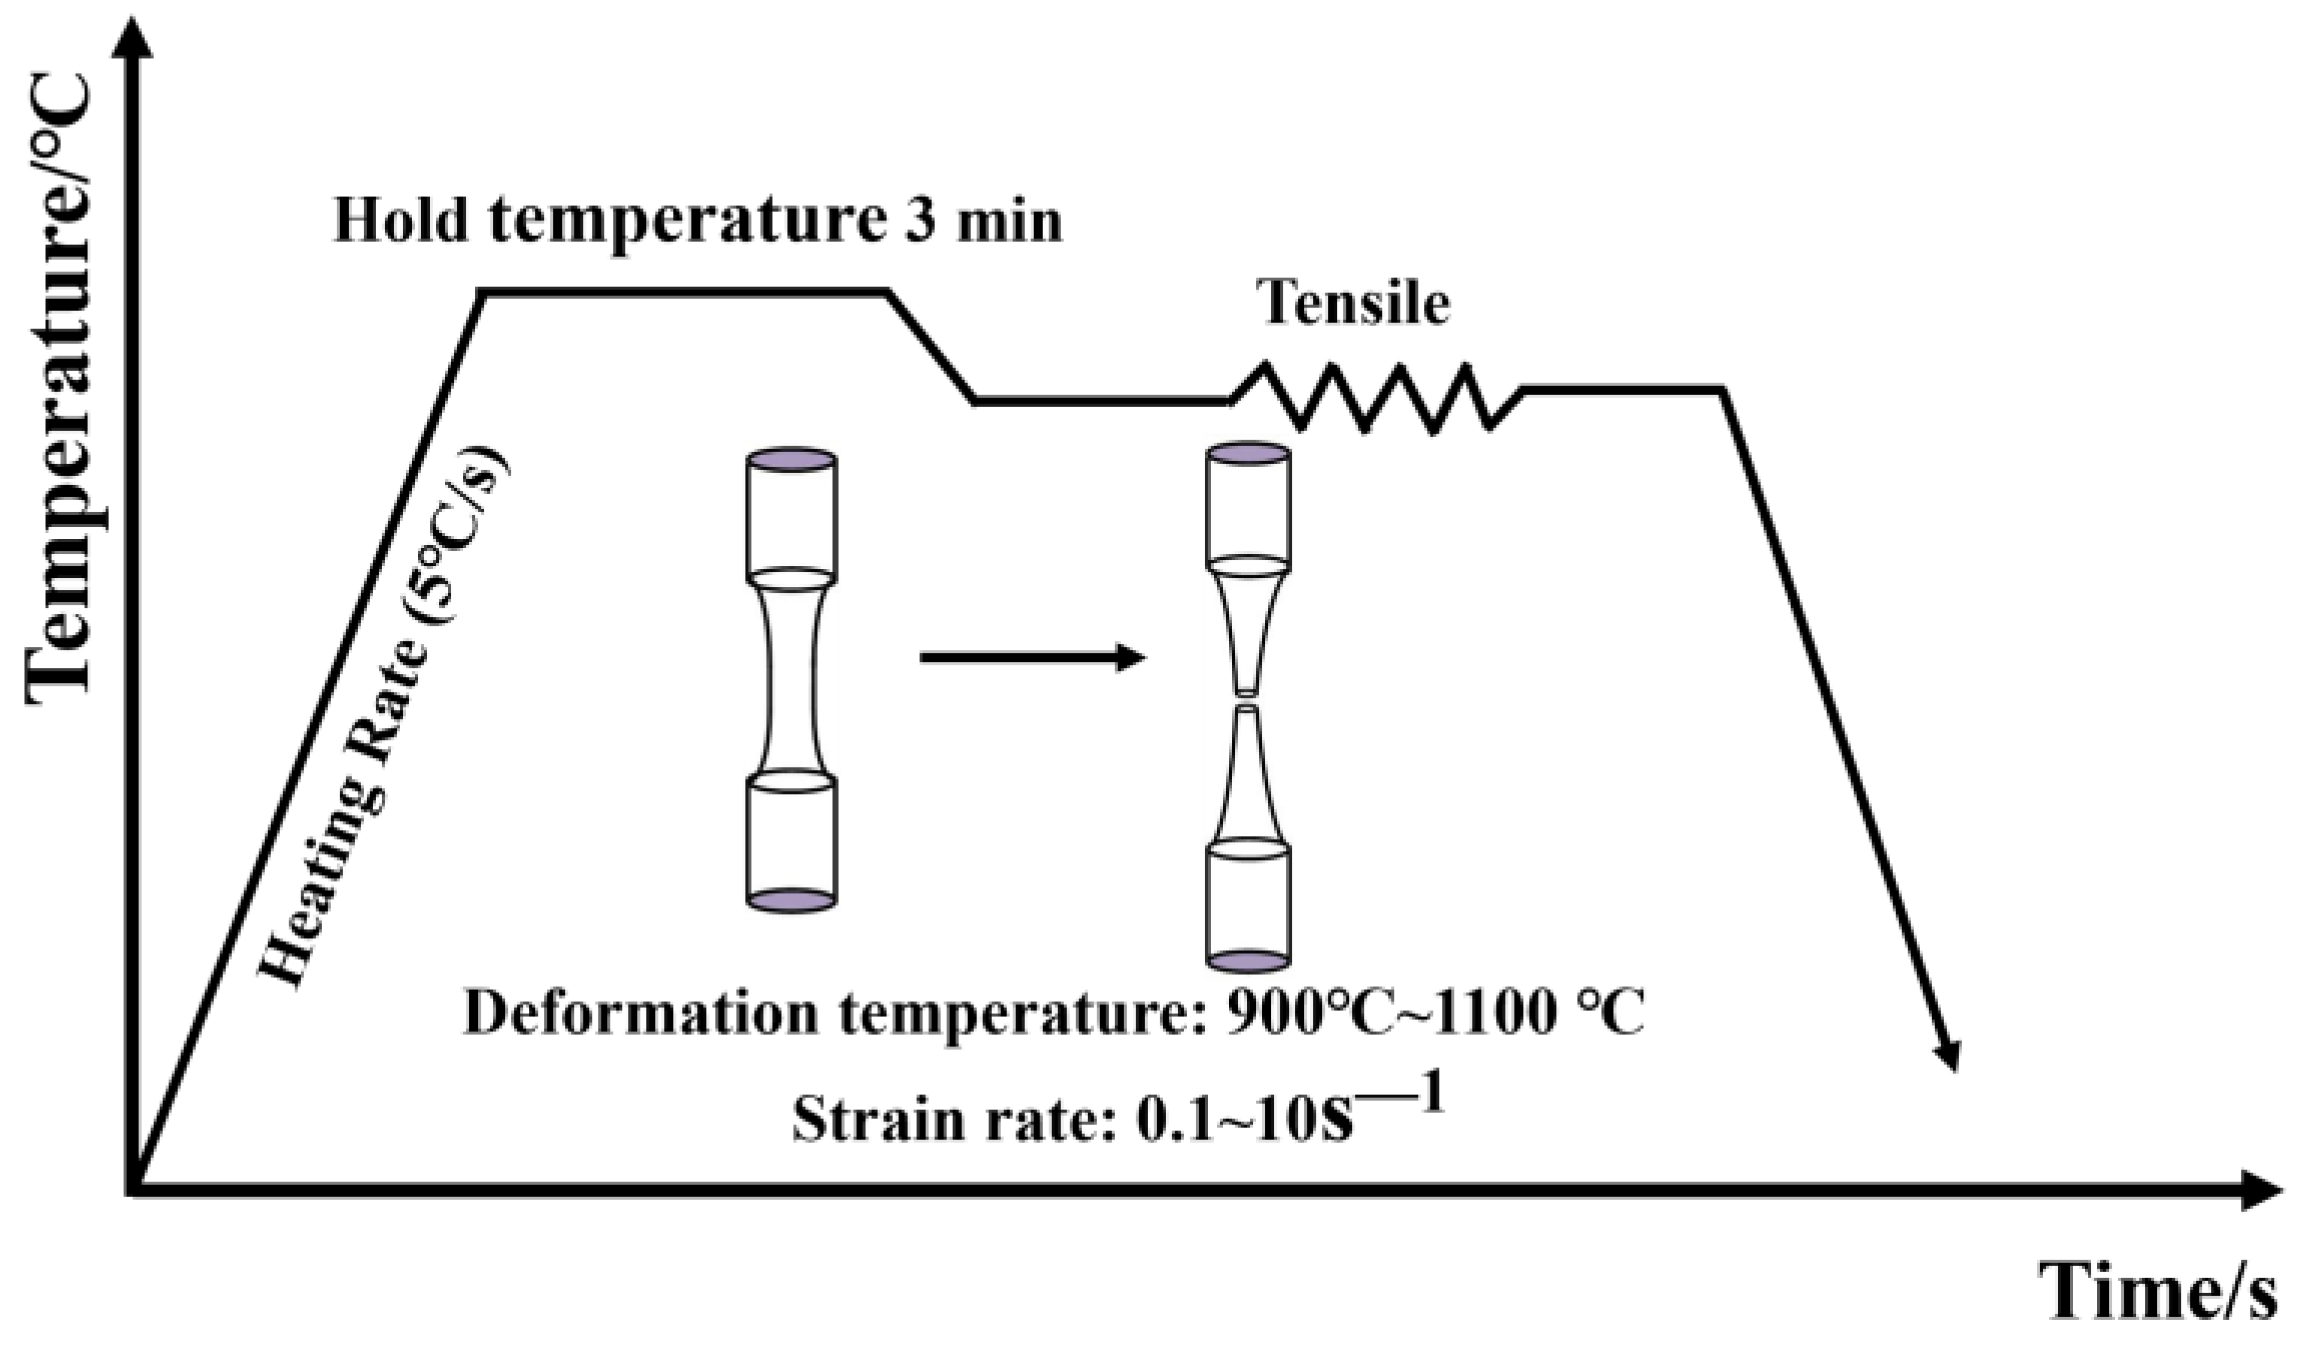
2.2. Experimental Study

The forged railway wagon bogie adapter was machined into the Figure 1 dimensions by means of an electric spark cutting machine and a CNC lathe. The high temperature tensile test was carried out with a Gleeble-1500D thermal simulator, Dynamic Systems Inc., Poestenkill, NY, USA. As shown in Figure 2, the sample was heated to 1200 °C at 5 °C/s and kept warm for 3 min so that it was fully austenitized. It was then cooled to 1100, 1000, 900 °C at a cooling rate of 5 °C/s, respectively, and isothermal stretching was carried out at a strain rate of 0.1, 1, and 10 s−1, respectively. After undergoing tension, the sample was rapidly water-cooled to preserve its microstructure.

3. Results and Discussion

3.1. Introduction to GTN Model

Gurson proposed a body cell model with voids in a finite large matrix and obtained the yield functions applicable to two shapes of voids, cylindrical voids in a cylindrical cell and spherical voids in a three-dimensional body cell, as shown in Equation (1).
Φ = ( σ e q σ y ) 2 + 2 f c o s h ( 3 σ m 2 σ y ) ( 1 + f 2 ) = 0
Tvergaard and Needleman revised the Gurson model and proposed three modified parameters to describe the interaction between voids. The improved model is the GTN damage model that many researchers now use. The yield function of the GTN damage model is expressed as:
Φ = ( σ e q σ y ) 2 + 2 q 1 f * cosh ( 3 σ m q 2 2 σ y ) ( 1 + q 3 ( f * ) 2 ) = 0
f * is a piecewise continuous function used to describe the through polymerization of microvoids in the necking process of a material, and f * = 0 when no damage occurs in the material; the functional relationship is as follows:
f * = { f                                                   f f c f c + k ( f f c )     f > f c
k = f u * f c f f f c
In the formula, f c is the critical porosity, f F is the void fraction at the time of failure, and k is the void growth acceleration factor. The total damage consists of two parts: nucleation of newly formed voids, and the growth of voids that have been nucleated.
f = f g r o w + f n u c l
Assuming the voids surrounding the characteristic volume element are incompressible, their growth is contingent upon the plastic deformation of the matrix.
f g r o w = f n S n 2 π exp ( 1 2 ( ε m ε n S n ) ) ε p
where f n is the volume fraction of the nucleable void, S n is the standard deviation of void nucleation strain, and ε n is the mean nucleation strain.

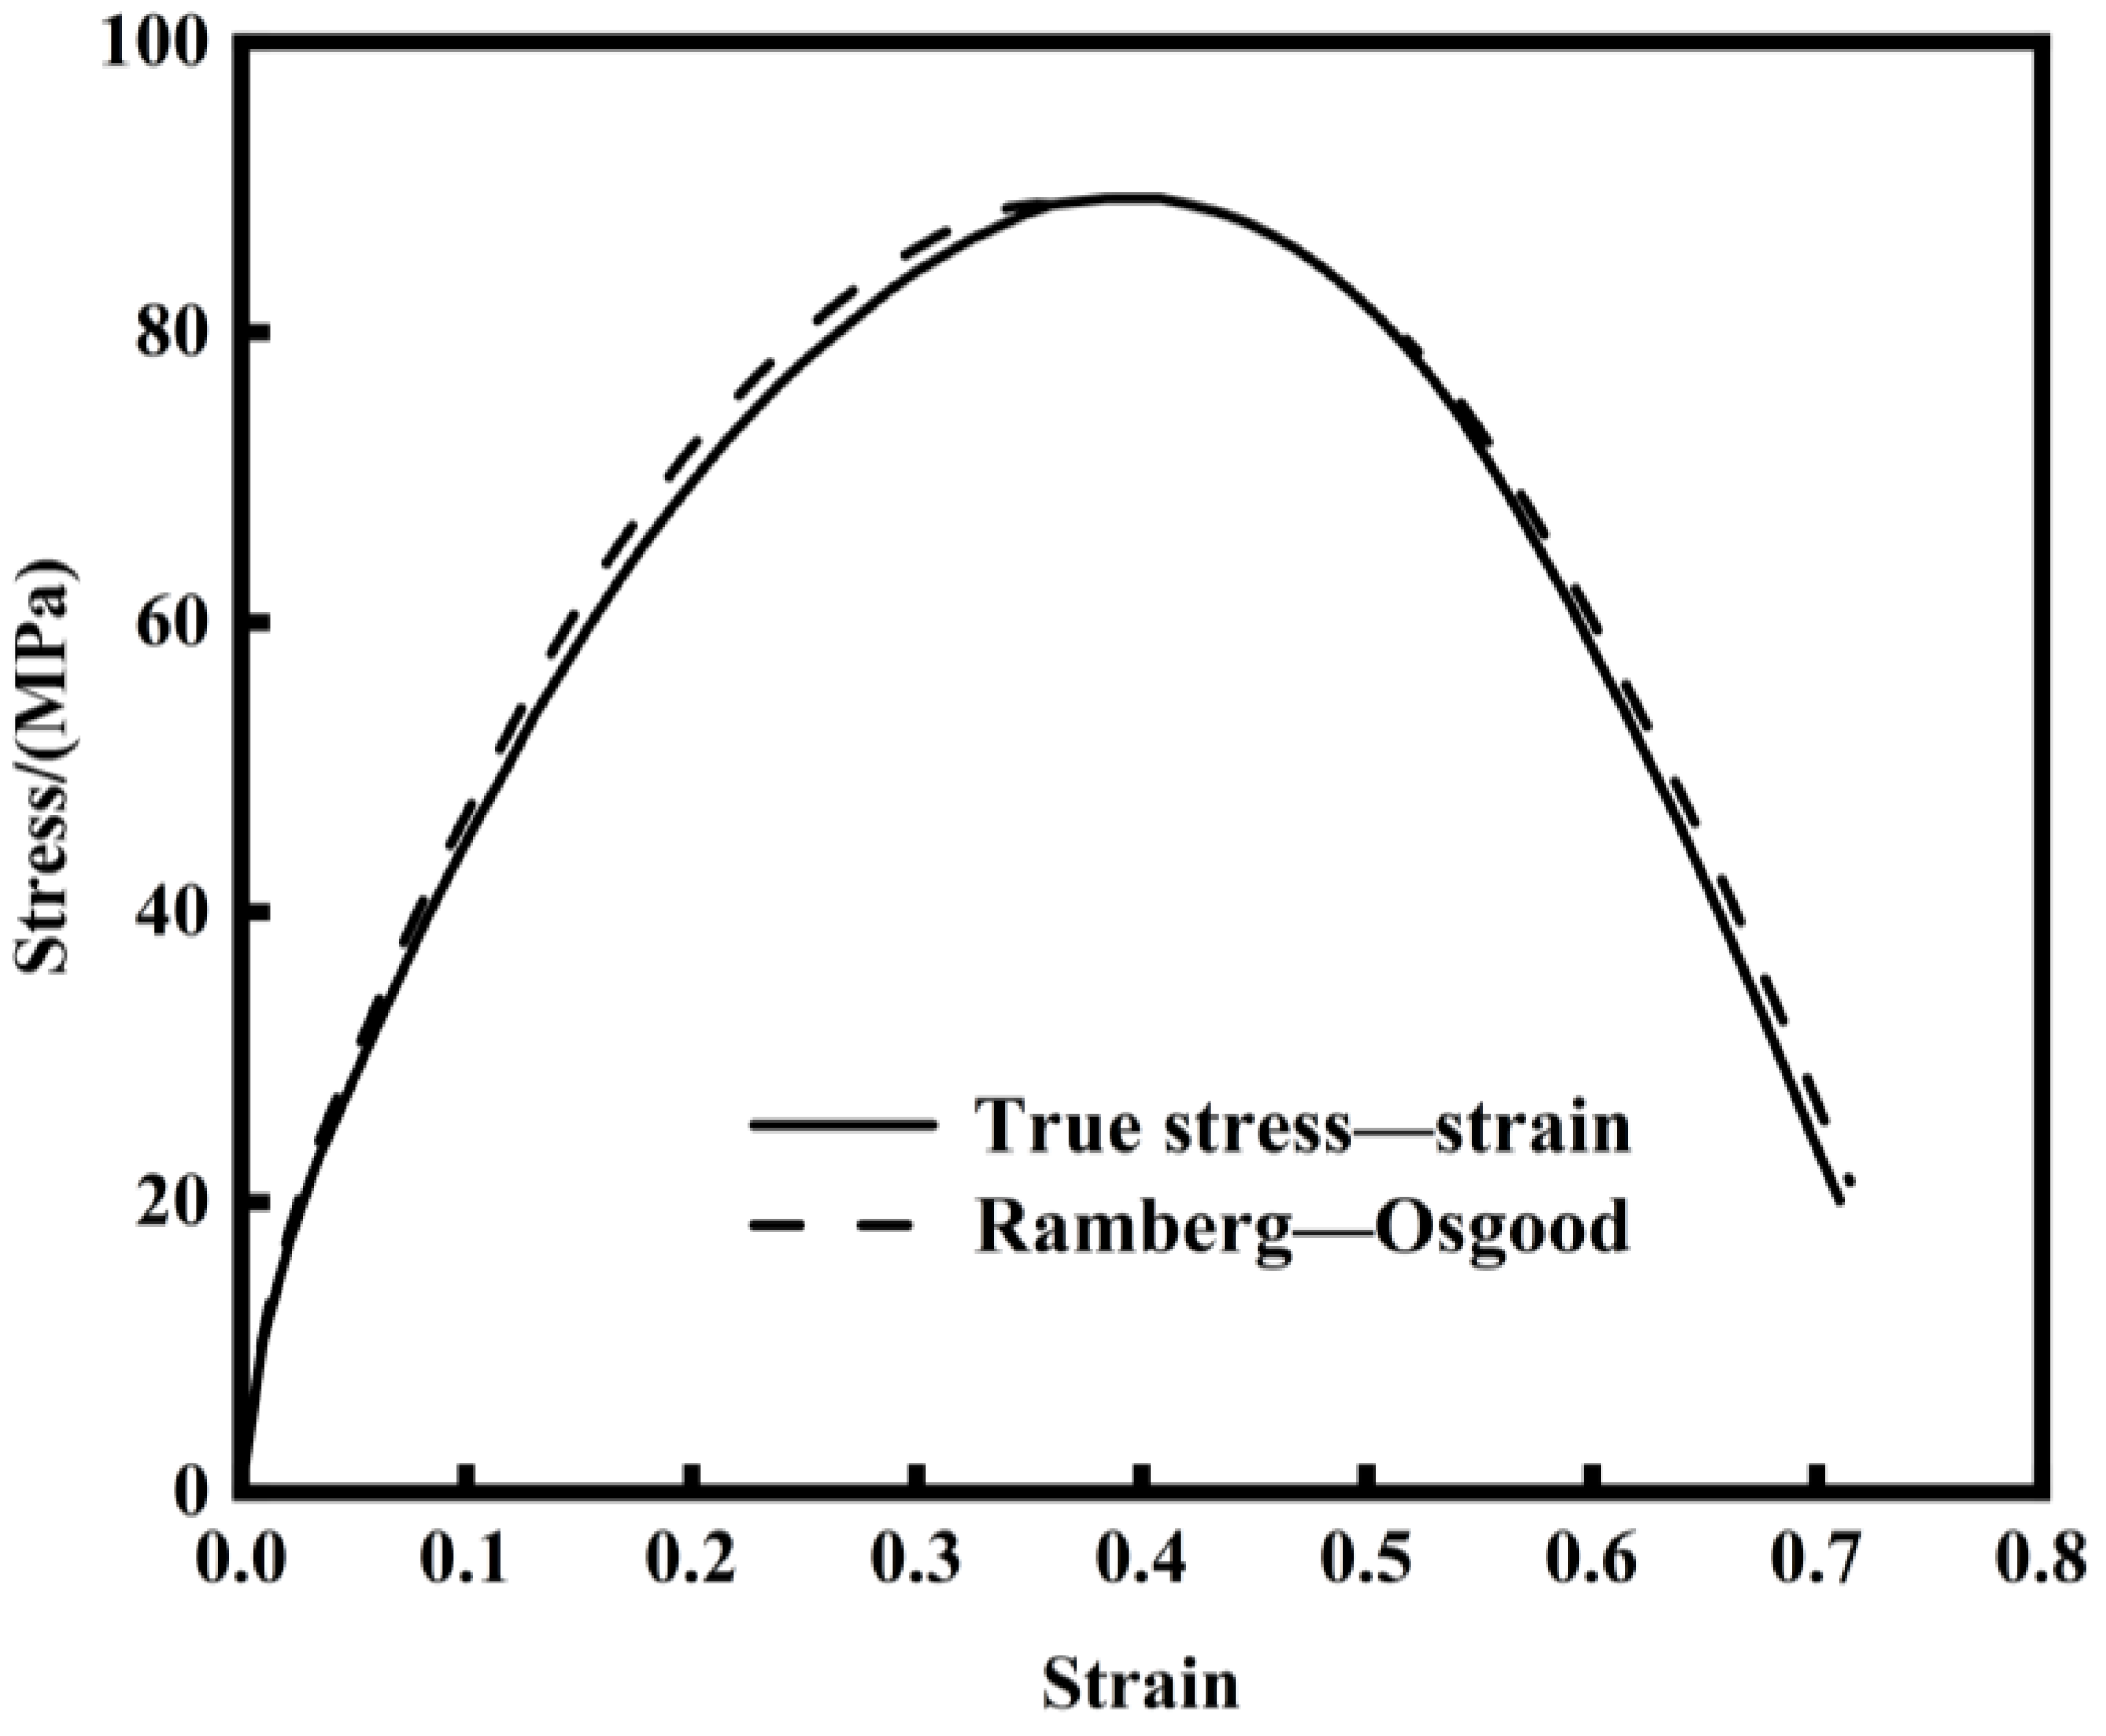
3.2. Material Parameters in the GTN Model

According to the formula of the GTN damage model, there are nine undetermined values in the model: f 0 , f n , f c , f F , q 1 ,   q 2 ,   q 3 , SN and ε N . Among them, q 1 , q 2 and q 3 serve as correlation coefficients for material properties, are primarily influenced by material yield and hardening, and are calibrated based on the stress–strain curve. SN and ε N reflect the inclusion and nucleation of voids in the material. The deviation between experiment and simulation can be used to calibrate GTN parameters. f 0 , f n , f c and f F are different stages of void evolution. Kiran and Khandelwal [27] proposed three methods to calibrate them, the third of which assumed that both the initial and nucleating voids were the cause of the damage. Therefore, the GTN model is corrected with the third hypothesis.

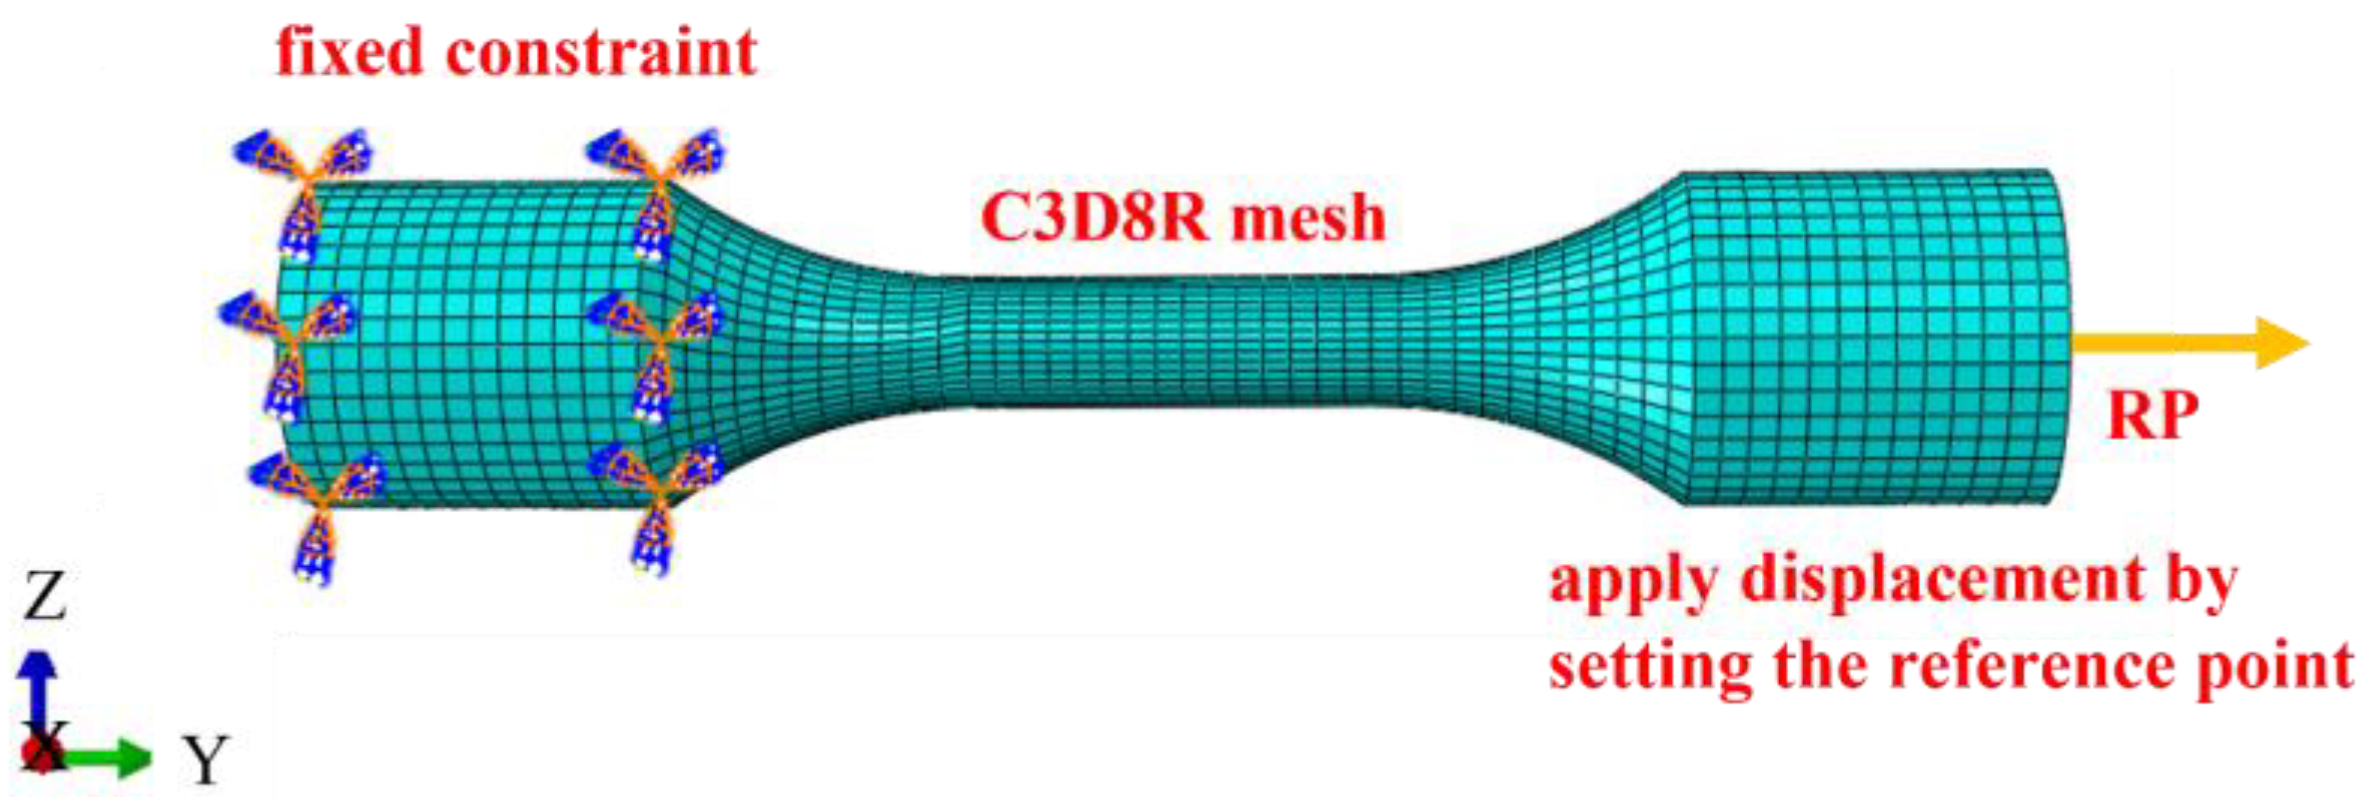
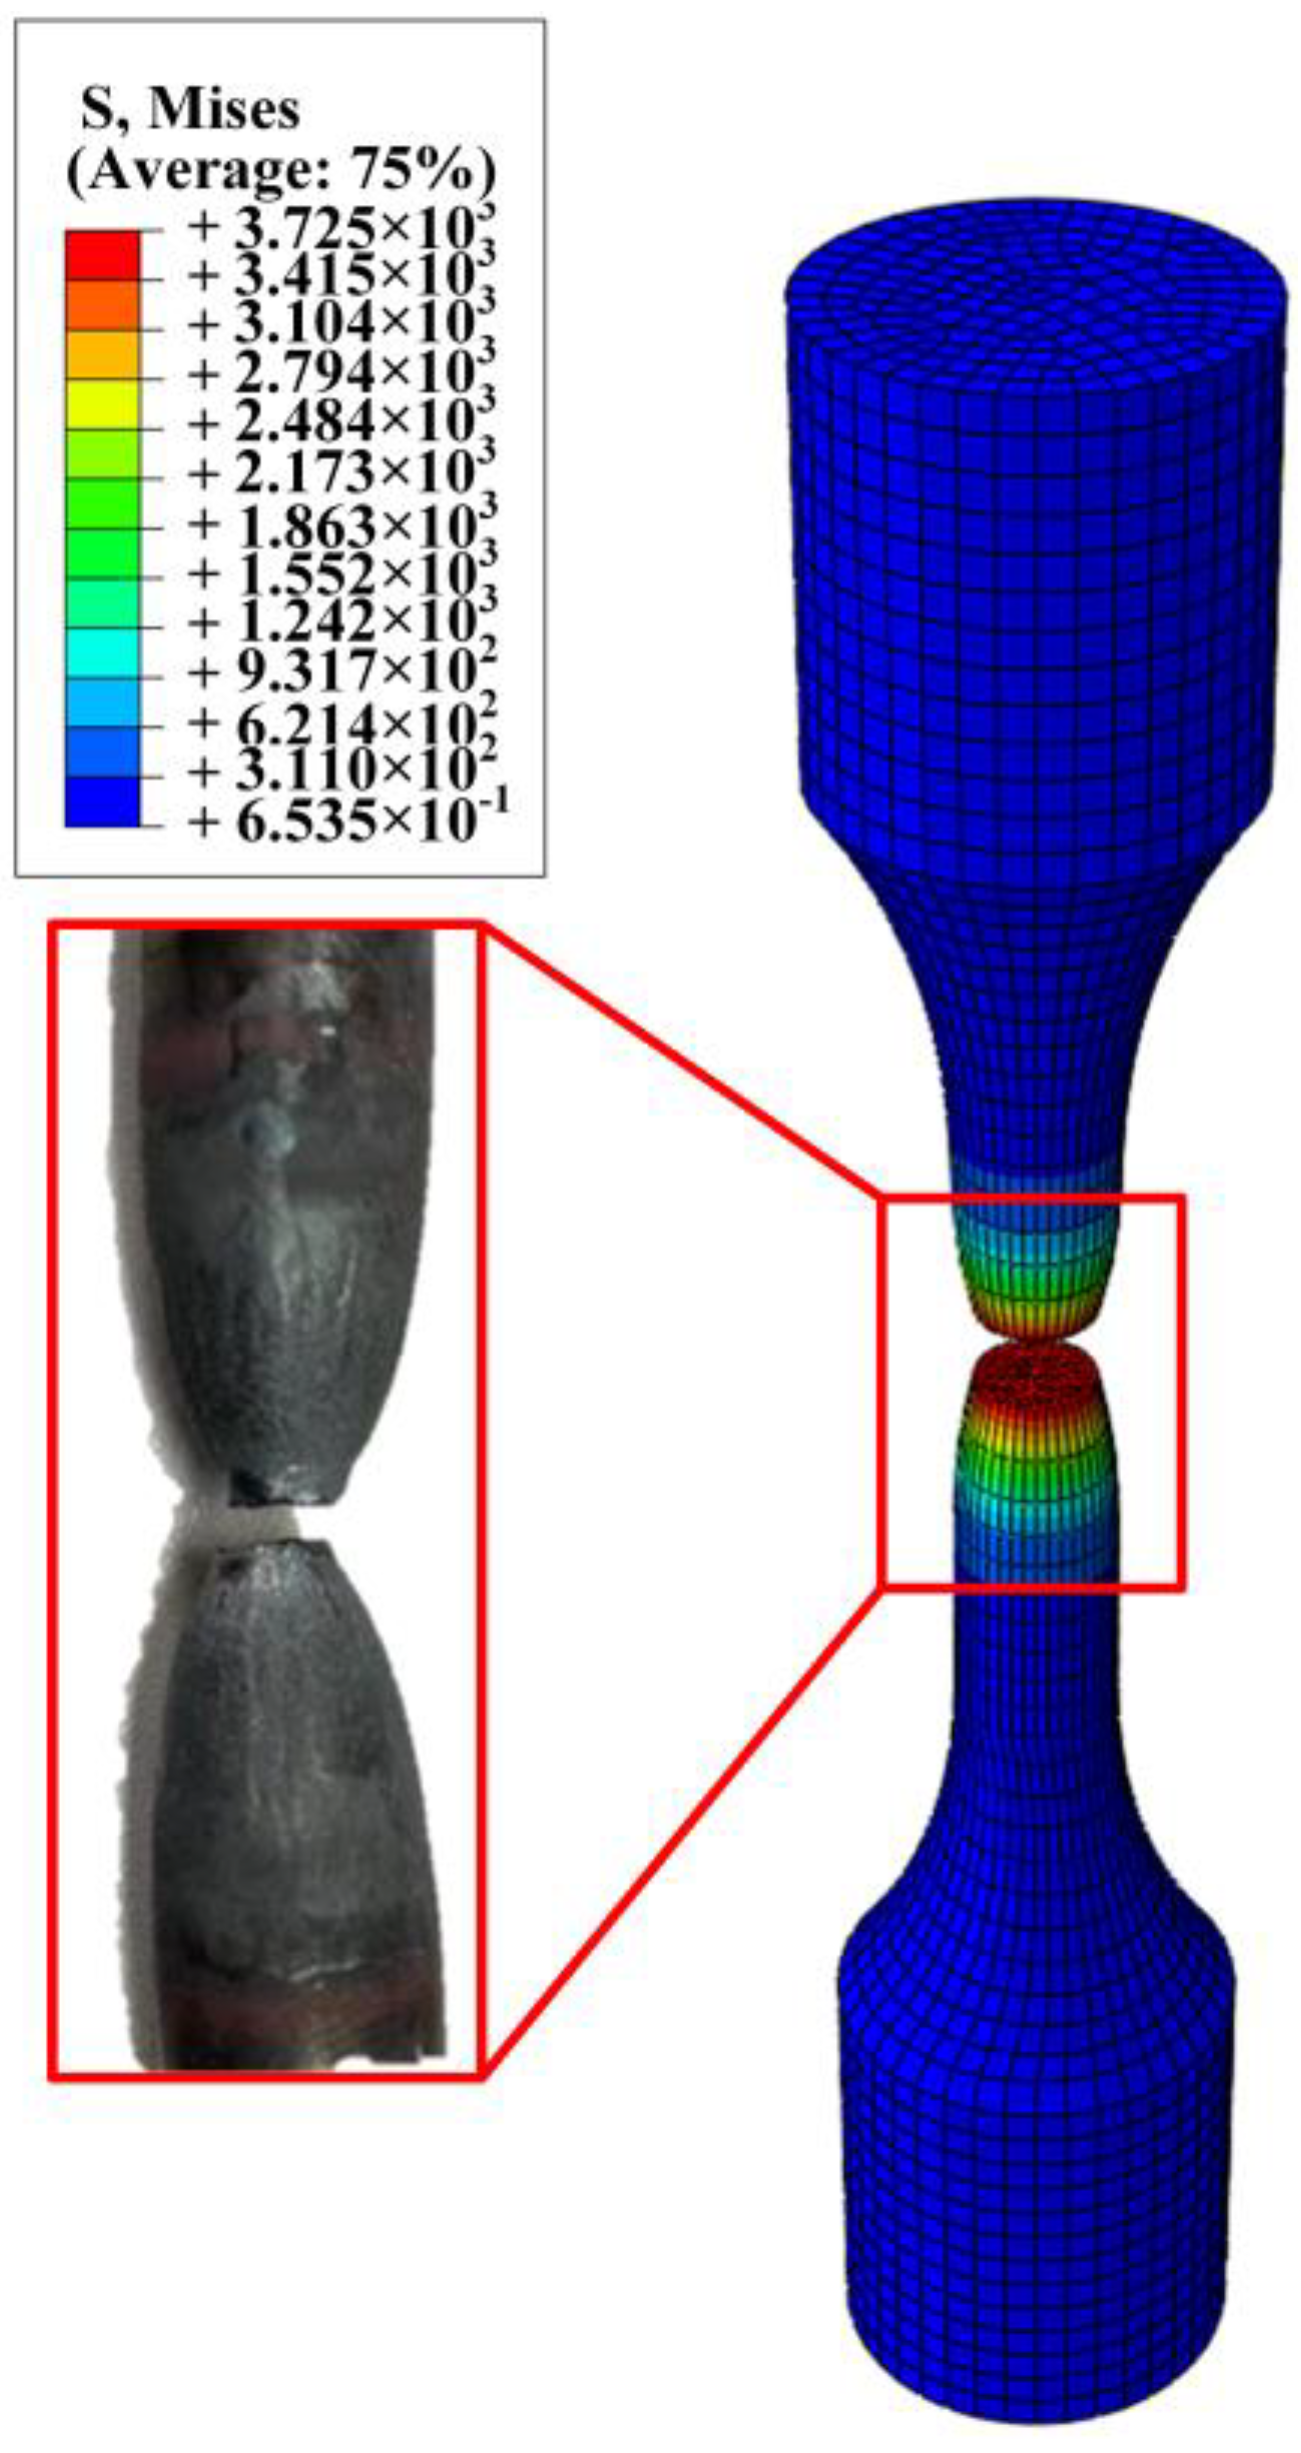
3.3. Establishment of Finite Element Model

Using ABAQUS 2016 software, a numerical model for unidirectional tensile testing was created based on the actual dimensions of the sample, as illustrated in Figure 3, to simulate the entire unidirectional tensile test procedure. The simulation is performed in an Abaqus/Explicit dynamic module, where large displacements and deformations are allowed, while damage effects can be taken into account. The AISI 1035 Steel Elastic Model Emperor E and Patson values are 212,000 and 0.3, respectively, and the density is 7.85 kg/m3. The model selected porous metal plasticity to analyze the damage evolution, set the lower end as a fixed constraint, and applied displacement by setting a reference point above. Based on the GTN model, the high temperature tensile of AISI 1035 steel was simulated.

3.4. Calibration of q 1 , q 2 and q 3

Figure 4 depicts the actual stress–strain curve of AISI 1035 steel under varying temperatures and strain rates. During the elastic stage, the stress distribution within the material is fairly even, with no noticeable nucleation occurring. With the increase in stress, plastic deformation begins to appear in the material, and the local stress concentration area may trigger the nucleation of a hole. When the material enters the necking stage, the local stress concentration intensifies, and the holes grow rapidly and polymerize, eventually leading to the fracture of the material. At this moment, the stress value on the stress–strain curve gradually diminishes, while the strain value keeps on rising.
After the correction coefficients q 1 , q 2 and q 3 were introduced, Faleskog [28] connected the correction coefficients with the ratio of the yield stress to elastic modulus, σ y /E, and hardening index, as shown in Table 2 and Formula (7).
ε = σ E + α ( σ E ) n
The Ramberg–Osgood hardening model was employed to fit the tensile stress–strain curve, as shown in Figure 5. The resulting parameters α and n are listed in Table 2. Referring to Table 3 and Faleskog’s research, q 1 = 1.78, q 2 = 0.833, q 3 = q 1 2 = 3.17 is adopted for the GTN model of AISI 1035 steel.

3.5. Calibration of ε n and S N

In the GTN model, ε n and S N determine the rate of void nucleation. Yin Y and Li [29]s’ research shows that ε n represents the plastic strain level at the beginning of the cracking macro damage. Therefore, the strain value at the departure of the finite element load–displacement curve from the experiment is used as the approximate value of ε n .
Peeq (plastic equivalent strain), which is an important index of the material in the plastic stage, is used to analyze the deformation behavior of the material. The void nucleation strain ε n of AISI 1035 steel is 0.115, 0.177 and 0.141, respectively, as shown in Figure 6a–c. Therefore, the average ε n = 0.144 of the GTN model of AISI 1035 steel is determined. The solution of   S N is generally based on empirical methods, so according to previous experience,   S N is 0.1 [30].

3.6. Calibration of f 0 ,   f n ,   f c and f F

The necking zone of the sample after tensile fracture is divided into four regions, which are the basis for calibration of the four parameters f 0 ,   f n ,   f c and f F , as shown in Figure 7. Zone I is the undeformed zone, zone II is the uniform deformation zone, zone III is the adjacent fracture zone, and zone IV is the final failure zone. Figure 8a shows the material containing the initial void in the undeformed region of zone I. Image Pro Plus software was used to calculate the void proportion. The calculated f 0 = 0.0053.
Second-phase particles within the matrix are essential for void nucleation. The calibration of f n depends on the ratio of these particles in zone II. The composition of the precipitated phase of AISI 1035 steel was analyzed by energy dispersive spectrometer. Figure 9 shows the analysis region and energy spectrum results.
The main elements of AISI 1035 steel are Fe, Si and Mn. According to the energy spectrum results of Figure 9, it is observed that second-phase particles like S and P are present, meeting the conditions necessary for void nucleation. Image Pro Plus software was used to identify the second-phase precipitates, as shown in Figure 8b, and the proportion of particles in the second phase was 0.027, that is f n = 0.027.
The voids coalesce before the final fracture [31]. The void proportion was calculated in region III as the value of critical void volume fraction f c , as shown in Figure 8c, f c = 0.071. The calculation of fracture void volume fraction f F is based on zone IV, as shown in Figure 8d, and the void proportion was 0.085.

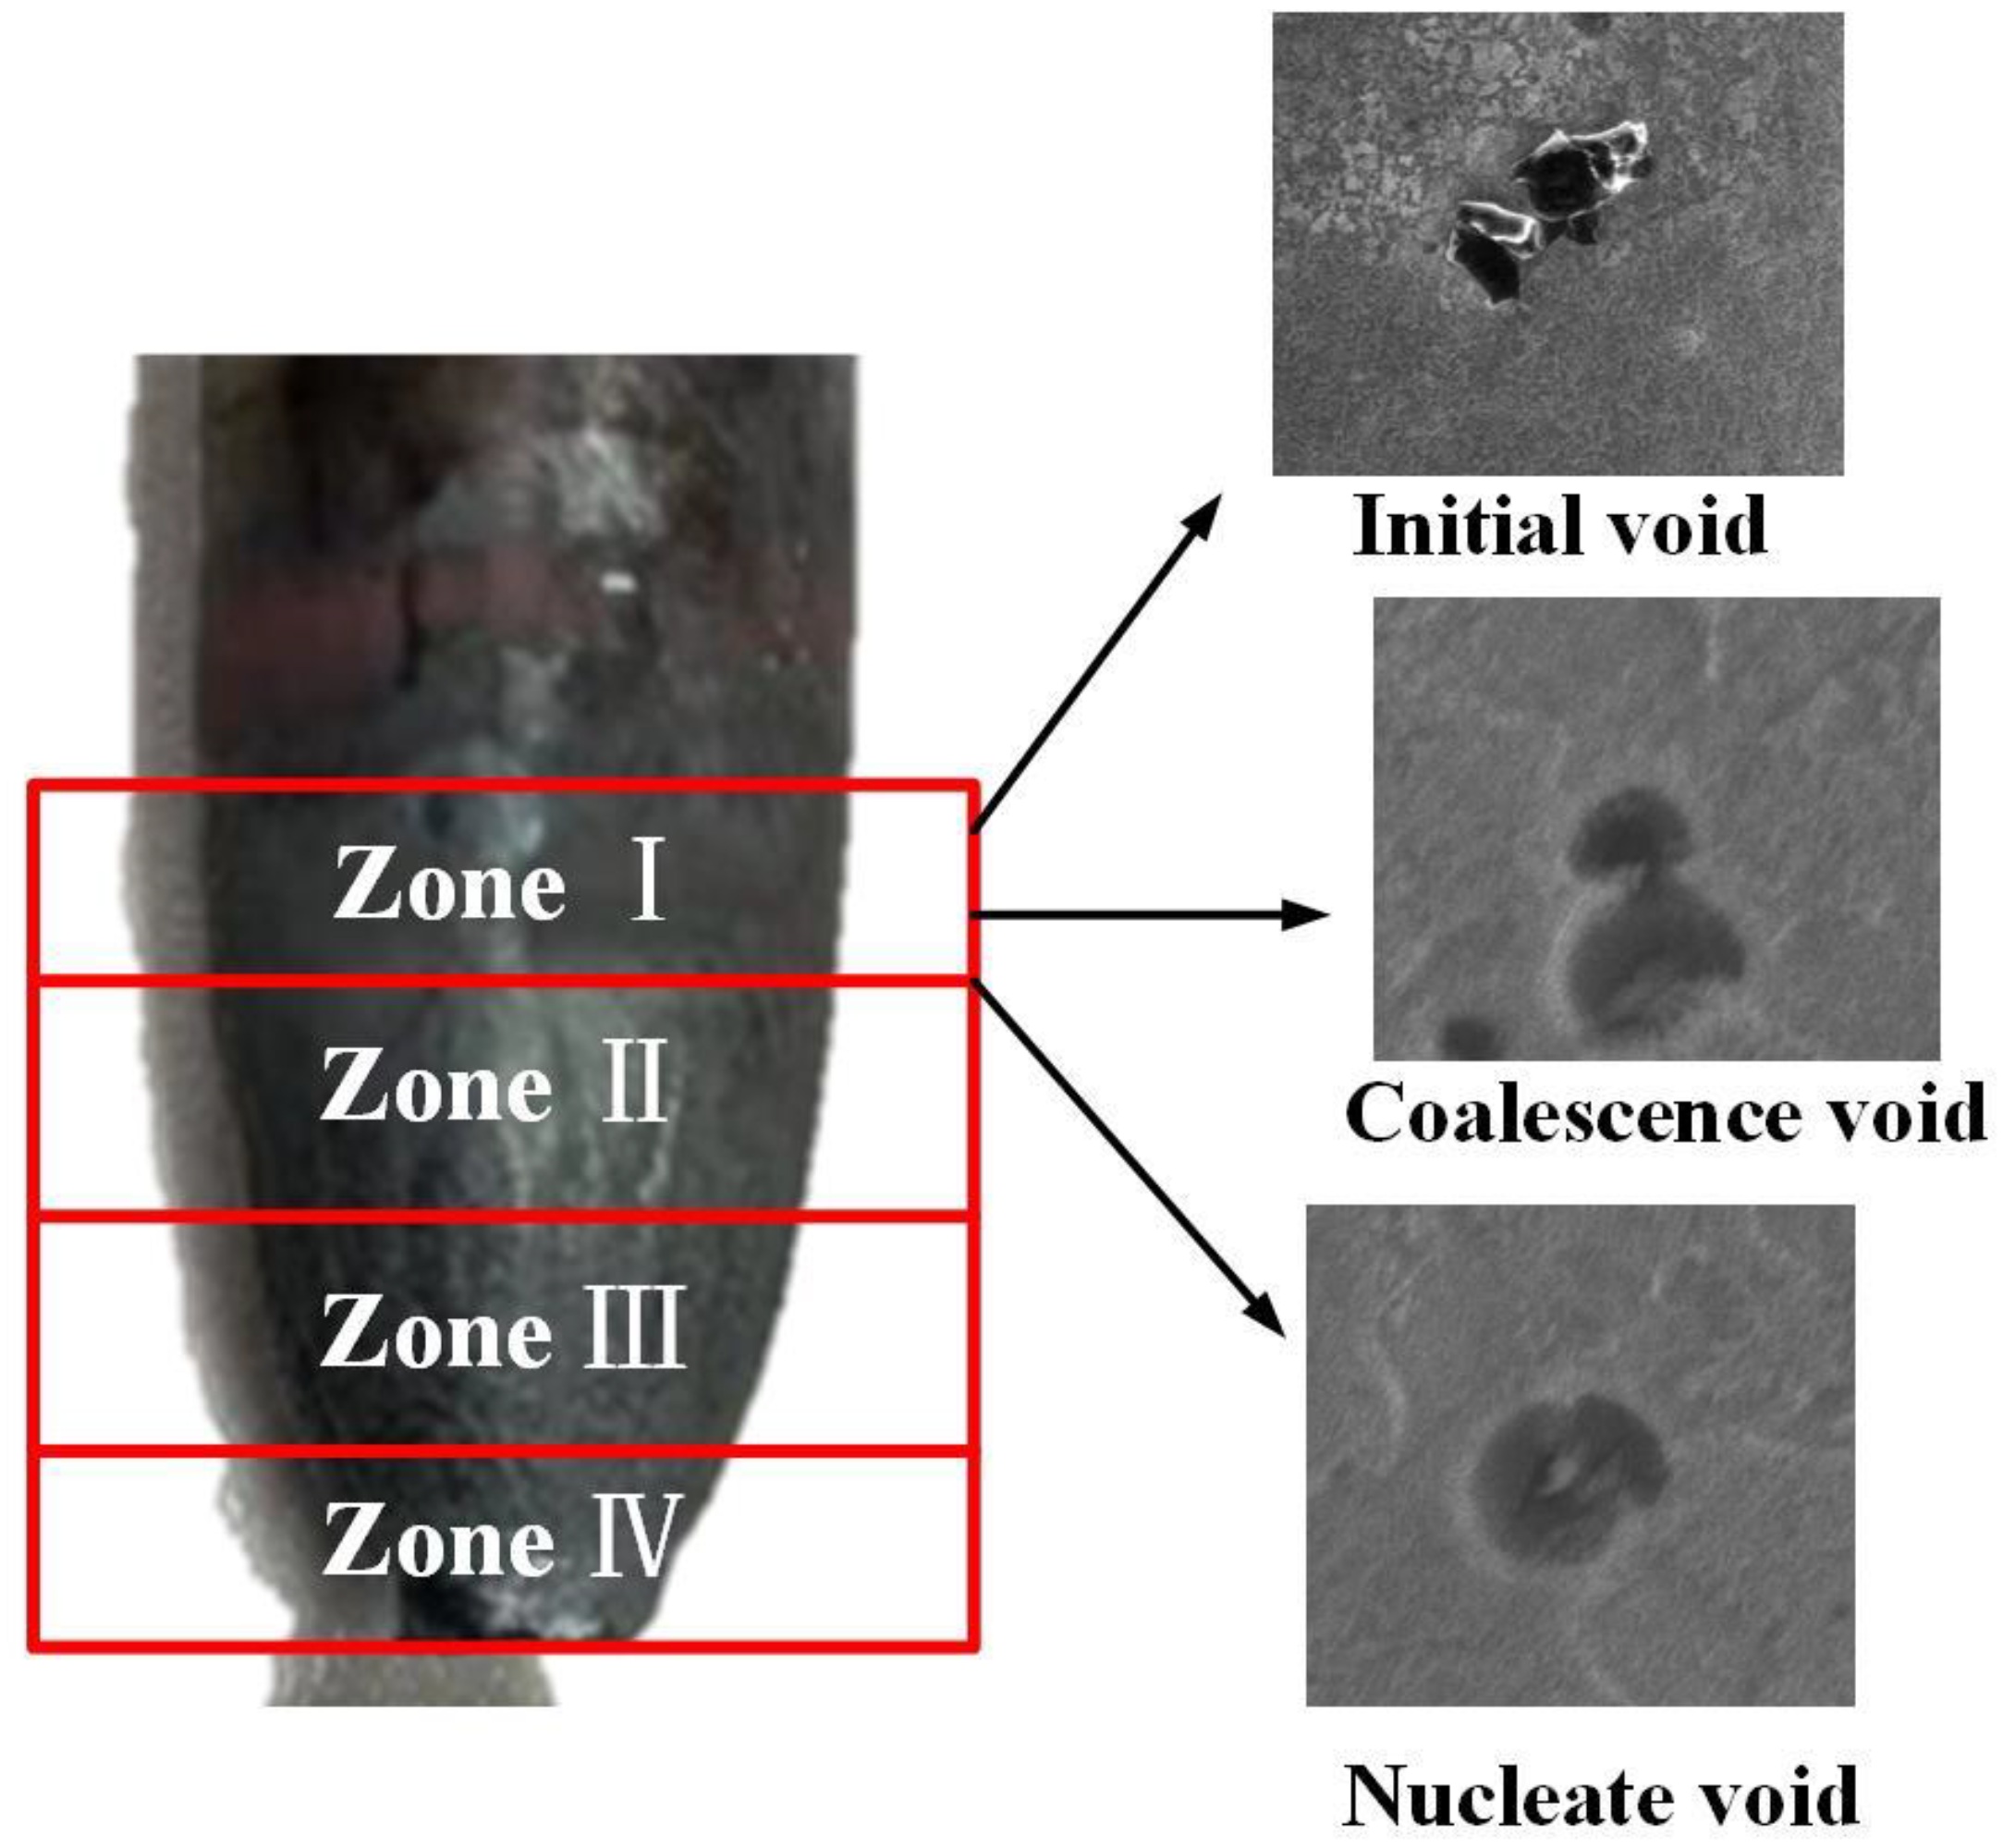
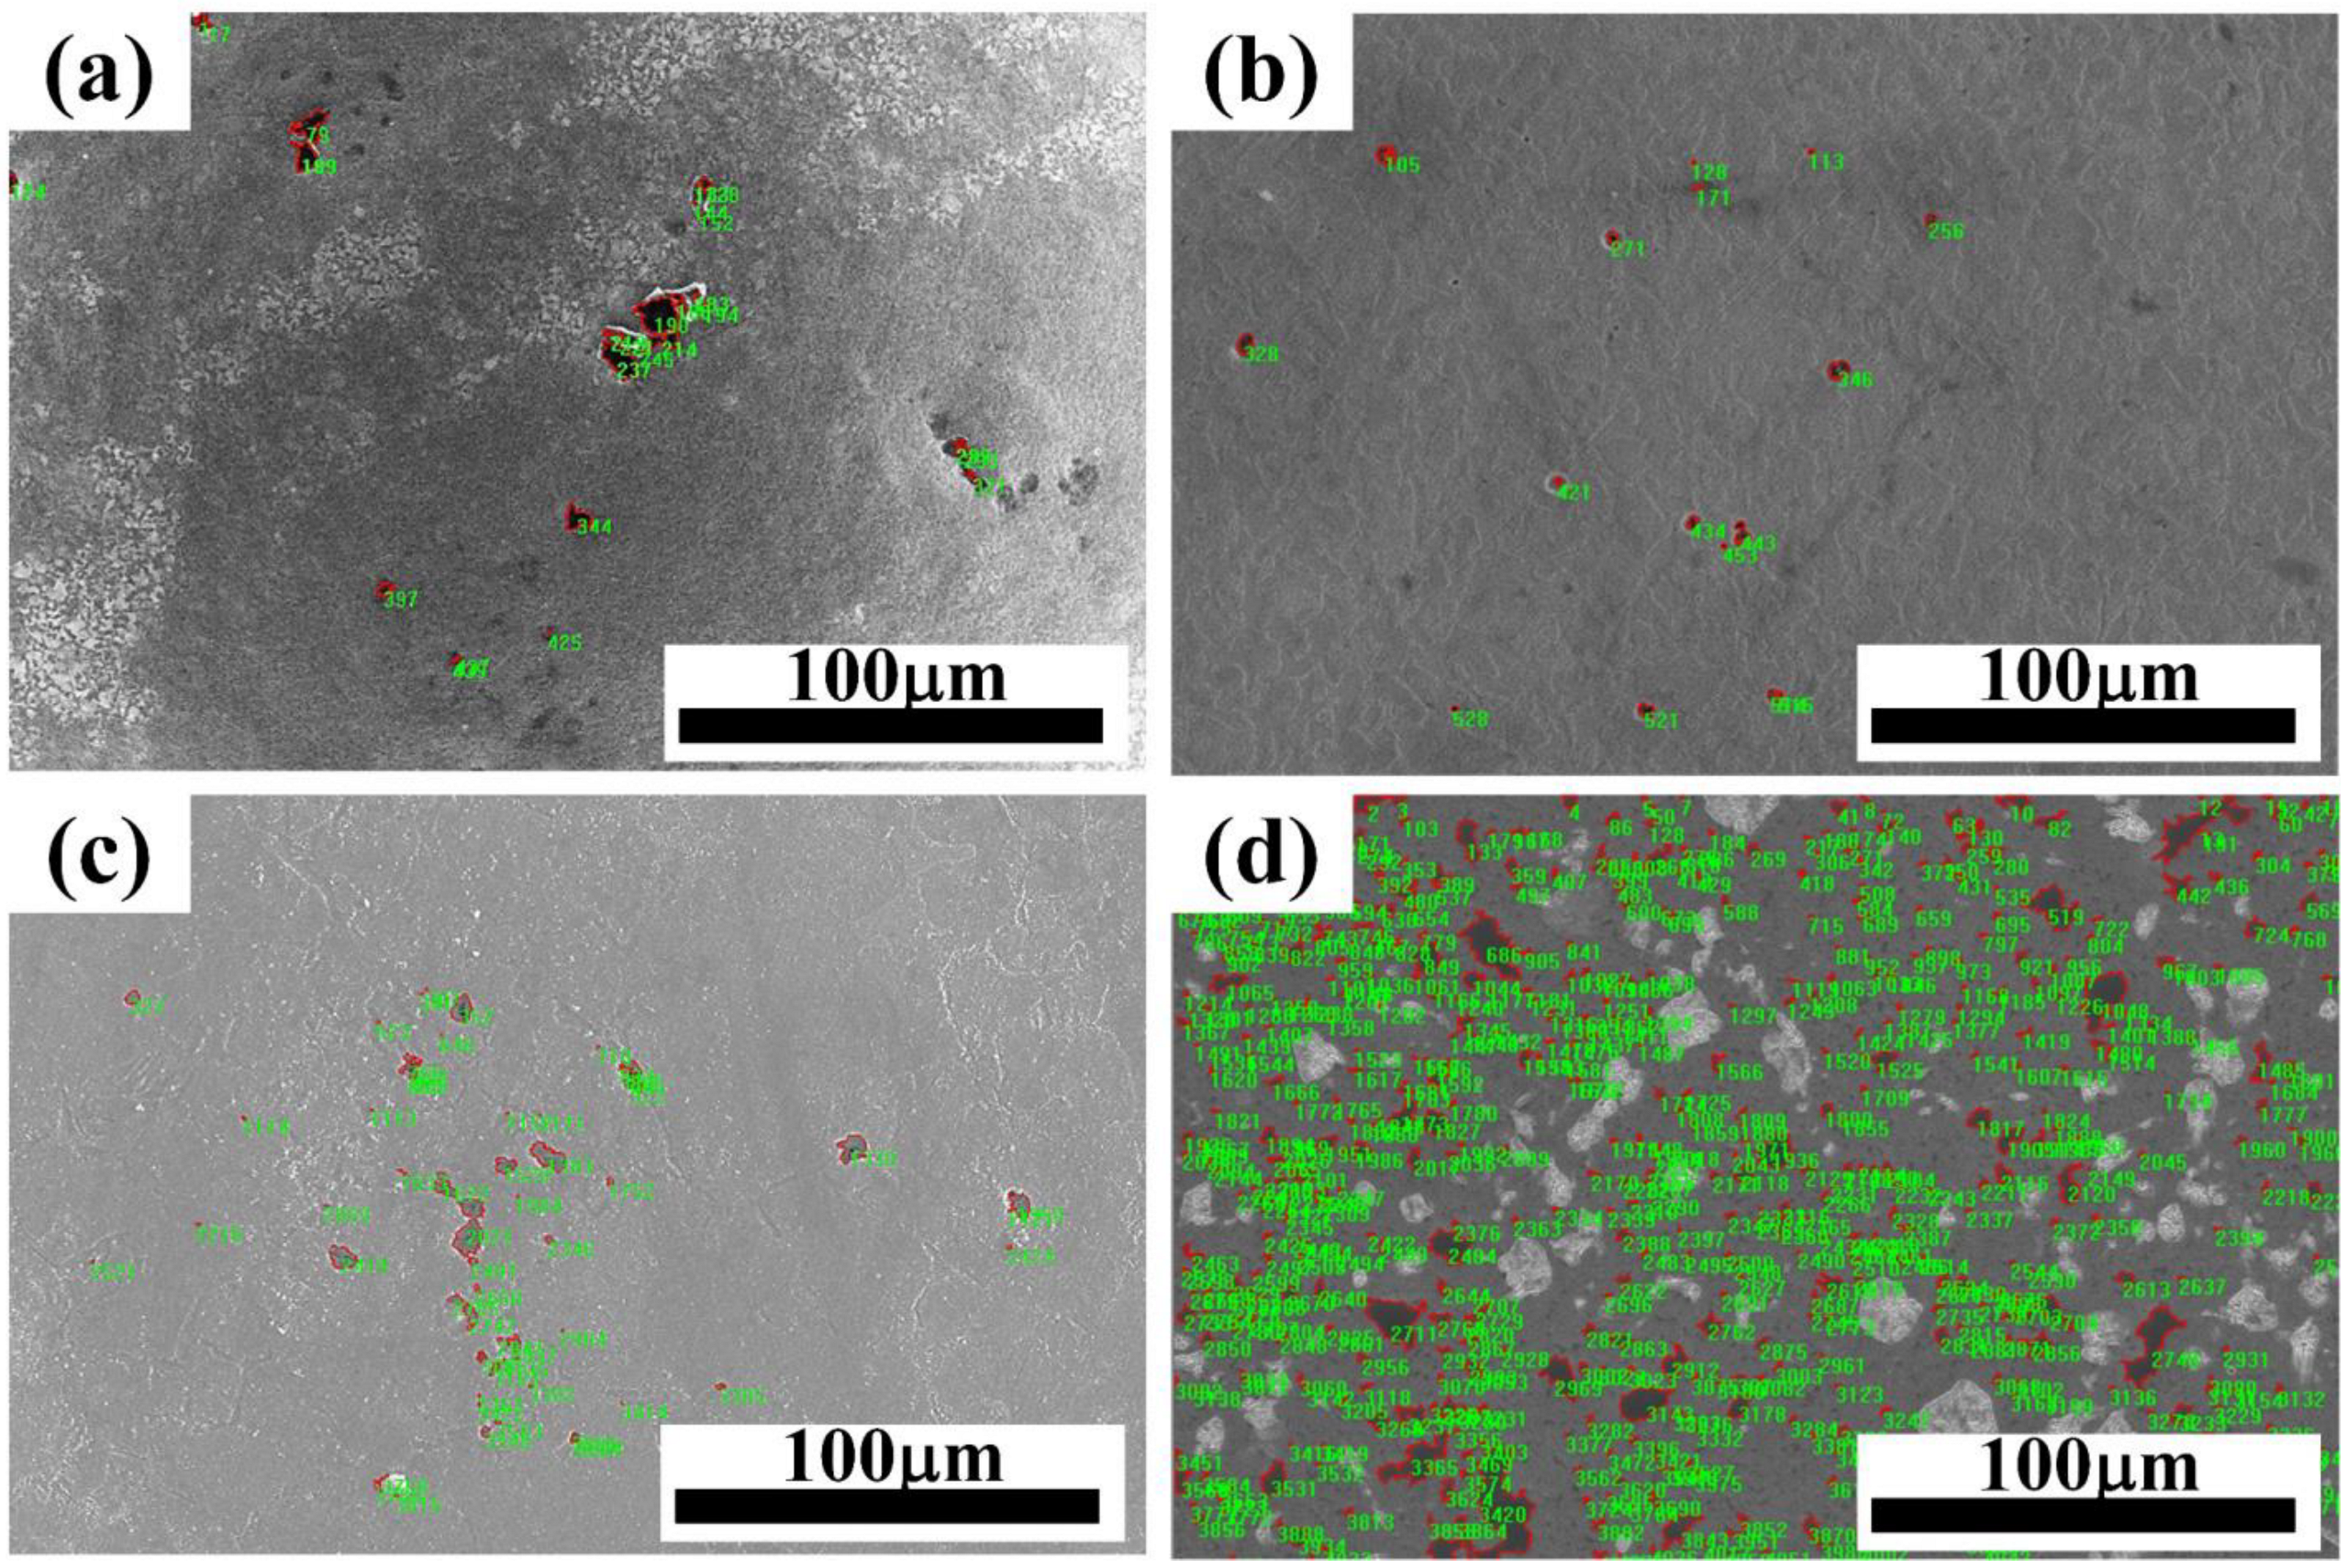
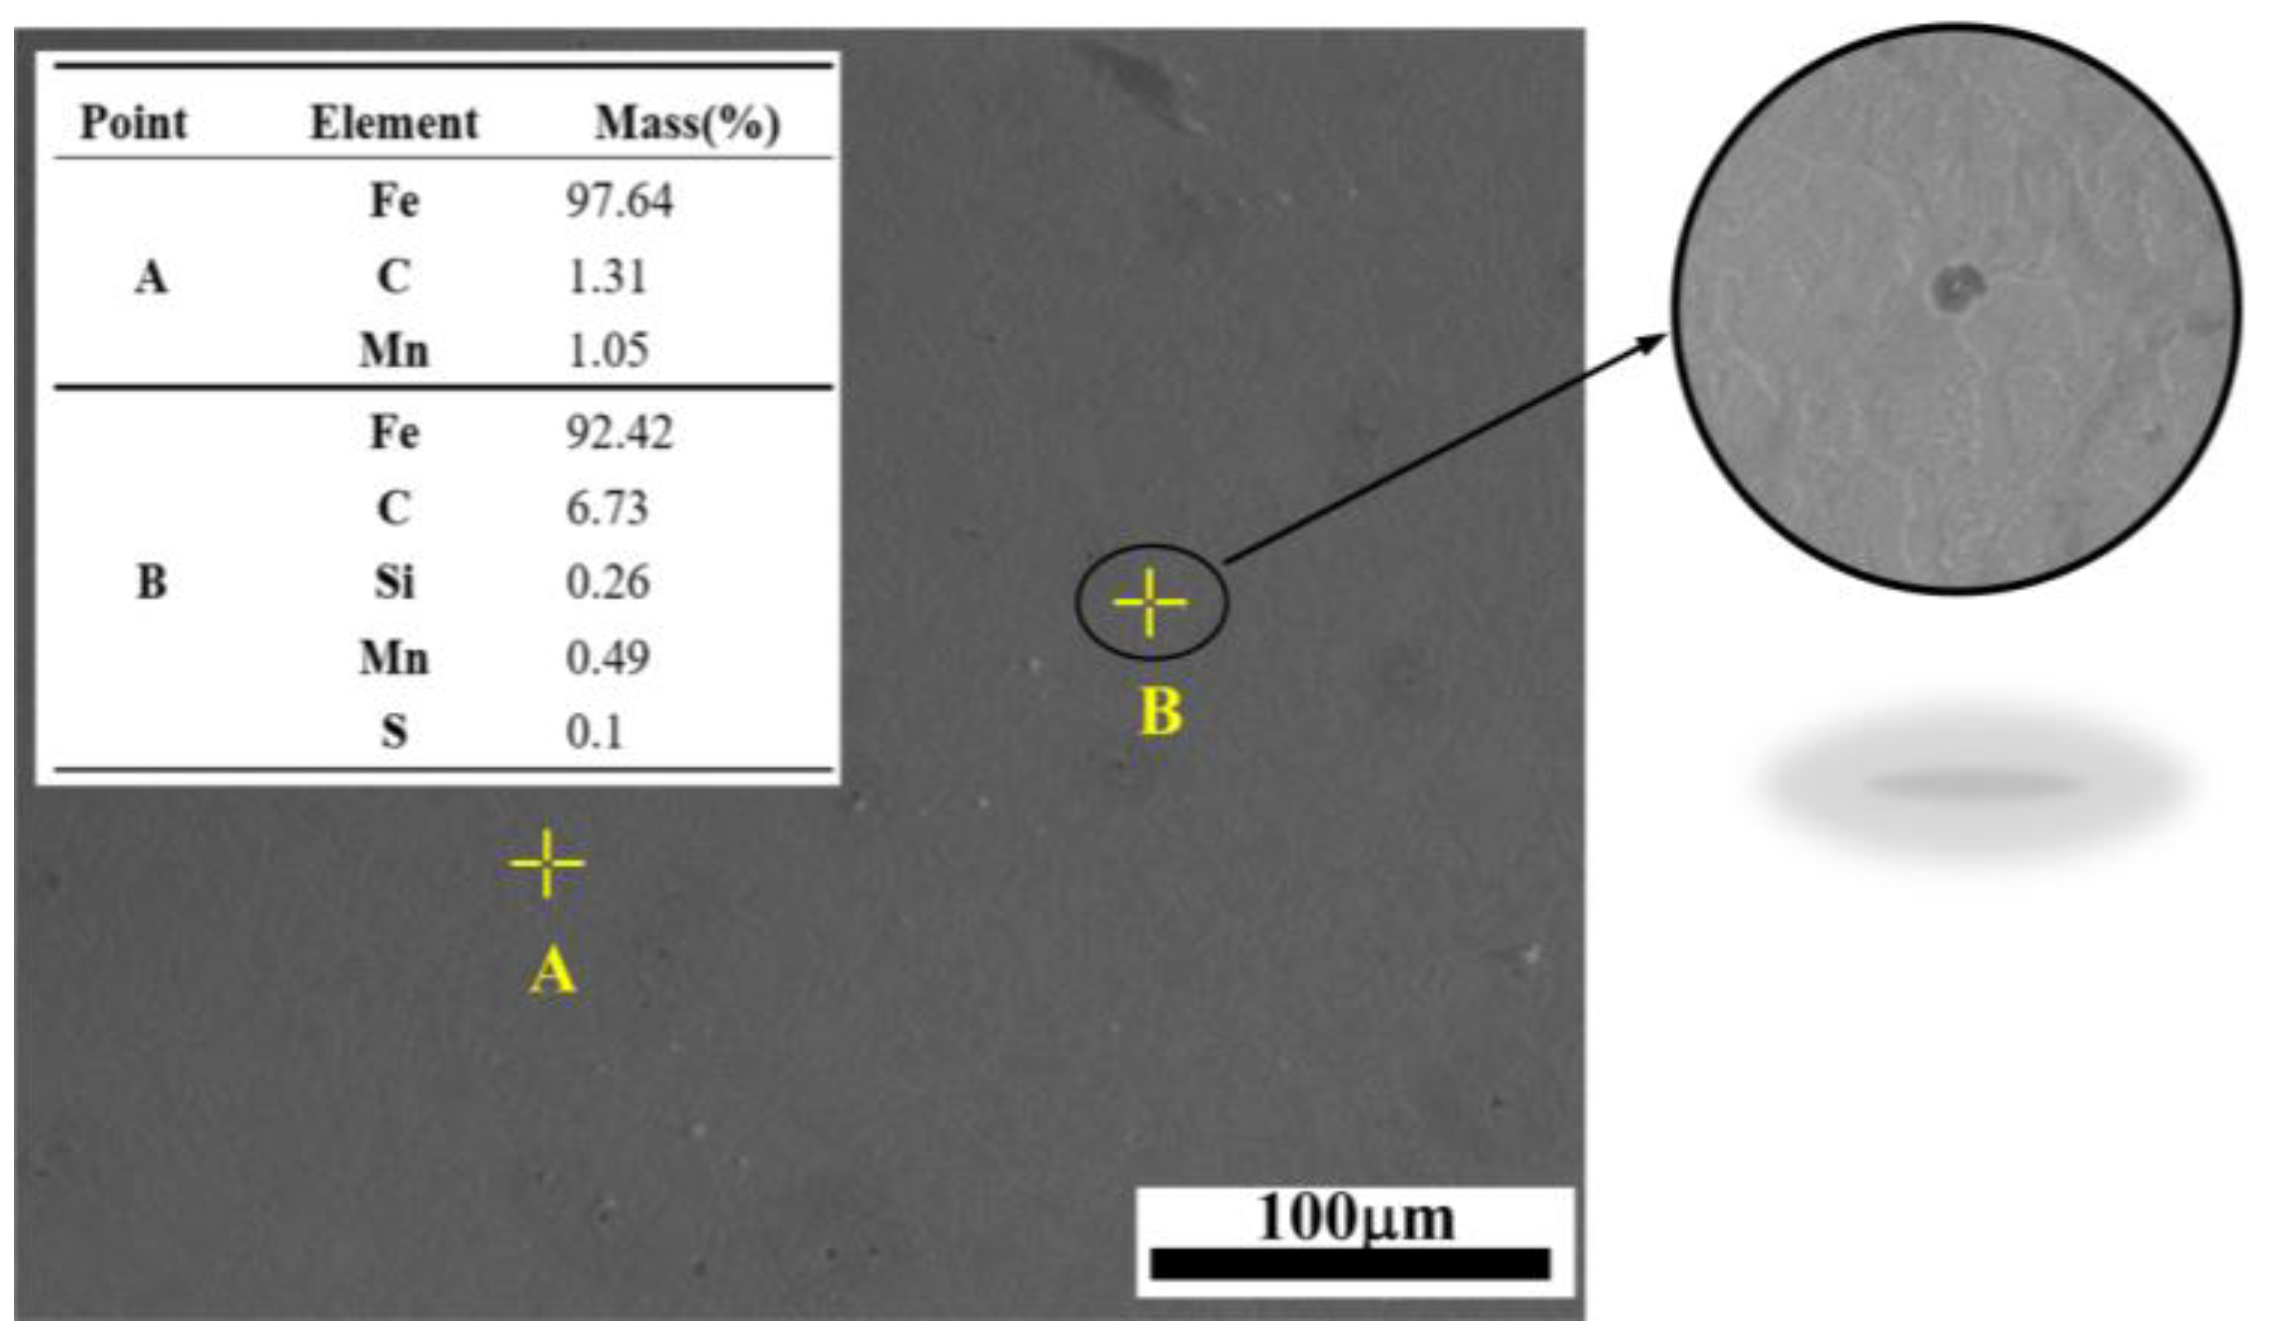
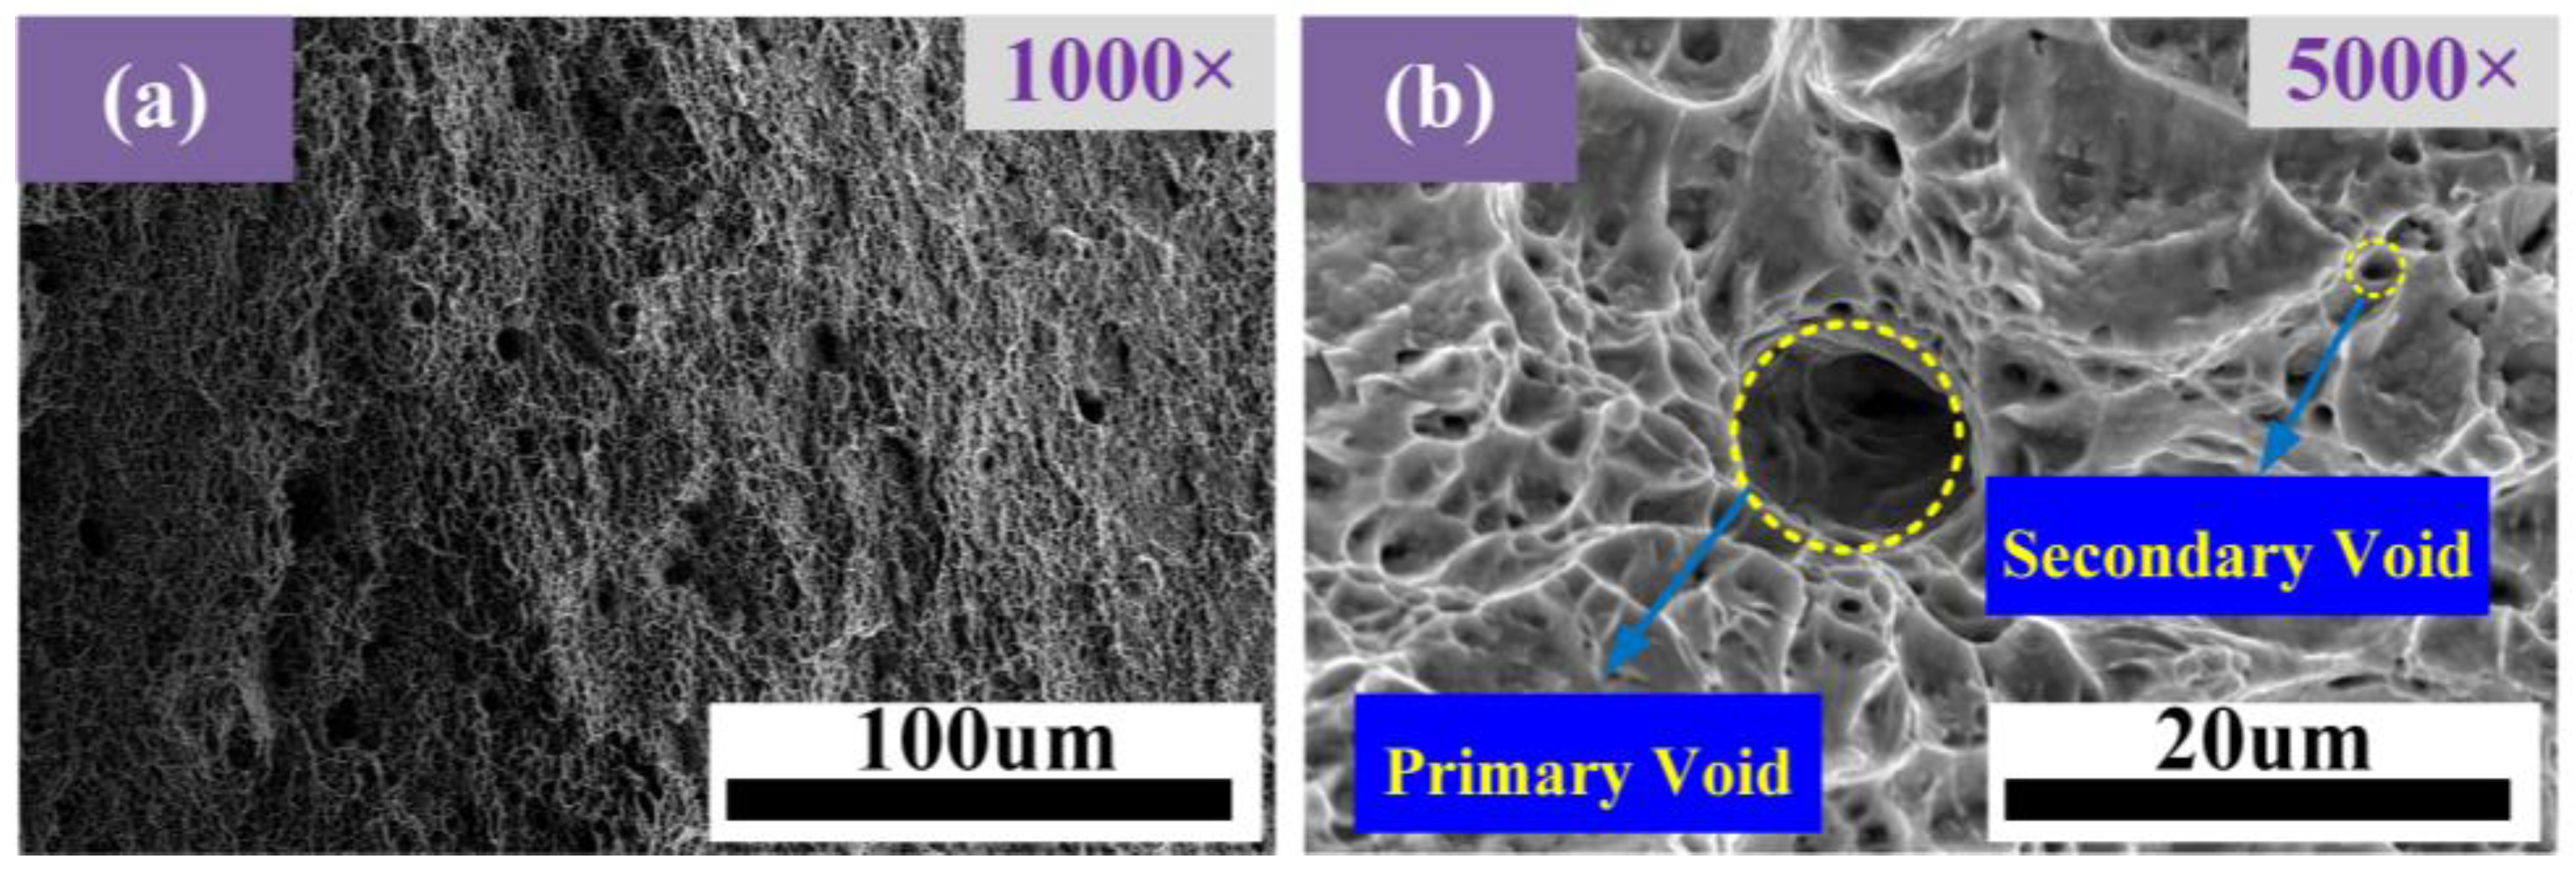
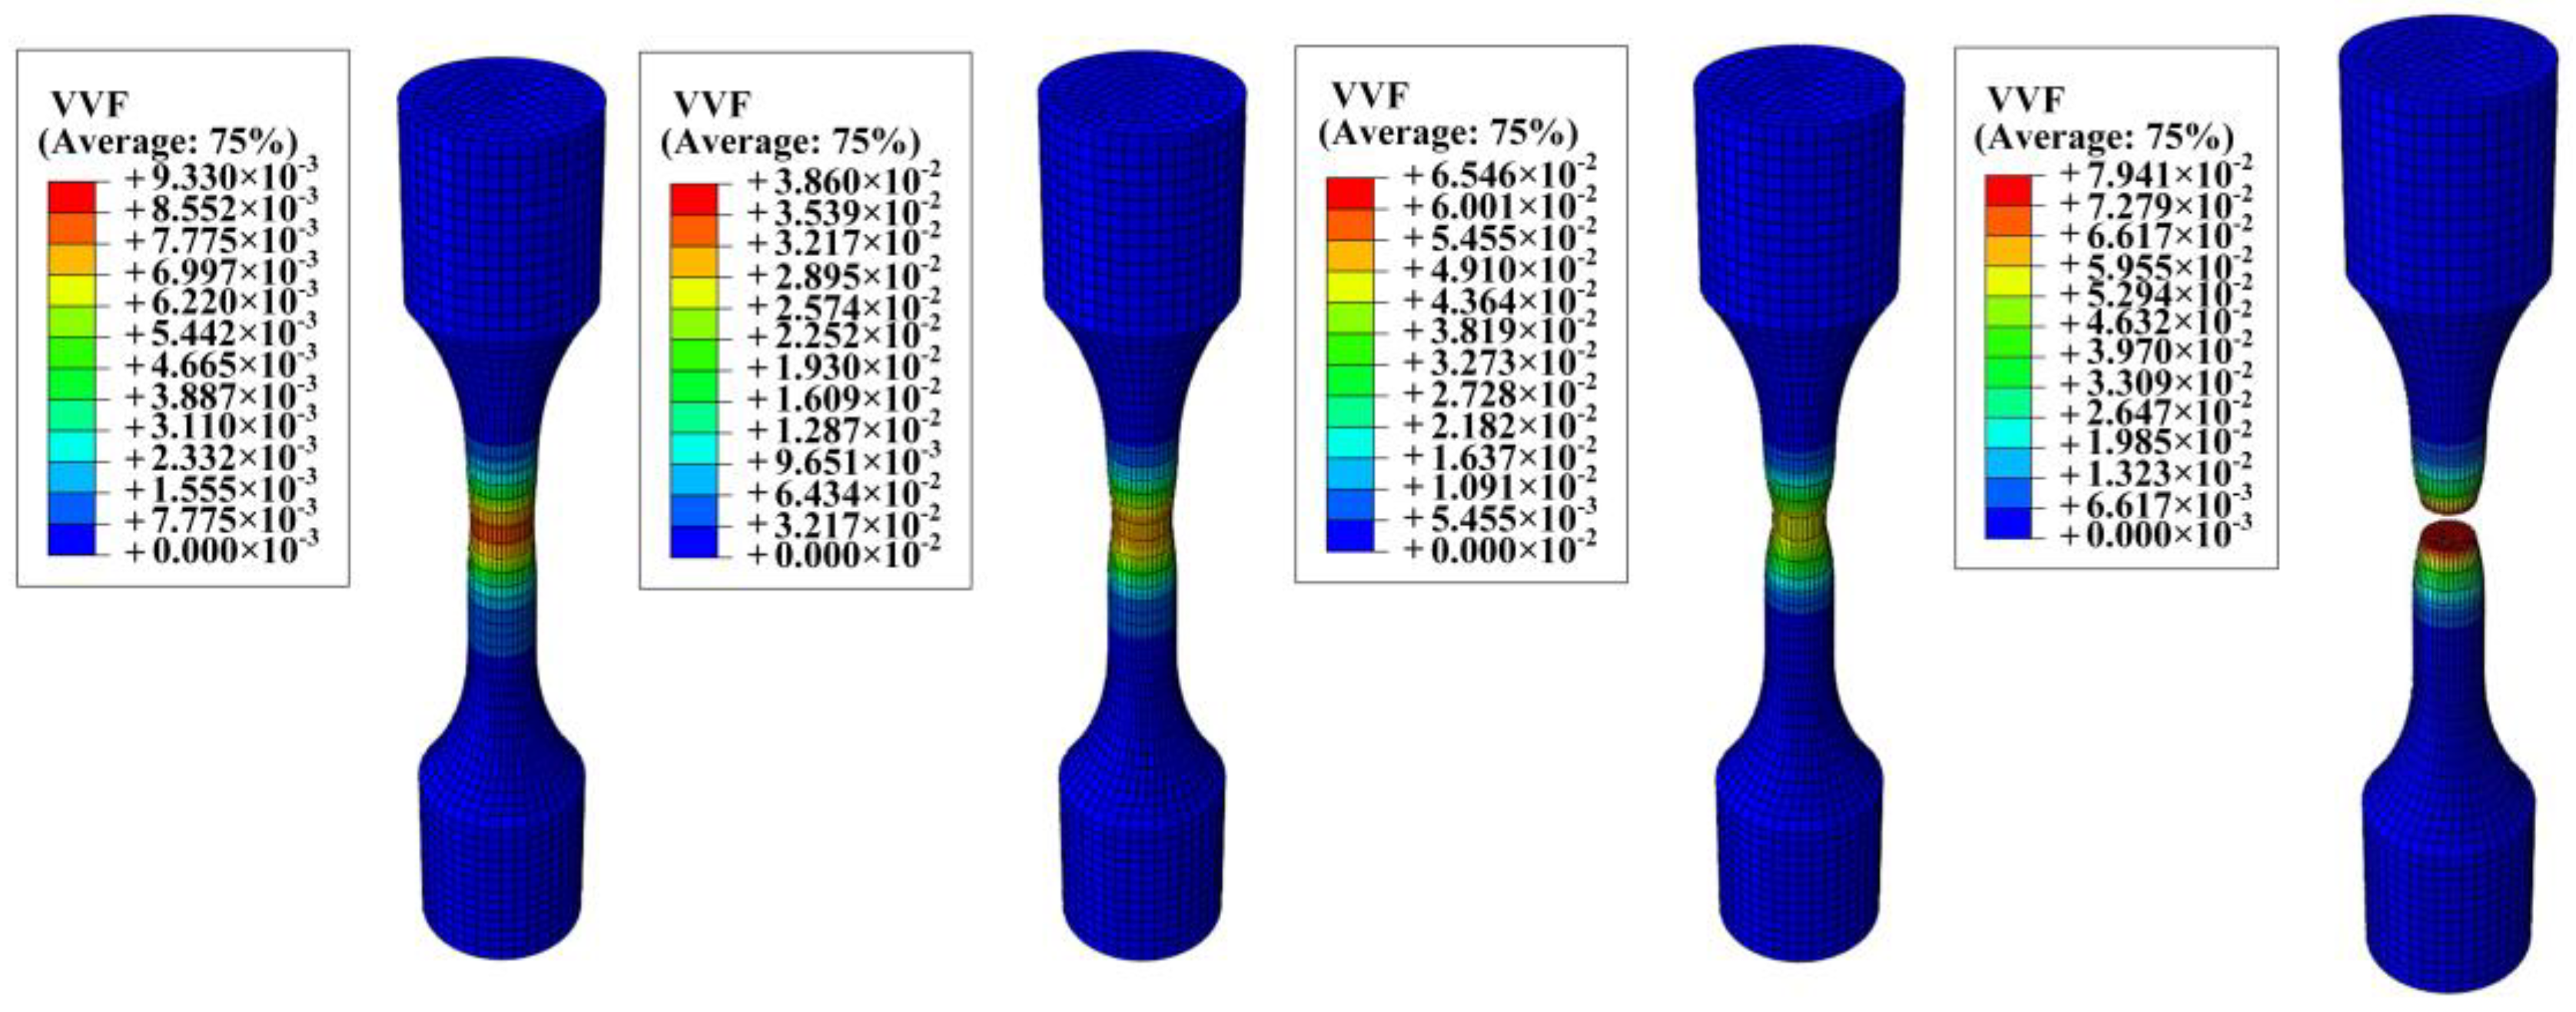
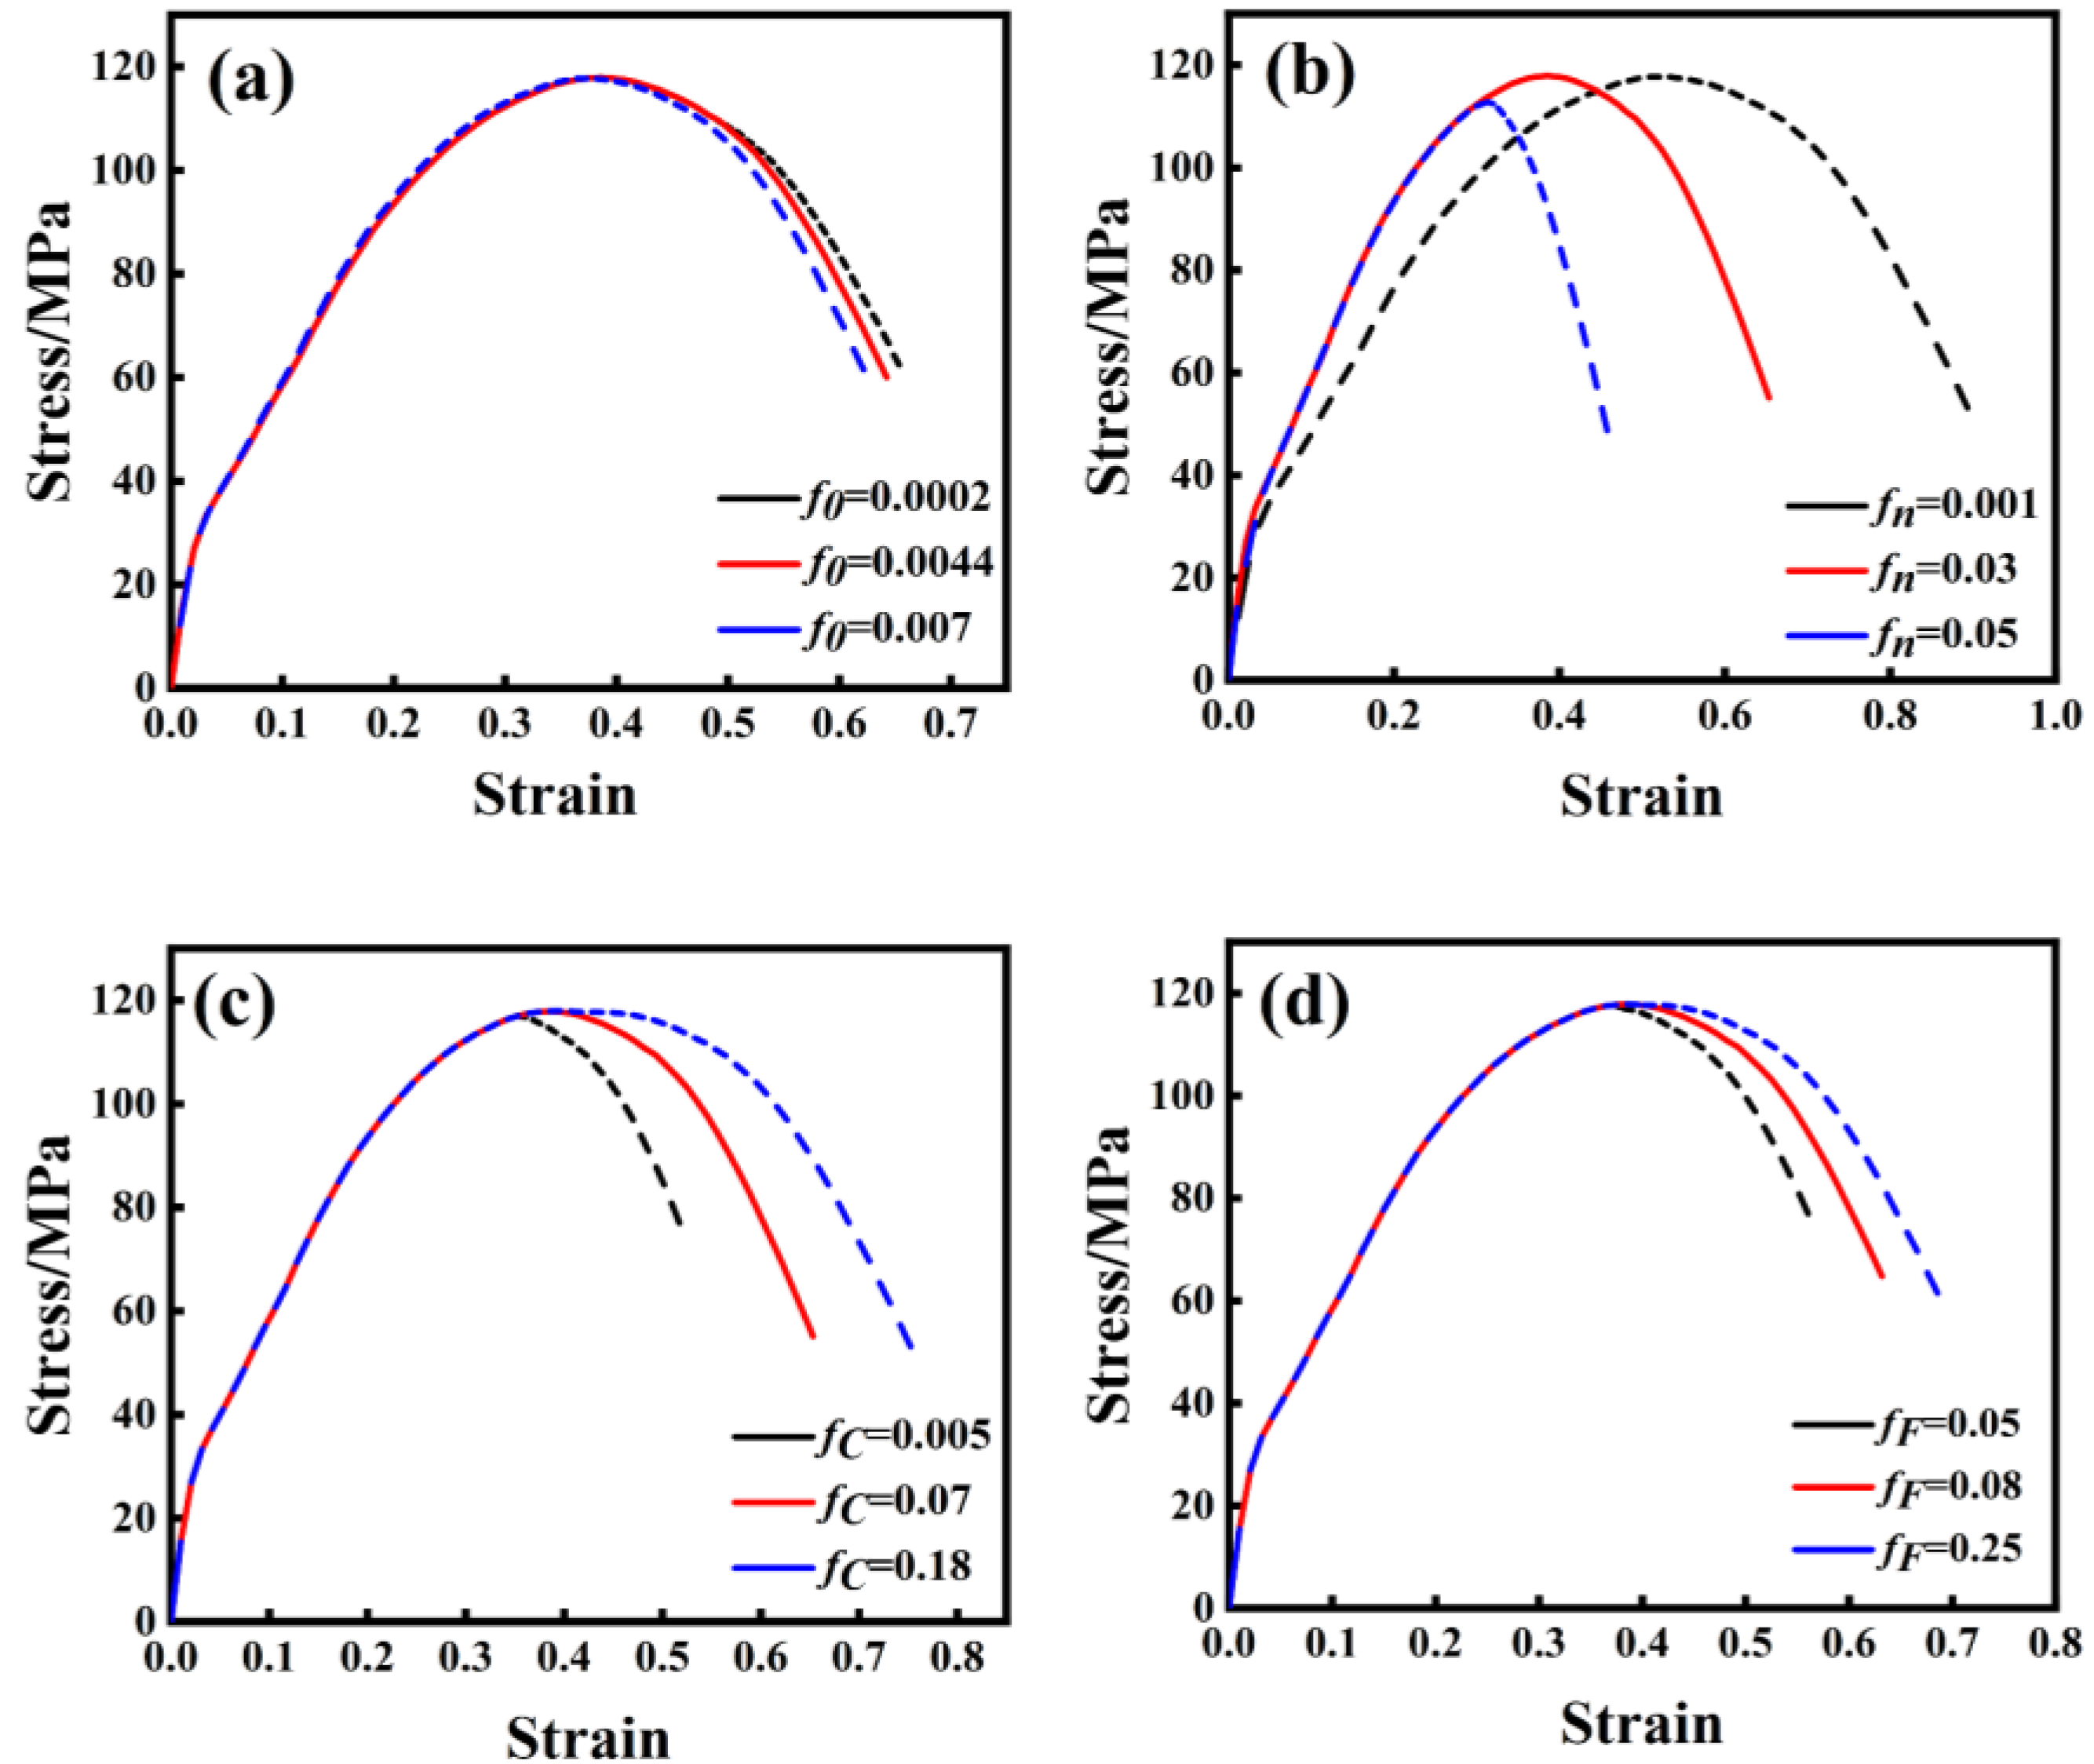
3.7. Damage Evolution Analysis

According to the mesoscopic damage theory, the continuous accumulation of damage can be considered as void nucleation, growth and aggregation. (1) The nucleation of microvoids: due to the fragmentation of two-phase particles or separation from the matrix material formed, mostly in the inclusion or two-phase particle interface. (2) Microvoid growth: As macroscopic plastic deformation increases, the number and volume of microvoids grow rapidly. (3) Coalescence of microvoids: The increased number and volume of microvoids lead to their coalescence, resulting in macroscopic cracks and material fracture [32].
To investigate the fracture characteristics of materials and understand how temperature and strain rate affect fracture, it is essential to analyze the fracture morphology of materials. As can be seen in Figure 10, there are dimples distributed at the fracture of the sample. The distinguishing feature of ductile fractures is the existence of dimples. It can be judged that the fracture mode of the materials is ductile fracture [33,34,35].
Figure 10a shows the fracture morphology of AISI 1035 steel at 1100 °C and 10 s−1 with a magnification of 1000. The microvoids in the material aggregate and connect with each other, and cracks appear when the proportion of voids increases to a certain extent. Figure 10b shows a 5000-fold fracture morphology. The primary dimple is large and the secondary dimple is small. Secondary voids will nucleate during deformation.
Figure 11 and Figure 12 show the respective morphology of fracture samples under SEM. It can be seen from Figure 11 that the dimples are larger and deeper at 1100 °C, indicating that the second-phase particles are larger and that the material has strong plastic deformation ability. When the strain rate is 1 s−1, the dimples appear, indicating that the toughness at this strain rate is greater. However, this dimple is smaller and shallower than the above dimples, indicating that the temperature significantly influences the material’s toughness.
Based on the above observations, it can be found that the damage and fracture of ductile metal materials result from microvoids, and the internal impurities in the material nucleate, grow and polymerize under the influence of the external environment and load, resulting in damage and fracture. The SEM observations demonstrate the rationality of the GTN model in simulating the damage fracture of ductile metal materials.

3.8. Establishment of Response Surface Method

Based on the GTN damage model, uniaxial tensile deformation experiments at high temperatures of 900, 1000, 1100 °C and strain rates of 0.1, 1, 10 s−1 were simulated by finite element simulation. When the response value was selected, the four points of the stress peak point and the transverse and longitudinal coordinates of the failure point of the macro-stress–strain curve were set as R1, R2, R3 and R4 [36], and the stress–strain data of 0.1 s 1000 °C were selected as an example, as shown in Figure 13.
Based on the combination of four factors and three levels of test parameters, 29 test groups were designed using the orthogonal test method. The data were obtained from the stress–strain curves obtained by finite element simulation. Table 4 displays the selected damage parameter grades. Following this experimental design and the use of Design expert 13 software, this experiment selected 1100 °C as an example. The experimental results are detailed in Table 5.

3.8.1. Response Surface Model Fitting and Significance Analysis Test

The variance analysis of the regression model is shown in Table 6. In this analysis, the P-values for each response variable R1, R2, R3, and R4 are extremely close to zero, indicating that the model has very significant statistical significance. The response model formula is shown in Equations (8)–(11).
R 1 = 0.480960 1.17636 f 0 + 0.086295 f n + 0.105956 f c 0.036462 f F 11.60909 f 0 f n 8.28267 f 0 f c + 13.35200 f 0 f F 1.06010 f n f c + 0.002045 f n f F 0.417333 f c f F
R 2 = 121.51502 173.17333 f 0 + 71.63398 f n 7.27615 f c 8.47192 f F + 7096.16364 f 0 f n + 34.44452 f 0 f c + 48.8625 f 0 f F 7.200865 f n f c 15.255156 f n f F 0.4767 f c f F
R 3 = 0.713056 10.63087 f 0 0.379224 f n 0.188299 f c 0.060719 f F + 90.377 f 0 f n + 11.61813 f 0 f c + 0.683308 f n f c 1.36128 f n f F 0.0744 f c f F 2.73168 f 0 f F + 1256.44640 f 0 2 + 5.11924 f n 2 + 2.61542 f c 2 + 0.322938 f F 2
R 4 = 32.17556 461.27990 f 0 7.15611 f n 4.85988 f c 11.20834 f F + 955.45455 f 0 f n 1977.77778 f 0 f c + 3225.86667 f 0 f F + 263.58586 f n f c 7.24242 f n f F + 45.17037 f c f F

3.8.2. Response Surface Analysis

The three-dimensional response surface of fracture strain affected by four significant factors f 0 (A), f n (B), f c (C) and f F (D) was drawn by Design-Expert software, as shown in Figure 14. The figure shows that with the decrease in f 0 and the increase in f n , R3 generally tends to decrease, which may be due to the increase in the proportion of f n caused by partial void nucleation (Figure 14a). R3 decreases with the increase in f n and the decrease in f c . The reason is that there are more nucleated voids and the voids coalesce, and that the time for the material to reach the necking state is shorter [37] (Figure 14b). With the decrease in f c and f F , R3 decreases, indicating that the void size increases rapidly and that the fracture occurs soon after necking (Figure 14c). The effect of f F on R3 is small because of the short time between necking and fracture (Figure 14d).
The interaction of each damage parameter significantly affects the void volume fraction of materials. Table 7 displays the damage parameters obtained based on the predictions of the quadratic regression model.

3.9. Finite Element Simulation Analysis

As depicted in Figure 15, the fracture location of the sample is compared with the results from finite element simulations, confirming the accuracy of the finite element analysis. Figure 16 shows VVF (Void Volume Fraction) cloud images in four stages. First of all, the porosity increases from 0.00077 to 0.0093, and the damage is concentrated in the central area. When the porosity increases to 0.0386, the sample shows an obvious necking phenomenon, and when the porosity reaches 0.0654, the sample reaches the near-fracture state. When the sample breaks, the porosity reaches 0.079. The porosity of the four stages corresponds to the porosity calibrated by the experimental method. The error is within 10%, which meets the requirements.
f 0 has little effect on tensile curve shape and fracture strain, as shown in Figure 17a. According to Figure 17b, it is evident that f n exerts a significant impact on the mechanical properties of the material, particularly affecting its fracture strain and tensile strength. Higher values of f n lead to increased nucleation of inclusions within the material, resulting in lower tensile strength and corresponding strain at failure, thus diminishing the material’s mechanical properties [38,39]. The primary effect of f c on the tensile curve is observed in Figure 17c: larger values of f c correspond to slower void polymerization times, resulting in higher tensile strength and corresponding strain at failure. This improvement reflects enhanced mechanical properties of the material [40]. The tensile curve’s fracture stress and strain are predominantly influenced by f F [41]. The smaller f F is, the more likely the material is to fracture, as shown in Figure 17d.

4. Conclusions

This paper mainly introduces the fracture mechanism of AISI 1035 steel and the micro-fracture model based on voids. The specific conclusions are as follows:
(1)
The method of fitting the stress–strain curve of AISI 1035 steel with the Ramberg–Osgood hardening model is used to calibrate q 1 = 1.78, q 2 = 0.833, q 3 = q 1 2 = 3.17 in the GTN model. The inflection point of the curve slope obtained by the finite element method and experimental method is used to determine ε N = 0.144, and the deviation parameter S N is 0.1. The GTN model parameters which can characterize the damage of AISI 1035 steel were determined by combining the macroscopic mechanical properties with the microscopic morphology. By comparing the damage parameters obtained by the two methods, it is proved that the fracture parameters obtained can better simulate the fracture of materials, and the GTN fracture model exhibits strong applicability to the fracture of AISI 1035 steel. The error of the damage parameters obtained by the two methods is less than 10%, confirming the GTN damage model’s effectiveness in predicting the evolution of damage behavior in AISI 1035 steel.
(2)
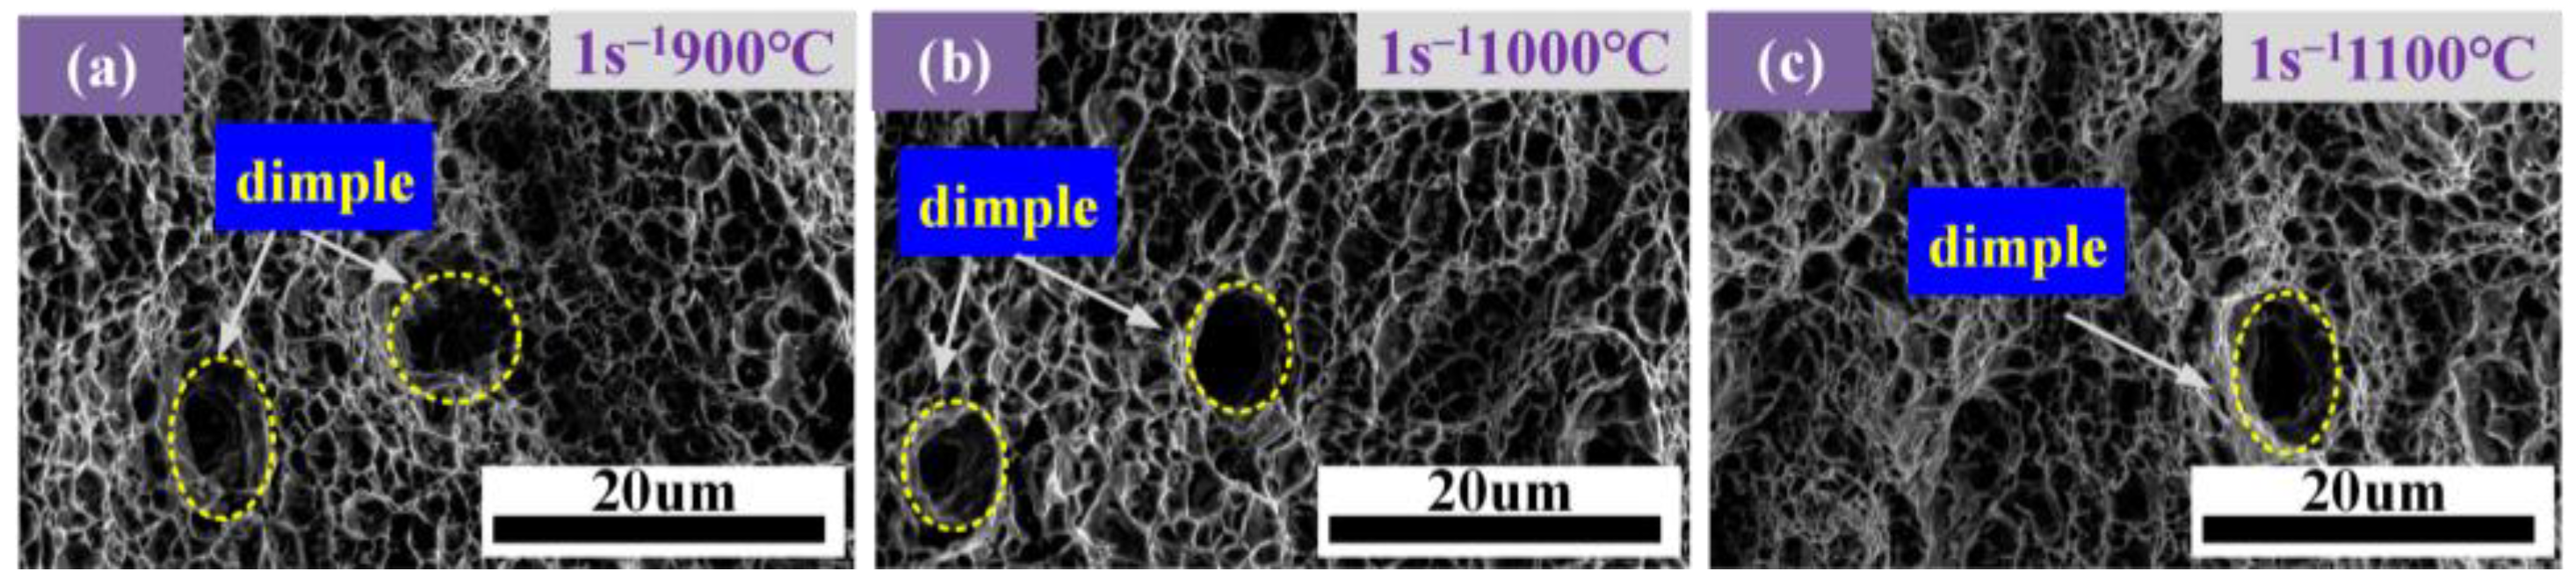
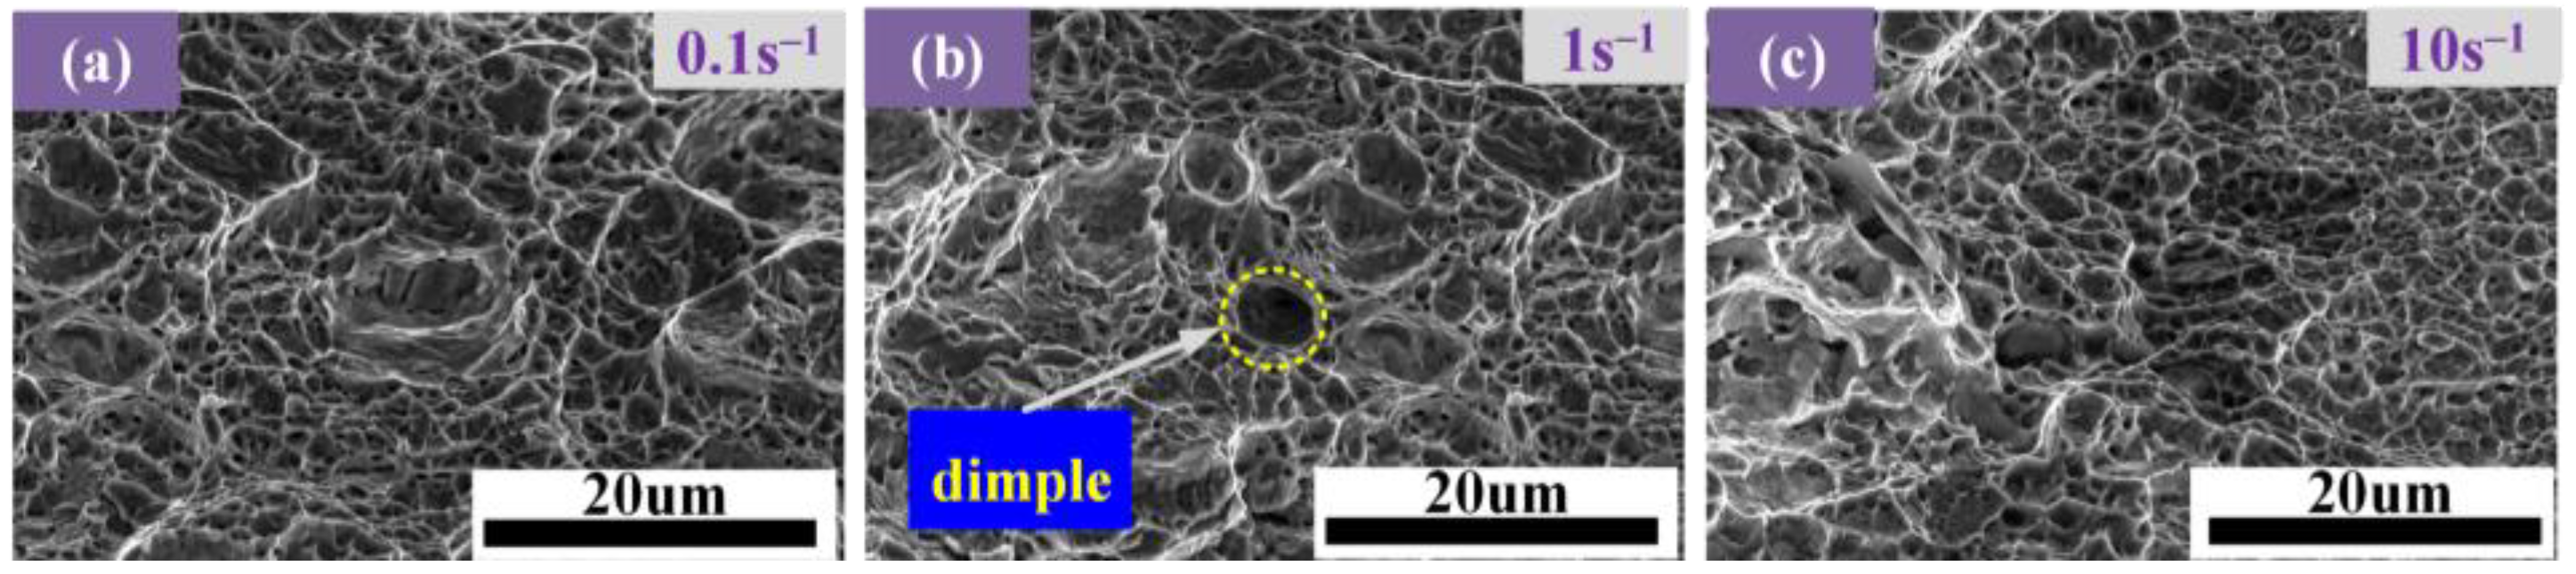
By observing the fracture morphology of AISI 1035 steel, it is found that the size and depth of the dimples of the sample at 1100 °C are larger and deeper, which reveals that AISI 1035 steel has good plastic deformation ability and shows typical ductile fracture characteristics.
(3)
By studying the effects of different damage parameters on fractures, it is found that the effect of f 0 on fractures is relatively small, while the effects of f n , f c and f F on fractures are larger. The larger f n is, the earlier the fracture point is; conversely, the larger f c and f F are, the later the fracture occurs.
Accurate GTN model parameters enable the prediction of the mechanical behavior of 1035 steel under various loading conditions, particularly during plastic deformation and fracture. By developing a precise damage model, researchers can optimize the forging process at the design stage, thereby enhancing both product performance and reliability. In summary, calibrating the GTN model parameters offers significant theoretical support and practical guidance for improving the performance of 1035 steel in forging and other applications.

Author Contributions

J.Y.: Experimental, Investigation, Writing—original draft. X.H.: Review and editing, Experimental, Investigation, Conceptualization, Project administration. G.M.: Review and editing, Experimental, Conceptualization, Review and editing. C.S.: Review and editing, Investigation. X.T.: Review and editing, Investigation, Conceptualization, Project administration. H.J.: Review and editing, Project administration, Conceptualization. All authors have read and agreed to the published version of the manuscript.

Funding

This work is supported by the Talent Project of Tangshan Human Resources and Social Security Bureau (A202202008) and funded by the Science and Technology Project of China Minmetals Corporation Limited (2021ZXA06).

Institutional Review Board Statement

The authors claim that there are no ethical issues involved in this research.

Informed Consent Statement

All the authors consent to participate in this research and contribute to the research.

Data Availability Statement

No data or materials are available for this research. No codes are available for this research.

Conflicts of Interest

The author Changzhe Song is employed by the China MCC22 Group Corporation Ltd. The remaining authors declare that the research was conducted in the absence of any commercial or financial relationships that could be construed as a potential conflict of interest.

References

  1. Liu, F.; Li, Y.; Cheng, Z.; Li, F.; Li, J.; Ghafoor, S. Sustainability assessment of incremental sheet forming: A review. Int. J. Adv. Manuf. Technol. 2022, 119, 1385–1405. [Google Scholar] [CrossRef]
  2. Kumar, G.; Maji, K. Forming limit analysis of friction stir tailor welded AA5083 and AA7075 sheets in single point incremental forming. Int. J. Mater. Form. 2022, 15, 20. [Google Scholar] [CrossRef]
  3. Wu, S.; Gao, L.; Matsuoka, Y.; Rashed, S.; Zhao, Y.; Ma, N. Multi-step toolpath approach of improving the dimensional accuracy of a non-axisymmetric part in incremental sheet forming and its mechanism analysis. J. Mech. Sci. Technol. 2022, 36, 1975–1985. [Google Scholar] [CrossRef]
  4. Li, G.; Cui, S. Meso-mechanics and damage evolution of AA5182-O aluminum alloy sheet Based on the GTN model. Eng. Fract. Mech. 2020, 235, 107162. [Google Scholar] [CrossRef]
  5. Wang, C.; Jiang, W.; Han, K.; Liu, X.; Zhu, Y.; Xing, R.; Hou, C. Microscopic damage in eutectic SnPb alloy: First-principles calculations and experiments. Eng. Fail. Anal. 2024, 164, 108638. [Google Scholar] [CrossRef]
  6. Pei, C.; Zeng, W.; Yuan, H. A damage evolution model based on micro-structural characteristics for an additive manufactured superalloy under monotonic and cyclic loading conditions. Int. J. Fatigue 2020, 131, 105279. [Google Scholar] [CrossRef]
  7. Jianbing, C.; Yudong, R.; Guangda, L. Damage of quasi-brittle materials from a two-scale perspective: From geometric discontinuity to free energy reduction. Chin. J. Mech. Mech. 2024, 56, 1–11. [Google Scholar]
  8. Hou, L. Study on High Temperature Failure of Stainless Steel Spring Based on GTN Model; Xi’an University of Technology: Xi’an, China, 2023. [Google Scholar]
  9. Bergo, S.; Morin, D.; Hopperstad, O.S. Numerical implementation of a non-local GTN model for explicit FE simulation of ductile damage and fracture. Int. J. Solids Struct. 2021, 219, 134–150. [Google Scholar] [CrossRef]
  10. Gurson, A.L. Continuum theory of ductile rupture by void nucleation and growth: Part I—Yield criteria and flow rules for porous ductile media. J. Eng. Mater. Technol. 1977, 99, 2–18. [Google Scholar] [CrossRef]
  11. Tvergaard, V.; Needleman, A. Analysis of the cup-cone fracture in a round tensile bar. Acta Metall. 1984, 32, 157–169. [Google Scholar] [CrossRef]
  12. Needleman, A.; Tvergaard, V. An analysis of ductile rupture modes at a crack tip. J. Mech. Phys. Solids 1987, 35, 151–183. [Google Scholar] [CrossRef]
  13. Chu, C.C.; Needleman, A. Void nucleation effects in biaxially stretched sheets. J. Eng. Mater. Technol. 1980, 102, 249–256. [Google Scholar] [CrossRef]
  14. Sun, X.; Mo, X.; Liu, Y.; Shen, W.; Li, C.; Li, Y.; Hu, X.; Xue, F. GTN Poroplastic Damage Model Construction and Forming limit prediction of Magnesium Alloy Based on BP-GA Neural Network. Mater. Today Commun. 2024, 41, 110295. [Google Scholar] [CrossRef]
  15. He, Z.; Zhu, H.; Hu, Y. Anisotropic mechanical behavior prediction of aluminum alloy sheet based on an anisotropic GTN model: Modeling, simulation and experimental investigation. Mech. Adv. Mater. Struct. 2024, 31, 314–331. [Google Scholar] [CrossRef]
  16. Khademi, M.; Mirnia, M.J.; Naeini, H.M. Numerical analysis of ductile fracture in stretch bending of AA6061-T6 aluminum alloy sheet using GTN damage model. Int. J. Solids Struct. 2024, 301, 112947. [Google Scholar] [CrossRef]
  17. Liu, Z.; Wang, T.; Luo, Z.; Zheng, E.; Wang, Z.; Jiang, S.; Chen, J. Numerical simulation and defect prediction of forming process for aluminum alloy sheets considering the effect of both anisotropy and lode parameter. Eng. Fract. Mech. 2024, 299, 109940. [Google Scholar] [CrossRef]
  18. Yin, Y.; Yang, T.; Qin, W.; Lu, Y.; Gu, Y. Calibration of GTN model for fracture analysis of steel plates with holes. J. Constr. Steel Res. 2024, 215, 108506. [Google Scholar] [CrossRef]
  19. Yoshida, S.; Ogawa, T.; Hayashi, T.; Saito, T.; Hattori, Y.; Sasaki, S. Study on fracture assessment by GTN model for BWR reactor internals based on material properties of simulated irradiated stainless steels. Int. J. Press. Vessel. Pip. 2024, 208, 105147. [Google Scholar] [CrossRef]
  20. Wu, H. Research on Strong Spinning Damage Model and Ductile Fracture Behavior of Cylindrical Parts; Harbin Institute of Technology: Harbin, China, 2021. [Google Scholar]
  21. Yan, R.; Xin, H.; Veljkovic, M. Ductile fracture simulation of cold-formed high strength steel using GTN damage model. J. Constr. Steel Res. 2021, 184, 106832. [Google Scholar] [CrossRef]
  22. Brahim, A.O.; Capozucca, R.; Khatir, S.; Magagnini, E.; Benaissa, B.; Wahab, M.A.; Cuong-Le, T. Artificial neural network and YUKI algorithm for notch depth prediction in X70 steel specimens. Theor. Appl. Fract. Mech. 2024, 129, 104227. [Google Scholar] [CrossRef]
  23. Yildiz, R.A.; Yilmaz, S. Influence of heat treatments on the formability of the 6061 Al alloy sheets: Experiments and GTN damage model. Int. J. Adv. Manuf. Technol. 2021, 113, 2277–2299. [Google Scholar] [CrossRef]
  24. Sun, Q.; Lu, Y.; Chen, J. Identification of material parameters of a shear modified GTN damage model by small punch test. Int. J. Fract. 2020, 222, 25–35. [Google Scholar] [CrossRef]
  25. Li, X.; Xu, M.; Zhang, Z. Hot damage evolution in a high strength aluminum alloy during hot forming: A study using the Gurson–Tvergaard–Needleman model. J. Mater. Res. Technol. 2021, 14, 1366–1376. [Google Scholar] [CrossRef]
  26. Gao, T.; Ying, L.; Hu, P.; Han, X.; Rong, H.; Wu, Y.; Sun, J. Investigation on mechanical behavior and plastic damage of AA7075 aluminum alloy by thermal small punch test: Experimental trials, numerical analysis. J. Manuf. Process. 2020, 50, 1–16. [Google Scholar] [CrossRef]
  27. Kiran, R.; Khandelwal, K. Gurson model parameters for ductile fracture simulation in ASTM A992 steels. Fatigue Fract. Eng. Mater. Struct. 2014, 37, 171–183. [Google Scholar] [CrossRef]
  28. Faleskog, J.; Gao, X.; Shih, C.F. Cell model for nonlinear fracture analysis–I. Micromechanics calibration. Int. J. Fract. 1998, 89, 355–373. [Google Scholar] [CrossRef]
  29. Yin, Y.; Li, S.; Han, Q.; Li, M. Material parameters in void growth model for G20Mn5QT cast steel at low temperatures. Constr. Build. Mater. 2020, 243, 118123. [Google Scholar] [CrossRef]
  30. Yin, Y.; Ma, T.; Han, Q.; Lu, Y.; Zhang, Y. Material parameters in the GTN model for ductile fracture simulation of G20Mn5QT cast steels. J. Mater. Civ. Eng. 2022, 34, 04021412. [Google Scholar] [CrossRef]
  31. Jia, Z. Research and Application of Ductile Fracture Model of Aluminum Alloy Based on Pore Evolution Behavior; University of Science and Technology Beijing: Beijing, China, 2022. [Google Scholar]
  32. Yin, Q. Atomic Simulation of Pore Damage Evolution Behavior of Nanocrystalline Materials Under Three-Dimensional Stress; Huazhong University of Science and Technology: Wuhan, China, 2023. [Google Scholar]
  33. Jiang, Y.Q.; Lin, Y.C.; Jiang, X.Y.; He, D.G.; Zhang, X.Y.; Kotkunde, N. Hot tensile properties, microstructure evolution and fracture mechanisms of Ti-6Al-4V alloy with initial coarse equiaxed phases. Mater. Charact. 2020, 163, 110272. [Google Scholar] [CrossRef]
  34. Lin, Y.C.; Zhu, X.H.; Dong, W.Y.; Yang, H.; Xiao, Y.W.; Kotkunde, N. Effects of deformation parameters and stress triaxiality on the fracture behaviors and microstructural evolution of an Al-Zn-Mg-Cu alloy. J. Alloys Compd. 2020, 832, 154988. [Google Scholar] [CrossRef]
  35. Wu, J.; Zhang, C.; Wang, L.; Yang, Y.; Yao, L.; Wang, X.; Meng, J.; Zhou, Y.; Sun, X. Effect of hot isostatic pressing on stress-rupture crack growth of a single-crystal nickel-based superalloy. J. Mater. Res. Technol. 2024, 32, 59–66. [Google Scholar] [CrossRef]
  36. Tian, Y. Optimization of the Hot Stamping Forming Process for High Strength Steel Laser Tailored Welding Plate B-pillar Based on Response Surface Methodology; Changchun University of Technology: Changchun, China, 2023. [Google Scholar]
  37. Ji, H.; Ma, Z.; Huang, X.; Xiao, W.; Wang, B. Damage evolution of 7075 aluminum alloy basing the Gurson Tvergaard Needleman model under high temperature conditions. J. Mater. Res. Technol. 2022, 16, 398–415. [Google Scholar] [CrossRef]
  38. Sasani, F.; Taheri, A.K.; Bahrami, H.; Pouranvari, M. Plastic Deformation and Fracture of AlMg6/CNT Composite: A Damage Evolution Model Coupled with a Dislocation-Based Deformation Model. J. Mater. Res. Technol. 2024, 31, 187–204. [Google Scholar] [CrossRef]
  39. Ji, H.; Yao, R.; Huang, X.; Wang, B.; Tang, X.; Liu, Y.; Pei, W. Damage evolution of 6005A aluminum alloy sheet based on Gurson-Tvagaard-Needleman model: Experiment and finite element simulation. J. Mater. Eng. Perform. 2022, 31, 3902–3917. [Google Scholar] [CrossRef]
  40. Wu, D.; Wang, K.; Liu, B.; Qu, H.; Wang, X.; Liu, G. Damage evolution of titanium alloy laser-welded joint during hot deformation: Experiment and modeling. J. Mater. Res. Technol. 2023, 26, 6375–6388. [Google Scholar] [CrossRef]
  41. Lee, J.; Bong, H.J.; Ha, J.; Kim, D. Inter-void shearing effect on damage evolution under plane strain deformation in high-strength aluminum alloy sheet. J. Mater. Res. Technol. 2023, 26, 7547–7565. [Google Scholar] [CrossRef]
Figure 1. Geometry and size of tensile sample.
Materials 17 05070 g001
Figure 2. Uniaxial thermal tensile test flow.
Materials 17 05070 g002
Figure 3. Tensile sample geometric model and mesh.
Materials 17 05070 g003
Figure 4. Stress–strain curve of AISI 1035 steel: (a) 0.1 s−1, (b) 1 s−1, and (c) 10 s−1.
Materials 17 05070 g004
Figure 5. Fitting results of the Ramberg–Osgood hardening model.
Materials 17 05070 g005
Figure 6. Calibration of void nucleation strain ε N of AISI 1035 steel: (a) 0.1 s−1; (b) 1s−1; (c) 10 s−1.
Materials 17 05070 g006
Figure 7. Initial voids in the volume fraction measurement area and the undeformed area of the neck of the stretched sample.
Materials 17 05070 g007
Figure 8. Digital image processing of SEM micrographs was used to calculate the porosity. (a) f 0 ; (b) f n ; (c) f c ; and (d) f F .
Materials 17 05070 g008
Figure 9. Matrix with partially grown void and nucleation void.
Materials 17 05070 g009
Figure 10. Fracture morphology of A1S1 1035 steel at 1100 °C, 10 s−1: (a) 1000×; and (b) 5000×.
Materials 17 05070 g010
Figure 11. Fracture morphology of AISI 1035 steel tensile parts at different temperatures: (a) 900 °C; (b) 1000 °C; and (c) 1100 °C.
Materials 17 05070 g011
Figure 12. Fracture morphology of AISI 1035 steel tensile parts at different strain rates: (a) 0.1 s−1; (b) 1 s−1; and (c) 10 s−1.
Materials 17 05070 g012
Figure 13. Response value of stress–strain curve.
Materials 17 05070 g013
Figure 14. Response surface model of the effect of different parameter combinations on material strain at breaking point (R3). (a) Combination of f 0 and f n , (b) Combination of f n and f c , (c) Combination of f c and f F , (d) Combination of f F and f 0 .
Materials 17 05070 g014
Figure 15. The 35 steel’s final fracture zone was obtained by experiment and finite element analysis.
Materials 17 05070 g015
Figure 16. The 1100 °C thermal tensile simulation void volume fraction (VVF) distribution cloud image.
Materials 17 05070 g016
Figure 17. Impact of each damage parameter on the tensile curve. (a) f0, (b) f n , (c) f c , (d) f F .
Materials 17 05070 g017
Table 1. Composition of AISI 1035 steel.
ElementCMnSiSP
Wt.%0.320.790.890.010.021
Table 2. Values of q1 and q2 suggested by Faleskog et al.
Hardening N(1/n)σy/E = 1 × 10⁻³σy/E = 2 × 10⁻³σy/E = 4 × 10⁻³
q1q2q1q2q1q2
0.0251.880.9561.840.9771.741.013
0.051.630.951.570.9741.481.013
0.0751.520.9371.450.961.331.004
0.11.580.9021.460.9311.290.982
0.151.780.8331.680.8561.490.901
0.21.960.7811.870.81.710.836
Table 3. Performance parameters of AISI 1035 steel.
Mechanical PropertiesTest Results
Elastic modulus E212,000 MPa
Yield strength σy341 MPa
Tensile strength σu587 MPa
Elongation δ29.3%
α0.21
n7
Table 4. The selection level of high temperature damage parameters.
Levelf0fnfcfF
10.0020.0010.0050.05
20.003250.0230.02750.125
30.00450.0450.050.2
Table 5. The 1100 °C response surface design scheme and results.
No.f0fnfcfFR1R2R3R4
10.0020.0450.02750.1250.479965123.0240.68536930.6241
20.0020.0230.050.1250.479404121.2810.6864230.6601
30.00450.0230.050.1250.478994121.0140.68607230.3251
40.0020.0010.02750.1250.478415119.8720.69046130.5728
50.003250.0450.050.1250.479066122.7280.6870630.6726
60.0020.0230.02750.20.47769120.8980.68585530.3273
70.00450.0450.02750.1250.479289122.7570.68930130.4502
80.003250.0010.050.1250.479304119.5720.68644730.3121
90.0020.0230.02750.050.480702122.990.68867730.8763
100.003250.0450.02750.050.479888123.4450.69115330.5225
110.003250.0450.02750.20.479372122.3330.6833230.5486
120.003250.0230.0050.050.478582122.0240.68764530.5271
130.00450.0010.02750.1250.479016119.6040.68445730.2938
140.003250.0230.02750.1250.479599121.3910.68291930.4796
150.003250.0010.02750.050.479021120.2910.68667730.3994
160.003250.0230.02750.1250.479204121.3260.68295530.4869
170.00450.0230.0050.1250.479447121.340.68540230.4182
180.00450.0230.02750.050.478164121.7370.68816330.0432
190.0020.0230.0050.1250.478925121.6140.68705730.5307
200.003250.0230.050.050.480348121.7030.68787830.3942
210.003250.0230.02750.1250.479246120.990.68296230.4528
220.003250.0230.02750.1250.479944121.3020.68330.5087
230.003250.0010.02750.20.478492119.1850.68782930.4733
240.003250.0010.0050.1250.478289119.9030.68716730.5539
250.003250.0450.0050.1250.48015123.0520.68642730.3925
260.003250.0230.02750.1250.479035121.3560.68296430.4445
270.003250.0230.050.20.477947120.5960.68429530.5989
280.00450.0230.02750.20.480159120.6290.68431730.7039
290.003250.0230.0050.20.478998120.9240.68456830.4269
Table 6. Analysis of variance at different temperatures.
TemperatureR1R2R3R4R1R2R3R4
R2 (%)p-Value
900 °C98.3697.4998.7496.55<0.0001<0.0001<0.0001<0.0001
1000 °C96.2496.4896.4898.14<0.0001<0.0001<0.0001<0.0001
1100 °C96.8898.6697.4199.17<0.0001<0.0001<0.0001<0.0001
Lack of Fit p-Value
900 °C0.3630.6250.0650.079
1000 °C0.0640.2410.2150.625
1100 °C0.0990.9570.2780.815
Table 7. Values of damage parameters under different conditions.
Rate, s−1 Temp, °C0.1110
900100011009001000110090010001100
f 0 0.0030.00350.00420.0030.00320.004250.00330.003650.0045
f n 0.0130.05240.03810.00820.04960.034960.00230.046330.0312
f c 0.0280.01520.03210.04240.02490.045880.04320.031560.0752
f F 0.1210.18520.09940.09830.18130.081950.08230.179150.0782
Disclaimer/Publisher’s Note: The statements, opinions and data contained in all publications are solely those of the individual author(s) and contributor(s) and not of MDPI and/or the editor(s). MDPI and/or the editor(s) disclaim responsibility for any injury to people or property resulting from any ideas, methods, instructions or products referred to in the content.

