1. Introduction
With the rapid advancement of modern industry, large-sized and complex structural components are increasingly used in aviation, aerospace, energy, transportation, and other fields. These components often feature unique designs, intricate internal structures, and stringent performance requirements, posing significant challenges to traditional manufacturing processes [
1]. Recently, the development of additive manufacturing (AM) technology has facilitated the production of large-sized aluminum alloy components, offering advantages such as a low cost, short processing cycles, and high material utilization rates [
1,
2,
3,
4,
5]. AM is widely regarded as a pivotal driver of the Fourth Industrial Revolution and a predominant method for producing high-performance parts [
6,
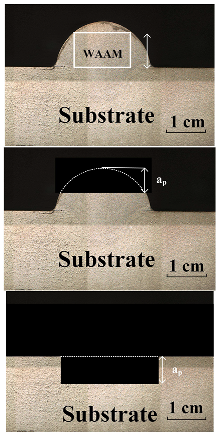
7]. During wire arc additive manufacturing (WAAM), issues such as the large heating area of the arc column and energy dispersion lead to rough surfaces of the samples, requiring secondary machining and making it difficult to manufacture complex structures [
8,
9]. As a result, parts produced via WAAM lack precision and require further machining or milling before use. To address the demands for a certain level of production capacity and processing accuracy, hybrid manufacturing combining material addition and removal technology has emerged as a necessary means for the small-batch or single-piece production of such parts [
10].
Hybrid manufacturing refers to a new type of manufacturing process that combines two or more existing manufacturing technologies. Its purpose is to achieve complementary advantages of multiple manufacturing processes in order to meet the production demands of high efficiency, high quality, and diversification in modern manufacturing industries [
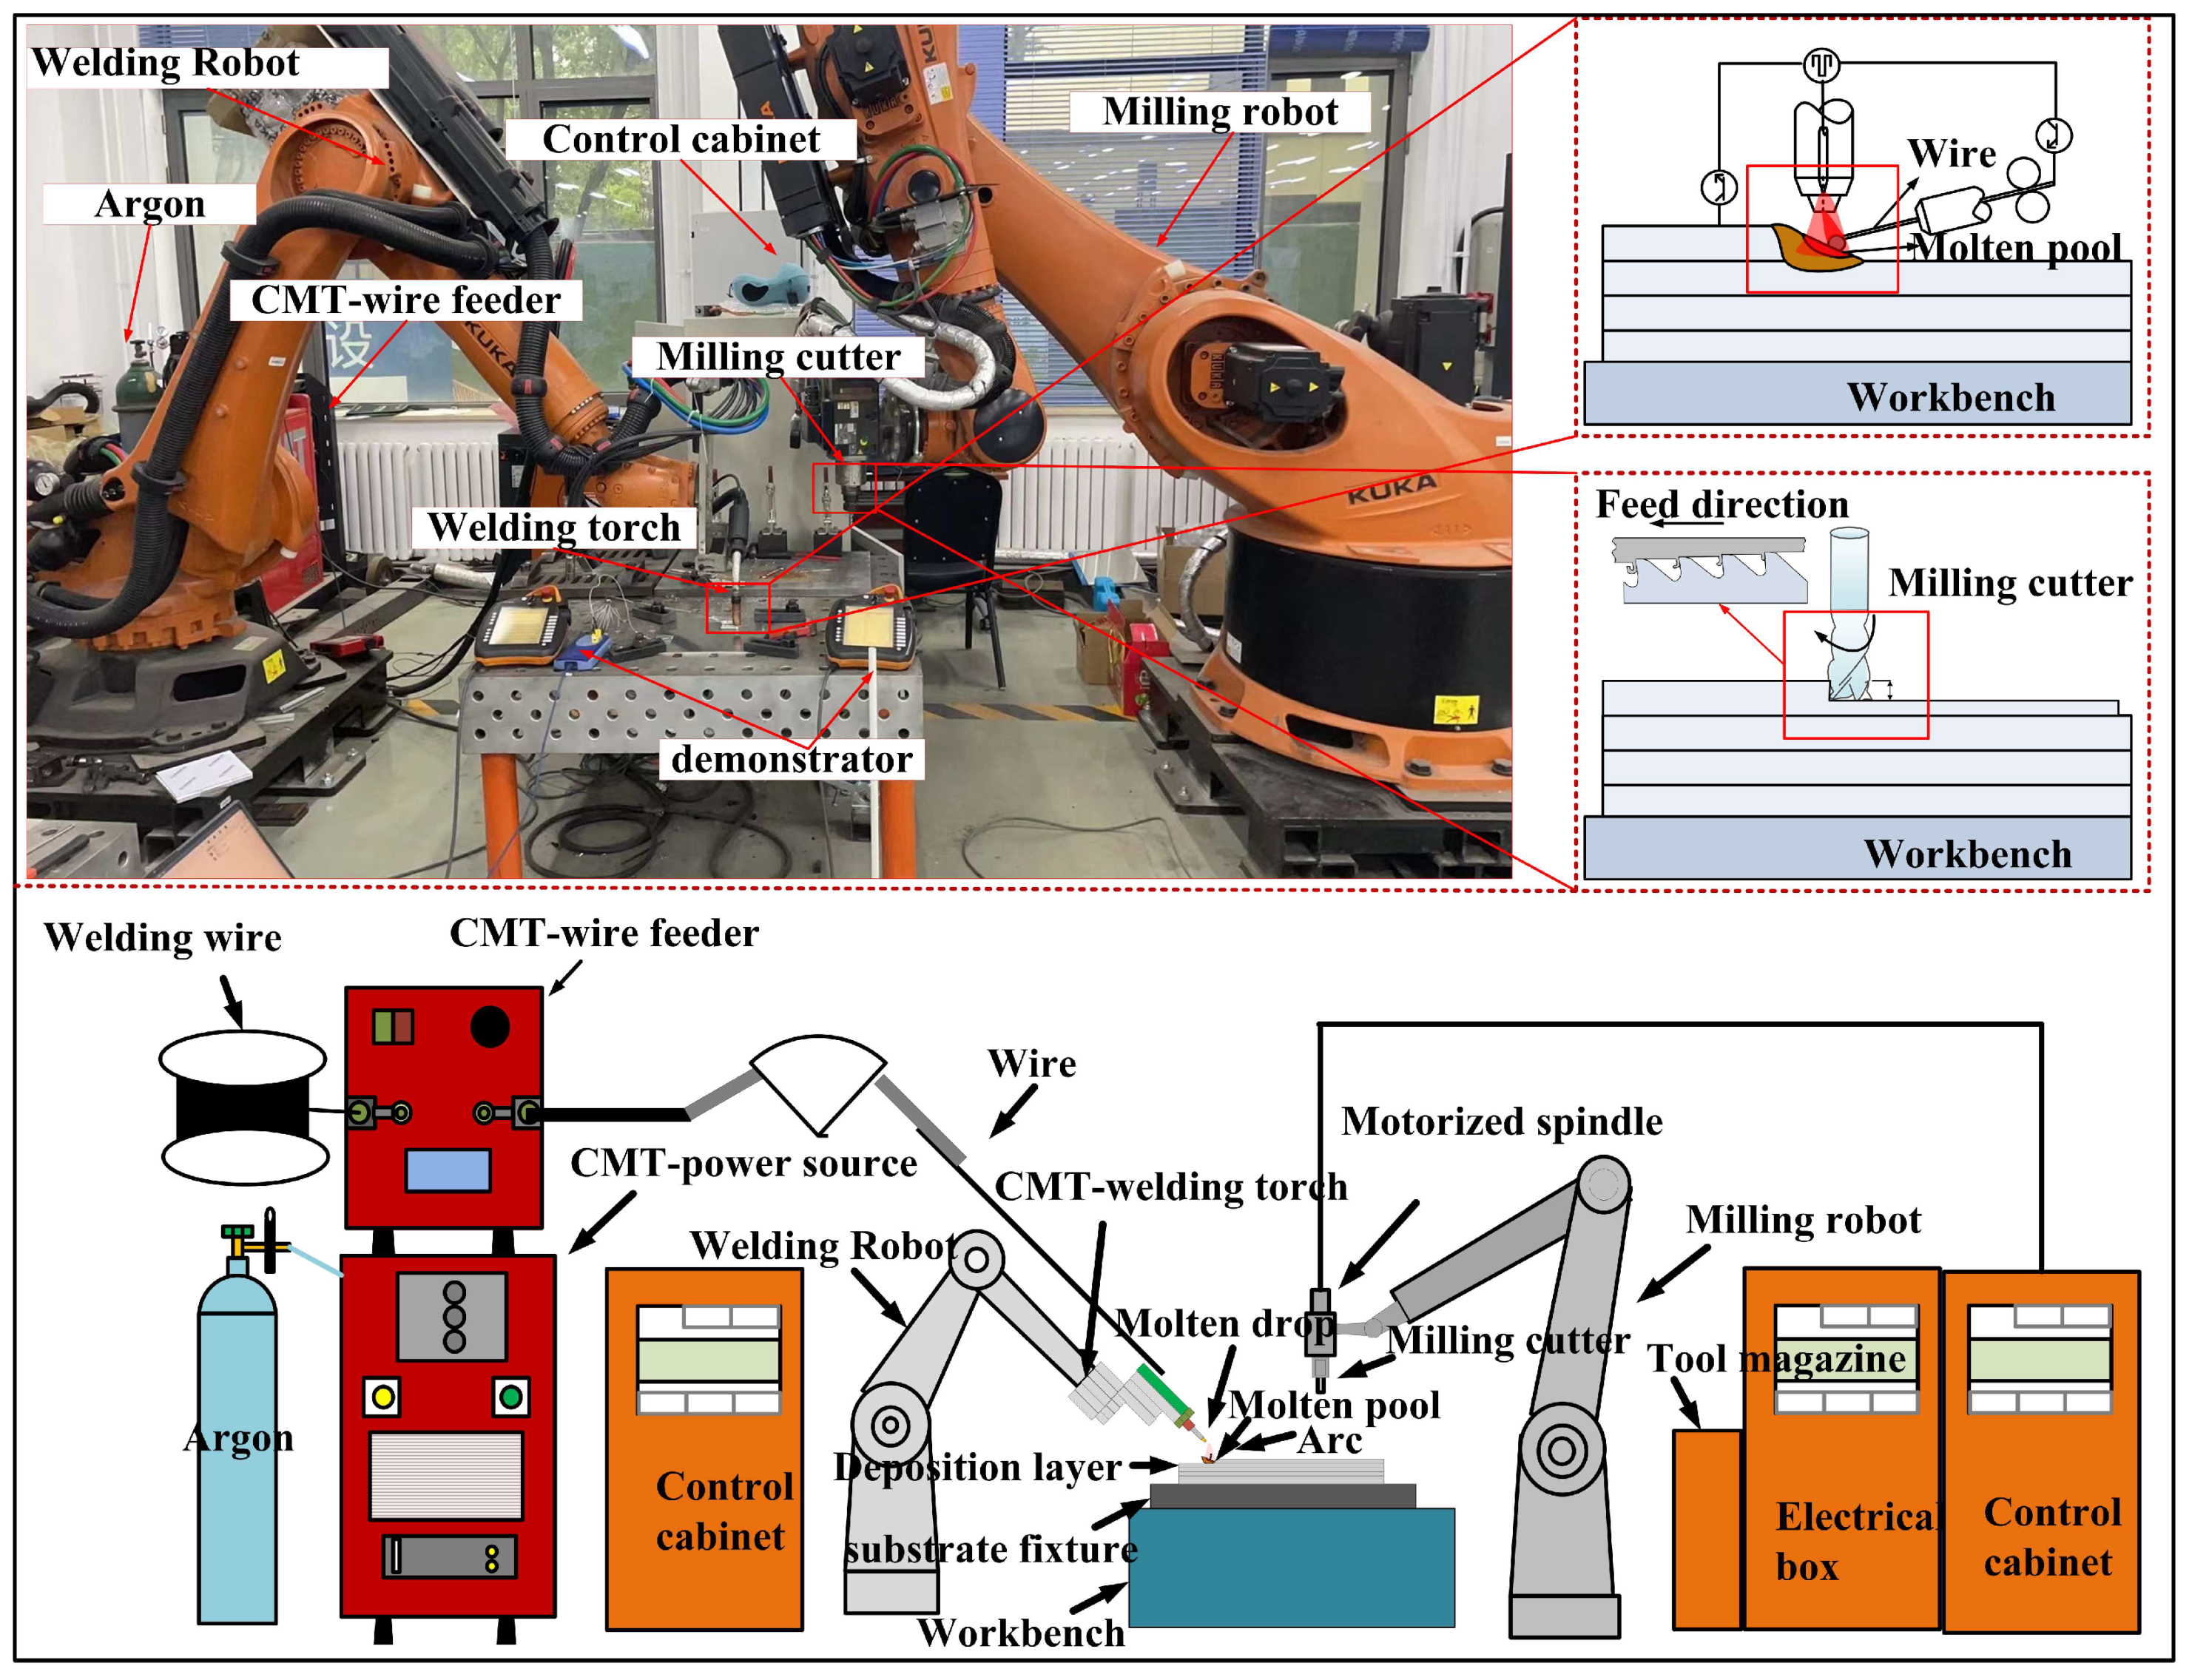
11]. The extant manufacturing processes are categorized into three types: AM (Δm > 0), subtractive manufacturing (Δm < 0), and equal material processing (Δm = 0). Multi-robot collaborative hybrid manufacturing, which combines WAAM and robot milling, is a novel manufacturing approach. WAAM constructs parts by adding material layer upon layer, offering high design freedom and material utilization. However, during the construction process, WAAM may introduce forming defects such as overfilling and underfilling, which can significantly impact the quality of the finished parts. Robotic milling, on the other hand, shapes the desired form by removing excess material, characterized by high precision and superior surface quality [
12].
Hybrid additive–subtractive manufacturing (HASM) technology amalgamates the advantages of both additive and subtractive manufacturing. Karunakaran et al. developed a hybrid manufacturing system based on arc welding and milling, integrating a pulsed gas metal arc welding machine into a three-axis CNC (Computer numerical control machine tools) machine. After each layer is deposited, only the top surface is milled until near-net shaping is complete, followed by the final peripheral milling to ensure dimensional accuracy [
13]. Jeng et al. introduced a selective laser cladding and milling hybrid process, comprising a CO
2 laser, a coaxial powder delivery system, and a four-axis linked machining and control system. This approach involves planar milling after every two or three layers, balancing formative efficiency and quality [
14]. Zhang Haiou and associates have advanced a hybrid manufacturing technique based on plasma deposition molding and CNC milling, utilizing plasma beam molding, which offers advantages like a high heat input, small beam radius, and concentrated energy, thus enabling faster accumulation and reduced costs. All the aforementioned studies were achieved through system integration, which consolidated both additive and subtractive manufacturing processes into a single device. Initially, WAAM was employed to swiftly construct an approximate form of the component. Subtractive manufacturing was utilized to perform precise finishing on the component, ensuring that it met the required dimensional accuracy and surface quality. This technology not only significantly enhanced manufacturing efficiency but also effectively reduced production costs, making it particularly suitable for the small-batch or single-piece production of large-sized, structurally complex components [
15].
HASM, by incorporating subtractive processing into traditional AM, effectively enhances the dimensional accuracy and surface quality of components produced solely through additive methods, enabling complex-shaped parts to meet final application requirements. However, current research on subtractive processes in HASM remains limited, with traditional milling techniques of as-cast still being utilized. HASM aims to address the deficiencies of AM, improve production efficiency, reduce costs, enhance component performance, and drive the development of the manufacturing industry. Given that the manufacturing methods and internal microstructures of traditional as-cast are fundamentally different from those of additively manufactured components, there are significant differences in their milling processability, making it unfeasible to directly apply traditional milling processes to HASM. Therefore, it is imperative to investigate the milling processability of additively manufactured samples, providing technical and theoretical foundations for HASM [
16,
17].
To address the milling process of additively manufactured samples in HASM, it is necessary to analyze the surface roughness and mechanical properties of both traditionally as-cast and as-deposition samples after milling, revealing the differences in milling processes between these two material states within the same material series. Based on the characteristics, research focused on developing milling tools, milling parameters, and processing strategies suitable for HASM. Through experimental validation and analysis, an applicable milling process plan was proposed to provide technical support for the application of HASM in the small-batch or single-piece production of large-sized, complex structural components.
3. Results
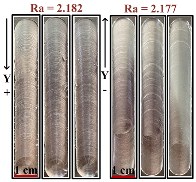
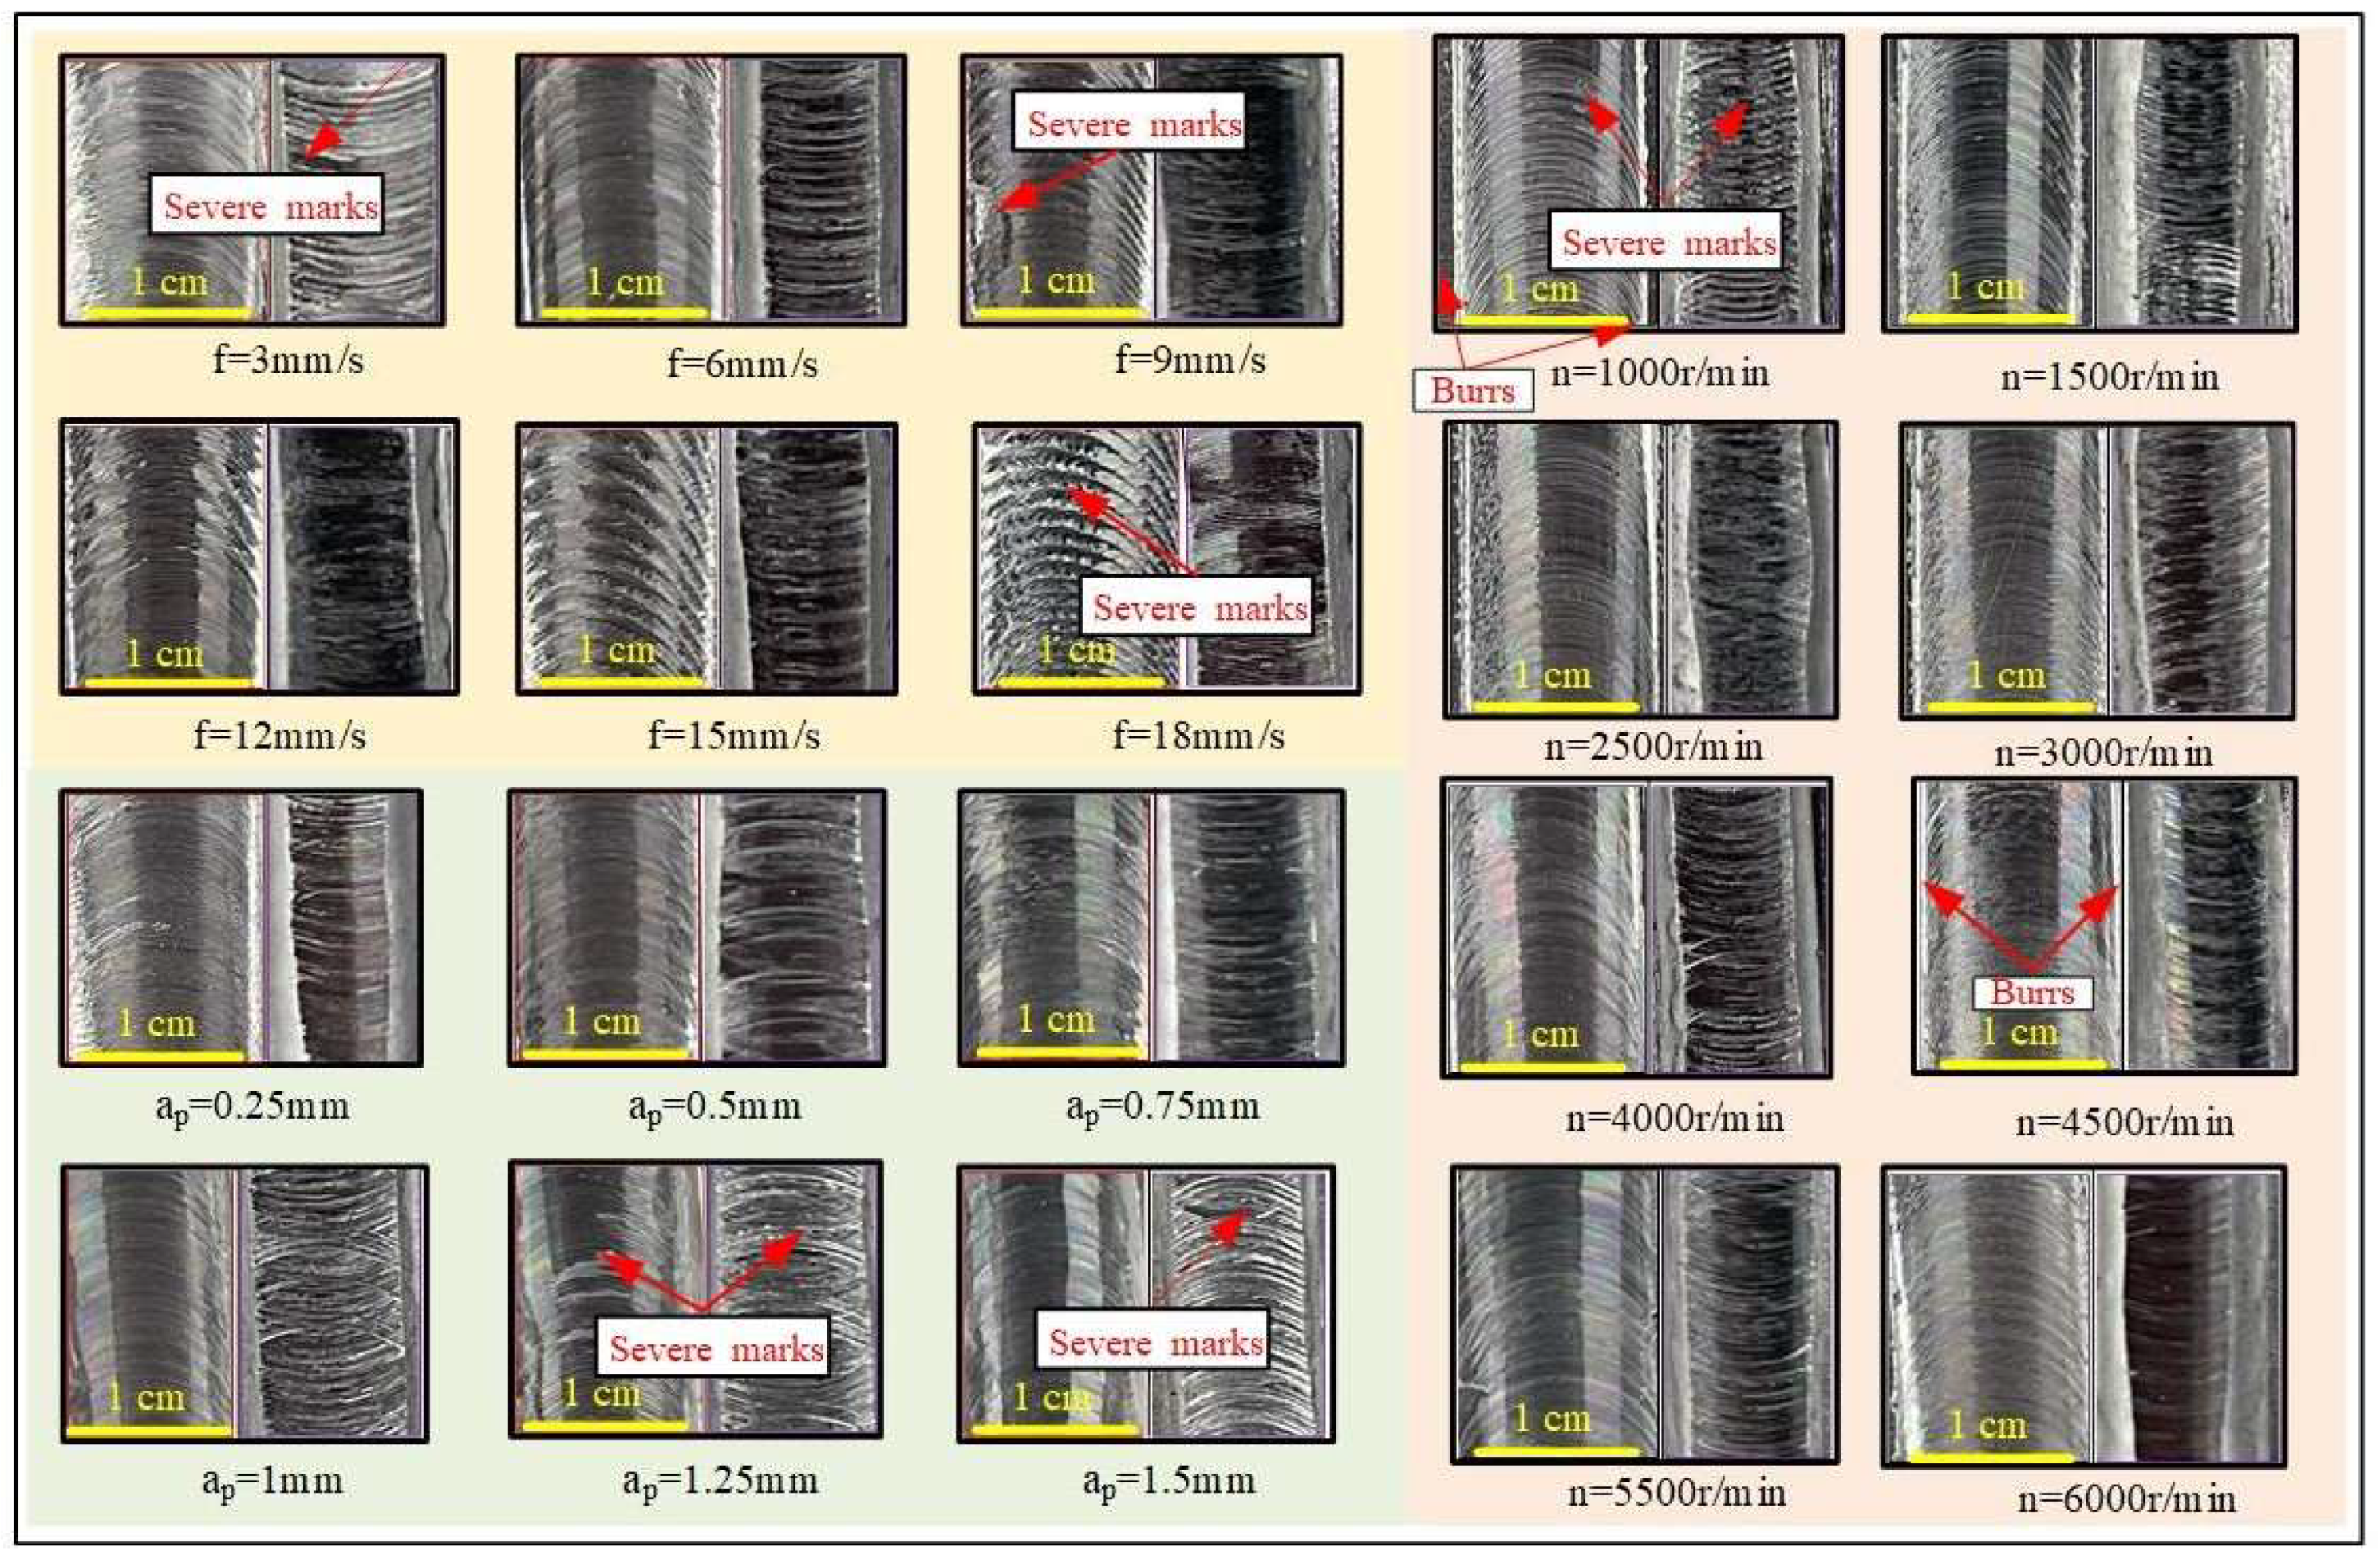
This section explores the impact of different parameters on the surface quality during robotic milling. Surface morphology and surface roughness are two key indicators for assessing surface quality, with surface morphology serving for qualitative evaluation and surface roughness providing quantitative data. To clarify the specific effects of various parameters on surface morphology, this study employed an optical microscope to observe the surface morphology of samples in each group. When selecting the processing area, this study specifically chose the middle part as the sampling area, set the cut-off length and sampling length to 0.8 mm and 12.5 mm, respectively, and controlled the sliding speed of the probe at 1 mm/s. During the measurement process, to reduce random errors, three points were non-uniformly selected along the feed direction on the measured surface for measurement, and the average value of these three points was taken as the final data.
Figure 3 presents the measured surface roughness results, which reveal that, as the feed rate increases, the surface morphology of the as-cast samples exhibits a notable deterioration trend, while the as-deposited samples are relatively less affected by the feed rate. With an increase in spindle speed, the surface morphology of both types of samples improves significantly. However, as the milling depth increases, the surface morphology of both deteriorates noticeably. To further analyze the impact of parameters on surface roughness, visualization processing is performed based on the results, yielding specific insights into the effects of each factor at different levels on surface roughness.
3.1. Spindle Speed
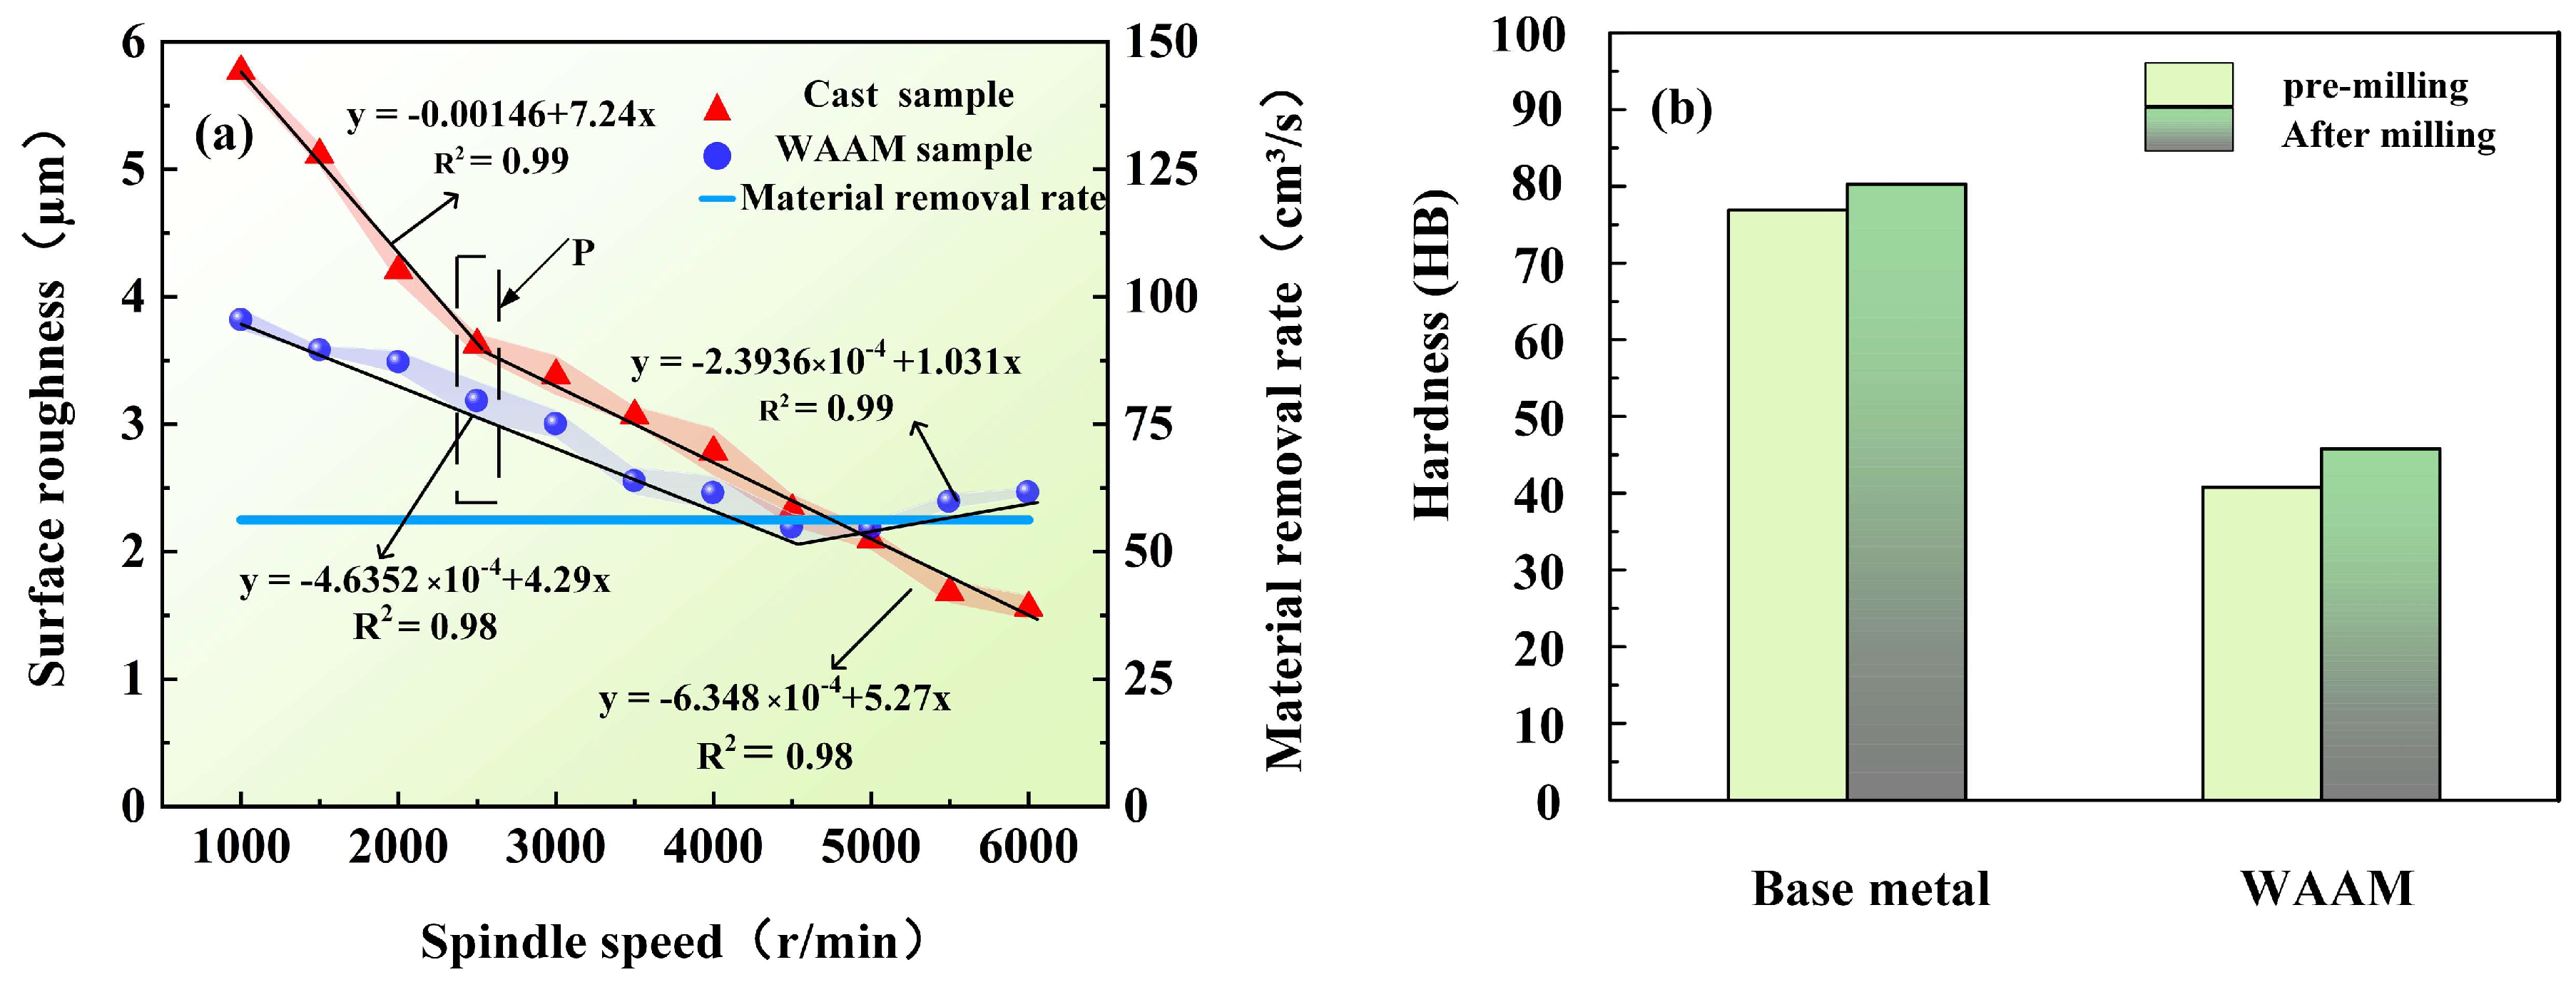
Figure 4a illustrates the pattern between spindle speed and surface roughness. The experimental results indicate that the surface roughness of the as-cast samples decreases as the spindle speed increases, with a particularly rapid decrease within the range of 1000 to 2500 rpm; after 2500 rpm, the rate of decrease gradually slows down. For the as-deposited samples, the surface roughness exhibits a trend of decreasing first and then increasing as the spindle speed increases. Within the range of roughness decrease, the declining trend of the additive manufactured samples is gentler compared to that of the cast samples. The variation range is primarily between 2.142 and 3.750
, and the optimal surface quality is achieved at a spindle speed of 4750 rpm.
To quantify this relationship, further linear modeling of the experimental data was conducted to determine the linear function between different spindle speeds and surface roughness. Specifically, hardness analysis was performed on the samples at the inflection point P in the experimental parameters (spindle speed of 4750 rpm, feed rate of 7.5 mm/s, and cutting depth of 0.75 mm). The experimental results reveal that the hardness of the as-cast samples before milling is 76.910 HB, which increases to 80.332 HB after milling, whereas the hardness of the as-deposited samples before milling is 40.751 HB, which increases to 45.252 HB after milling. The hardness of the as-deposited samples is 46% lower than that of the as-cast samples. The milling process produces a certain degree of surface hardening effect on both, as shown in
Figure 4b.
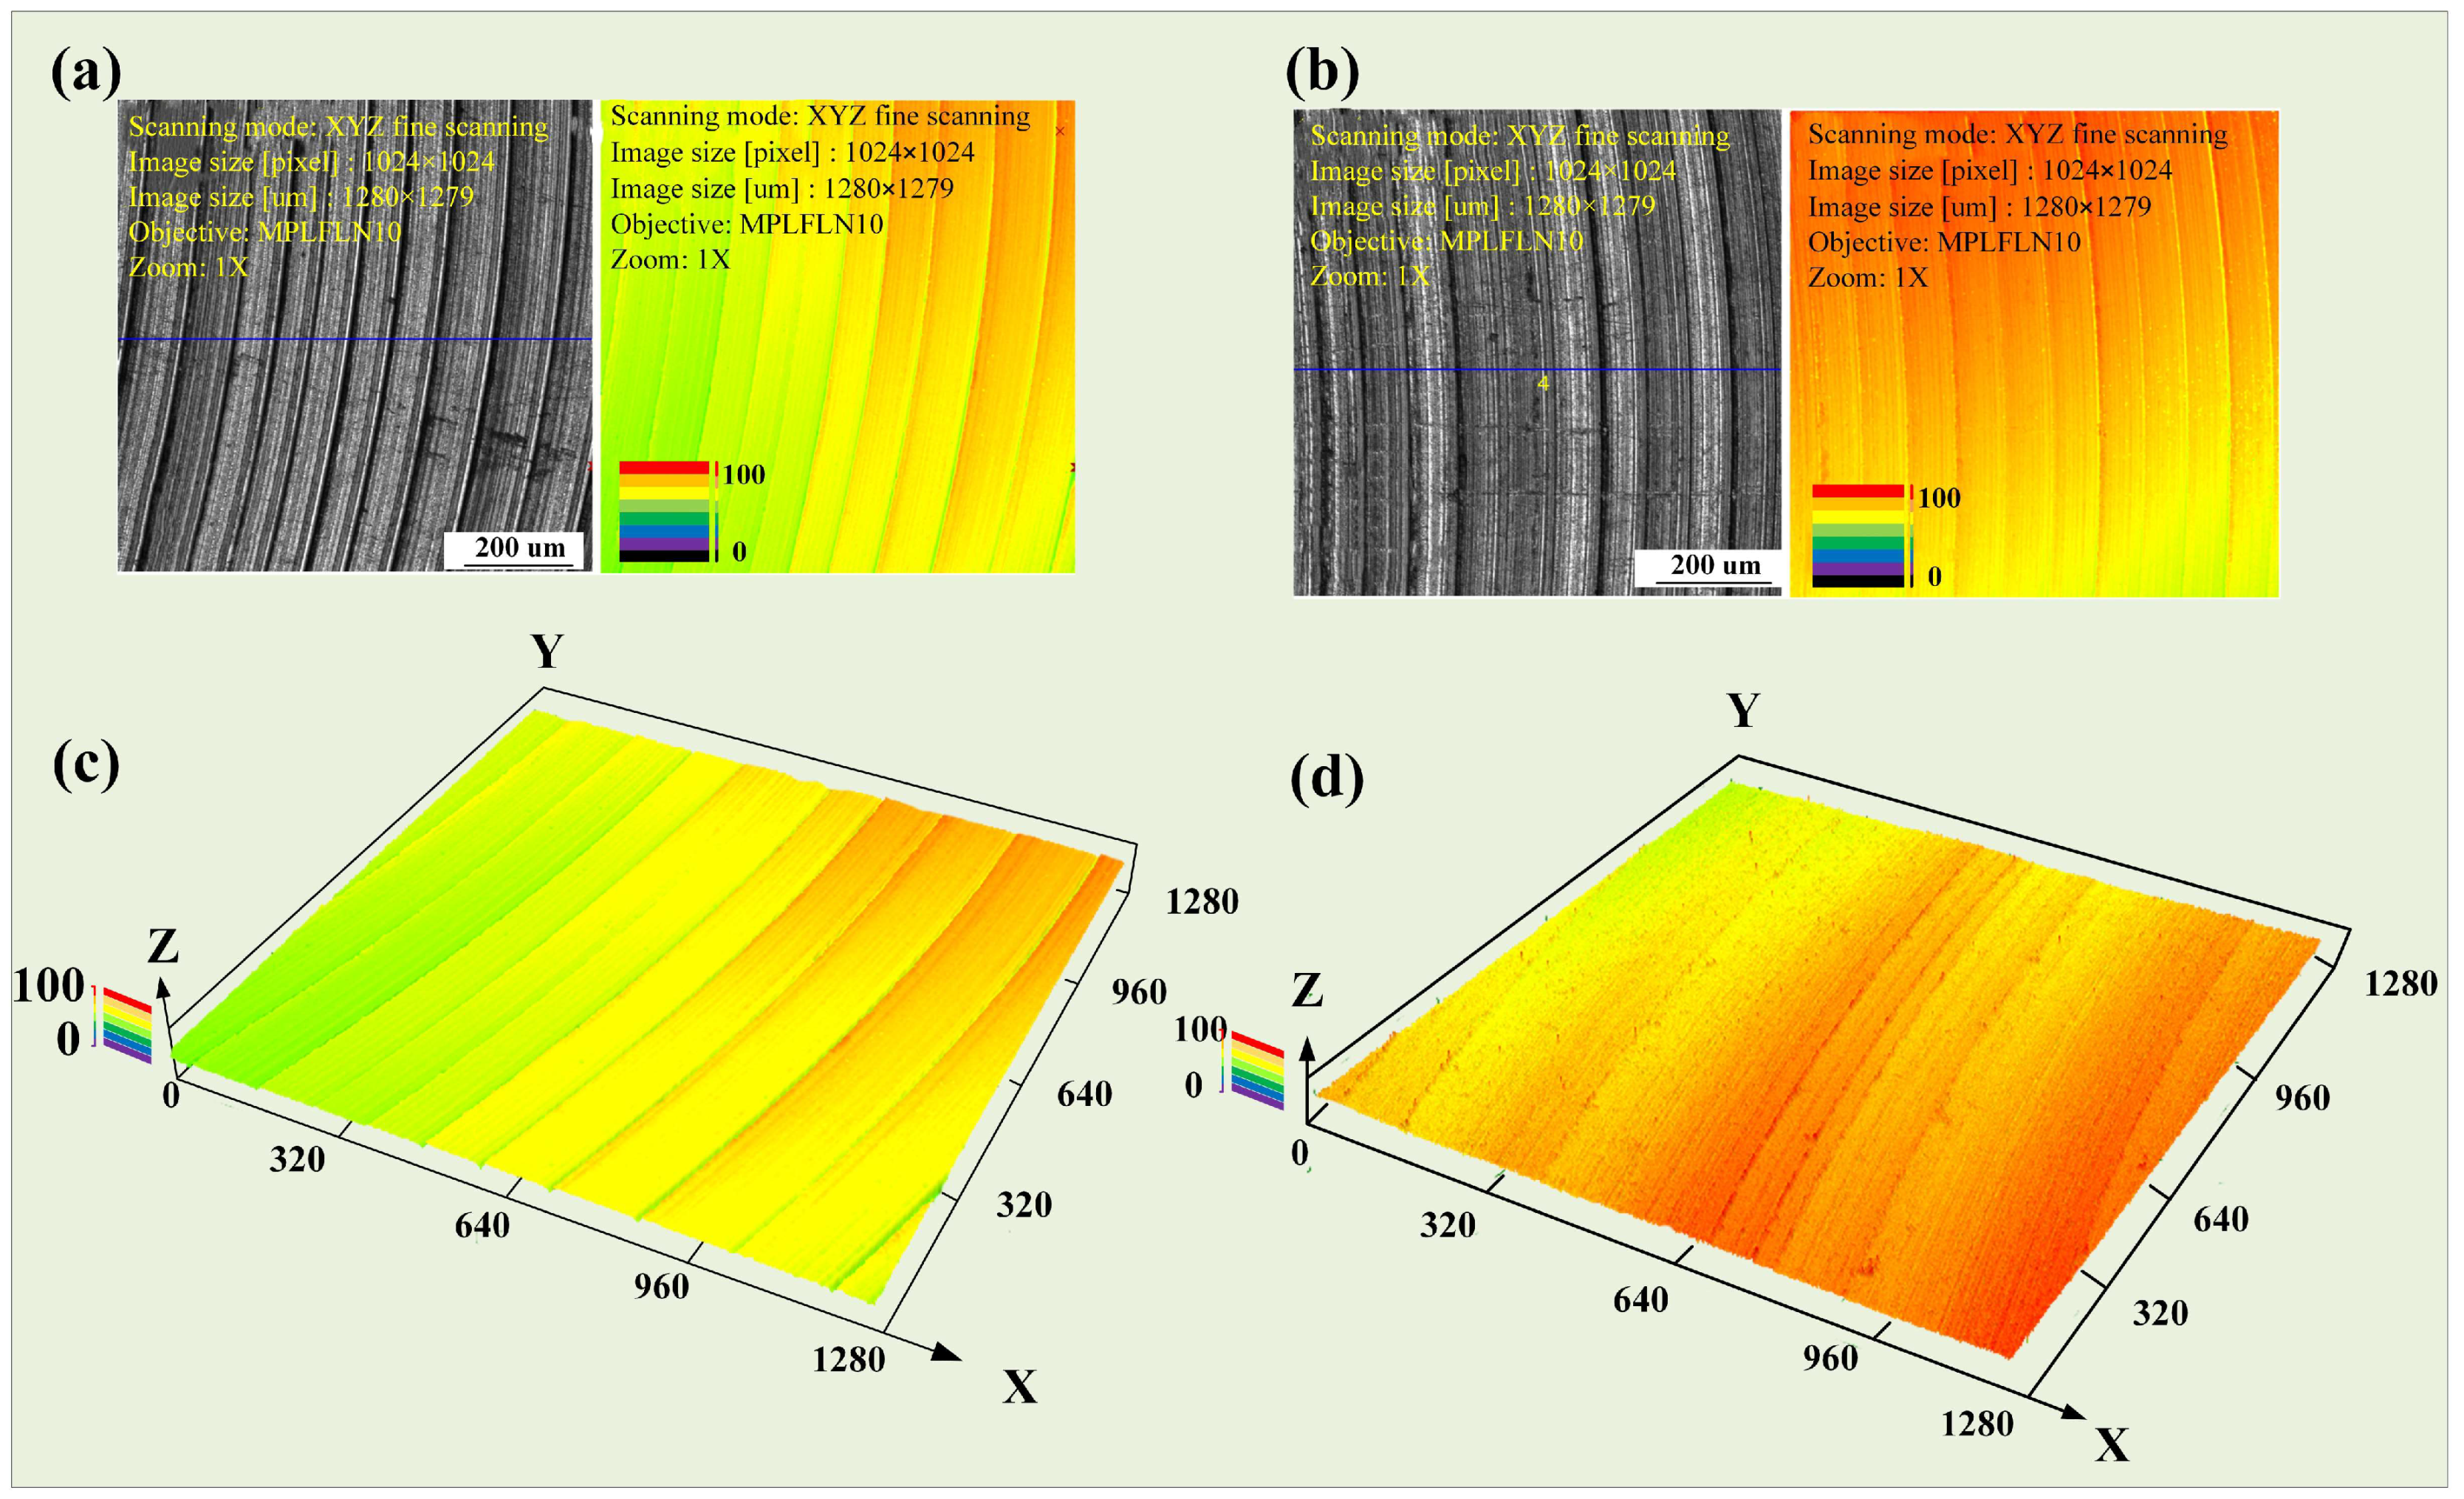
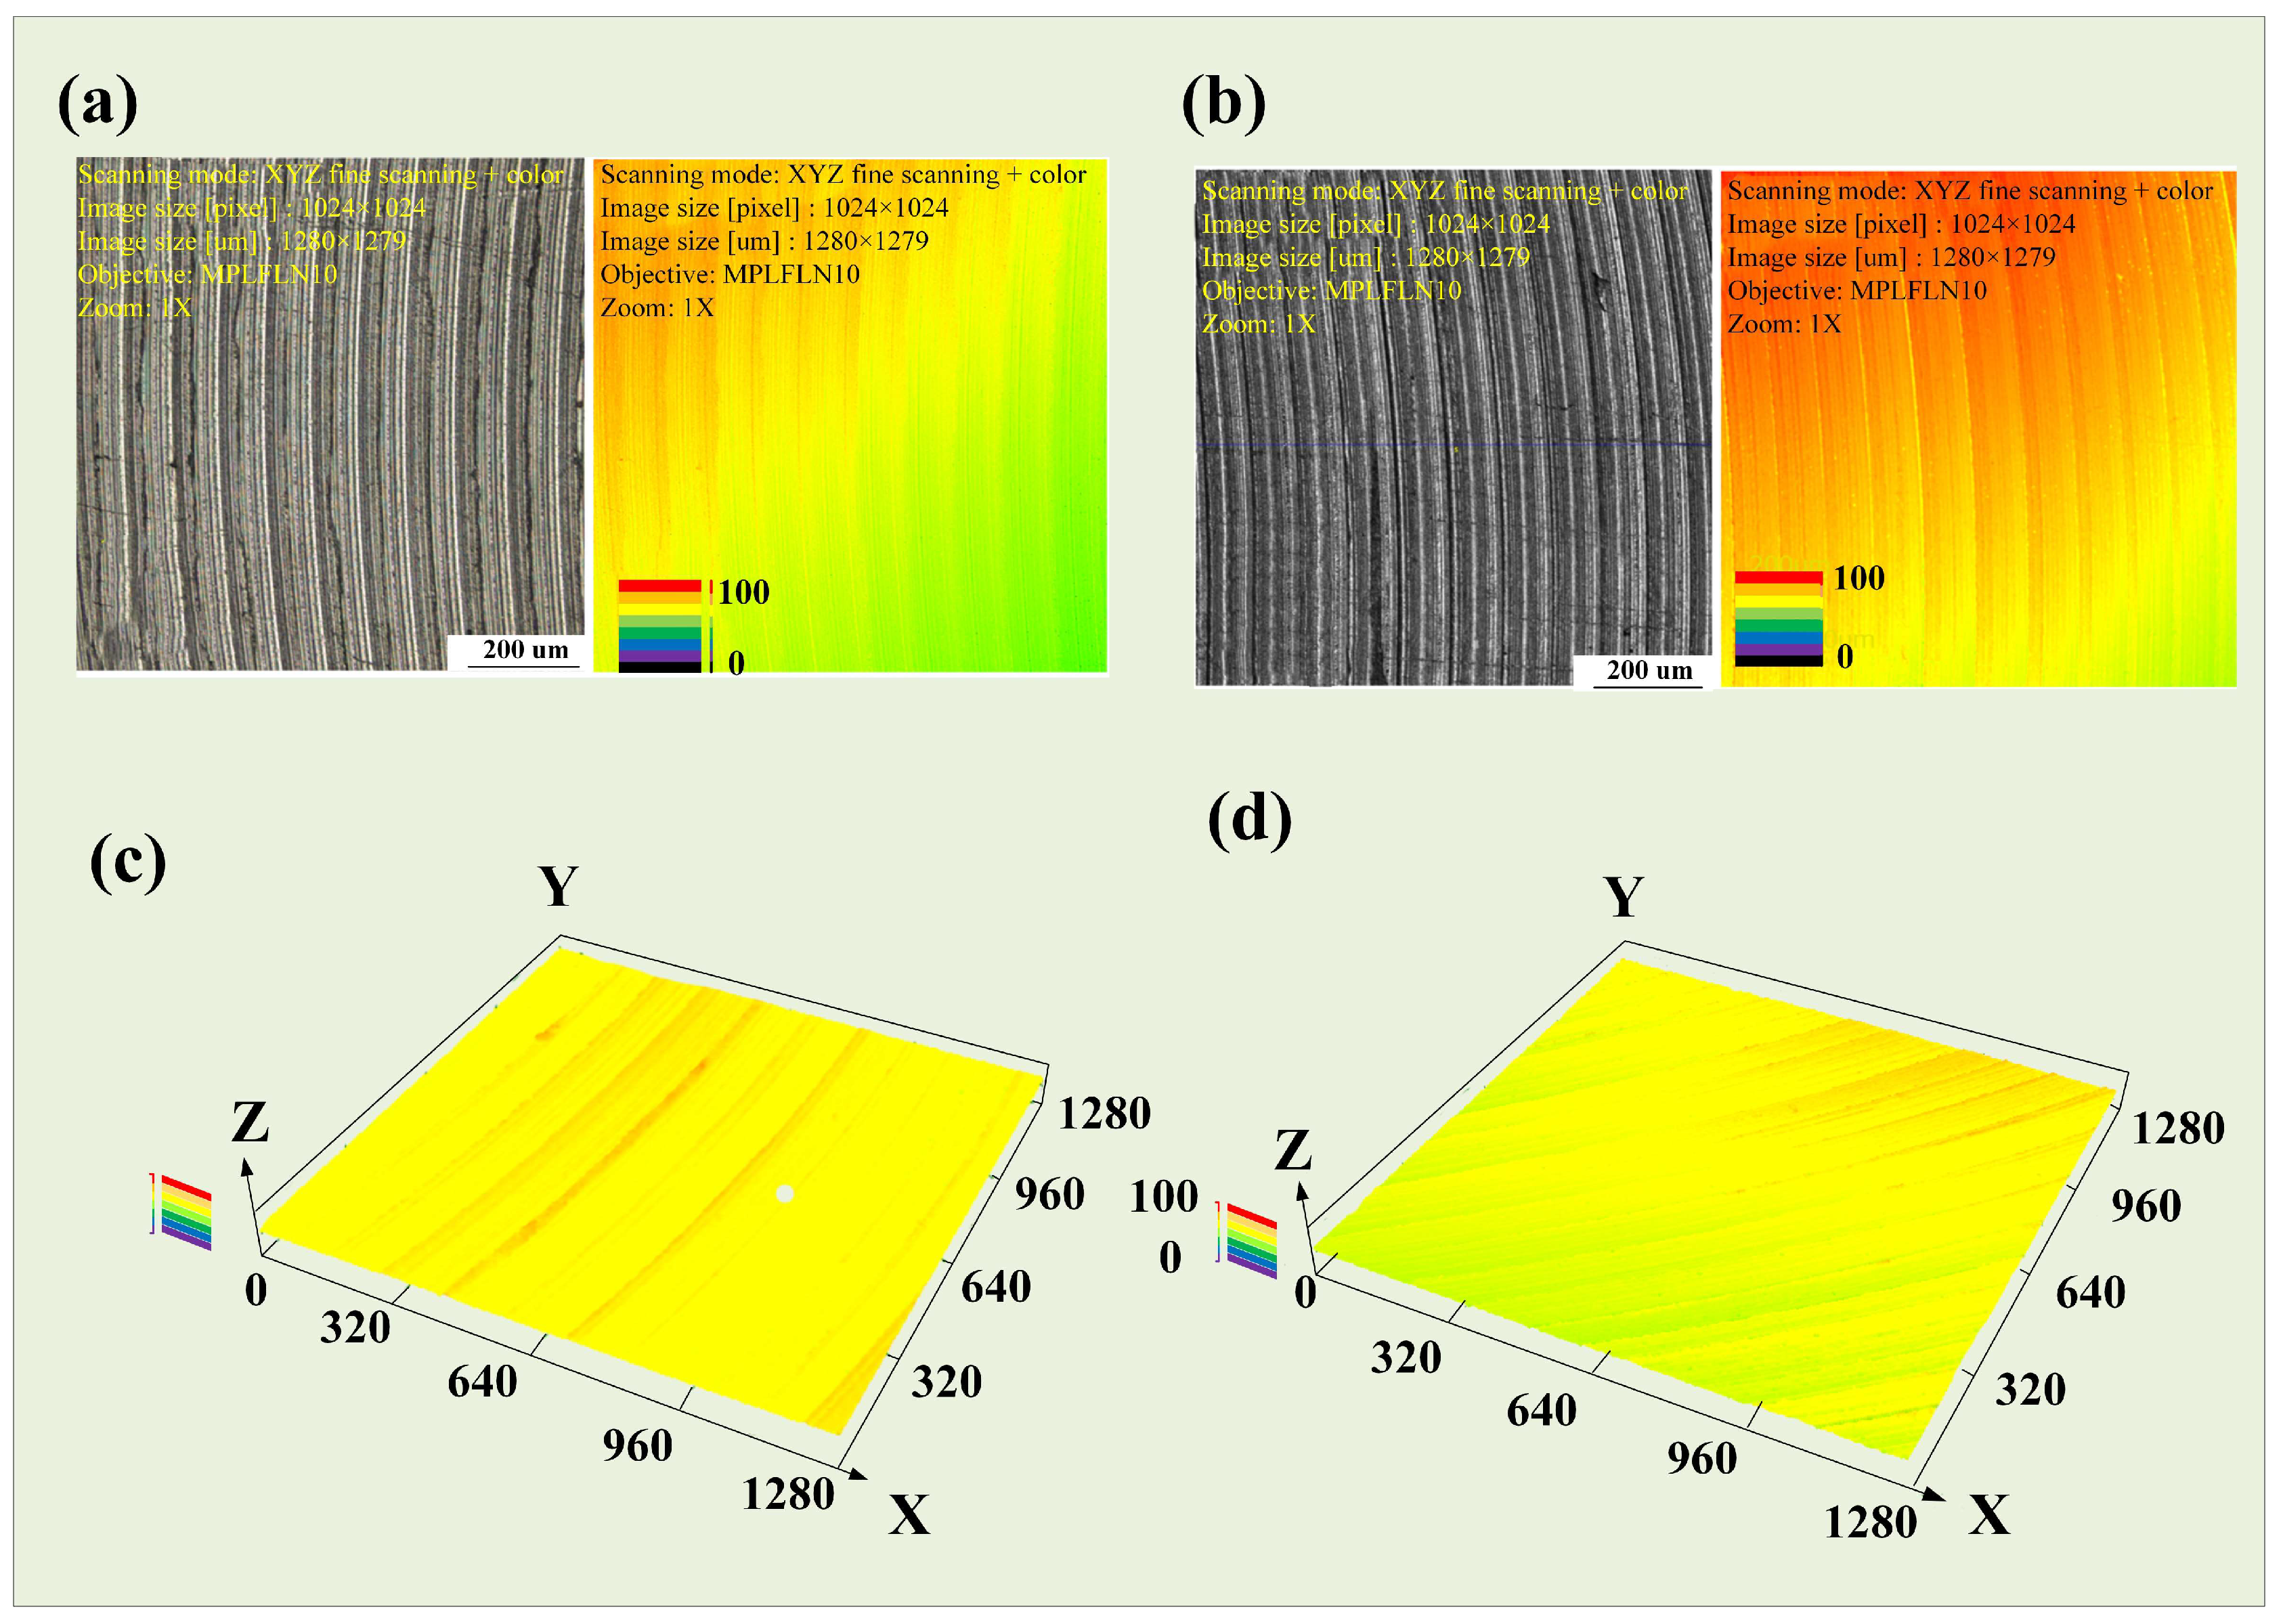
To clarify the differences between as-cast and as-deposited samples after milling, a precise scan of the processed surface morphology under the parameters at point P was conducted using LEXT, OLS4100 (Olympus, Shinjuku, Japan). The surface of the as-deposited sample was relatively uneven, while the surface of the as-cast sample exhibited a stepwise increasing trend. The tool marks were particularly pronounced after one complete rotation of the tool. In comparison, the height fluctuations on the surface of the as-deposited sample were larger. This difference was visually represented in the two-dimensional surface maps (
Figure 5a,b) and three-dimensional topography maps (
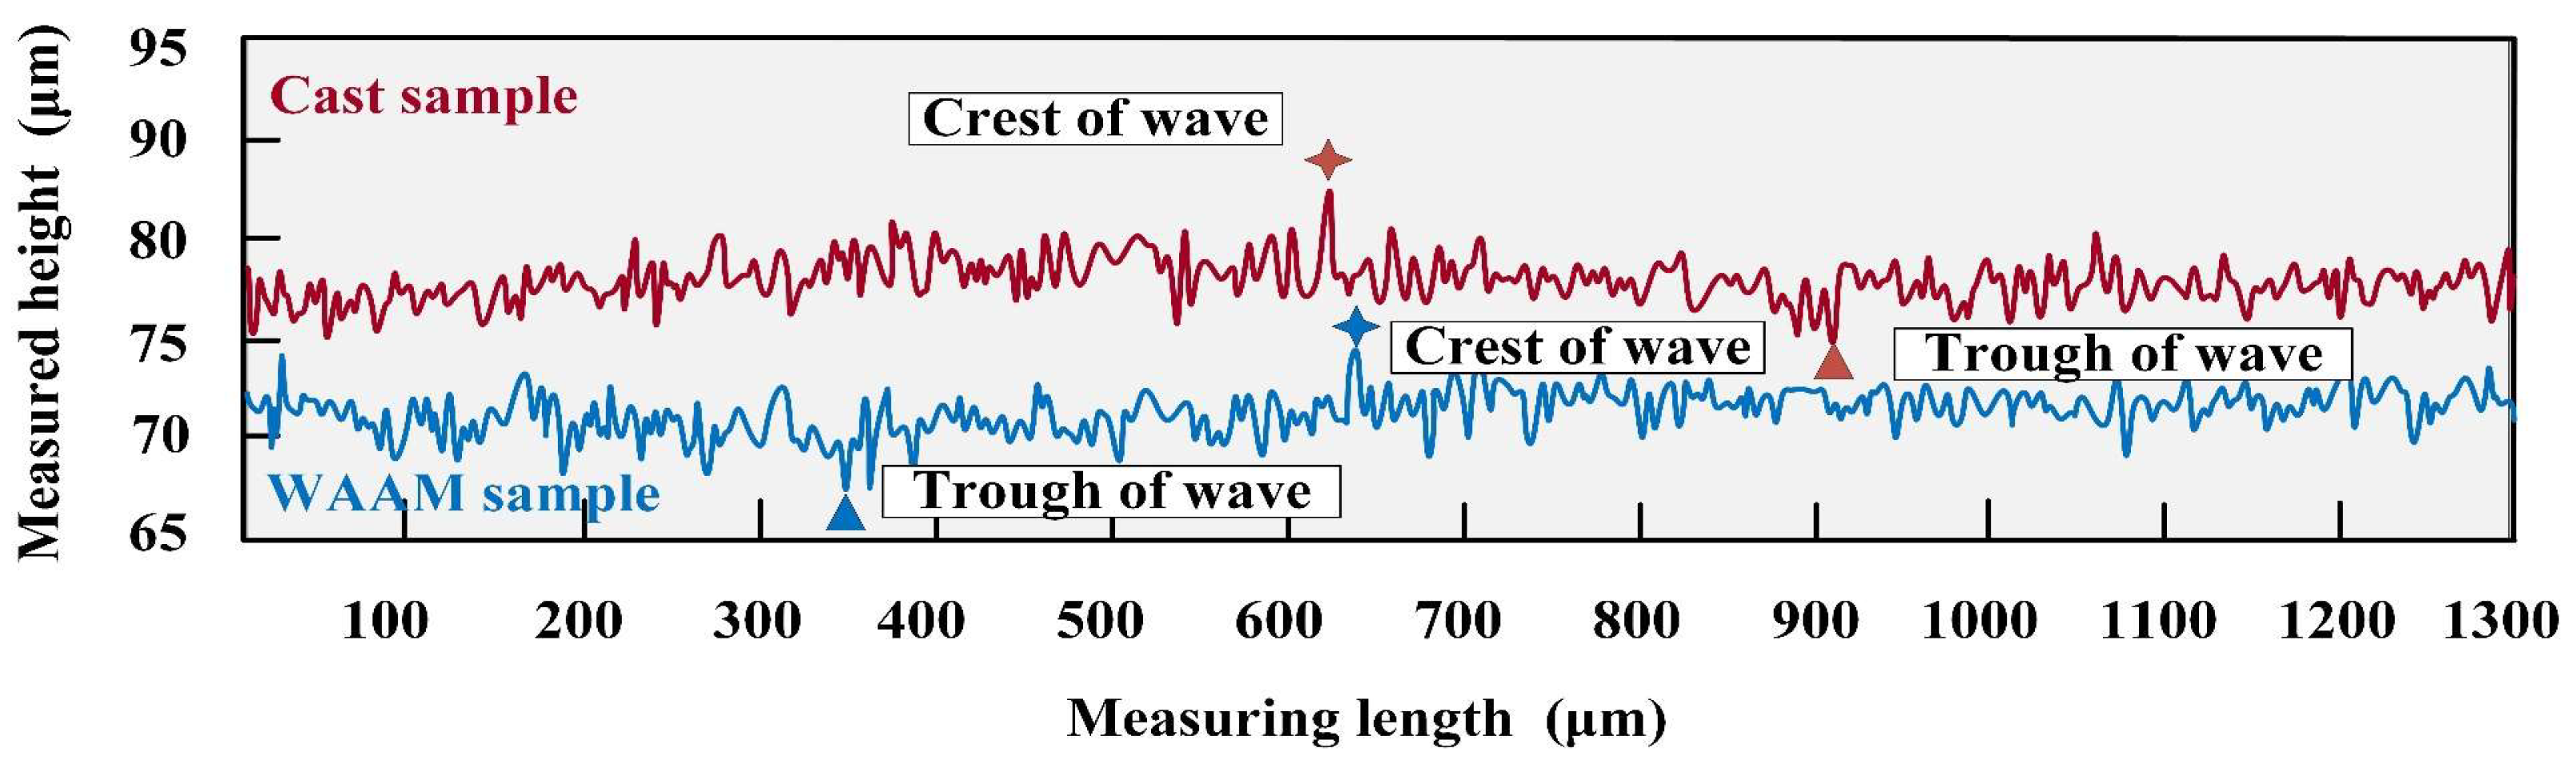
Figure 5c,d). Further measurements of the surface contours on the same measurement plane revealed that the difference in height between the as-deposited and as-cast samples reached 10.125
at the same height. The difference between the peak and valley of the as-cast sample was 7.503
, while that of the as-deposited sample was 13.512
, indicating greater surface fluctuations on the as-deposited sample; the results are shown in
Figure 6.
3.2. Feed Rate
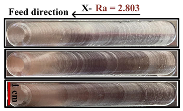
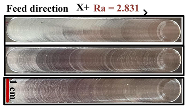
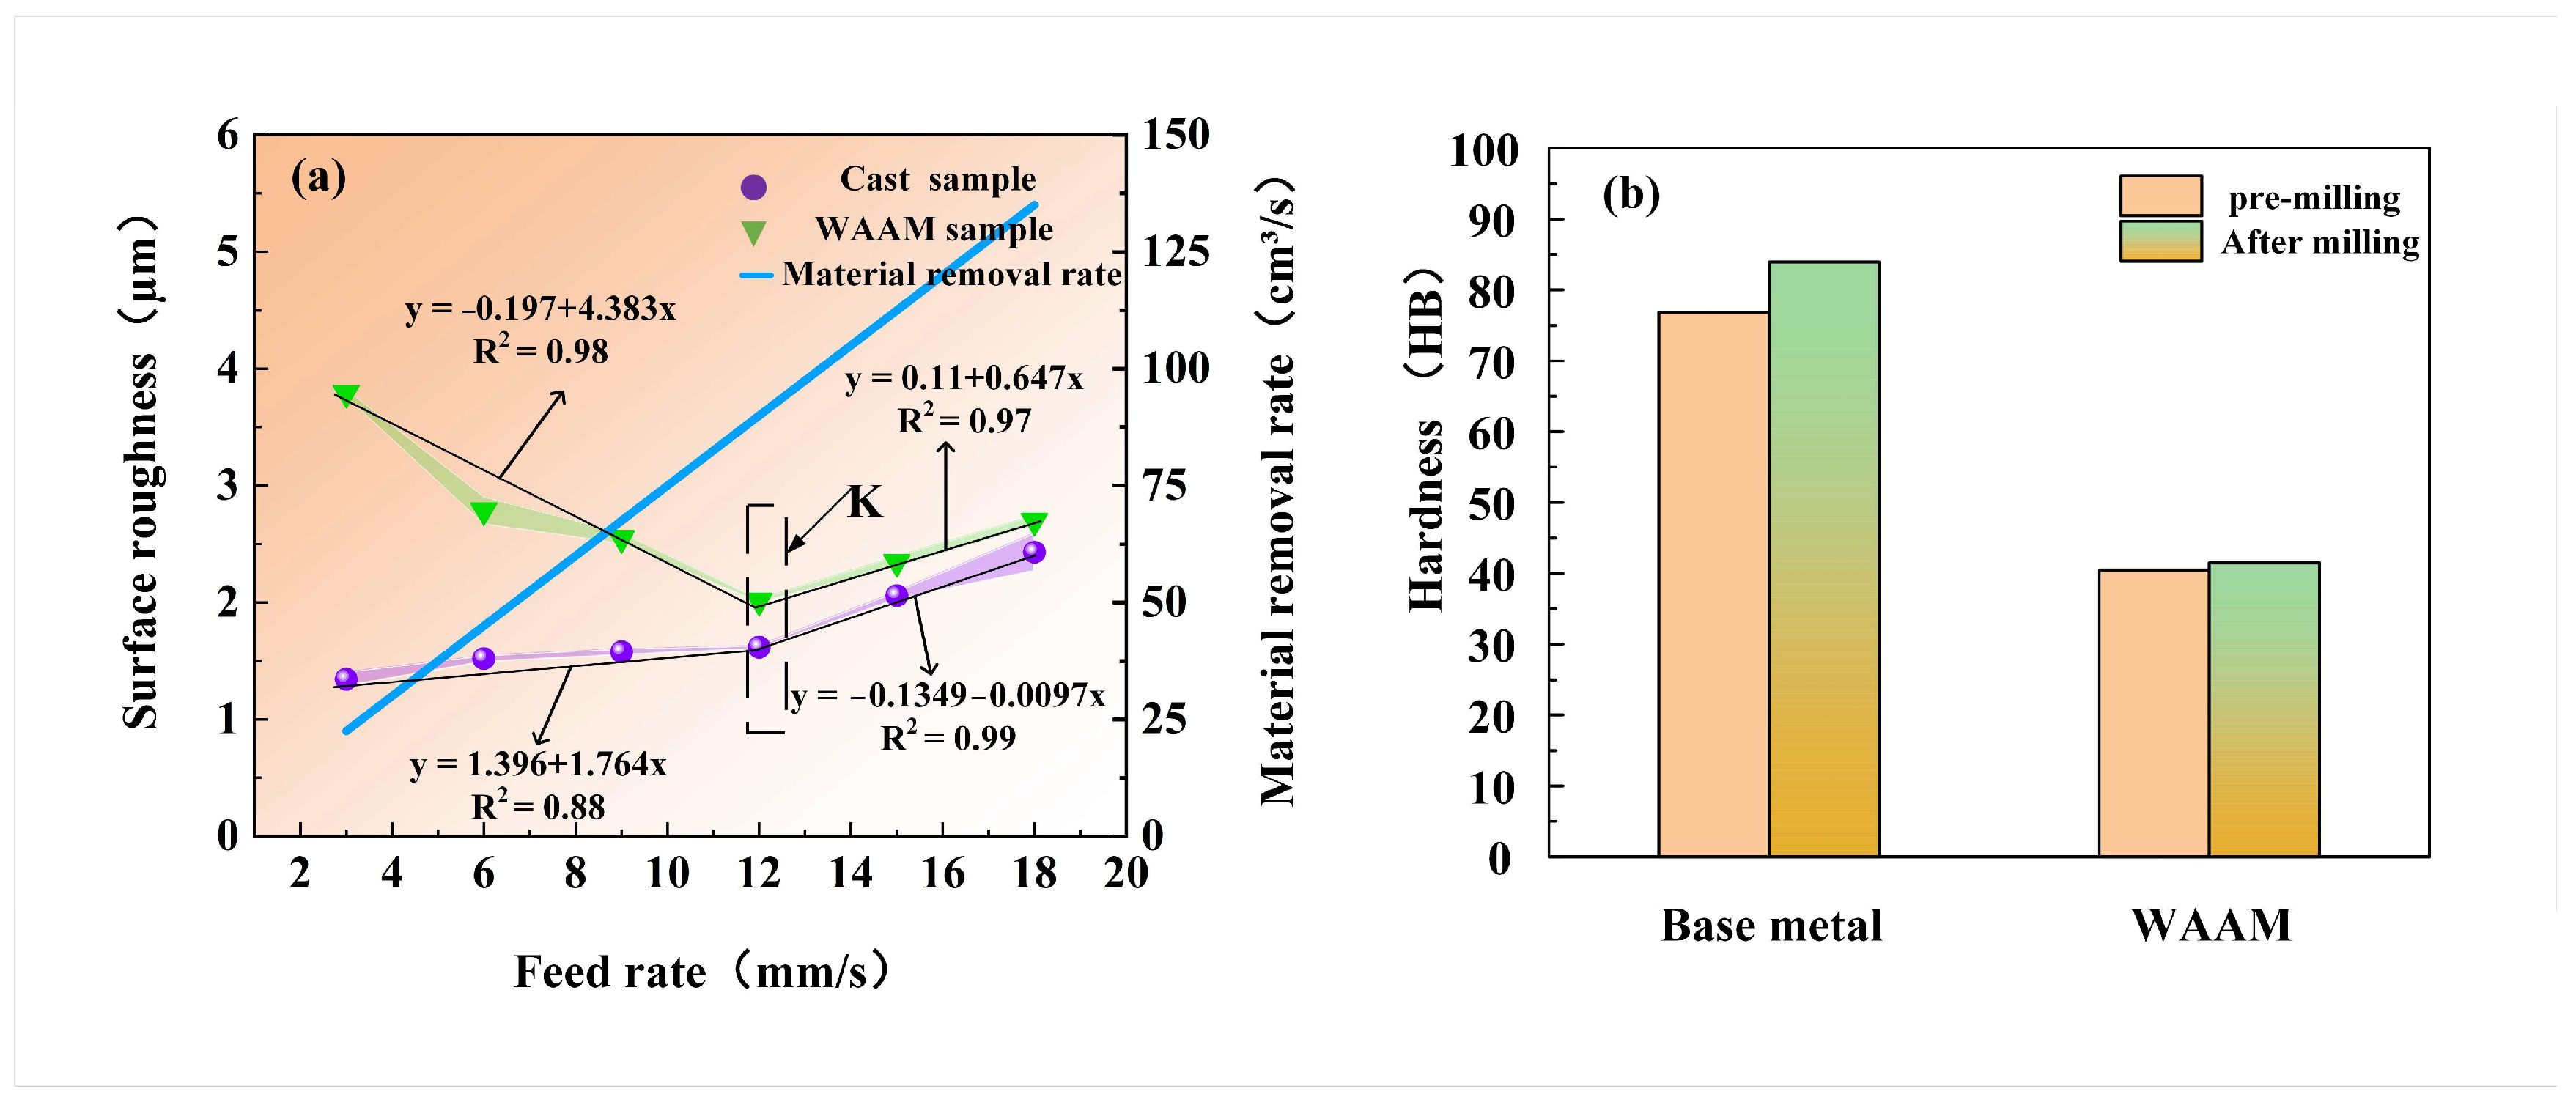
The relationship between feed rate and surface roughness is shown in
Figure 7a. In the results, it is observed that the surface roughness of the as-cast sample increases with the increase in feed rate, ranging from 1.341
to 2.523
. When the feed rate is within the range of 2.5 mm/s to 12 mm/s, the rate of increase in surface roughness is relatively slow; when the feed rate exceeds 12 mm/s, the growth rate of surface roughness accelerates significantly. On the contrary, the surface roughness of the as-deposited sample shows a different trend with the variation in feed rate, ranging from 2.013
to 3.791
. Within the feed rate range of 2.5 mm/s to 12 mm/s, the surface roughness decreases rapidly with the increase in feed rate; however, when the feed rate exceeds 12 mm/s, the surface roughness begins to increase with the increase in feed rate. Notably, when the feed rate reaches 12 mm/s, the as-deposited sample exhibits the best surface quality.
To investigate the impact of feed rate on material hardness, samples under the inflection point K (spindle speed of 4500 r/min, feed rate of 12 mm/s, and cutting depth of 0.75 mm) were selected for hardness analysis. The results show that the hardness of the as-cast sample before milling is 76.901 HB, which increases to 86.433 HB after milling, while the hardness of the as-deposited sample before milling is 40.752 HB, and it increases slightly to 41.350 HB after milling, as shown in
Figure 7b. This indicates that, under these parameters, the surface hardening of the as-cast sample is more significant after milling while the surface hardening of the as-deposited sample is relatively weaker.
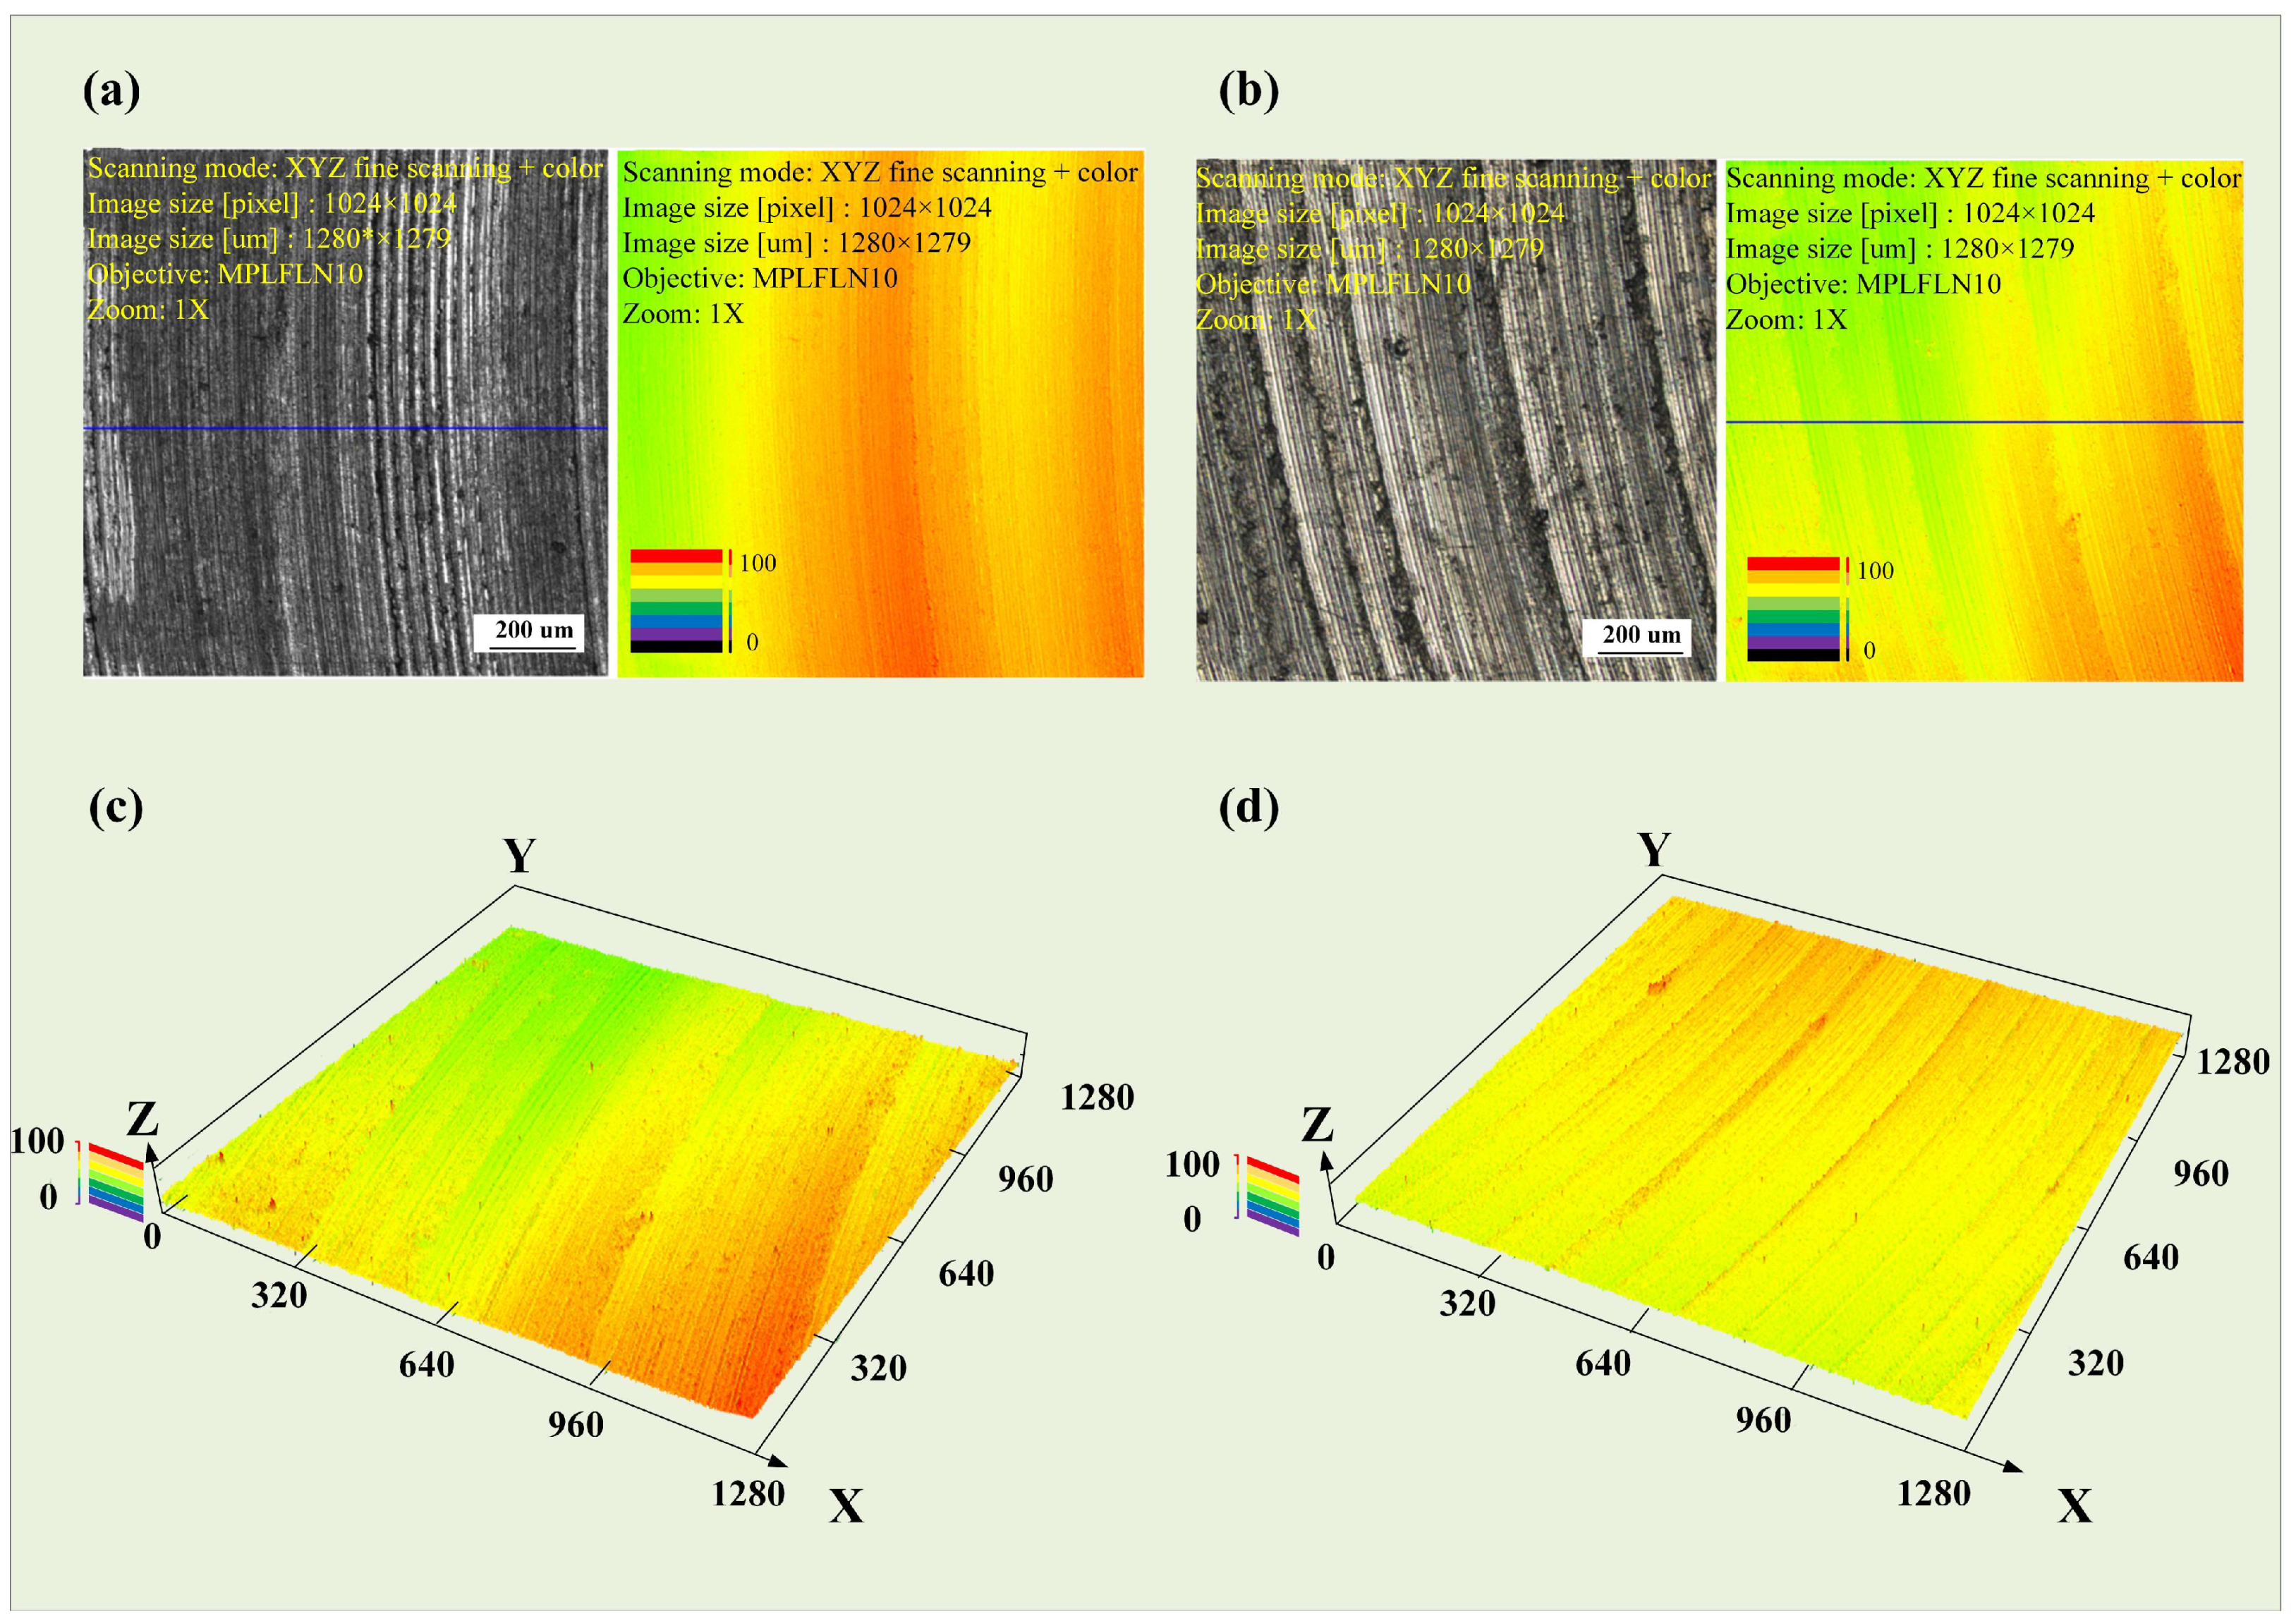
The two-dimensional surface morphologies of the as-cast and as-deposited samples at point K are shown in
Figure 8a,b, respectively, while the three-dimensional morphologies are presented in
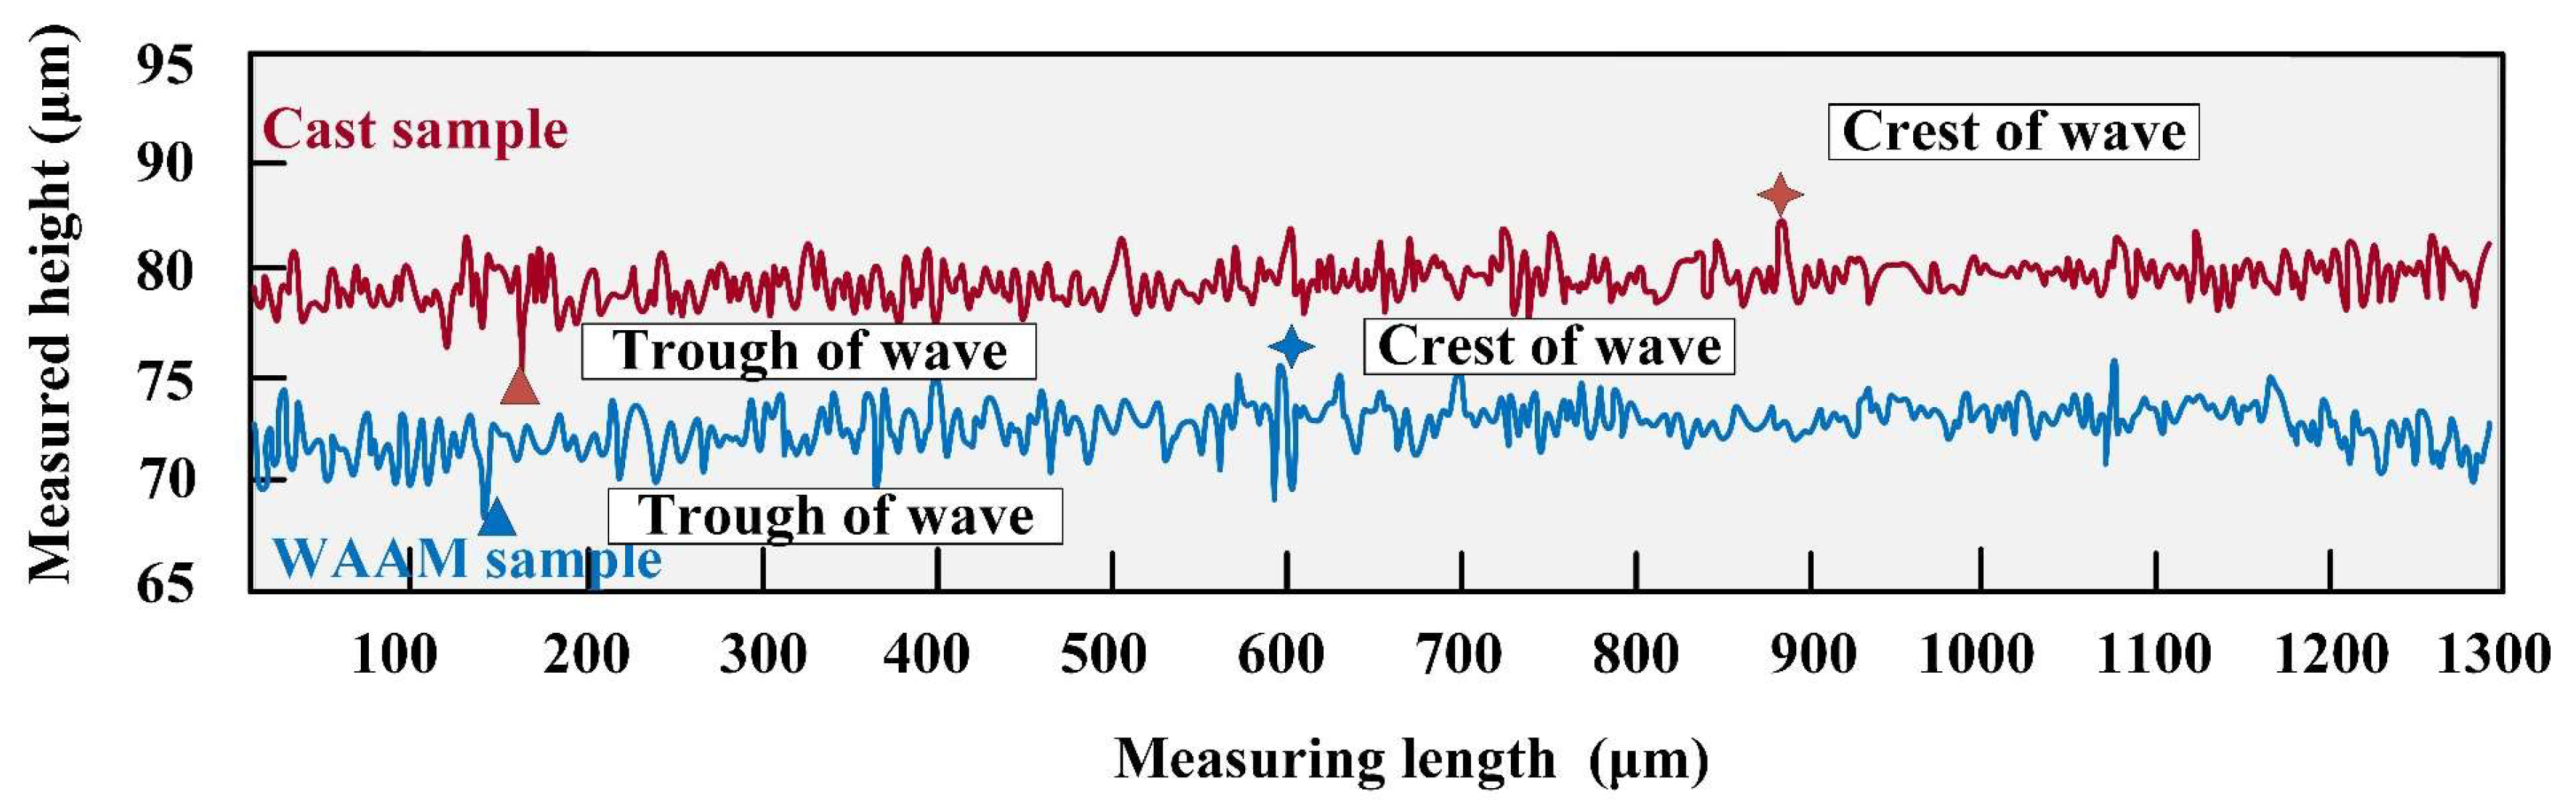
Figure 8c,d, respectively. The results indicate that, under these parameters, the tool marks on the as-deposited sample are more pronounced, whereas the surface of the as-cast sample has a greater degree of undulation. The difference between the peak and valley of the as-cast sample is 7.503
, and the difference between the peak and valley of the as-deposited sample is 8.516
. Under these experimental parameters, the tool marks on both samples are not significant, and the processed surfaces are relatively smooth. However, the surface undulation of the as-cast sample is still slightly greater than that of the as-deposited sample. The results are shown in
Figure 9.
3.3. Cutting Depth
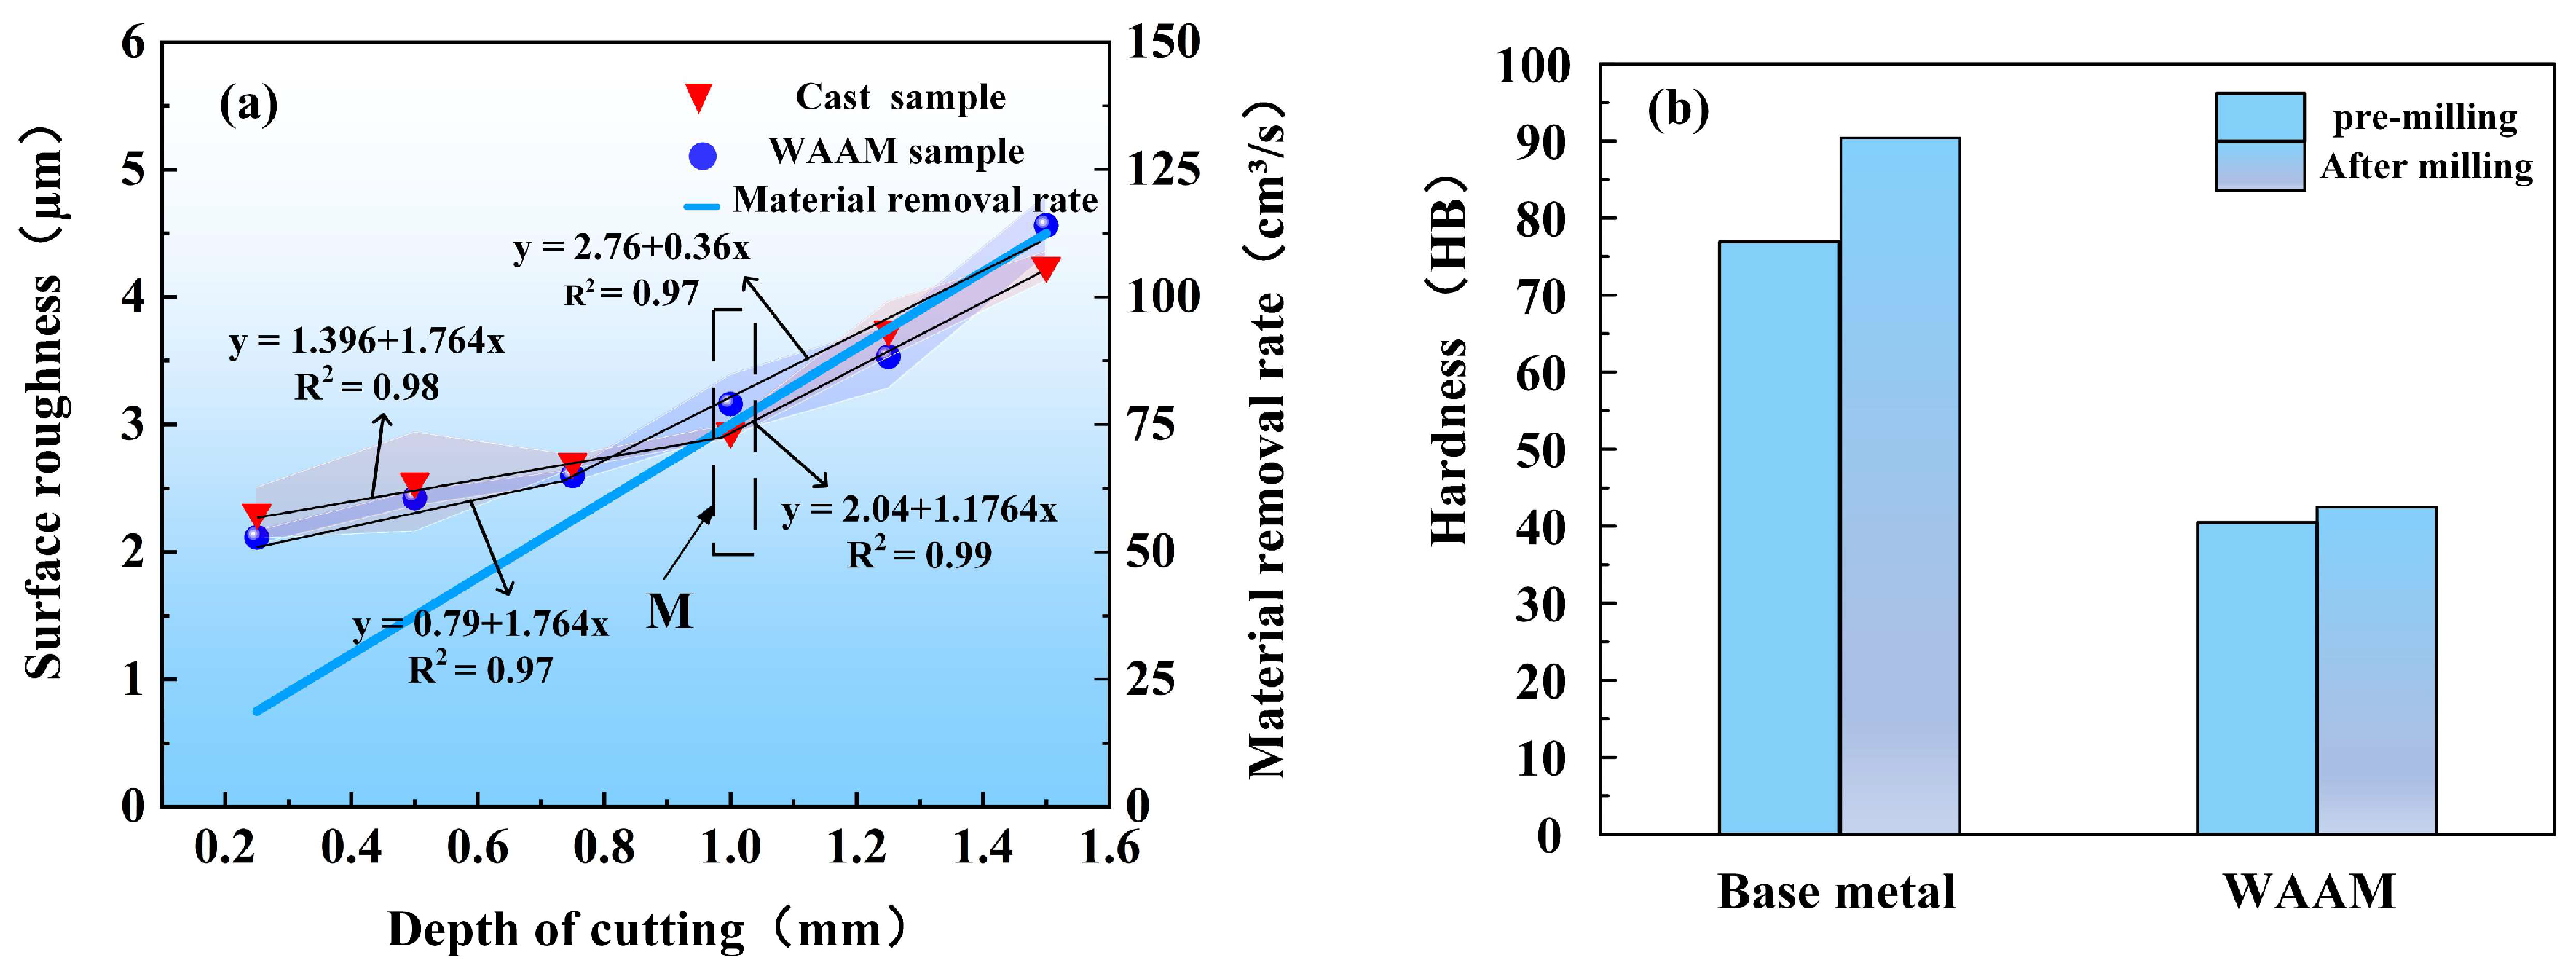
The relationship between cutting depth and surface roughness is shown in
Figure 10a. For both as-cast and as-deposited samples, the surface roughness increases with the increase in cutting depth. The surface roughness of as-cast samples varies between 2.420
and 4.562
, while the range for as-deposited samples is between 2.311
and 4.310
. As the cutting depth increases, the surface roughness of as-cast samples exhibits a significant upward trend. Especially when the cutting depth exceeds 0.75 mm, the deterioration in surface quality becomes particularly severe. Based on this, this study selects samples at the inflection point M under specific parameters (spindle speed of 4500 r/min, feed rate of 7.5 mm/s, and cutting depth of 0.75 mm) for hardness analysis. The results indicate that the original hardness of as-cast samples is 76.906 HB, which increases to 88.603 HB after milling. For as-deposited samples, the original hardness is 40.751 HB, and it slightly increases to 41.051 HB after milling, as shown in
Figure 10b.
Under these parameters, although there are slight tool marks on the processed surface, it is still relatively smooth overall. The two-dimensional surface morphologies of as-cast and as-deposited samples are shown in
Figure 11a,b, respectively, while their three-dimensional morphologies are presented in
Figure 11c,d, respectively. The difference between the peak and valley in the as-cast sample is 10.265
, while the difference in the as-deposited sample is 7.518
. Under the current parameters, the tool marks on both samples are not significant, and the overall processed surface is relatively smooth, as shown in
Figure 12.
3.4. Multiple Factors
Based on the measured results shown in
Table 3, a second-order regression model relating surface roughness to spindle speed, feed rate, and cutting depth was obtained using the Design-Expert software. Subsequently, an ANOVA analysis was conducted.
It can be seen from
Table 4, the coefficient of determination R
2 for the response model of the as-cast sample is 0.9705, indicating that the model can account for 97.05% of the variation in the response. The correlation coefficient is close to 1, suggesting a good fit of the model. According to the analysis of variance (with a significance level of α = 0.05, corresponding to a confidence interval of 0.95), the model has an F-value of 25.59 and a
p-value of 0.0002, which is significantly smaller than 0.05, indicating a high level of significance. Based on the
p-value, the rotational speed A and the cutting depth C have a significant impact on the surface quality. For the as-deposited sample, the coefficient of determination R
2 for the response model is 0.9753, suggesting that the model can explain 97.53% of the variation in the response. The correlation coefficient is close to 1, indicating a good fit of the model. The analysis of variance (with a significance level of α = 0.05, corresponding to a confidence interval of 0.95) reveals an F-value of 15.57 and a
p-value of 0.0084, which is significantly smaller than 0.05. Therefore, the model demonstrates a high level of significance. Based on the
p-value, the influence of the three parameters can be ranked as follows: feed rate > rotational speed > cutting depth.
The surface roughness of as-cast samples ranges from 2.011
to 5.512
, while the surface quality of as-deposited samples fluctuates between 2.203
and 4.928
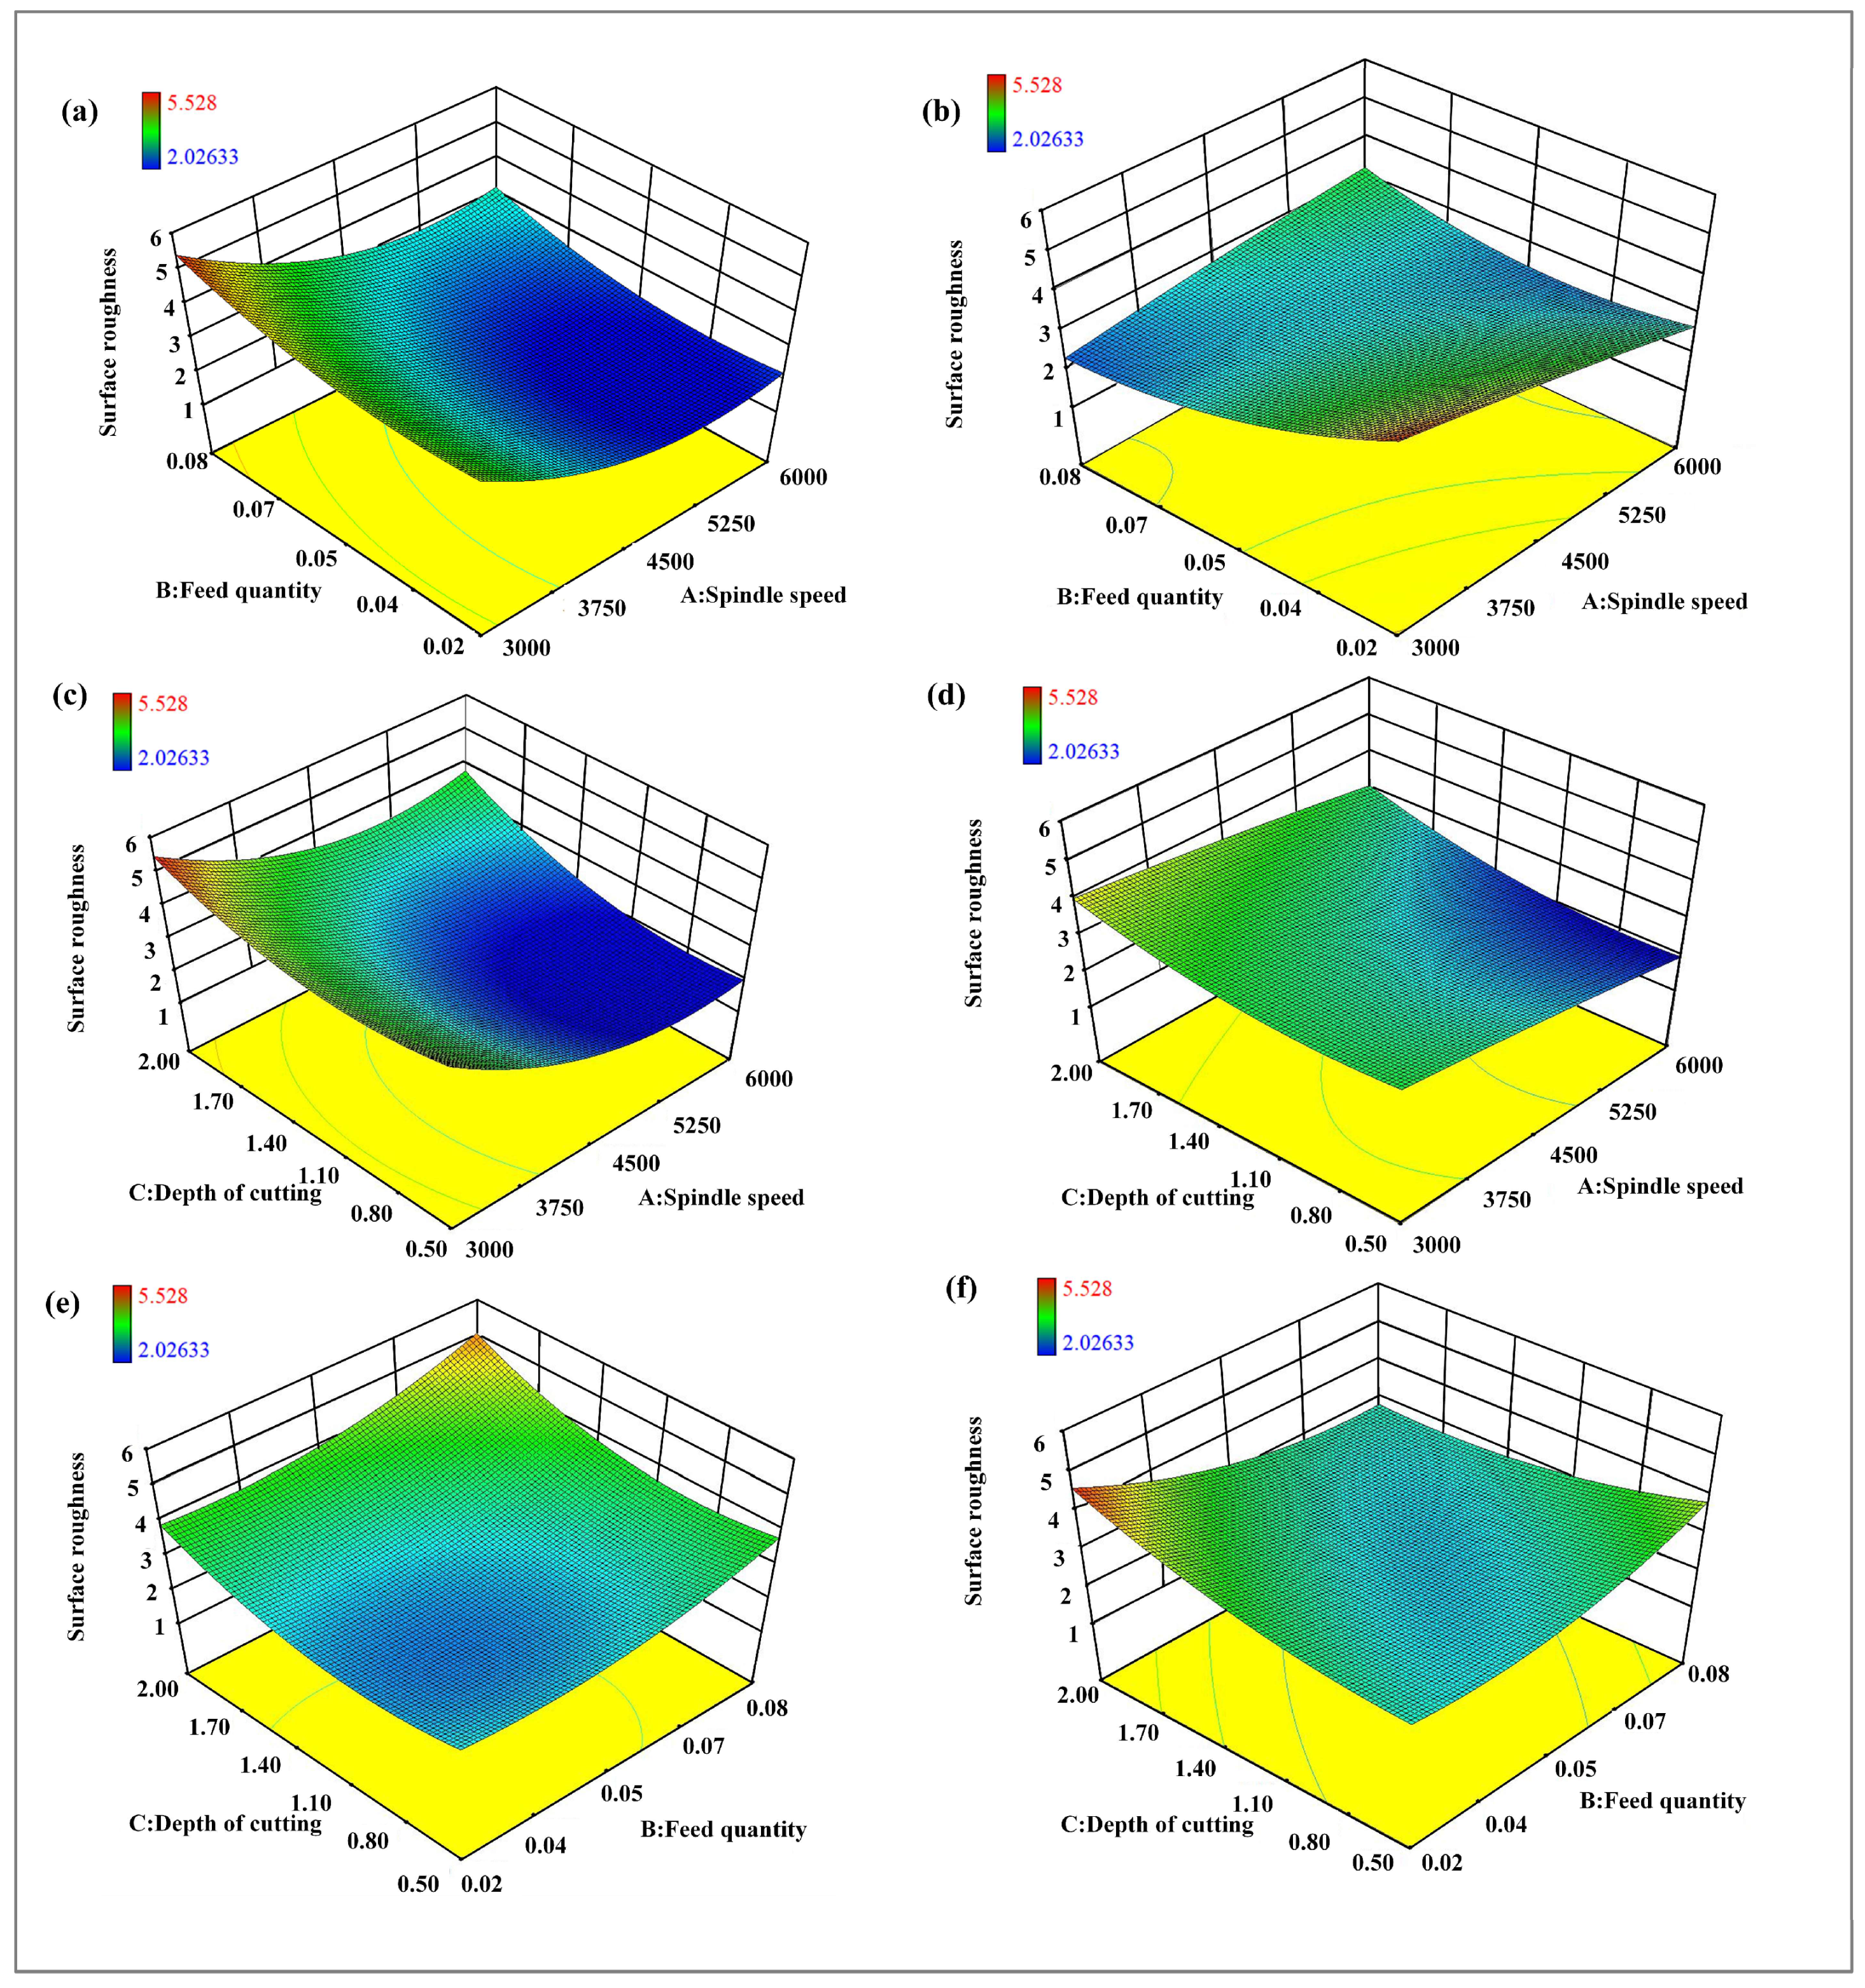
. When adjusting different milling parameters, the milling surface quality of as-deposited samples exhibits relatively stable characteristics. Through the study of multi-factor interactions, as shown in
Figure 13, it is observed that the surface roughness of as-cast samples gradually increases as the spindle speed decreases and the feed rate increases. Conversely, when the spindle speed reaches its peak and the feed rate is adjusted to its minimum, the surface quality of as-cast samples achieves the optimal state. For as-deposited samples, the surface roughness tends to increase as the spindle speed decreases and the feed rate decreases. The comparison indicates that there is a significant difference in the impact of feed rate on the surface roughness between the two types of samples.
The interaction between cutting depth and spindle speed has been investigated. For as-cast samples, the surface roughness increases as the cutting depth increases and the spindle speed decreases. However, in as-deposited samples, the surface roughness is relatively smooth, and the contour lines are not densely distributed, which suggests that the impact of cutting depth and spindle speed on the surface roughness of additive manufactured samples is not significant.
Regarding the interaction between cutting depth and feed rate, it is found that the surface roughness of as-cast samples increases as both parameters increase. Especially under the conditions of minimum feed rate and shallowest cutting depth, the surface quality of as-cast samples is the best. As-deposited samples exhibit similarities to as-cast samples in this aspect, but with a relatively weaker response.
4. Discussion
Significant differences exist in surface roughness between as-cast and as-deposited samples under milling parameters. In terms of spindle speed, as the spindle speed increases, the surface quality of both sample types exhibits an improving trend. This phenomenon can be attributed to the increased number of cutting actions per unit time due to the higher speed, which enhances metal cutting efficiency and improves surface roughness precision. When the spindle speed is too low, continuous chips are easily formed, leading to reduced surface quality. Simultaneously, the low speed reduces the generation of cutting heat, which helps to mitigate plastic deformation and thermal influence of the material, benefiting surface quality improvement [
20]. As the speed further increases, the decreasing trend in surface roughness gradually slows down. The reason is that the elevated temperature in the cutting area leads to local softening of the metal, affecting material flow and hardness [
21,
22,
23]. Although cutting forces decrease and vibrations and deformations reduce, the high viscosity of the material may cause chips to adhere to the cutting tool, resulting in surface damage. At this point, the negative impact of viscosity outweighs the positive impact of reduced hardness [
24]. When the spindle speed increases to 6000 r/min, although the surface becomes smoother, the reduction in roughness tends to be minimal.
Due to the lower hardness of as-deposited samples, which is 43% lower than that of as-cast samples, when the spindle speed is low, the milling process generates smaller cutting forces and less elastic–plastic deformation, leading to a significantly better surface quality of as-deposited samples under the same milling parameters compared to as-cast samples [
25]. In milling processes, surface morphology and roughness are primarily influenced by two factors: one is the scallop height caused by the rake angle of the cutting edge and the other is the plastic deformation of the material due to extrusion and recovery by the cutting edge. The wall morphology and roughness are mainly determined by the scallop height between cylindrical surfaces formed by tool feed and material plastic deformation. Differences in force during processing can lead to variations in surface quality. Due to the lower hardness and higher plasticity of as-deposited samples, milling can easily produce a built-up edge (BUE), resulting in a poorer surface roughness of the workpiece. As the spindle speed increases, the tendency for BUE formation is eliminated, improving surface quality. However, with further increases in spindle speed, the heat generated per unit time increases, raising the milling temperature in the deformation zone, leading to softening of the chip’s bottom layer and forming an extremely thin micro-melted layer [
26], which reduces the friction coefficient on the rake face, thus showing a trend of decreasing surface roughness. But, when the spindle speed increases to a high level, the excessive heat generated during milling leads to excessively high milling temperatures, making it difficult for the heat accumulated on the contact surface between the tool and the workpiece to dissipate quickly [
27]. The adhesion between the chip and the milling cutter, as well as the processed surface, increases, causing the chip to melt and adhere, resulting in the phenomenon of a BUE. This increases the milling force. As the spindle speed rises, the frequency of this phenomenon increases, and the negative impact caused by changes in material viscosity dominates. Therefore, when the spindle speed exceeds 4500 r/min, the processed surface begins to deteriorate. For as-deposited materials, this critical speed value has not been reached. Although both material states experience softening due to local temperature increases during milling, the aluminum alloy undergoes mechanical stress during processing, leading to work hardening of the processed surface after cooling, as shown in
Figure 4b. Work hardening occurs when the metal is plastically deformed, and the crystal structure becomes denser, increasing hardness in some areas.
For as-deposited samples, when the feed rate increases from 3 mm/s to 12 mm/s, the surface roughness of the samples decreases from 3.791
to 2.013
, a reduction of 46.8%, showing a trend opposite to that of as-cast samples. In arc additive manufacturing, the heating area of the ion arc column is large, and the energy is relatively dispersed. After the material cools down, certain residual stresses are generated. High residual stresses can cause micro-cracks in the material to propagate, forming cutting zones and cutting marks during milling, leading to increased surface roughness. When the feed rate is low, it can cause excessive cutting, which is unfavorable for the discharge of cutting heat with the chip, resulting in poorer surface quality [
28,
29]. However, when the feed rate increases, the amount of material removed per tooth increases, and the chip thickness increases. Within a certain range, thicker chips can more effectively remove heat from the cutting area, reducing the size of the thermally affected zone. Additionally, thicker chips can also reduce friction between the tool and the processed surface, thereby reducing the likelihood of scratching and burning. At this point, the positive effect of thermal influence factors outweighs the negative effect of increased cutting forces, so the surface roughness of the workpiece decreases and the surface quality improves significantly. When the feed rate exceeds 12 mm/s, the surface roughness of the part begins to increase. This is because, as the cutting thickness increases, the cutting force increases sharply, generating a large amount of cutting heat, which raises the temperature in the cutting area, reduces material viscosity, and leads to poorer surface quality. Furthermore, differences in hardness, density, and material ductility between as-deposited and as-cast samples lead to different results.
Regarding the cutting depth, during the milling process, the surface roughness of the as-cast sample is 2.102
when the cutting depth is 0.25 mm. As the cutting depth increases to 1.5 mm, the surface roughness rises to 4.613
, resulting in a 115.8% deterioration in surface quality for the as-cast sample and a 112% deterioration for the as-deposited sample. This is because the cross-sectional area of the material shear zone increases with the cutting depth, leading to an increase in the material removal rate per unit time. This, in turn, causes a sharp increase in milling force, resulting in an increase in adhered particles and scratches on the surface and a deterioration in surface quality. When the cutting depth of the as-deposited sample is less than 1 mm, the axial cutting force varies less, resulting in better surface quality. Furthermore, an increase in cutting depth also leads to an accumulation of frictional heat during the cutting process, which raises the cutting temperature. High temperatures can cause plastic deformation of the material and the diffusion of thermally affected areas, further impacting the surface quality [
30].


