Abstract
In this article, the sol–gel method was used as a synthesis method, which shows the physicochemical nature of the synthesis of a new complex material, ferrite Li0.5MnFe1.5O4. The structure and composition of the synthesized ferrite were determined by X-ray phase analysis. According to analysis indicators, it was found that our compound is a single-phase, spinel-structured, and syngony-cubic type of compound. The microstructure of the compound and the quantitative composition of the elements contained within it were analyzed under a scanning electron microscope (SEM). Under a scanning electron microscope, microsystems were taken from different parts of Li0.5MnFe1.5O4-type crystallite; the elemental composition of crystals was analyzed; and the general type of surface layer of complex ferrite was shown. As a result, given the fact that the compound consists of a single phase, the clarity of its construction was determined by the topography and chemical composition of the compound. As a result, it was found that the newly synthesized complex ferrites correspond to the formula Li0.5MnFe1.5O4. The particles of the formed compounds have a large size (between 50.0 μm or 20.0 μm and 10.0 μm). Electrophysical measurements were carried out on an LCR-800 unit at intervals of 293–483 K and at frequencies of 1.5 and 10 kHz. An increase in frequency to 10 kHz led to a decrease in the value ε in the range of the studied temperature (293–483 K).
1. Introduction
Research in nanotechnology is a rapidly developing field at the forefront of physics and continues to be of particular interest to the scientific community [1]. Multifunctional materials, in particular, are studied for their effective properties combined in one smart compound [2,3]. A wide range of intelligent materials has been presented, and among them, significant attention has been paid to ferrites, which are considered promoter hosts due to their very prominent features [4,5].
Important results in this category of ceramics generally show excellent physicochemical properties, such as environmental mental health [6], chemical stability [7], high electrical resistance [8], and low price availability [9]. It is worth noting that in order for spinel ferrites to be useful for potential technological applications, a promising road was laid. Some prominent review articles indicate that the use of spinel ferrites for biomedical applications may be unavoidable due to their high biocompatibility [10] and low toxicity [6]. They have also been shown to have special properties for magnetic hyperthermia and magnetic resonance imaging [11,12]. Similarly, many discoveries have confirmed the development of this type of material as a suitable approach for ferrofluidic technology [13], wastewater treatment, catalysts [14], selective sun absorbers [15], and medical instruments [16].
With impressive properties such as conductivity, magnetic behavior, and high-temperature magnetic transition, mixed ferrites are soft ferrimagnetic compounds that show that they already exist in the field of technology. These materials are important due to their careless magnetization in room conditions [17,18].
The widespread use of spinel ferrites is due to their low price, easy preparation, and abundant use in technological and industrial applications [19]. The technological and industrial applications of these magnetic materials are due to their excellent electrical and magnetic properties, which leads to their use in magnetic memory devices, transformers, high-frequency applications, and electronic devices, such as mobile phones, camcorders, laptops, and computers [20].
Many researchers have studied the structural, electrical, and magnetic properties of various Li-based ferrites, such as Li-Mn [21], Li-Ni [22], Li-Co [23], Li-Mg [24], Li-Cr [25], Li-Zn [26], and Li-Ti [27], which are manufactured by a ceramic method. However, ferrite prepared by the ceramic method involves the synthesis of high calcination temperatures to complete the solid-state reaction between the constituent oxides or carbonates, and the particles are obtained in significantly larger and uneven sizes. This leads to the formation of voids, and then low-density ferrites, when uneven particles are compacted. To overcome these difficulties, the sol–gel method is the preferred method for synthesizing nanoferrite on a volumetric scale by obtaining homogeneous particles, and the most convenient method for synthesizing nanoparticles. This is because of the simplicity of this method; the low-cost precursors; the fact that the annealing process is carried out in a short time; good control of the amount of crystallite; and other properties of materials [28].
Nanoscale manganese ferrites exhibit interesting structural and magnetic properties. They have a wide range of applications, from basic research to industrial applications. In this work, the composition of ferrite nanoparticles is studied.
2. Materials and Methods
The sol–gel method was used as an effective way to synthesize a new mixed ferrite of a complex mixed composition. In order to determine the composition of a new complex mixed ferrite obtained by the sol–gel method, an X-ray phase study was carried out, and in order to conduct quantitative and qualitative analysis, an examination under a scanning electron microscope and a study of electrophysical properties (dielectric conductivity and electrical resistance) were carried out.
As a primary raw material, distilled water of a manganese (III) oxide (“chemical pure”) brand, iron (III) oxide (“chemical pure”) brand, and lithium conbanate (“chemical pure”) brand were used. Trihydric alcohol–glycerin and citric acid were used as gel-forming reagents. The raw materials obtained by stoichiometric calculation were weighed on an analytical balance with a maximum accuracy of 0.0001 g, mixed, ground in an agate sieve, placed in an Alund crucible, and fired in a muffle furnace at a temperature of 1100 °C.
The resulting dried gel was fired in a muffle oven for 10 h at a temperature of 600 °C until a black powder was obtained. Finally, the resulting powder was fired in stages for 7 h at a temperature of 700–1100 °C in the air [29].
The pycnometric density of ferrites was determined by a previously described method [30]. Toluene and distilled water were used as indifferent liquids. The density of composite materials was measured five times, and the average values were calculated.
3. Results and Discussion
3.1. X-Ray Analysis
X-ray analysis was carried out at the Kazakh National Women’s Pedagogical University on a diffractometer Miniflex/600 (Rigaku. Almaty, Kazakstan). Analysis using a sika beam (U = 30 KV, J = 10 MA, rotation speed 1000 pulses per second, time constant t = 5 s, 2θ, with an angle interval between 5 and 900) was carried out on a Miniflex 600 RIGAKU, and filtered by a filter.
During the X-ray observation of the synthesized mixed complex ferrite, it was observed that the amorphous state of the samples decreased; the crystallization process was complete; and the kinetics of the sol–gel reaction were low. In addition, it is proved from the diffractogram shown in Figure 1 below that the samples changed from an amorphous state to a fully polycrystalline state, and the independent phase was completely formed.
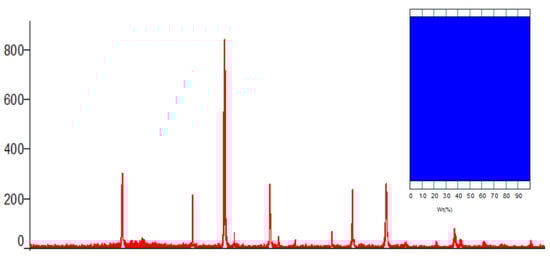
Figure 1.
X-ray diffractogram of the complex ferrite Li0.5MnFe1.5O4. Insert: phase ratio diagram.
Below are the results of the Rietveld method of indexing the diffractogram of the complex ferrite studied by X-ray analysis.
According to Scherrer’s formula, the average size of crystallites can be written as follows:
where
d—average size of crystals;
K—dimensionless particle shape coefficient (Scherrer constant);
λ—wavelength of X-ray radiation;
β—half-height reflex width (2θ in radians and units);
θ—diffraction angle (Bragg angle).
A new complex mixed ferrite synthesized by the X-ray phase analysis method has the unit number Z = 8. Li0.5MnFe1.5O4 is crystallized in a cubic wall-centered cell, and the space group is Cell parameters: a = 8.3677, b = 8.3677, and c = 8.3677. The average size of crystallites according to Scherrer’s formula through the X-ray wavelength of ferrite is 40.6 µm, and the correctness of the results of the X-ray studies was confirmed by the coincidence of the values of X-ray and pycnometric densities.
3.2. Scanning Electron Microscope Observations
The spectrum of the distribution of the element was studied by a scanning electron microscope (Sam) (Application Note team, Brooker, Berlin, Germany) in order to conduct quantitative and qualitative analysis, and study the percentage content of elements.
A scanning electron microscope (SEM) is designed to obtain a magnified image of an object by scanning it with an electron beam directed at it and recording the signal generated by the interaction of electrons with a detector. The small diameter of the probe, even at low accelerating voltages and high currents, allows for elemental analysis of samples with dimensions of the analyzed area of several tens of nanometers. The beam current detector is located on the microscope column below the aperture of the objective lens, so that the beam current can be monitored at any time during the analysis.
To study the morphology of the surface layer of samples of new complex mixed ferrite synthesized by the sol–gel method, an image of electric diffraction was studied using an electron microscope scanning luminous microstructures. Electron monographs of the compound taken in an imaging electron microscope are given in Figure 2a–c.
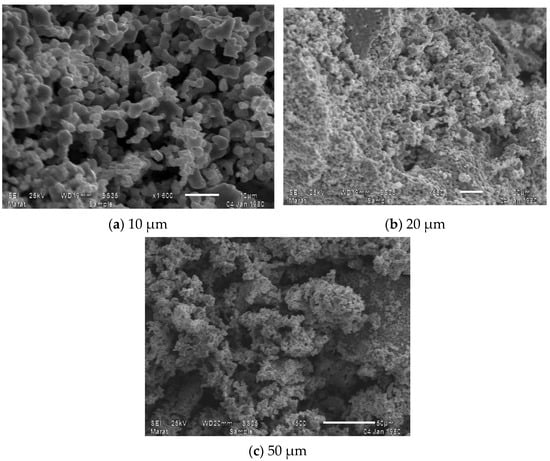
Figure 2.
Image of the new mixed complex ferrite Li0.5MnFe1.5O4 measured with three different micrometer accuracies: (a) 10 μm; (b) 20 μm; (c) 50 μm.
The above images show the results of micrographs taken at magnifications of 10.0 μm, 20.0 μm, and 50.0 μm, and also show the general appearance of the complex ferrite surface layer. As a result, given that the compound consists of one phase, the clarity of its structure was determined by the topography and chemical composition of the compound. Figure 3 shows the spectrum patterns of the newly synthesized mixed complex ferrite Li0.5MnFe1.5O4 and the elemental analysis results of the Li0.5MnFe1.5O4 compound.
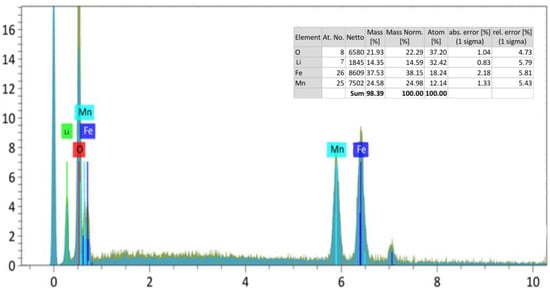
Figure 3.
Spectrum samples of the Li0.5MnFe1.5O4 compound. The results of the element analysis are built-in.
Based on the distribution map of elements, on the basis of solving the nature of crystallization, the chemical composition with microstructure and distribution zones of chromium, iron, lithium, and oxygen atoms were studied. As a result of the numerical elemental composition study, it can be concluded that iron, chromium, lithium metals, oxygen, and carbon atoms are distributed in the 10.0 μm regions (Figure 2a). With an imaging electron microscope, it is possible to obtain nanoscale measurements of solids in powder form.
The spectrum of the distribution of the element was studied using a scanning electron microscope in order to conduct quantitative and qualitative analysis, and study the percentage content of elments. The spectrum samples of the synthesized new mixed complex ferrite and the results of the elemental analysis are shown in Figure 3.
3.3. Electrophysical Research
This was carried out according to methods of measuring electrophysical properties [31,32].
The study of electrophysical properties (dielectric constant and electrical resistance) was carried out by measuring the electrical capacitance of samples in the serial device LCR-800 (Taiwan) in thermostatic mode at an operating frequency of 1 kHz in continuous dry air, with holding time at each set temperature.
Samples parallel to the plane in the form of discs with a diameter of 10 mm and a thickness of 2–6 mm were pre-prepared with a binder mixture (1.5%). Pressing was carried out at a pressure of 20 kg/cm2. The resulting discs were fired in the laboratory furnace “SNOL” at a temperature of 400 °C for 6 h. Then, they were carefully leveled on both sides.
The dielectric constant was determined from the electrical capacitance of the sample at certain values of the sample thickness and electrode surface. A Sawyer–Tower circuit was used to obtain the relationship between the electric induction d and the electric field strength E. Visual control of D (hysteresis loop e) was carried out on a C1-83 oscilloscope with a voltage divider consisting of a resistance of 6 Mom and 700 Kohm and a reference capacitor of 0.15 µF. The frequency of the generator was 300 Hz. In all temperature studies, samples were placed in a furnace; the temperature was measured with a chromium–aluminum thermocouple connected to a voltmeter B2-34 with an error of 0.1 MV. The temperature change rate was 5 K/min. The value of the dielectric constant at each temperature was determined by the following formula:
where is the capacitance of the capacitor without the test substance (air).
Calculation of the width of the forbidden zone (ΔE) of the substance under investigation was determined by the following formula:
where k is the Boltzmann constant equal to 8.6173303 ×·10−5 eB·K−1; R1 is the resistance at T1; and R2 is the resistance at T2.
To ensure the reliability of the data obtained, the dielectric constant of a standard substance, barium titanate BaTiO3, was measured at frequencies equal to 1 kHz, 5 kHz, and 10 kHz. Table 1 below shows the results of measurements of the electrophysical characteristics of BaTiO3.

Table 1.
Symmetry type and unit cell parameters of Li0.5MnFe1.5O4.
As can be seen from the data in Table 2, the values of the dielectric constant 293 K at 1 kHz and 5 kHz correspond satisfactorily to its recommended value of 1400 ± 250. In addition, observed changes in the electrical conductivity of BaTiO3 at all frequencies (1 kHz, 5 kHz, and 10 kHz) at 383 K correspond to its transition from the perovskite cubic phase Pm3m to the tetragonal (polar) ferroelectric phase with the space group P4mm [33,34,35].
Table 2.
Dependence of electrical resistance (R), electrical capacity (C), and dielectric constant (ε) on BaTiO3 temperature.
It should be noted that despite the decrease in the values of the dielectric constant of BaTiO3 at a frequency of 10 kHz, and at T equal to 293 K, 303 K, and 313 k, and all values of ε BaTiO3 at all three frequencies (1 kHz, 5 kHz, and 10 kHz) in the range of 313–483 K, there are values up to about 2150, indicating that this frequency change does not particularly affect the temperature dependence of the dielectric constant. BaTiO3 is in the range of 313–483 K.
Electrophysical measurements of Li0.5MnFe1.5O4 in the range of 293–483 K and frequencies equal to 1, 5, and 10 kHz were carried out at the LCR installation (Table 3, Figure 4).
Table 3.
Dependence of electrical capacity (C), electrical resistance (R), and dielectric constant (ε) of material 2 on temperature and frequency.
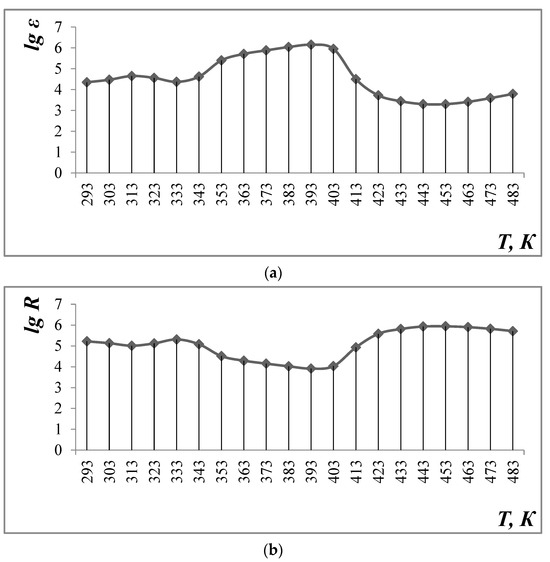
Figure 4.
Dependence of dielectric constant (a) and electrical resistance (b) on temperature and frequency equal to 1 kHz.
The data in Table 3 and Figure 4 show that the value of the dielectric constant (ε) reaches a maximum value at 383 K, which is equal to 1.43·106 (1 kHz). Then, it decreases to 6140 at 483 K (frequency 1 kHz). Increasing the frequency to 5 and 10 kHz leads to a decrease in ε in the entire temperature range under study (293–483 K).
The study of the temperature dependence of electrical resistance shows the complex nature of conductivity: at ∆T = 293–313 K—semiconductor, at ∆T = 313–333 K—metallic, at 333–393 K—semiconductor, at ∆T = 393–453 K—metallic, and at ∆T = 453–483 K—again, semiconductor.
The band spacing of 2 materials AT ∆T = 293–313 K (Table 4) and 333–393 K (Table 5) is equal to 1.91 and 1.19 EV (narrowband semiconductor), respectively, and AT ∆T = 453–483 K (Table 6) is equal to 3.04 EV (broadband semiconductor).
Table 4.
Calculation of the width of the forbidden zone (∆E) in the range 293–313 K.
Table 5.
Calculation of the width of the forbidden zone (∆E) in the range 333–393 K.
Table 6.
Calculation of the width of the forbidden zone (∆E) in the range 453–483 K.
4. Conclusions
Summing up the results of the study, a new mixed complex ferrite with the composition Li0.5MnFe1.5O4 was synthesized for the first time by the sol–gel method. In order to determine the composition of the resulting new complex mixed ferrite, an X-ray phase study was carried out, and in order to conduct quantitative and qualitative analysis, an examination under a scanning electron microscope and a study of electrophysical properties (dielectric conductivity and electrical resistance) were carried out.
For the first time, syngony types and parameters of elementary cells of a complex mixed ferrite synthesized by the method of X-ray phase analysis were determined. Li0.5MnFe1.5O4 (cubic, a = 8.3677(9), B = 8.3677(9), C = 8.3677(9) Å, Z = 8, denX-ray = 4.678 g/cm3, denPycno = 4.675 g/cm3); through the X-ray wavelength of ferrite, the average size of crystallites according to Scherrer’s formula is 40.6 µm. The results of radiographic research showed that the synthesized compound is polycrystalline. The accuracy of crystallochemical data is evidenced by a satisfactory correspondence of X-ray and pycnometric densities.
Through a scanning electron microscope, microsystems were taken from different parts of Li0.5MnFe1.5O4-type crystallite; the elemental composition of crystals was analyzed; and the general type of surface layer of complex ferrite was shown. As a result, given the fact that the compound consists of a single phase, the clarity of its construction was determined by the topography and chemical composition of the compound. As a result, it was found that the newly synthesized complex ferrites correspond to the formula Li0.5MnFe1.5O4. The particles of the formed compounds have a large size (between 50.0 µm or 20.0 µm and 10.0 µm). The results of the elemental analysis were presented in the form of a table.
Electrophysical measurements of Li0.5MnFe1.5O4 on the LCR-800 unit were carried out at intervals of 293–483 K and frequencies of 1.5 and 10 kHz.
Given the fact that 293 K is equal to a relatively high value of 2.69 × 10⁵ at 1 kHz, the maximum value of 383 K reached 1.43 × 10⁶. Next, it was reduced to 6140 at 483 K (frequency of 1 kHz). An increase in frequency to 5 and 10 kHz led to a decrease in the entire test temperature interval (293–483 K).
The study of the dependence of electrical resistance on temperature shows the complex nature of conductivity: t = 293–313 K—semiconductor, t = 313–333 K—metal, 333–393 K—semiconductor, t = 393–453 K—metal, and T = 453–483 K—semiconductor again.
In the future, I will study the temperature dependence and magnetic sensitivity of the magnetization of synthesized complex ferrite in various magnetic fields.
Author Contributions
Conceptualization, A.M.; methodology, M.A., Z.D., G.P. and M.N.; formal analysis, M.N. and G.P.; resources, M.A., M.M. and Z.D.; writing—original draft preparation, A.M. and M.M. All authors have read and agreed to the published version of the manuscript.
Funding
This research received no external funding.
Institutional Review Board Statement
Not applicable.
Informed Consent Statement
Not applicable.
Data Availability Statement
Data are contained within the article.
Conflicts of Interest
The authors declare no conflict of interest.
References
- Hossain, M.D.; Jamil, A.T.M.K.; Hossain, M.S.; Ahmed, S.J.; Das, H.N.; Rashid, R.; Khan, M.N.I. Investigation on structure, thermodynamic and multifunctional properties of Ni–Zn–Co ferrite for Gd3+ substitution. RSC Adv. 2022, 12, 4656. [Google Scholar] [CrossRef] [PubMed]
- Gonçalves, J.M.; Silva, M.N.; Naik, K.K.; Martins, P.R.; Rocha, D.P.; Nossol, E.; Rout, C.S. Multifunctional spinel MnCo2O4 based materials for energy storage and conversion: A review on emerging trends, recent developments and future perspectives. J. Mater. Chem. 2021, 9, 3095. [Google Scholar] [CrossRef]
- Yao, C.; Ismail, M.; Hao, A.; Thatikonda, S.K.; Huang, W.; Qin, N.; Bao, D. Annealing atmosphere effect on the resistive switching and magnetic properties of spinel Co3O4 thin films prepared by a sol–gel technique. RSC Adv. 2019, 9, 12615. [Google Scholar] [CrossRef] [PubMed]
- Chandel, M.; Moitra, D.; Makkar, P.; Sinha, H.; Hora, H.S.; Ghosh, N.N. Synthesis of multifunctional CuFe2O4–reduced graphene oxide nanocomposite: An efficient magnetically separable catalyst as well as high performance supercapacitor and first-principles calculations of its electronic structures. RSC Adv. 2018, 8, 27725. [Google Scholar] [CrossRef] [PubMed]
- Li, Z.; Wang, Z.L.; Wang, Z. In situ tuning of crystallization pathways by electron beam irradiation and heating in amorphous bismuth ferrite films. RSC Adv. 2018, 8, 23522. [Google Scholar] [CrossRef] [PubMed]
- Malima, N.M.; Khan, M.D.; Choi, J.; Gupta, R.K.; Mashazi, P.; Nyokong, T.; Revaprasadu, N. Solventless synthesis of nanospinel Ni1−xCoxFe2O4 (0 ≤ x ≤ 1) solid solutions for efficient electrochemical water splitting and supercapacitance. RSC Adv. 2021, 11, 31002. [Google Scholar] [CrossRef] [PubMed]
- Jangam, K.; Patil, K.; Balgude, S.; Patange, S.; More, P. Magnetically separable Zn1−xCo0.5xMg0.5xFe2O4 ferrites: Stable and efficient sunlight-driven photocatalyst for environmental remediation. RSC Adv. 2020, 10, 42766. [Google Scholar] [CrossRef] [PubMed]
- Bastianello, M.; Gross, S.; Elm, M.T. Thermal stability, electrochemical and structural characterization of hydrothermally synthesised cobalt ferrite (CoFe2O4). RSC Adv. 2019, 9, 33282. [Google Scholar] [CrossRef] [PubMed]
- Kobylinska, N.; Klymchuk, D.; Shakhovsky, A.; Khainakova, O.; Ratushnyak, Y.; Duplij, V.; Matvieieva, N. Biosynthesis of magnetite and cobalt ferrite nanoparticles using extracts of “hairy” roots: Preparation, characterization, estimation for environmental remediation and biological application. RSC Adv. 2021, 11, 26974. [Google Scholar] [CrossRef]
- Pham, T.N.; Huy, T.Q.; Le, A.T. Spinel ferrite (AFe2O4)-based heterostructured designs for lithium-ion battery, environmental monitoring, and biomedical applications. RSC Adv. 2020, 10, 31622. [Google Scholar] [CrossRef]
- Manohar, A.; Chintagumpala, K.; Kim, K.H. Mixed Zn–Ni spinel ferrites: Structure, magnetic hyperthermia and photocatalytic properties. Ceram. Int. 2021, 47, 7052. [Google Scholar] [CrossRef]
- Kefeni, K.K.; Msagati, T.A.M.; Nkambule, T.T.I.; Mamba, B.B. Spinel ferrite nanoparticles and nanocomposites for biomedical applications and their toxicity. Mater. Sci. Eng. 2020, 107, 110314. [Google Scholar] [CrossRef] [PubMed]
- Kharat, P.B.; Shisode, M.V.; Birajdar, S.D.; Bhoyar, D.N.; Jadhav, K.M. Synthesis and characterization of water based NiFe2O4 ferrofluid. AIP Conf. Proc. 2017, 1832, 050122. [Google Scholar] [CrossRef]
- Taneja, S.; Thakur, P.; Ravelo, B.; Thakur, A. Nanostructured Rare Earth Nd3+ doped Nickel–Zinc–Bismuth Spinel Ferrites: Structural, Electrical and Dielectric Studies. Mater. Res. Bull. 2022, 154, 111937. [Google Scholar] [CrossRef]
- Kim, J.H.; Kim, H.E.; Kim, J.H.; Lee, J.S. Ferrites: Emerging light absorbers for solar water splitting. J. Mater. Chem. A 2020, 8, 9447. [Google Scholar] [CrossRef]
- Somvanshi, S.B.; Jadhav, S.A.; Khedkar, M.V.; Kharat, P.B.; More, S.D.; Jadhav, K.M. Hyperthermic evaluation of oleic acid coated nano-spinel magnesium ferrite: Enhancement via hydrophobic-to-hydrophilic surface transformation. Ceram. Int. 2020, 46, 13170. [Google Scholar] [CrossRef]
- Nilar, L.; Fauzi, M.A.N.; Sreekantan, S.; Othman, R. Physical and electromagnetic properties of nanosized Gd substituted Mg–Mn ferrites by solution combustion method. Phys. B Condens. Matter 2015, 461, 134. [Google Scholar] [CrossRef]
- XiuBo, X.; Wang, B.; Wang, Y.; Ni, C.; Sun, X.; Du, W. Spinel structured MFe2O4 (M = Fe, Co, Ni, Mn, Zn) and their composites for microwave absorption: A review. Chem. Eng. J. 2022, 428, 131160. [Google Scholar] [CrossRef]
- Ahmad, I.; Farid, M.T. Characterization of cobalt based spinel ferrites with small substitution of gadolinium. World Appl. Sci. J. 2012, 19, 464. [Google Scholar] [CrossRef]
- Fu, Y.P.; Lin, C.H.; Liu, C.W. Preparation and magnetic properties of Ni0.25Cu0.25Zn0.5 ferrite from microwave-induced combustion. J. Magn. Magn. Mater. 2004, 283, 59. [Google Scholar] [CrossRef]
- Ravinder, D.; Balachander, L.; Venudhar, Y.C. Electrical conductivity in manganese-substituted lithium ferrites. Mater. Lett. 2001, 49, 267. [Google Scholar] [CrossRef]
- Trivedi, U.N.; Jani, K.H.; Modi, K.B.; Joshi, H.H. Study of cation distribution in lithium doped nickel ferrite. J. Mater. Sci. Lett. 2000, 19, 1271. [Google Scholar] [CrossRef]
- Abo El Ata, A.M.; Attia, S.M.; El Kony, D.; Al-Hammadi, A.H. Spectral, initial magnetic permeability and transport studies of Li0.5−0.5xCoxFe2.5−0.5xO4 spinel ferrite. J. Magn. Magn. Mater. 2005, 295, 28. [Google Scholar] [CrossRef]
- Ravinder, D.; Reddy, P.V.B. Thermoelectric power studies of polycrystalline magnesium substituted lithium ferrites. J. Magn. Magn. Mater. 2003, 263, 127. [Google Scholar] [CrossRef]
- Laishram, R.; Prakash, C. Magnetic properties of Cr3+ substituted Li–Sb ferrites. J. Magn. Magn. Mater. 2006, 305, 35. [Google Scholar] [CrossRef]
- Sattar, A.A.; El-Sayed, H.M.; Agami, W.R.; Ghani, A.A. Magnetic properties and electrical resistivity of Zr4+ substituted Li-Zn ferrite. Am. J. Appl. Sci. 2007, 4, 89–93. [Google Scholar] [CrossRef]
- Surzhikov, P.; Pritulov, A.M.; Ivanov, Y.F.; Shabardin, R.S.; Usmanov, R.U. Electron-Microscopic Study of Morphology and Phase Composition of Lithium-Titanium Ferrites. Russ. Phys. J. 2001, 44, 420. [Google Scholar] [CrossRef]
- Mataev, M.M.; Madiyarova, A.M.; Patrin, G.S.; Abduraimova, M.R.; Nurbekova, M.A.; Tursunova, Z.I. Synthesis and physico—Chemical characteristics of complex ferrite CrNaFe2O5. Chem. J. Kaz. 2024, 1, 109–118. [Google Scholar] [CrossRef]
- Mataev, M.M.; Mustafin, E.S.; Kasenov, R.Z.; Pudov, A.M.; Kaikenov, D.A.; Bogzhanova, Z.K. X ray Diffraction Study of the YbMIIFe5O12 (MII = Mg, Ca, Sr) Ferrites. Inorg. Mater. 2014, 50, 622–624. [Google Scholar] [CrossRef]
- Mataev, M.M.; Abdraimova, M.R.; Saxena, S.X.; Nuketaeva, D.Z.; Zheksembieva, B.T. Syntesis and X-ray analysis of complex ferrites. Key Eng. Mater. 2017, 744, 393–398. [Google Scholar] [CrossRef]
- Okazaki, K. Technology of Ceramic Dielectrics; Energiya: Moscow, Russia, 1976; 256p. [Google Scholar]
- Kasenov, B.K.; Kasenova, S.B.; Sagintaeva, Z.I.; Baisanov, S.; Lu, N.Y.; Nukhuly, A.; Kuanyshbekov, E.E. Heat Capacity and Thermodynamic Functions of Titanium-Manganites of Lanthanum, Lithium and Sodium of LaLi2TiMnO6 and LaNa2TiMnO6. Molecules 2023, 28, 5194. [Google Scholar] [CrossRef] [PubMed]
- Fesenko, E.G. The Perovskite Family and Ferroelectricity; Atomizdat: Moscow, Russia, 1972. [Google Scholar]
- Venevtsev, Y.N.; Politova, E.D.; Ivanov, S.A. Ferroelectric and Antisegnetoelectrics of the Barium Titanate Family; Chemistry: Moscow, Russia, 1985. [Google Scholar]
- Lines, M.; Glass, A. Ferroelectrics and Related Materials; Mir: Moscow, Russia, 1981. [Google Scholar]
Disclaimer/Publisher’s Note: The statements, opinions and data contained in all publications are solely those of the individual author(s) and contributor(s) and not of MDPI and/or the editor(s). MDPI and/or the editor(s) disclaim responsibility for any injury to people or property resulting from any ideas, methods, instructions or products referred to in the content. |
© 2024 by the authors. Licensee MDPI, Basel, Switzerland. This article is an open access article distributed under the terms and conditions of the Creative Commons Attribution (CC BY) license (https://creativecommons.org/licenses/by/4.0/).