Article

Synthesis of a Flaky CeO2 with Nanocrystals Used for Polishing

College of Biomedical Engineering, Sichuan University, Chengdu 610065, China
*
Author to whom correspondence should be addressed.
Materials 2024, 17(12), 2859; https://doi.org/10.3390/ma17122859
Submission received: 7 May 2024 / Revised: 3 June 2024 / Accepted: 5 June 2024 / Published: 12 June 2024

Abstract

:
It is important to adapt the morphology of CeO2 to different applications. A novel flaky CeO2 with nanocrystals was successfully synthesized using the ordinal precipitation method and calcination. The size of the flaky CeO2 was about 10 μm, and the nanocrystals were about 100 nm. Under the action of the precipitant NH4HCO3, Ce3+ nucleated in large quantities. The nanosized crystals gathered into flakes driven by the surface energy. As the calcination temperature increased, the grains grew slowly by mass transfer due to the slow diffusion of reactants. By adding AlOOH to the starting material, the Al3+ doped into the CeO2 increased the content of Ce3+ in the CeO2, which improved the chemical activity of the CeO2. When the starting material’s Al:Ce ratio was 5:1, the Ce3+ increased to 31.11% in the CeO2, which provided good application potential in the polishing field. After polishing by the slurry of flaky CeO2 for 1 h, the SiC surface roughness reduced from 464 nm to 11 nm.

1. Introduction

The crystal structure of cerium oxide is an open fluorite structure consisting of Ce4+ arranged in a face-centered cubic arrangement and O2− occupying tetrahedral positions. Due to the intrinsic characteristics of atomic hybridization to form a cubic fluorite lattice structure, cerium oxide has intrinsic Ce3+ and its content is easily affected by doping and the formation of oxygen vacancies [1]. Such a structure makes it easy to form oxygen vacancies and perform element doping, and it maintains the cubic structure of fluorite with good chemical stability [2]. Due to its excellent properties, cerium oxide is currently used in a wide range of fields, such as CO2 conversion catalysis [3], photocatalysis [4], ultraviolet absorption [5], biomaterials [6], thermal coatings [7] and polishing abrasives [8].
The issue of how to prepare specific sizes and morphologies of cerium oxide is of great significance when it comes to adapting it to different applications. At present, researchers have successfully prepared CeO2 from different dimensionalities, including nanosphere-like and nanowire-shaped, nanoflakes, and nanocubes through different preparation methods. Among them, two-dimensional cerium oxide materials have huge application potential because of their high specific surface area and high anisotropy. However, they are difficult to synthesize due to a lack of intrinsic driving force during growth. Thus, only several reports discussed the synthesis of two-dimensional cerium oxide. C.H. Lu et al. prepared rhombic cerium hydroxycarbonate through the hydrothermal method [9]. L. Chen et al. synthesized larger-sized flaky cerium oxide by preparing precursors from the solution with a low concentration and pyrolysis [10]. J. Gong et al. controlled the morphology of the precursor CeOHCO3 through the hydrothermal method and synthesized equilateral triangular nanosheets of CeO2 with excellent optical properties [11].
In this paper, a novel flaky CeO2 composed of nanocrystals was prepared and the nanocrystal formation mechanism was discussed. The potential application of this material was explored in the field of polishing. Since aluminum is difficult to replace in cerium oxide crystals during the preparation process, a small amount of the Al element was doped into the lattice of the CeO2 to enhance its performance in the polishing process. In contrast, the Al3+, which did not dope in the CeO2, transformed into Al2O3 after precipitation and calcination. The Al2O3 was mixed with CeO2 to improve the mechanical strength.

2. Methods

2.1. Preparation of Flaky CeO2 with Nanocrystals

The starting materials used were cerium nitrate hexahydrate (Ce (NO3)3·6H2O), aluminum nitrate nonahydrate (Al (NO3)3·9H2O), and ammonium bicarbonate (NH4HCO3), all of which were of analytically pure grade.
Firstly, a certain amount of Al (NO3)3 was dissolved in deionized water, and then Al (NO3)3 solution and NH4HCO3 solution as a precipitant were added in parallel flow. Magnetic stirring was used during the reaction. The reaction product was suction-filtrated, dried, and milled to prepare AlOOH.
As AlOOH is an amphoteric oxyhydroxide, it can react with an acid or a base. When the hydrolysis pH value is below 5 or above 10, some AlOOH precipitates will dissolve [12]. The AlOOH was dissolved in 1 mol/L Ce (NO3)3 solution at a pH of 4.3 in the reaction beaker, where the 2 mol/L NH4HCO3 solution as a precipitant was added drop by drop to raise the pH value to 7.5. At this stage, part of the AlOOH dissolved into Al3+, while the incompletely dissolved AlOOH helped with Ce3+ nucleation in the early stage of precipitation. After the reaction, the reaction product was aged for 24 h. The precipitates were filtered and dried at 120 °C for 2 h and calcined at different temperatures with a temperature increase rate of 10 °C/min. To investigate the effects of different calcination temperatures and Al contents, the samples were divided into groups numbered 1–4, consistent with 0:1, 1:5, 1:1, and 5:1 of the atomic ratios of Al:Ce, respectively. Then, the samples with 1:1 of Al:Ce were calcined at 350, 700, 900, and 1200 °C.

2.2. Chemical Mechanical Polishing (CMP)

To compare the polishing efficiency and effectiveness of the flaky CeO2 powder and commercial spherical CeO2 abrasives, the two abrasives were configured with Na2CO3 solution to form a simple polishing slurry of 3 wt.%. After thinning, SiC wafers were cut into 10 mm × 10 mm plates and polished with a flow rate of 10 mL/min and a rotational speed of 240 ppm for 1 h.

2.3. Characterization

Thermogravimetric Analysis (TG) and Differential Thermal Analysis (DTA) on a DTG-60H (Shimadzu, Shanghai, China) analyzed the precursors’ phase and mass changes with an increasing temperature. The phase analysis of the precursors and powders after calcination at different temperatures was carried out by X-ray diffraction (XRD) on a XRD6100 diffractometer (Shimadzu, Shanghai, China) with Cu Kα radiation (λ = 1.5418 Å); the XRD patterns were collected in the range of 2θ = 10°–90°. The changes in the chemical-bonding state of the elemental Ce due to changes in the ratio of Ce to Al in the CeO2 were investigated using X-ray photoelectron spectroscopy (XPS) on a Kratos AXIS Supra, with a monochromatic Al Kα X-ray source (hν = 1486.6 eV). All the binding energies were related to the C1s peak (284.8 eV).
The morphology of the samples was determined on a field emission scanning electron microscope (FESEM) Apreo S (Thermo Scientific™, Shanghai, China) and a transmission electron microscope (TEM) Tecnai G2 F20 S-TWIN (FEI, Shanghai, China).
The SiC surfaces before and after the polishing were compared to discuss the change in the surface. The surface profile and roughness were measured using a Contour GT-K optical profilometer from Bruker Nano Inc., Billerica, MA, USA.

3. Results and Discussion

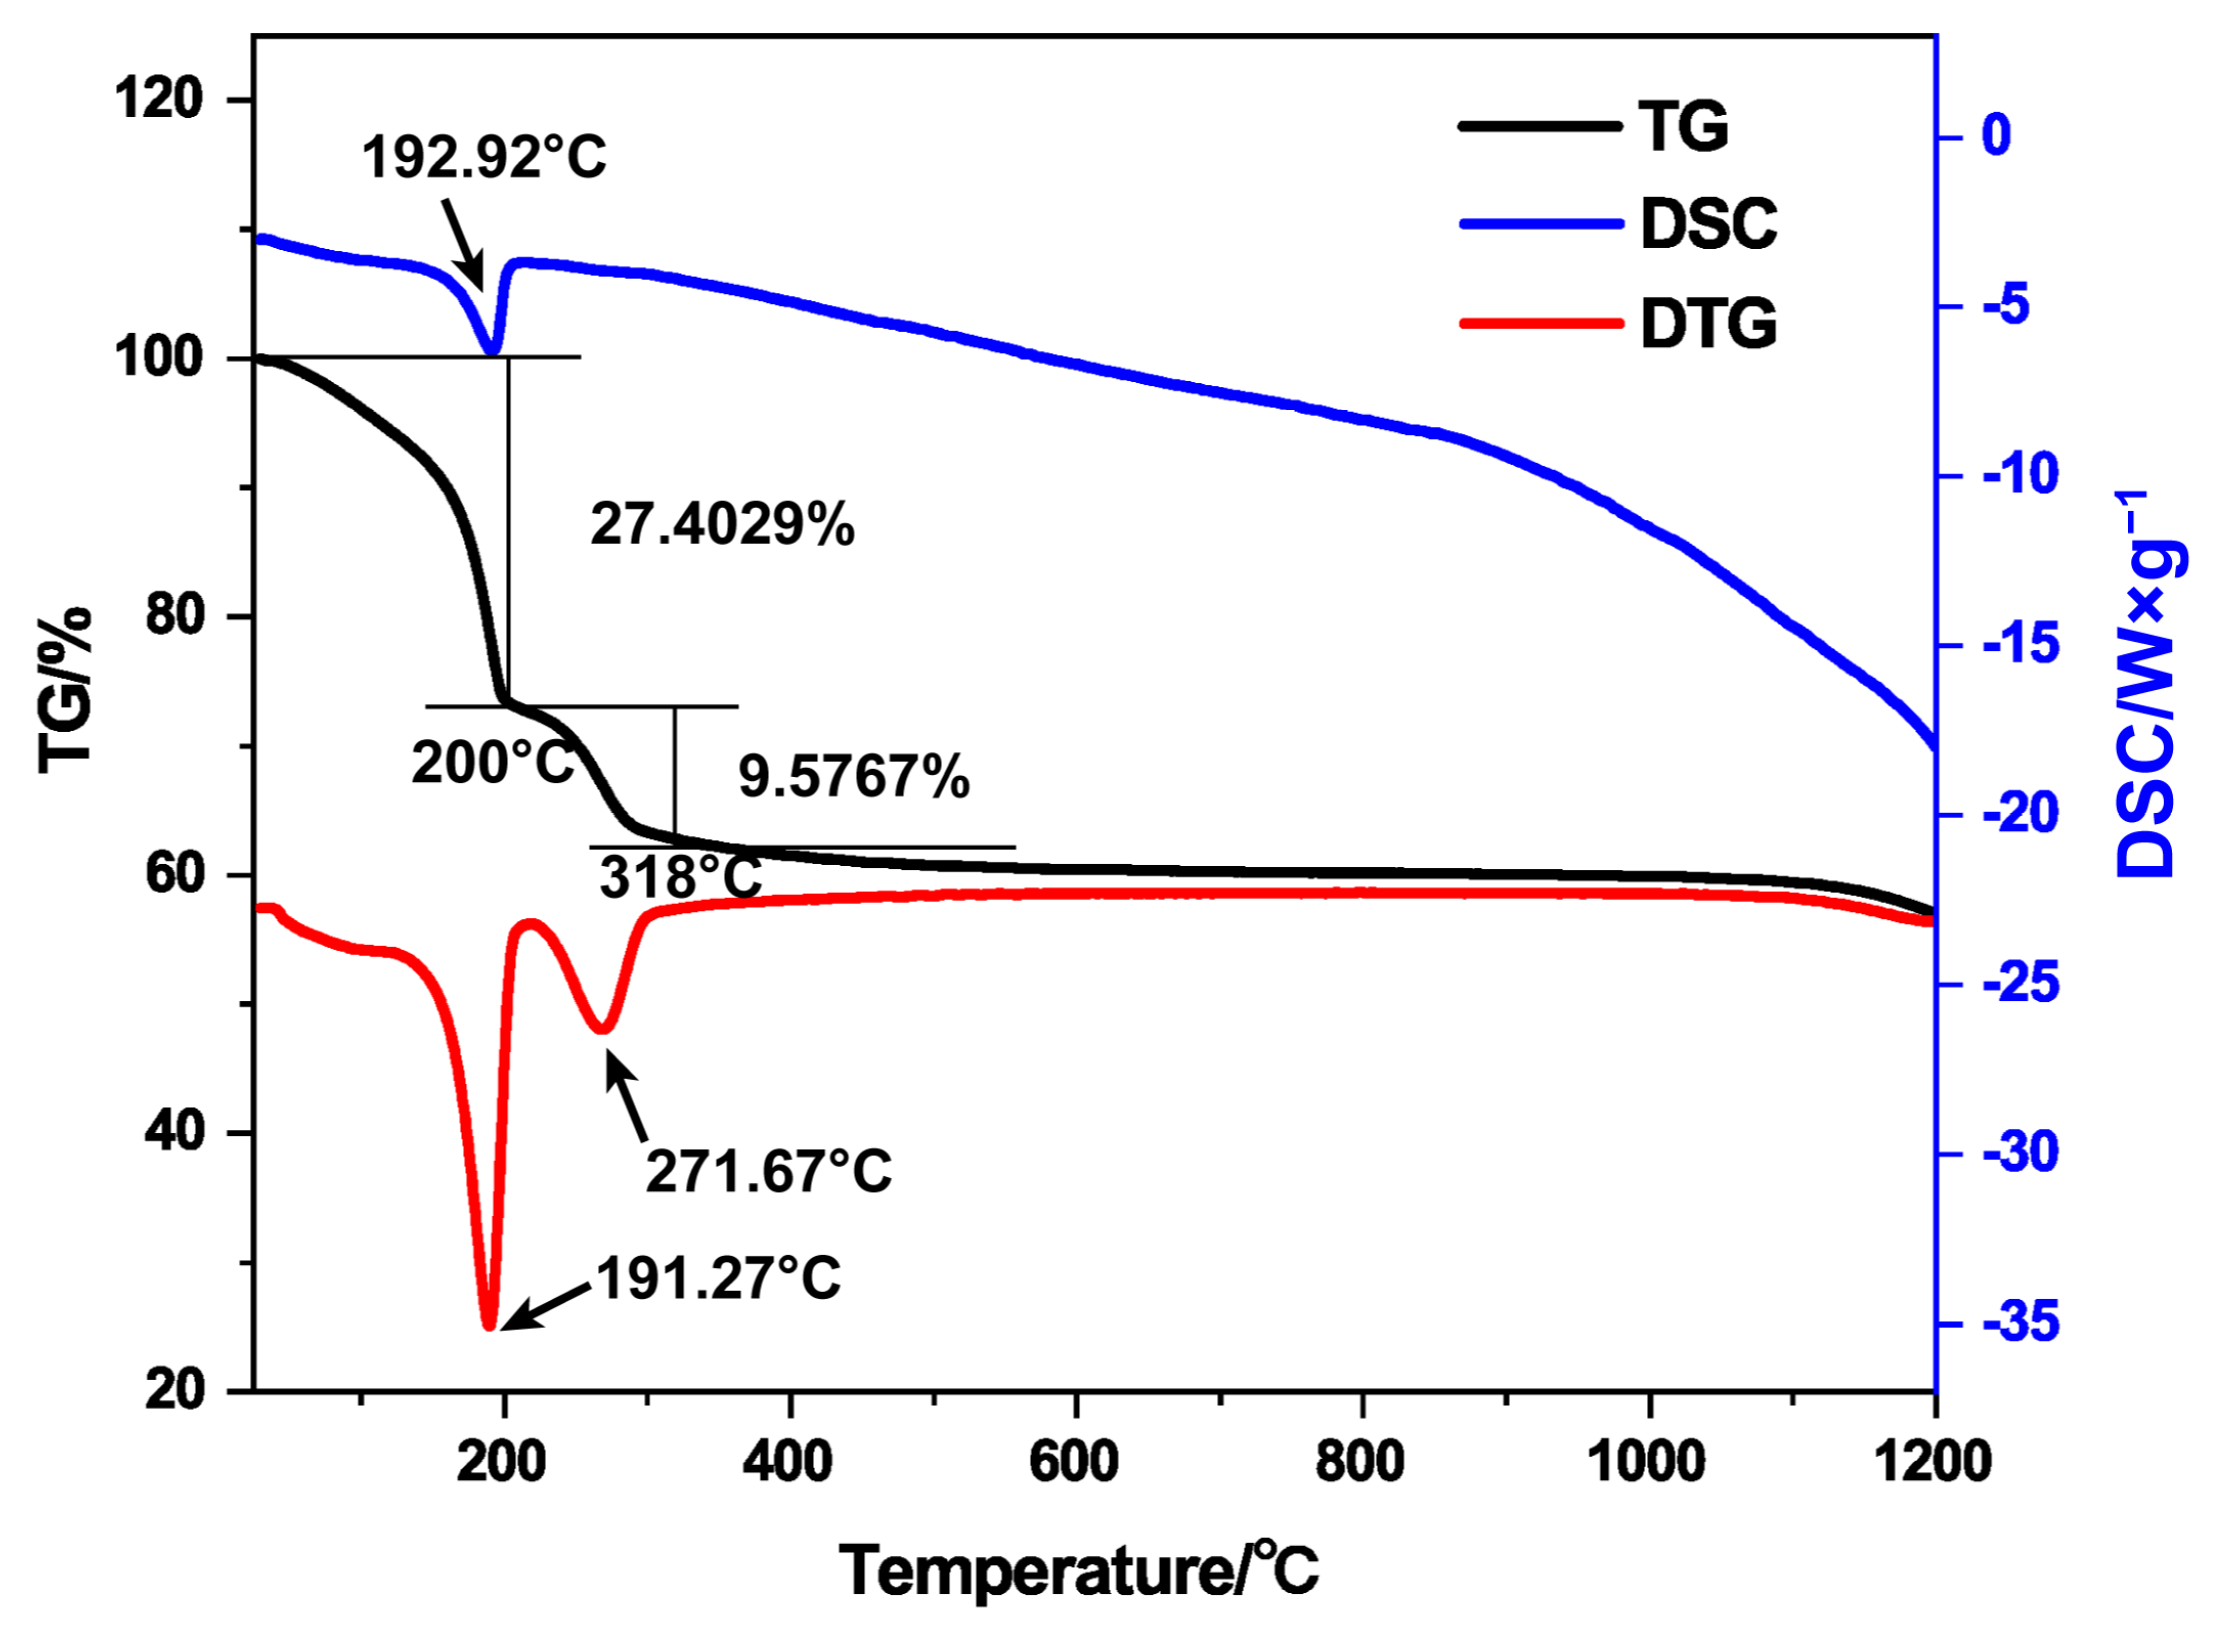
3.1. Thermal Analysis and Composition

As shown in Figure 1, the TG/DSC curves of the 6.5 mg precursors composed of CeOHCO3 and AlOOH ramping up at room temperature—1200 °C showed the first noticeable mass loss between 0 and 200 °C. The DSC curve showed a prominent heat absorption peak at 192.92 °C. In addition, the second more pr onounced mass loss occurred at 200–318 °C. The DTG curve showed a minimum at 191.27 °C, corresponding to the first mass loss and heat absorption. The minimum at 271.67 °C corresponds to the second weight loss. The TG/DSC curves showed that the precursor had a phase transformation when the calcination temperature was above 200 °C and other components changed during 200–318 °C.
The XRD patterns of the precursor prepared by ordinal precipitation and powder consisting of CeO2 and Al2O3 after calcination at different temperatures are shown in Figure 2. The precursor shows diffraction peaks of CeOHCO3 consistent with 41-0013 of the Joint Committee on Powder Diffraction Standards (JCPDS). This is because NH4HCO3, the precipitant, provides CO32− ions and creates an alkaline precipitation environment. In addition, there are diffraction peaks of Al(OH)3 consistent with 24-0006, which are from AlOOH combined with H2O [13].
CeO2 with a cubic fluorite structure is confirmed at 200 °C, and the diffraction peaks of the precursor CeOHCO3 are not observed. CeOHCO3 transforms into CeO2 according to Equation (1) when the temperature exceeds 200 °C [14], consistent with the thermal analysis.
CeOHCO3 + 1/4O2→CeO2 + 1/2H2O↑ + CO2
As the temperature increases to 350 °C, Al2O3 consistent with 31-0026 is confirmed and the diffraction peaks of Al(OH)3 cannot be observed, which means that Al(OH)3 is decomposed into Al2O3 and H2O according to Equation (2) [15]
2Al(OH)3→Al2O3 + 3H2O
The theoretical quality change was calculated according to the inferred composition change. The weight loss curve of the first section with a large slope is related to the removal of free water and crystalline water from the sample. After a 10% weight loss, the precursor of 6.5 mg should contain CeOHCO3 weight 4.30 mg and Al(OH)3 weight 1.54 mg, with a molar ratio of 1:1. In the second stage of the weight loss, CeOHCO3 is converted into CeO2 and theoretically loses 0.90 mg (13.85%), while later Al(OH)3 is converted into Al2O3 and theoretically loses 0.19 mg (8.31%). The results of the theoretical calculation are consistent with the TG curve obtained in the experiment and confirm the composition change mechanism we inferred.
As the temperature increases to 700 °C and 900 °C, the diffraction peaks of CeO2 become sharper, implying better crystallinity. In terms of Scherrer’s formula, the average grain size of the sample can be calculated as 29.3 nm at 350 °C, 42.1 nm at 700 °C, and 49.5 nm at 900 °C based on the diffraction peak of about 28.5°.

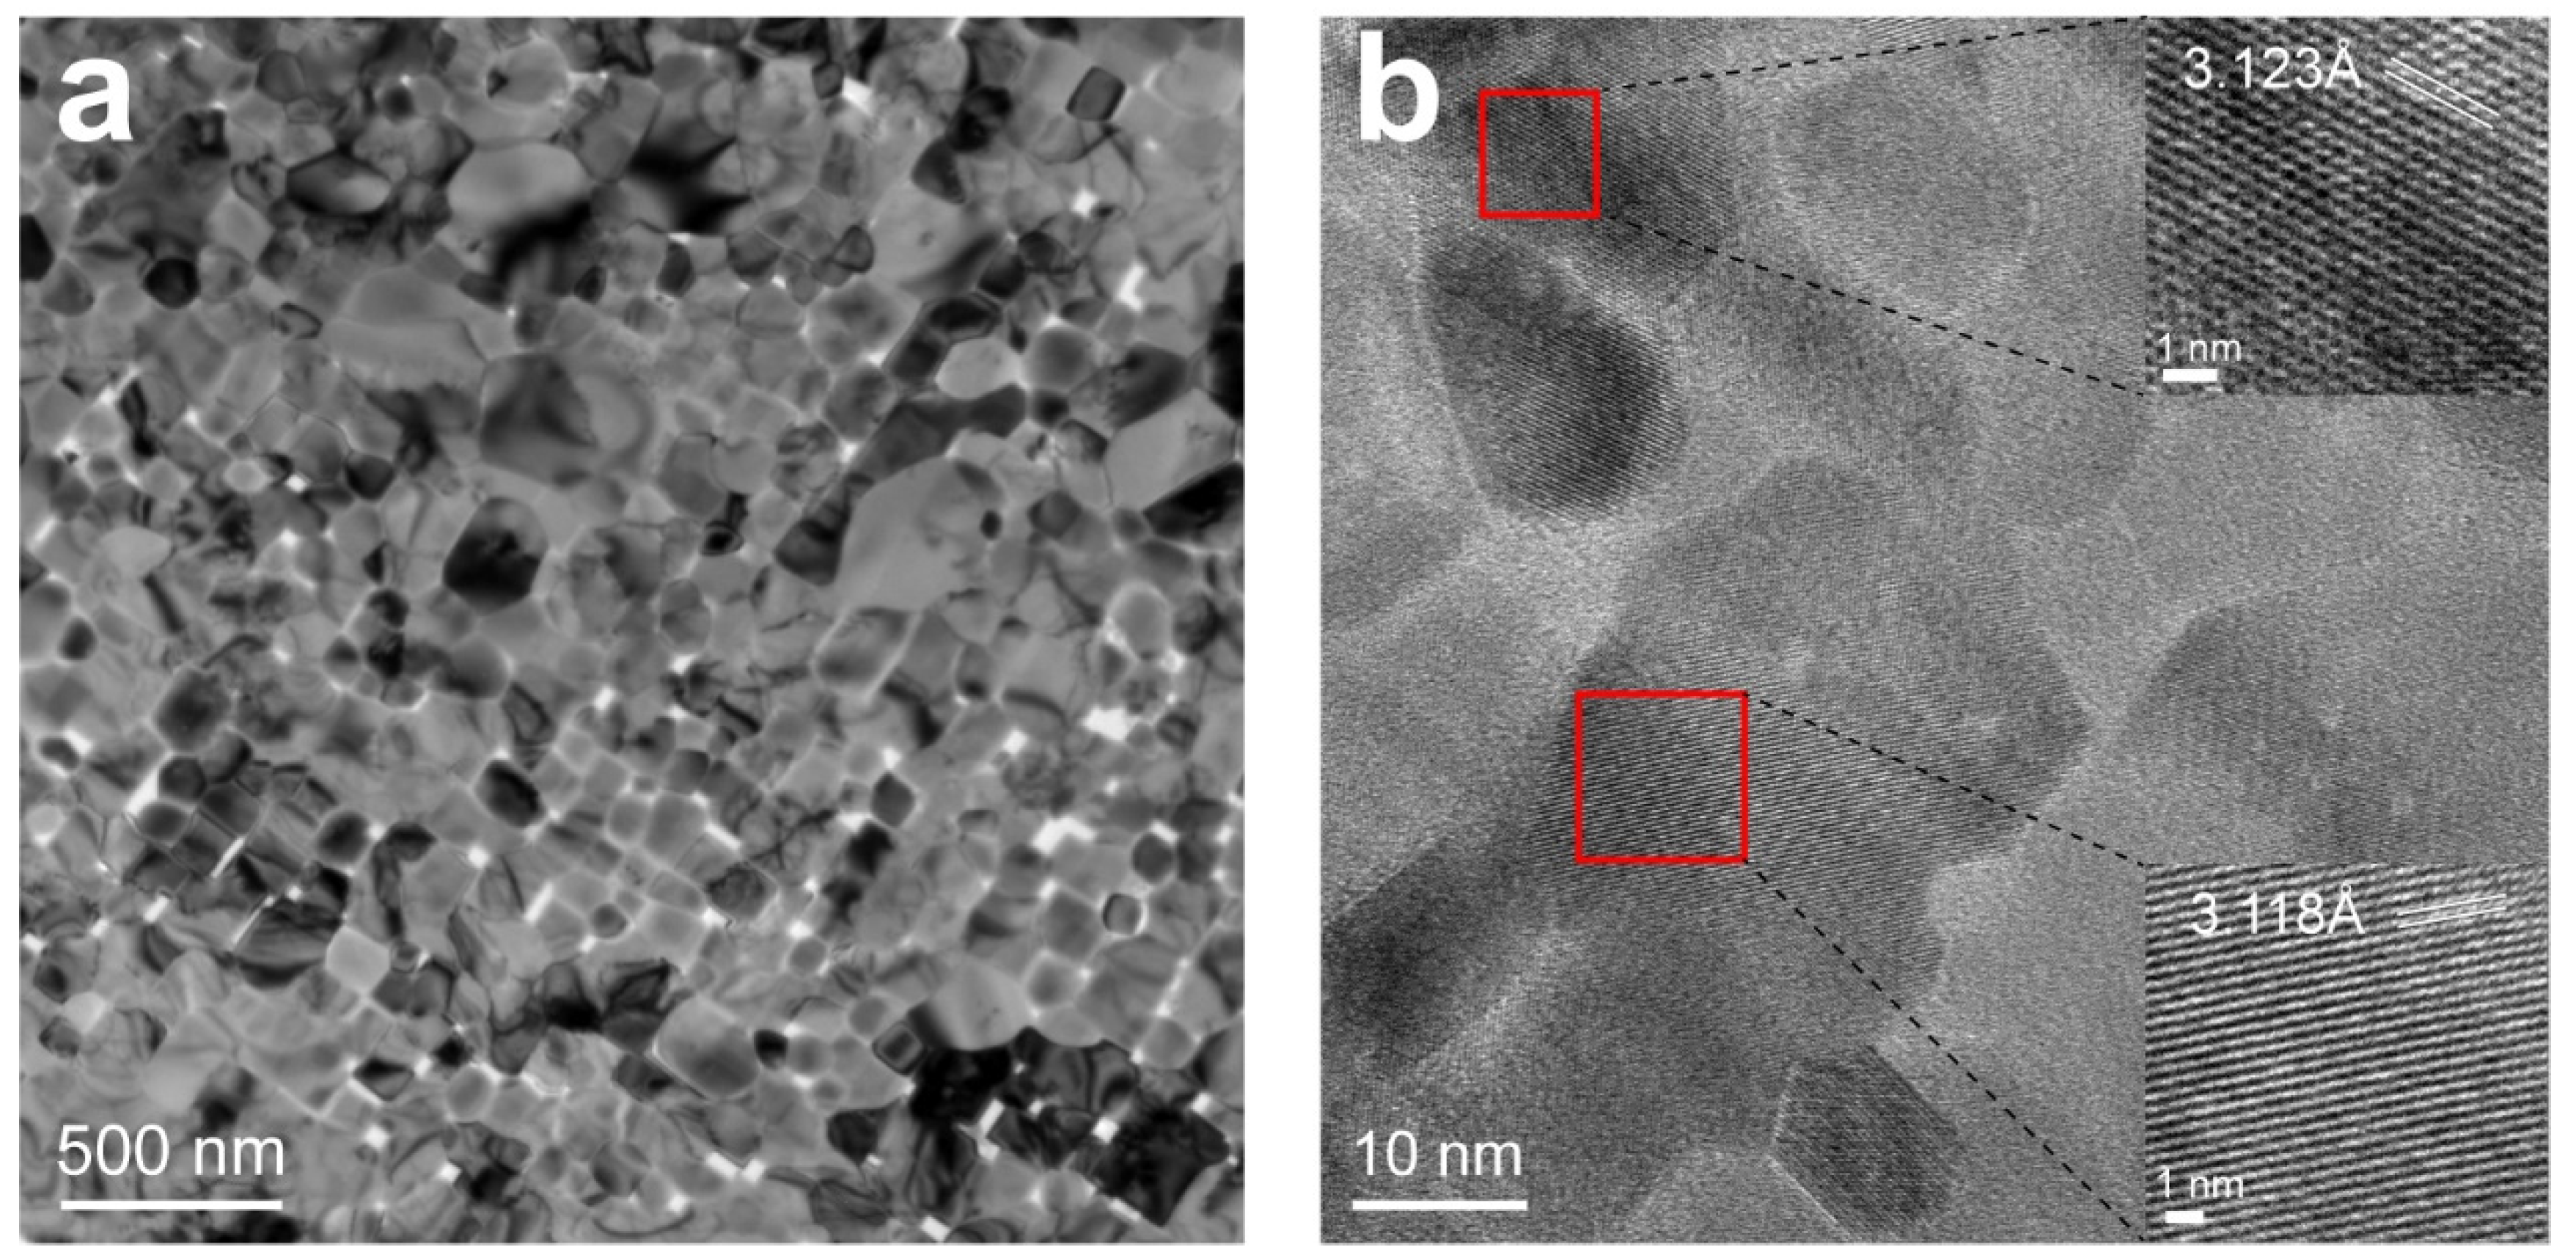
3.2. Morphology and Microstructure

The excess Ce3+ in the reaction beaker was nucleated in large quantities using the ordinal precipitation method. Then, these fine grains were aggregated to form large flakes of material, as shown in Figure 3a.
The morphology of the samples calcined at different temperatures is shown in Figure 3b–d. All the powders are flaky-like, mainly octagonal when the temperature is below 900 °C, and grow to hexagonal at 900 °C. Some particles attached to the precursors and the powders after calcination.
The nanoparticles grow gradually to 400 nm for small grains and 1 μm for big grains when the temperature rises to 1200 °C, as shown in Figure 3e,f.
To determine the morphological characteristics of the aluminum oxide and cerium oxide in the sample, EDS was used to detect the composition of the sample calcined at 900 °C. As shown in Figure 4, the morphology of the cerium oxide and aluminum oxide in the product is quite different. Cerium oxide is a large-sized flake material, while aluminum oxide is an agglomerate of nanoparticles.
To observe the nanocrystals in the flaky CeO2, a TEM was used to investigate the morphology of CeO2 calcined at 900 °C. The sizes of the nanocrystal grains in CeO2 calcined at 900 °C are about 50–150 nm (Figure 5a). It was accounted for that the precursor obtained using ordinal precipitation was composed of nano-sized grains. The nanograins in the flaky material are finer and have a uniform size distribution. The grains grew slowly as the temperature increased to 900 °C. Based on Figure 5b showing the HRTEM images, the highly crystallized cerium oxide nanograins have distinct lattice lines resolved at 3.123 and 3.118 Å, which belong to the (111) crystal planes of CeO2 crystals. Among several low-index lattice planes of CeO2, the (111) crystallographic plane is the one with higher stability [16], which explains that the principal crystallographic planes observed in the TEM images are (111) crystallographic planes.
The growth mechanism is inferred from the morphological observation of the flaky nanocrystalline CeO2 material, as shown in Figure 6. As precipitant was added, Ce3+ rapidly nucleated into fine grains of CeOHCO3. At the same time, AlOOH acted as a template for the nucleation sites. AlOOH gradually dissolved into the cerium nitrate solution to release Al3+. Driven by the excellent surface energy, many fine grains were aggregated and formed flaky CeOHCO3. The pH value kept rising with the continuous addition of the precipitant, and AlOOH was transformed to Al(OH)3. Subsequently, during the calcination process, CeOHCO3 was converted into CeO2 with an increasing temperature under an atmosphere of air. Al(OH)3 transformed into Al2O3, which enhanced the mechanical strength of the abrasives. Tiny grains kept fusing and growing to become large with the increase in the temperature. Normally, CeO2 particles grow gradually as the temperature increases. However, the grains grow slowly as the temperature increases from 300 °C to about 900 °C. When the temperature increases to 1200 °C, the grains proliferate to the micrometer level. It can be considered that the slow diffusion of reactants limits the chemical reaction, meaning that the CeO2 grains grow in a small range by mass transfer [17].

3.3. Chemical State of Ce

The Ce3+ in CeO2, rather than the Ce4+, is believed to improve the performance in polishing [7]. To investigate the effect of the content of the element Al on the chemical state of CeO2, samples 1–4 were quantitatively analyzed by X-ray photoelectron spectroscopy (XPS), as shown in Figure 7. Table 1 lists the detailed information of each XPS peak assignment. For the Ce 3d signal in the samples, it can fit the peaks of Ce 3d5/2 and Ce 3d3/2, and after the curve-fitting, the Ce 3d2/5 peaks were labeled as v0, v1, v2, v3, v4, and the Ce 3d3/2 peaks were labeled as u0, u1, u2, u3, u4. Moreover, v0, v2, u0, u2 belonged to Ce3+, while the v1, v3, v4, u1, u3, u4 peaks belonged to Ce4+ ions [18]. The Ce3+ content in the samples was calculated by measuring the area of each peak of the Ce3+ to the area of all the Ce 3d peaks. The Ce3+ content of the control group was 26.00%. When the content of Al was less, it had no obvious effect on the CeO2. With the gradual increase in the Al content at the ratio of Al:Ce of 1:1, the Ce3+ content reaches 28.48%. When the ratio of Al:Ce rises to 5:1, the Ce3+ content reaches 31.12% and has enhancement compared with that of the control group.

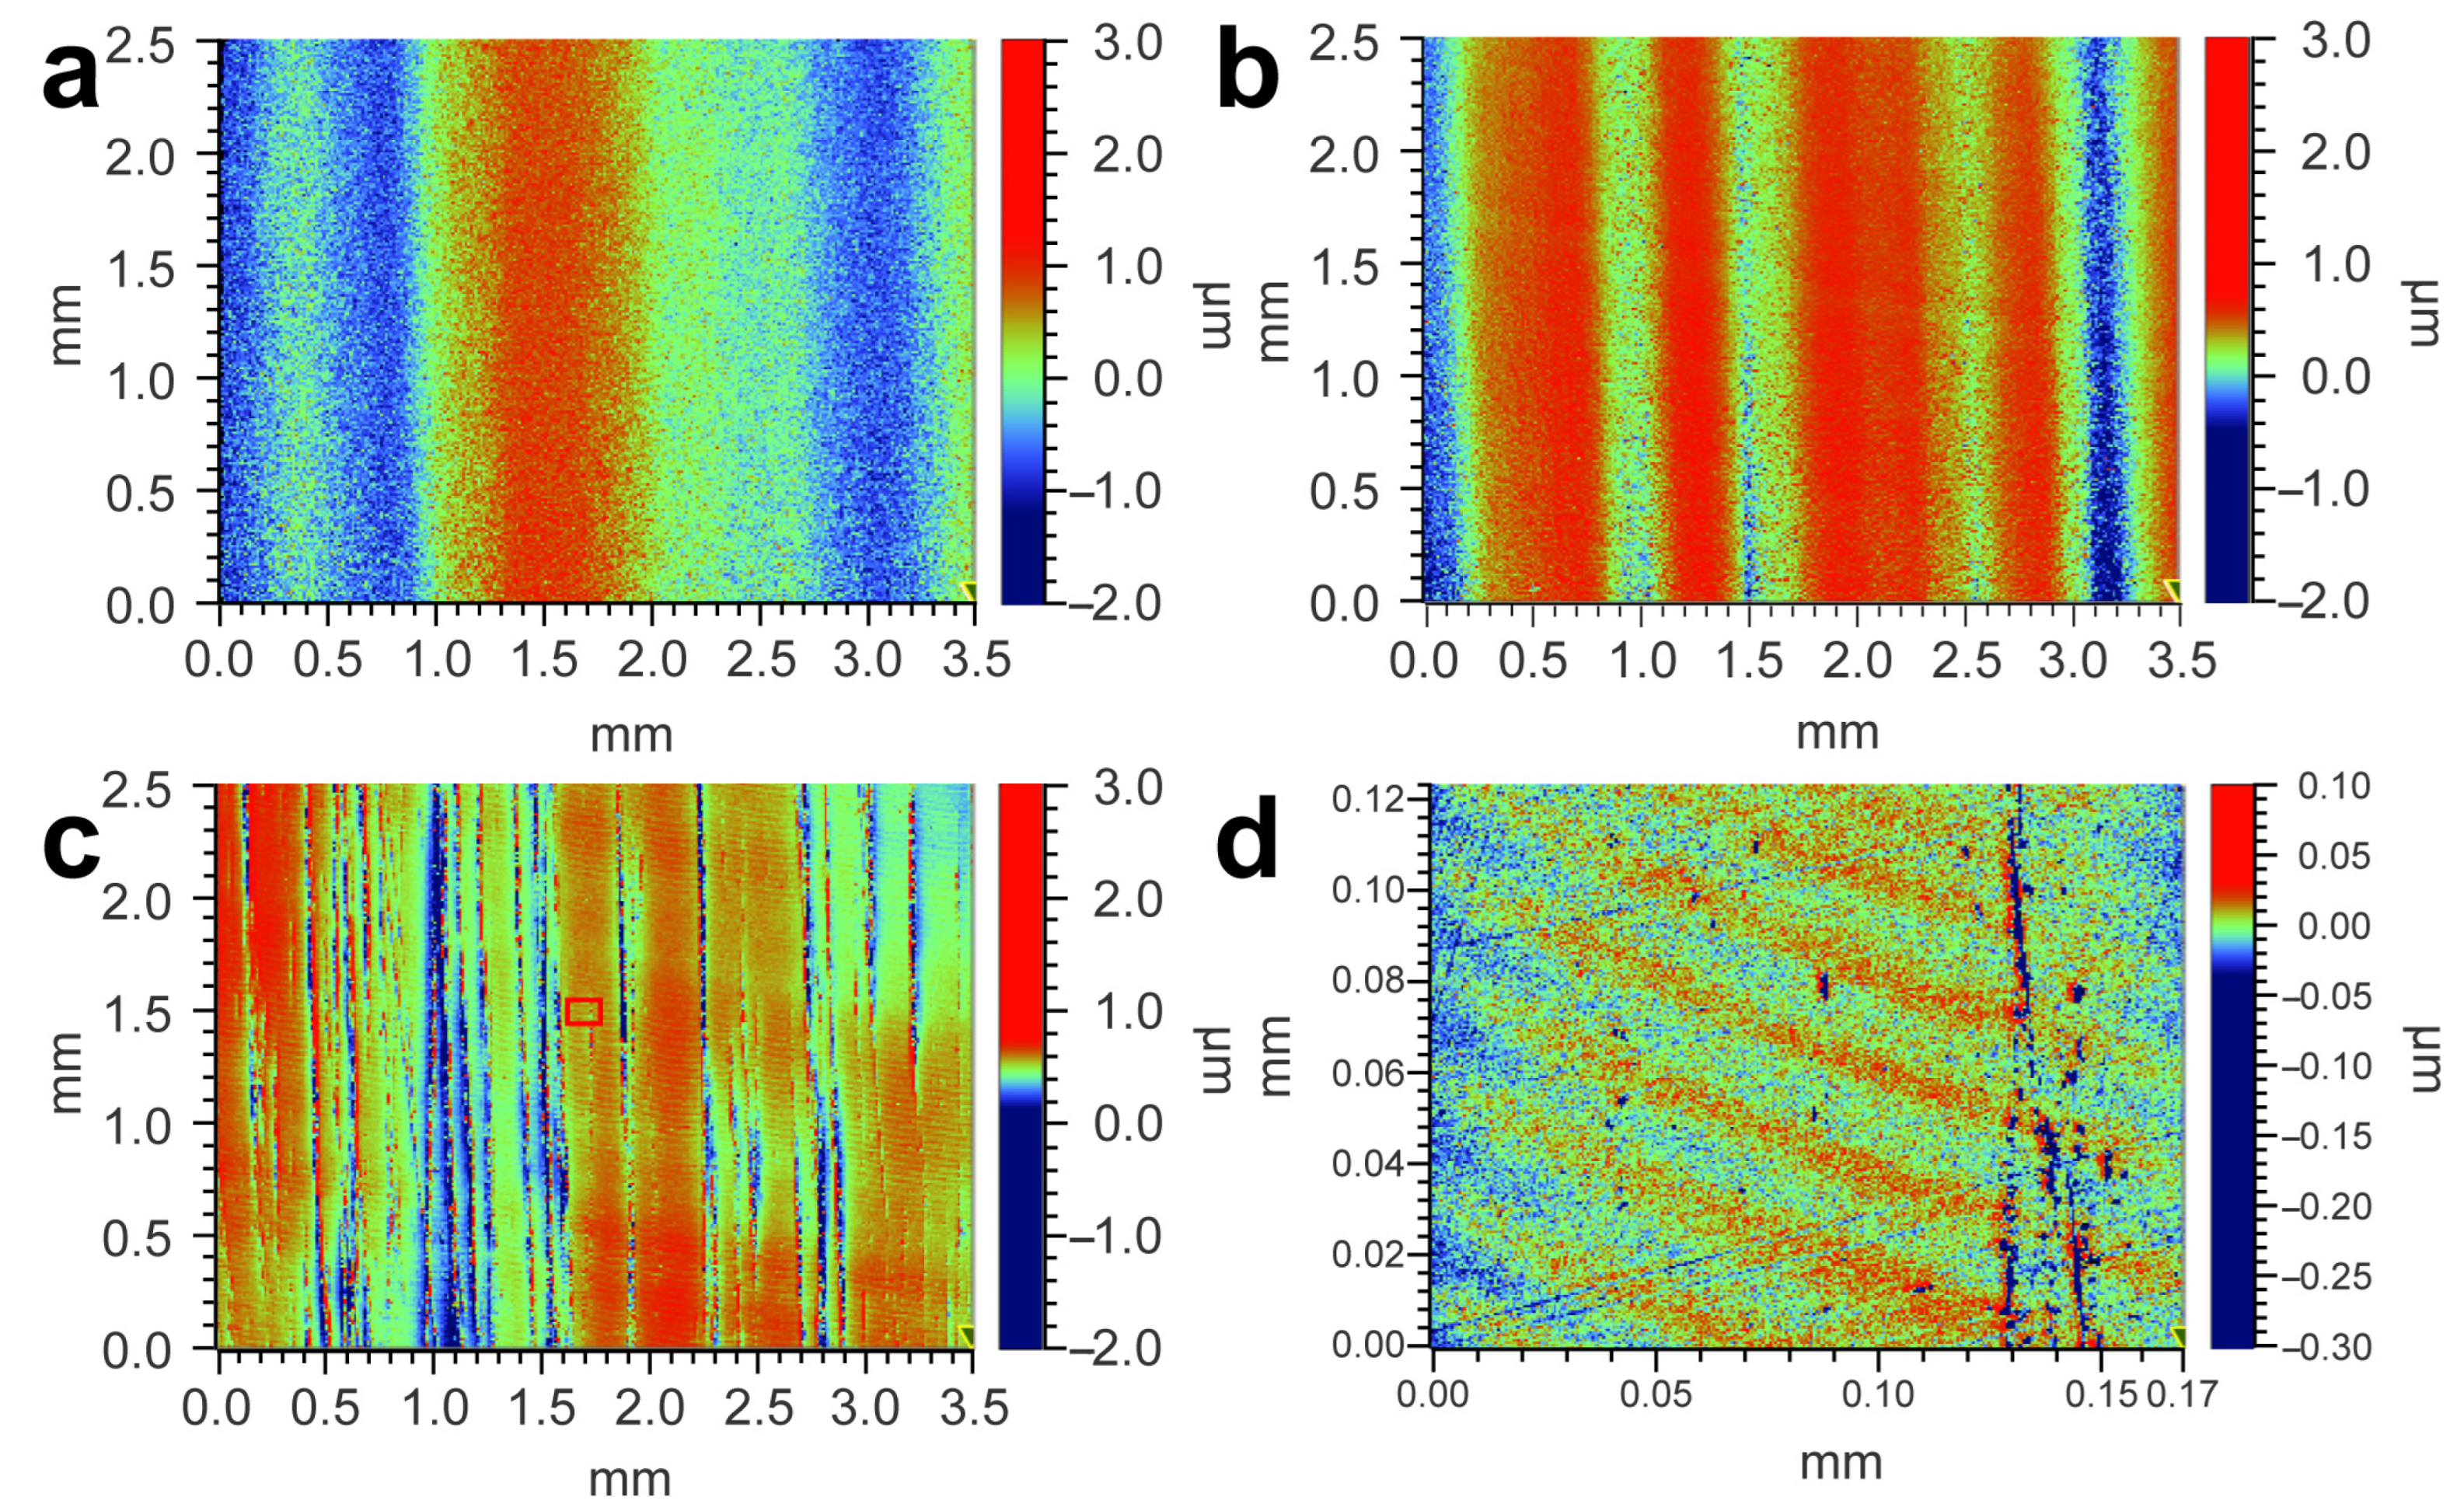
3.4. SiC Surface Polished by CeO2

Powder consisting of flaky CeO2 with Al2O3 (about 10 μm, calcined at 900 °C and added AlOOH in the ratio Ce:Al = 1:5) and common spherical CeO2 abrasive (2.3 μm) were used to polish SiC wafers to compare the polishing performance. In Figure 8a, the SiC surface before polishing exhibits surface characteristics of alternating high and low elongated bars, and the surface roughness Ra is 464 nm. In Figure 8b, the height differences of the surface polished by spherical CeO2 abrasive are reduced, and the roughness Ra is reduced from 464 nm to 230 nm. In Figure 8c, the height differences of the surface polished by flaky CeO2 are the lowest, with a Ra roughness of 67 nm. Figure 8d shows the optical profile of a local higher area of 0.17 mm × 0.12 mm in the red box of Figure 8c, and the Ra is measured as 11 nm. The surface roughness and the height difference are much lower than those associated with polishing by spherical abrasives.

4. Conclusions

In conclusion, a novel flaky CeO2 composed of nanocrystals was obtained using ordinal precipitation. AlOOH was added to contribute to the nucleation of the nanograins. Meanwhile, Al3+ doped in CeO2 facilitated the increase in Ce3+, which was proved by XPS analysis. When the Al3+ was doped in the ratio Al:Ce = 5:1, the Ce3+ increased from 26.00% to 31.11%. Al3+ without doping in CeO2 transformed into Al2O3, enhancing the mechanical strength of the powder. After the SiC wafer was polished by a slurry containing flaky CeO2 for 1 h, the height differences decreased significantly, and the surface roughness Ra was reduced from 464 nm to 11 nm in an area of 0.17 mm × 0.12 mm.

Author Contributions

Conceptualization, L.G.; Formal analysis, Y.Z.; Investigation, Y.Z.; Data curation, Y.Z.; Writing—original draft, Y.Z.; Writing—review & editing, L.G.; Supervision, L.G. All authors have read and agreed to the published version of the manuscript.

Funding

This research received no external funding.

Institutional Review Board Statement

Not applicable.

Informed Consent Statement

Not applicable.

Data Availability Statement

Data are contained within the article.

Conflicts of Interest

The authors declare no conflict of interest.

References

  1. Nolan, M. Formation of Ce3+ at the cerium dioxide (110) surface by doping. Chem. Phys. Lett. 2010, 492, 115–118. [Google Scholar] [CrossRef]
  2. Kong, J.; Xiang, Z.; Li, G.; An, T. Introduce oxygen vacancies into CeO2 catalyst for enhanced coke resistance during photothermocatalytic oxidation of typical VOCs. Appl. Catal. B Environ. 2020, 269, 118755. [Google Scholar] [CrossRef]
  3. Chang, K.; Zhang, H.; Cheng, M.-J.; Lu, Q. Application of Ceria in CO2 Conversion Catalysis. ACS Catal. 2020, 10, 613–631. [Google Scholar] [CrossRef]
  4. Yin, D.; Zhao, F.; Zhang, L.; Zhang, X.; Liu, Y.; Zhang, T.; Wu, C.; Chen, D.; Chen, Z. Greatly enhanced photocatalytic activity of semiconductor CeO2 by integrating with upconversion nanocrystals and graphene. RSC Adv. 2016, 6, 103795–103802. [Google Scholar] [CrossRef]
  5. Kim, S.K.; Chang, H.; Jang, H.D. Synthesis of micron-sized porous CeO2-SiO2 composite particles for ultraviolet absorption. Adv. Powder Technol. 2017, 28, 406–410. [Google Scholar] [CrossRef]
  6. Abid, S.A.; Taha, A.A.; Ismail, R.A.; Mohsin, M.H. Antibacterial and cytotoxic activities of cerium oxide nanoparticles prepared by laser ablation in liquid. Environ. Sci. Pollut. Res. 2020, 27, 30479–30489. [Google Scholar] [CrossRef] [PubMed]
  7. Guo, L.; Wang, Y.; Liu, M.; Gao, Y.; Ye, F. CeO2 Protective Material against CMAS Attack for Thermal–Environmental Barrier Coating Applications. Coatings 2023, 13, 1119. [Google Scholar] [CrossRef]
  8. Cheng, J.; Huang, S.; Li, Y.; Wang, T.; Xie, L.; Lu, X. RE (La, Nd and Yb) doped CeO2 abrasive particles for chemical mechanical polishing of dielectric materials: Experimental and computational analysis. Appl. Surf. Sci. 2020, 506, 144668. [Google Scholar] [CrossRef]
  9. Lu, C.-H.; Wang, H.-C. Formation and microstructural variation of cerium carbonate hydroxide prepared by the hydrothermal process. Mater. Sci. Eng. B 2002, 90, 138–141. [Google Scholar] [CrossRef]
  10. Chen, L.; Xie, H.; Liu, Y.; Huang, K. Synthesis of Bundle- and Flake-Like CeO2 Powders Via a Precursor-Pyrolysis Approach. J. Am. Ceram. Soc. 2007, 90, 1232–1236. [Google Scholar] [CrossRef]
  11. Gong, J.; Meng, F.; Yang, X.; Fan, Z.; Li, H. Controlled hydrothermal synthesis of triangular CeO2 nanosheets and their formation mechanism and optical properties. J. Alloys Compd. 2016, 689, 606–616. [Google Scholar] [CrossRef]
  12. Gai, W.Z.; Zhang, S.H.; Yang, Y.; Zhang, X.H.; Deng, Z.Y. Separation of Excess Fluoride from Water Using Amorphous and Crystalline AlOOH Adsorbents. ACS Omega 2016, 6, 16488–16497. [Google Scholar] [CrossRef] [PubMed]
  13. Baccarella, A.M.; Garrard, R.; Beauvais, M.L.; Bednarksi, U.; Fischer, S.; Abeykoon, A.M.; Chapman, K.W.; Phillips, B.L.; Parise, J.B.; Simonson, J.W. Cluster mediated conversion of amorphous Al(OH)3 to γ-AlOOH. J. Solid State Chem. 2021, 301, 122340. [Google Scholar] [CrossRef]
  14. Poggio, E.; Jobbágy, M.; Moreno, M.; Laborde, M.; Mariño, F.; Baronetti, G. Influence of the calcination temperature on the structure and reducibility of nanoceria obtained from crystalline Ce(OH)CO3 precursor. Int. J. Hydrogen Energy 2011, 36, 15899–15905. [Google Scholar] [CrossRef]
  15. Nylund, A.; Olefjord, I. Surface analysis of oxidized aluminium. 1. Hydration of Al2O3 and decomposition of Al(OH)3 in a vacuum as studied by ESCA. Surf. Interface Anal. 1994, 21, 283–289. [Google Scholar] [CrossRef]
  16. Majumder, D.; Chakraborty, I.; Mandal, K.; Roy, S. Facet-Dependent Photodegradation of Methylene Blue Using Pristine CeO2 Nanostructures. ACS Omega 2019, 4, 4243–4251. [Google Scholar] [CrossRef] [PubMed]
  17. Li, L.; Deng, J.; Chen, J.; Xing, X. Topochemical molten salt synthesis for functional perovskite compounds. Chem. Sci. 2016, 7, 855–865. [Google Scholar] [CrossRef] [PubMed]
  18. Kim, N.-Y.; Kim, G.; Sun, H.; Hwang, U.; Kim, J.; Kwak, D.; Park, I.-K.; Kim, T.; Suhr, J.; Nam, J.-D. A nanoclustered ceria abrasives with low crystallinity and high Ce3+/Ce4+ ratio for scratch reduction and high oxide removal rates in the chemical mechanical planarization. J. Mater. Sci. 2022, 57, 12318–12328. [Google Scholar] [CrossRef]
Figure 1. Thermal analysis curves of the precursors composed of CeOHCO3 and AlOOH.
Materials 17 02859 g001
Figure 2. XRD patterns of (a) precursor and powder calcined at 200 °C, and (b) powder calcined at different temperatures.
Materials 17 02859 g002
Figure 3. SEM images of the sample at different temperatures: (a) uncalcined precursor (b) 350 °C (c) 700 °C (d) 900 °C (e)1200 °C and (f) big grains at 1200 °C.
Materials 17 02859 g003
Figure 4. EDS images of the sample calcined at 900 °C.
Materials 17 02859 g004
Figure 5. (a) TEM morphology of CeO2 grains and (b) lattice fringes of (111) in the HRTEM image.
Materials 17 02859 g005
Figure 6. Illustration of the formation mechanism of flaky nanocrystal CeO2.
Materials 17 02859 g006
Figure 7. XPS spectra of CeO2 without AlOOH (a) and CeO2 with Al in ratio of (b) Al:Ce = 1:5 (c), Al:Ce = 1:1 and (d) Al:Ce = 5:1.
Materials 17 02859 g007
Figure 8. Surface profile of (a) SiC before polishing, (b) polished by common spherical CeO2 abrasive, (c) polished by flaky CeO2 abrasive, and (d) microregion of SiC polished by flaky abrasive.
Materials 17 02859 g008
Table 1. XPS peak assignments of Ce 3d.
No.Ce 3d5/2Ce 3d3/2Ce3+ (%)
v0v1v2v3v4u0u1u2u3u4
Ce3+Ce4+Ce3+Ce4+Ce4+Ce3+Ce4+Ce3+Ce4+Ce4+
11.5610.0713.1414.4720.30.616.6710.699.0213.626.00
20.3910.3213.8915.7719.630.596.8410.099.4513.0224.96
32.059.2615.6314.6220.022.416.148.398.213.2728.48
41.379.3917.2314.3218.9610.516.222.017.4112.5731.11
Disclaimer/Publisher’s Note: The statements, opinions and data contained in all publications are solely those of the individual author(s) and contributor(s) and not of MDPI and/or the editor(s). MDPI and/or the editor(s) disclaim responsibility for any injury to people or property resulting from any ideas, methods, instructions or products referred to in the content.

