Article

Contrast Enhancement in MRI Using Combined Double Action Contrast Agents and Image Post-Processing in the Breast Cancer Model

by
David MacDonald
1,
Frank C. J. M. van Veggel
2,
Boguslaw Tomanek
1,3,4 and
Barbara Blasiak
1,*
1
Institute of Nuclear Physics Polish Academy of Science, Radzikowskiego 152, 31-342 Krakow, Poland
2
Department of Chemistry, Centre for Advanced Materials & Related Technologies (CAMTEC), University of Victoria, Victoria, BC V8P 5C2, Canada
3
Division of Medical Physics, Department of Oncology, University of Alberta, 8303 112 St NW, Edmonton, AB T6G 2T4, Canada
4
Department of Clinical Neurosciences and Radiology, University of Calgary, 2500 University Drive NW, Calgary, AB T2N 1N4, Canada
*
Author to whom correspondence should be addressed.
Materials 2023, 16(8), 3096; https://doi.org/10.3390/ma16083096
Submission received: 8 March 2023 / Revised: 2 April 2023 / Accepted: 11 April 2023 / Published: 14 April 2023

Abstract

:
Gd- and Fe-based contrast agents reduce T1 and T2 relaxation times, respectively, are frequently used in MRI, providing improved cancer detection. Recently, contrast agents changing both T1/T2 times, based on core/shell nanoparticles, have been introduced. Although advantages of the T1/T2 agents were shown, MR image contrast of cancerous versus normal adjacent tissue induced by these agents has not yet been analyzed in detail as authors considered changes in cancer MR signal or signal-to-noise ratio after contrast injection rather than changes in signal differences between cancer and normal adjacent tissue. Furthermore, the potential advantages of T1/T2 contrast agents using image manipulation such as subtraction or addition have not been yet discussed in detail. Therefore, we performed theoretical calculations of MR signal in a tumor model using T1-weighted, T2-weighted, and combined images for T1-, T2-, and T1/T2-targeted contrast agents. The results from the tumor model are followed by in vivo experiments using core/shell NaDyF4/NaGdF4 nanoparticles as T1/T2 non-targeted contrast agent in the animal model of triple negative breast cancer. The results show that subtraction of T2-weighted from T1-weighted MR images provides additional increase in the tumor contrast: over two-fold in the tumor model and 12% in the in vivo experiment.

1. Introduction

Magnetic resonance imaging (MRI) provides the best soft tissue contrast among diagnostic imaging modalities such as computed tomography (CT), positron emission tomography (PET), or X-ray. The contrast provided by MRI is based on proton density as well as the T1 and T2 relaxation times of an imaged object. MRI technique utilizes these parameters for contrast manipulation by applying proton density, T1-weighted (T1w) or T2-weighted (T2w) MR images. MRI contrast may be provided solely by tissues themselves, due to differences in their relaxation times. Contrast agents shortening T1 and/or T2 relaxation times improve the detection of small pathologies such as those seen in early stages of cancer. The most commonly used T2w MRI pulse sequences are based on spin echo (SE) or gradient echo (GE) with long repetition time (TR) and long echo time (TE) [1]. For fast T1w, inversion recovery (IR) pulse can be added before a pulse sequence (e.g., IR-GE) [2].
Tissues with short T1 relaxation provide positive (hyperintense) contrast, while tissues with short T2 relaxation provide a lower signal hence negative (hypointense) contrast. Contrast agents, shortening T1 and/or T2, accumulating in tissues of interest, such as tumors, are used to enhance these effects to improve the diagnostic capabilities of MRI, especially for small biological targets [3].
Due to high r1 relaxivity (r1 = 1/T1) Gd3+-based particles are commonly used as T1 contrast agents [4] while superparamagnetic iron oxide nanoparticles (SPION) are used as T2 contrast agents due to their high r2 relaxivity (r2 = 1/T2) [5]. The large magnetic moments of T2 contrast agents cause high signal change per unit of particles, therefore small quantities of SPION are sufficient to obtain strong contrast imaging [6,7,8]. Furthermore, SPIONS are less toxic than Gd3+. Their surface can be functionalized enhancing their specificity, biocompatibility, and biodegradability [6,9,10]. SPION can be employed for targeted drug delivery to cancer cells and other disease sites by synthesizing them with target-specific proteins [6,7,10]. While SPION can be relatively easily functionalized, they reduce mostly T2 relaxations, providing negative contrast which limits their diagnostic capability [5].
Recently, core/shell nanoparticles have been produced and used as contrast agents due to their capability of reducing both T1 and T2 relaxation times. The nanoparticles that reduce both T1 and T2 relaxation times have been used as contrast agents to improve diagnosis of various diseases, for example: atherosclerotic plaque in the carotid arteries [11], liver metastases [12], identification of white matter lesions in multiple sclerosis (MS) [13], prostate cancer in animal models [14], or in functional MRI to improve the contrast between brain tissues [15]. The core of the dual contrast agents consisting of inorganic material can be covered with either inorganic materials (e.g., silica or gold) or organic materials (phospholipids, fatty acids, polysaccharides, peptides, or other surfactants and polymers) [3,16]. The advantages of some of these nanoparticles include lower toxicity, greater dispersibility, biocompatibility, easier conjugation with other bioactive molecules, and increased thermal and chemical stability [3,17]. These properties can be controlled by the selection of their composition and size. For example, iron oxide was doped with Gd3+, and NaDyF4 nanoparticles (NPs) were covered with NaGdF4 showing high r1 and r2 relaxivity [18]. In the NaDyF4/NaGdF4 contrast agent, the dysprosium (Dy3+) ion provides T2 contrast while Gd3+ provides mostly T1 contrast [19]. Hybrids of nanocubes with both iron and gadolinium as T1/T2 dual contrast agents were also produced and used in in vivo MRI [20]. It was also shown that the relaxivities of nanoparticles depend on their size [21].
While manipulation of the contrast agent’s composition and its size enables higher relaxivity, the maximum concentration hence toxicity remains to be the major obstacle in improving MRI diagnostic capabilities. To deal with this issue, Girard et al. proposed to apply a combination of MRI pulse sequences to utilize changes in both T1 and T2 relaxation times due to the presence of dual action (T1 and T2) contrast agents [22]. The authors used a spin echo (SE) and ultrashort echo (UTE) pulse sequences and calculated optimal pulse sequence parameters (echo time, repetition time, flip angle) for both sequences to obtain improved contrast [22].
So far, reports on contrast agents analyzed solely the changes in tumor signal after contrast agent injection, neglecting changes in the surrounding tissue [23]. However, from the diagnostic perspective, this approach is not optimal, as the tumor signal changes should be compared to signal changes in the adjacent tissues. Recently some authors proposed image post-processing to enhance the signal-to-noise ratio (SNR) of a tumor, defining SNR as the average tumor signal divided by the standard deviation of the noise [23]. While this approach is advantageous, it does not consider signal changes in both tumor and normal adjacent tissue, as contrast agents accumulate in both tumor and normal adjacent tissue. Therefore, we studied and compared changes in signals of both the tumor and normal adjacent tissue rather than the tumor SNR alone. We also performed a simple image manipulation of a phantom tumor model subtracting and adding T1w, and T2w images when T1/T2 “perfect” (i.e., accumulating in tumor only) targeted contrast agents were used. The results show that subtraction of T1w and T2w pre- and post-contrast MR images improves the tumor contrast. Theoretical calculations are followed by an example of in vivo MRI in a mouse model of triple negative breast cancer (TNB) at 9.4T using core/shell NaDyF4/NaGdF4 (21.2 nm/0.6 nm) contrast agent.

2. Materials and Methods

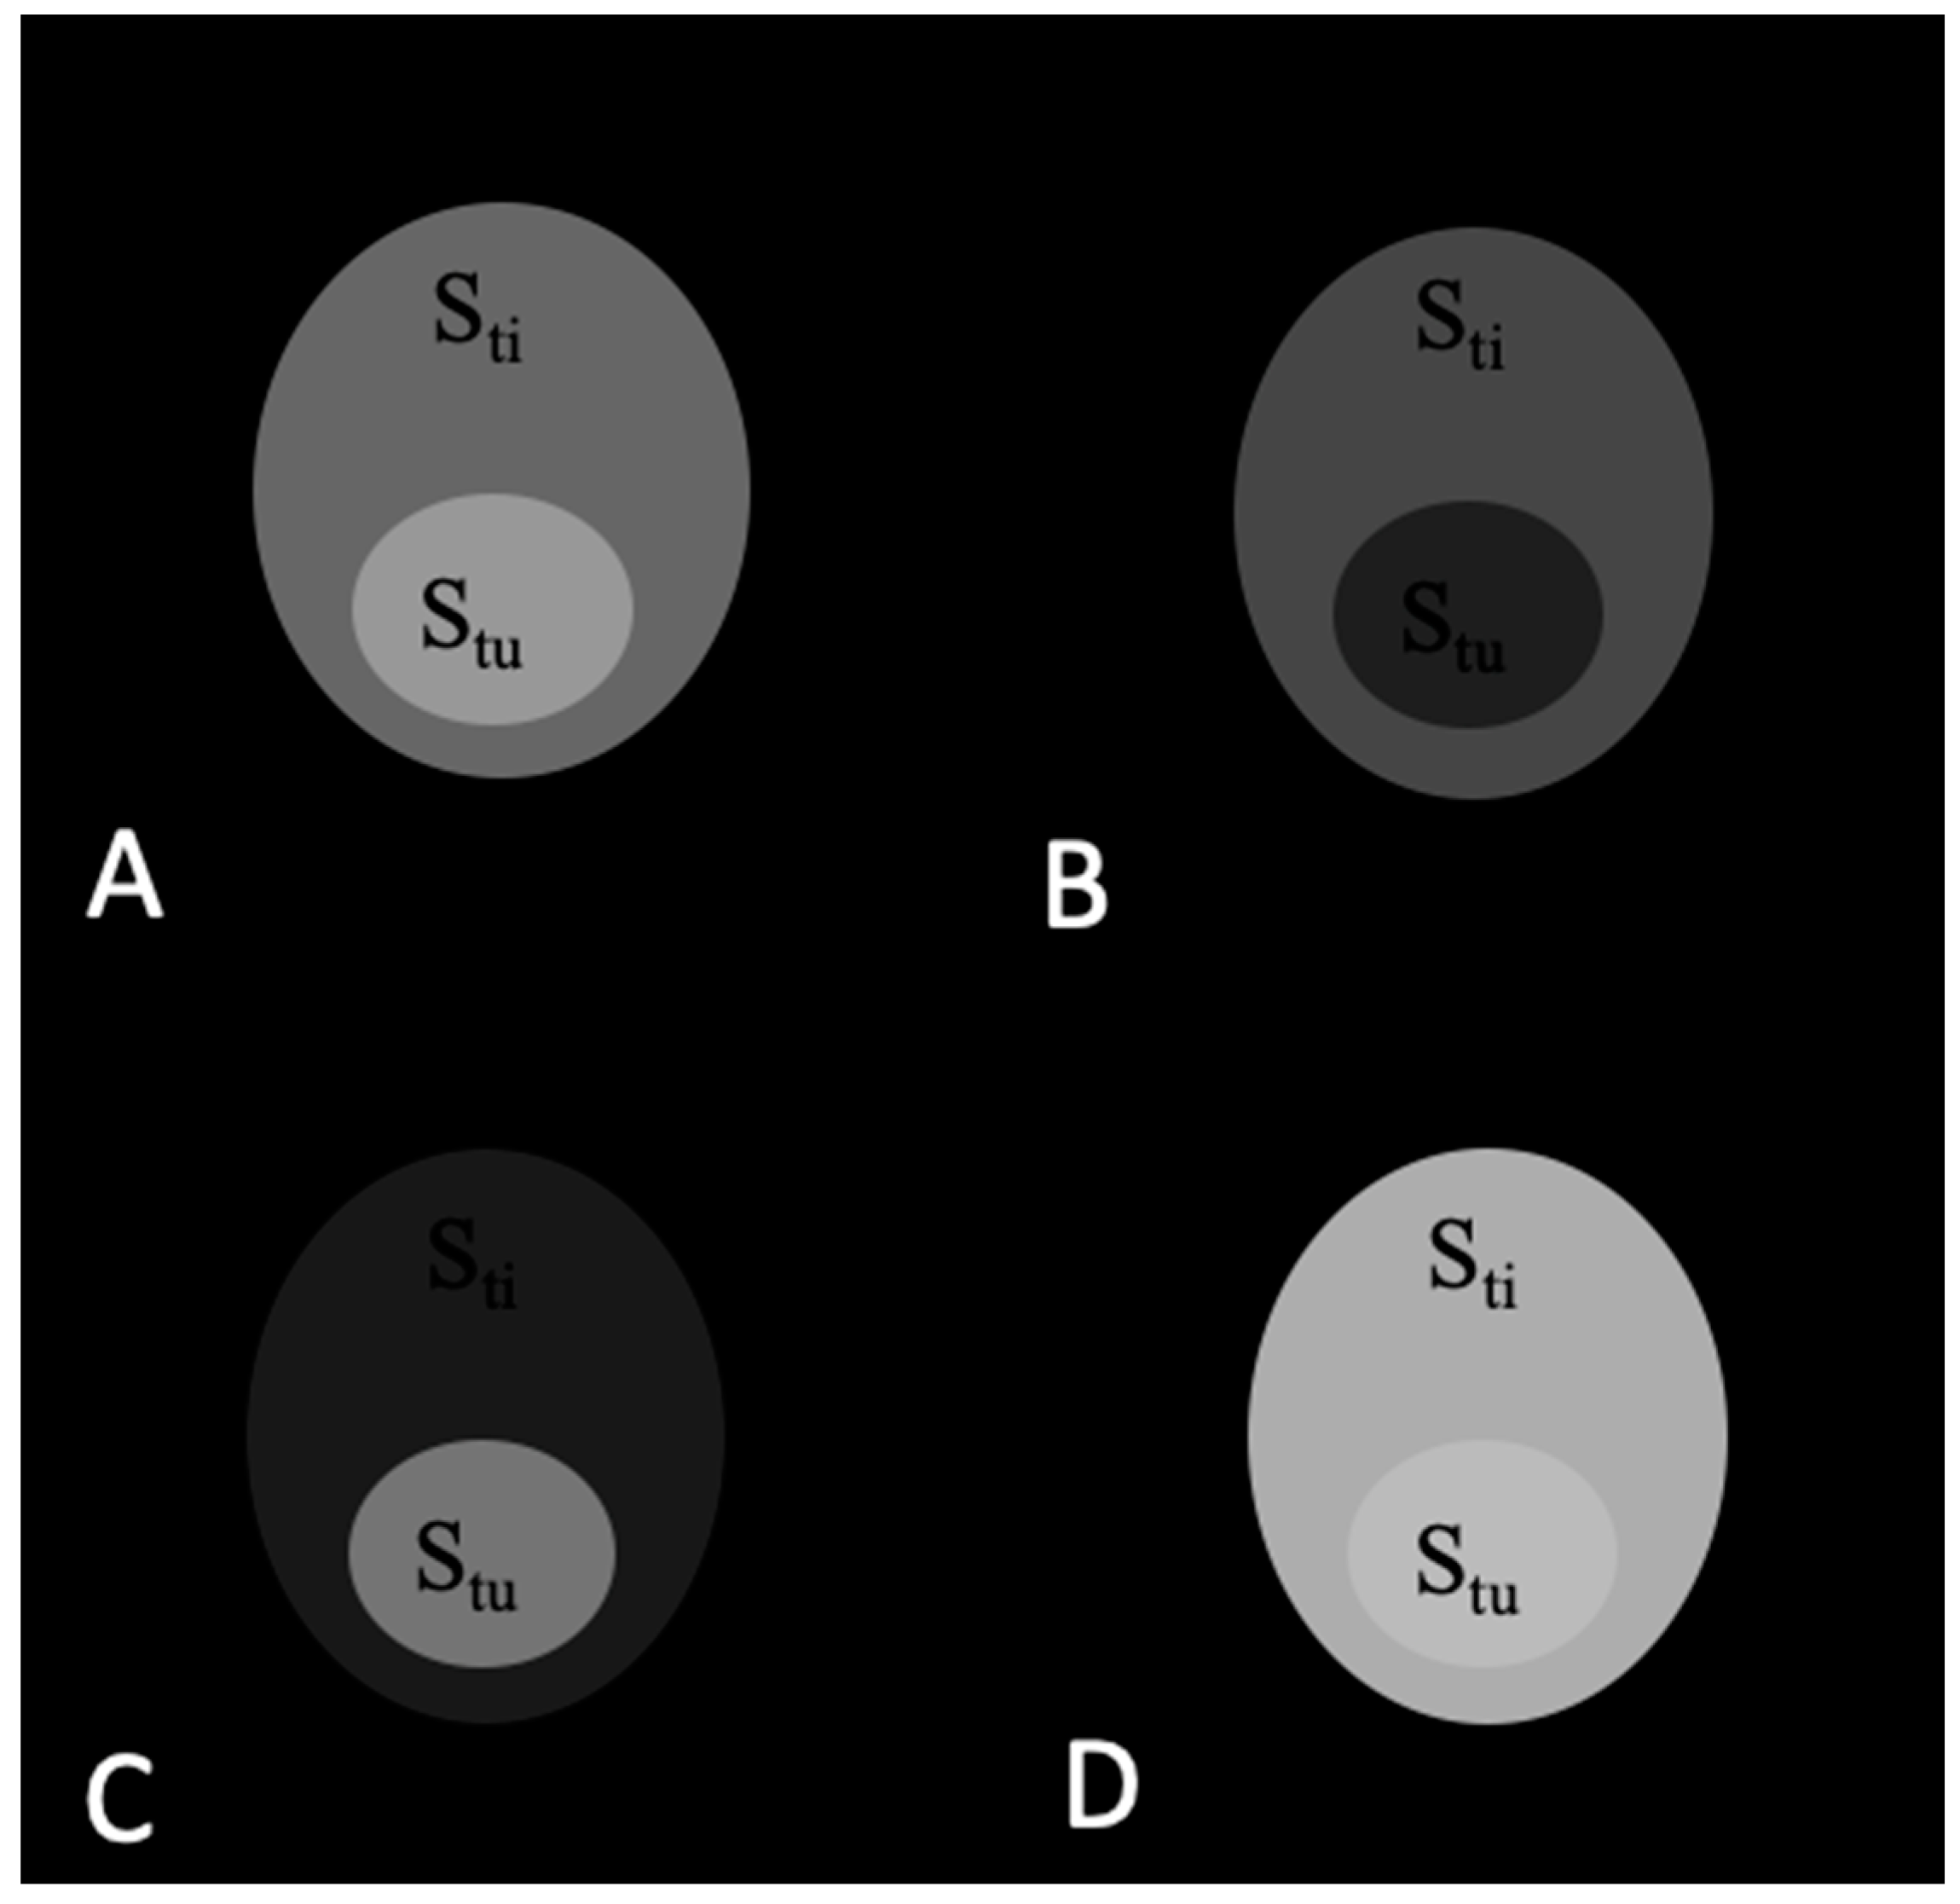
2.1. Theoretical Analysis of a Phantom Tumor Model

For theoretical analysis of tumor contrast enhancement in MRI accomplished with contrast agents, we considered the signal changes in T1w and T2w MR images caused by the application of T1, T2, and T1/T2 contrast agents. We assumed that the tumor is located within the normal adjacent tissue and that both the tumor and normal adjacent tissue have an elliptical shape and are homogenous (Figure 1). We defined tumor contrast (TC) as a ratio of signal from the tumor divided by the signal from adjacent tissue: TC = Stu/Sti, where Stu is the average signal from the tumor, and Sti is the average signal coming from the adjacent tissue.
Based on the previous reports on cancer MRI and, in particular, on MRI of breast cancer studies (e.g., [24]) showing about 50% TC enhancement caused by contrast agent injection, we considered a “perfect” tumor phantom model. This allowed us to study TC without influencing factors occurring in vivo (e.g., variable contrast absorption, tumor metabolism, tumor stage, contrast agent concentration etc.,) and MRI pulse sequence type and its parameters. We first assumed that tumor and surrounding tissue signals are identical in both T1w (equal to 100 arbitrary units (au)) and in T2w images (equal to 70 au). We also assumed “perfect” targeted contrast agents, accumulated in the tumor only. We further assumed, for T1 contrast agent, the signal increases by 50% in tumor only and does not change in the normal adjacent tissue. Similarly, for T2 contrast agent: signal from tumor decreases by 50% and is unchanged in normal adjacent issue in T2w MR images. For T1/T2 contrast agent, we assumed 50% signal increase and 50% reduction in T1w and T2w images, respectively [25,26]. In addition to providing signal values obtained from T1w and T2w images, we also added and subtracted images (Table 1).

2.2. Animal Model of Breast Cancer

For the mouse model of TNB, we used MDA-MB-231 cells [14]. Cells were cultured in RPMI supplemented with 5% fetal bovine serum (RPMI/5%) and maintained in a humidified 5% CO2 atmosphere at 37 °C. Cells were harvested by trypsinization (EDTA/trypsin), resuspended in RPMI/5%, and counted (BioRad TC10 counter, Hercules, CA, USA). About 2 × 10⁶ cells/mL of RPMI/5% were prepared and kept at 37 °C in a water bath up to the orthotopic implantation. At that point, cells were centrifuged (1500 rpm, 5 min) and resuspended in 20 μL sterile saline, and injected into the left #4 inguinal mammary gland of a 6-week old nu/nu female mouse. Implanted in the mouse mammary gland, MDA-MB-231 cells grew as solid spheroidal tumors over 3 weeks. Once the tumor had reached a size of ~50 mm3, the mouse (weight 35.6 g, heart rate 310–840 beats/min, body temp 36.5–38.0°) was injected via the tail vein with the contrast agent.

2.3. Synthesis and Characterisation of the NaDyF4/NaGdF4 Nanoparticles

The details of the NaDyF4/NaGdF4 synthesis are described elsewhere [14]. Briefly, prior to the synthesis of the core/shell NPs, cubic-phase (α) NaGdF4 NPs were synthesized, which acted as the sacrificial NPs for shell formation [27]. The multi-step process of the cubic (α) phase of sacrificial NaGdF4 synthesis started from gadolinium oxide, via gadolinium trifluoroacetate, mixed with various chemicals, heating, washing, and cooling cycles. Finally, the NP precipitated and washed with ethanol and dispersed in hexane. To synthesize NaDyF4, dysprosium (III) chloride hexahydrate was stirred in oleic acid and 1-octadecene under vacuum for 45 min at 120 °C. Further steps included heating, cooling, and stirring solutions of methanol containing sodium hydroxide and ammonium fluoride. After removing methanol by heating, the previously synthesized sacrificial (α) NaGdF4 nanoparticles dispersed in 1-octadecene (1 mL) were injected into the solution and stirred for 15 min to form a core-shell nanostructure. The nanoparticles were precipitated and washed with ethanol, and then finally dispersed in hexanes [14].
The synthesized NaDyF4/NaGdF4 NPs were analyzed using the X-ray diffraction method (XRD), showing the standard pattern of the hexagonal phase (β) of the NaDyF4 core. Analysis of the particle size distribution using the transmission electron microscopy (TEM) images showed a NaGdF4 shell thickness of 0.6 ± 0.1 nm while the core NaDyF4 NP showed a diameter of 21.2 ± 0.1 nm and the core/shell NPs had a diameter of 21.8 ± 0.1 nm. The relaxivities r1 and r2 of the NaDyF4/NaGdF4 NPs in deionized water were r1 = (9.0 ± 0.2) × 105 mM−1 s−1 and r2 = (147.0 ± 7.5) × 105 mM−1 s−1 respectively [14].

2.4. In Vivo MRI Experiments

A 9.4 T, 21 cm magnet bore MRI system (Bruker, Ettlingen, Germany) was used for the in vivo experiments. A volume radio frequency coil was placed over the animal covering the region of interest (ROI). The animal was imaged before and 15 min after the injection of NaDyF4/NaGdF4 (~21.2 nm/0.6 nm) non-targeted contrast agent. A total of 0.250 mL of the contrast agent was administered via the tail vein (vehicle, 0.9% saline) [14]. For the MRI, anesthesia was induced with 4% isoflurane and maintained with 2.7% isoflurane in 69% N2O and 30% O2 using a vaporizer. The animal experiment was approved by the local Animal Care Committee (number AC13-0202).

2.5. MR Imaging Parameters

To collect T1w and T2w in vivo MRI, we used rapid acquisition with relaxation enhancement (RARE) and multi-echo spin-echo (MESE) pulse sequences, respectively. The sequences were triggered with respiration to reduce possible motion artifacts. Parameters used for the T1w RARE pulse sequence were: echo time (TE) 7 ms, repetition time (TR) 750 ms, field of view (FOV) 2.56 × 2.56 cm, slice thickness 1 mm, and matrix 128 × 128. Parameters of the T2 weighted SE pulse sequence were: TE = 35 ms, TR = 5000 ms, FOV = 2.56 × 2.56 cm, slice thickness 1 mm, and matrix size 128 × 128. The images were collected before and 15 min post injection of the NaDyF4/NaGdF4 (average diameter of 21.2 nm and an average shell thickness of 0.6 nm) core/shell non-targeted contrast agent [14].

2.6. Selection of ROIs

The ROIs for the tumor and adjacent tissue were selected manually and an example of this is shown in Figure 2. The green line delineates the adjacent tissue and the red line delineates the tumor. Signal values Stu and Sti were calculated as the average of the signal intensities within ROI. Tumor contrast (TC) was analyzed in T1w and T2w MR images, as well as in subtracted and added T1w and T2w images before and after contrast agent injection. The subtraction and addition of images were performed using ImageJ (Bethesda, MD, USA) version 1.53 software in 16-bit format. The images were then converted to an 8-bit image jpeg format (0–255) and the analysis was completed with Python (Centrum Wiskunde & Informatica, Amsterdam, The Netherlands) version 3.6.

3. Results

3.1. Calculations of Contrast in a Tumor Phantom Model

The signals from the tumor and adjacent tissue as well as TC values before and after application of contrast agents are shown in Table 1. The corresponding images are shown in Figure 3, Figure 4, Figure 5 and Figure 6.
As seen in Table 1 and Figure 3, TC is the same and equals 1.00 before the contrast agent injection in T1w and T2w images as well as the subtracted and added images.
The TC values change in T1w, T2w, T1w − T2w, and T1w + T2w after injection of all contrast agents. For the T1 contrast agent, TC values are 1.50, 1.00, 2.67, and 0.71 in T1w, T2w, T1w − T2w, and T1w + T2w images, respectively. Figure 4A–D show the corresponding images. The highest TC = 2.67 is visible in the subtracted images (Figure 4C). The TC values change after injection of the T2 contrast agent and are 1.00, 0.47, 2.17, and 1.07 in T1w, T2w, T1w − T2w, and T1w + T2w images, respectively. Figure 5A–D show the corresponding images. The highest TC = 2.17 value is visible in the subtracted images (Figure 5C). TC values change after injection of the T1/T2 contrast agent and are 1.50, 0.50, 3.83, and 1.09 in T1w, T2w, T1w − T2w, and T1w + T2w images, respectively. Figure 6A–D show the corresponding images. The highest TC = 3.83 value is visible in the subtracted images (Figure 6C).

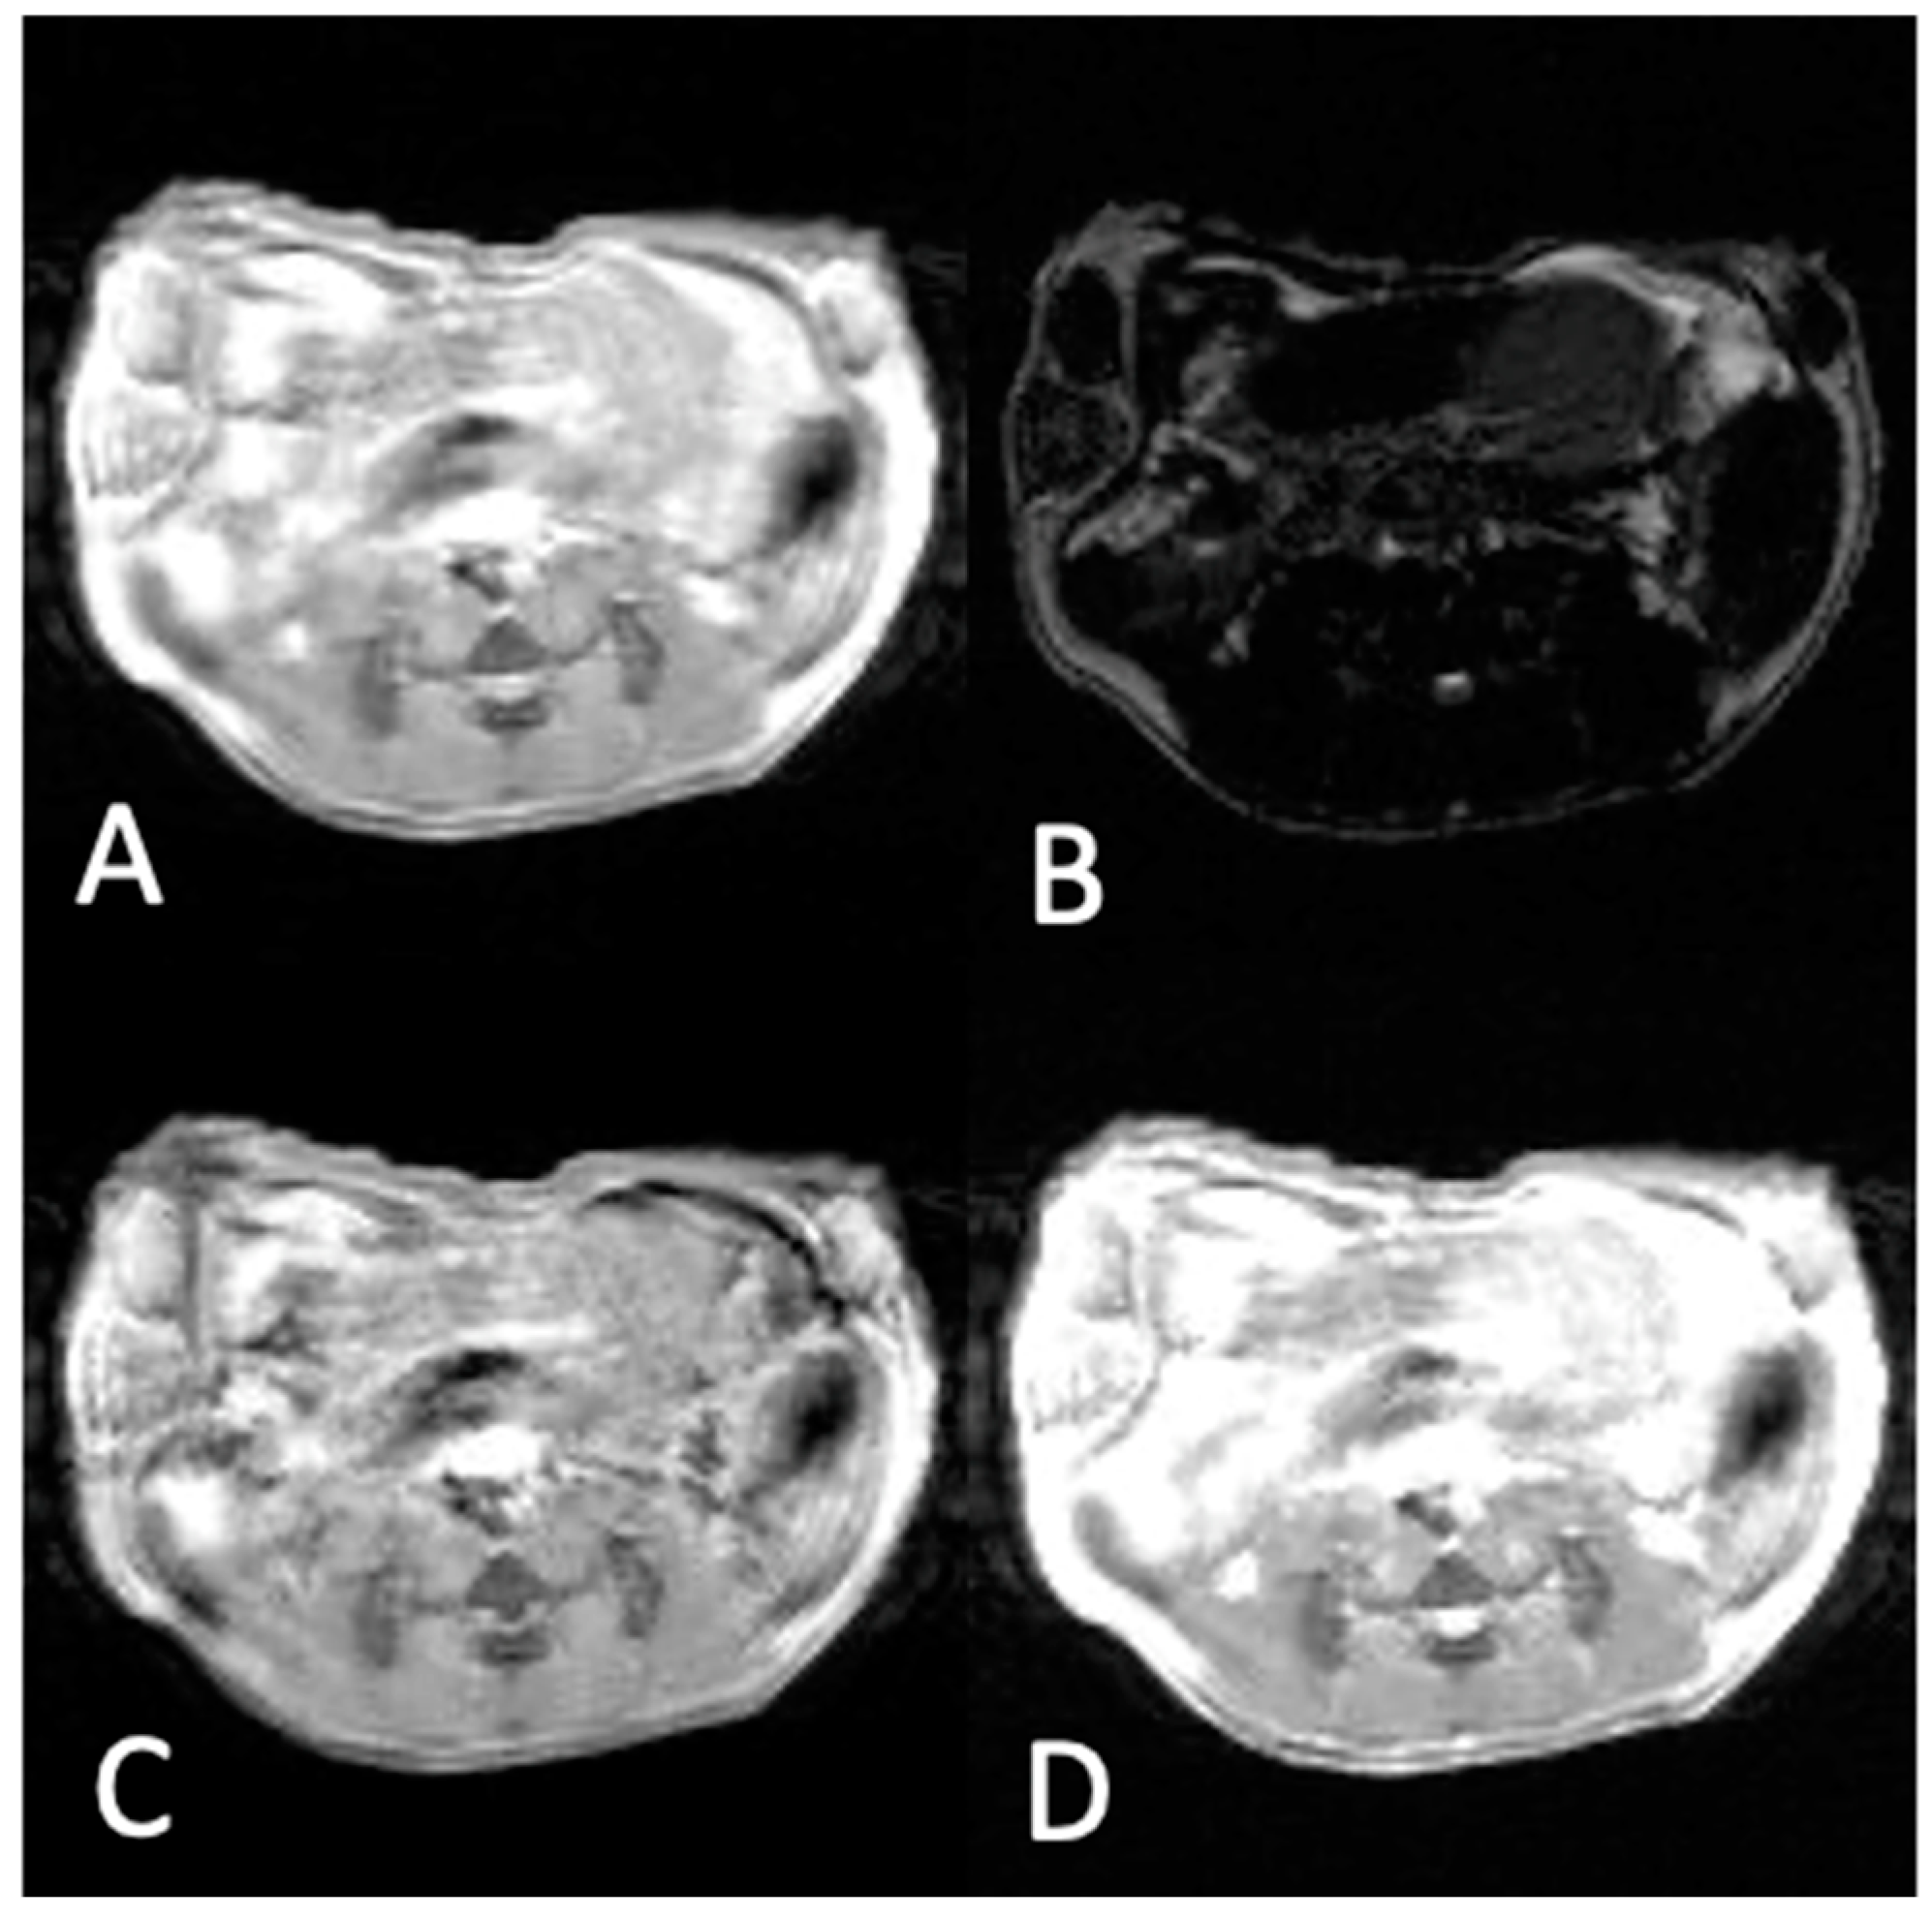
3.2. In Vivo Experiments

Figure 7 and Figure 8 show the MR images of a mouse bearing TNB tumor pre-injection (Figure 7) and post-injection (Figure 8) of the NaDyF4/NaGdF4 non-targeted contrast agent. Images marked with a, b, c, and d correspond to T1w, T2w, subtracted T1w − T2w, and added T1w + T2w, respectively. The signal and TC values in each case are shown in Table 2.
The results of in vivo experiments pre-injection (Figure 7) of the contrast agent show the highest TC value for subtracted T1w − T2w images (TC = 1.52) when compared to T1w, T2w and T1w + T2w images with TC equal to 1.15, 0.33, and 1.00, respectively. Injection of the non-targeted NaDyF4/NaGdF4 contrast agent into a mouse bearing TNB cancer increased the tumor contrast in the T1w image (Figure 8A), and decreased in the T2w image (Figure 8B), as expected. Image of the added T1w + T2w (Figure 8D) showed lower tumor contrast (1.09) compared to the T1w image (1.24) and higher contrast compared to that in the T2w image (0.32). The subtracted T1w − T2w image (Figure 8C) showed that the TC was the highest (1.56).

4. Discussion

Increasing tumor contrast is an ever-evolving pursuit for diagnostic imaging, specifically in MRI. Increasing the tumor contrast can lead to earlier tumor detection. While MRI techniques such as T1w and T2w imaging enable visualization of tumor regions, they are not sufficient for the detection of small tumors, and tumors with similar signals as surrounding tissues. To overcome this limitation T1, T2, and T1/T2 contrast agents have been applied. Of particular interest are T1/T2 contrast agents, as their surface can be used for conjugation with various delivery vehicles, such as antibody [28,29,30]. However, T1/T2 contrast agents provide lower TC in T1w images compared to T1-only contrast agents as their T1 shortening effect is usually smaller than that of the “pure“ T1 contrast. Similarly, shortening T2 is smaller for T1/T2 contrast agents than for “perfect” T2 contrasts, which reduce T2 only. These effects diminish the potential capabilities of the T1/T2 contrast agents.
The result for the phantom model showed that the application of the T1/T2 contrast agent alone improved tumor contrast by 50% (from 1.0 to 1.5) on T1-weighted images and reduced contrast by 50% (from 1.0 to 0.5) on T2w images. The image subtraction additionally improved contrast over two-fold (from 1.50 to 3.83) when compared to T1-weigthed. For the in vivo experiments, the corresponding values were: increase by 8% (from 1.15 to 1.24) in T1-weighted images, decrease by 1% (from 0.33 to 0.32) in T2-weighted images, and additional improvement due to image subtraction by 12% (from 1.24 to 1.56). Overall, the results showed that the image contrast enhancement caused by the T1/T2 contrast agents can be additionally improved by the application of image subtraction. Furthermore, TC is the highest for the T1/T2 contrast agent. Subsequently, potential drawbacks associated with lower contrast provided by the T1/T2 contrast agents can be rectified.
The differences between the phantom tumor model and in vivo TC results are due to the fact that our phantom tumor model assumes the application of the “perfect” targeted contrast agents, and our in vivo experiments use a non-targeted contrast agent. Application of the non-targeted contrast agent causes similar changes in signal in both tumor and normal adjacent tissue, while the phantom model shows signal changes in tumor only.
In the presented studies only one type of NPs was used to show the general concept of image analysis. The NaDyF4/NaGdF4 NPs used in the in vivo study had core/shell size of 21.2 nm/0.6 nm. However, we expect the observed increase in TC would be achieved independently of the size of the NP. NPs with higher r1 and r2 would provide even more evident increase in TC. The increase in r1 and r2 can be achieved by increasing both the shell and core sizes. In the case of the NaDyF4/NaGdF4, increase in the Gd shell size would increase r1, hence providing desired improvement in TC. The independence of the TC enhancement due to the applied image post-processing is also supported by the theoretical analysis of the phantom model, where an arbitrary contrast was considered. However, further studies with other NPs are required to find their optimum parameters (e.g., core/shell ratio and size) to obtain maximum TC.

5. Conclusions

The results show that the T1/T2 contrast agents can indeed provide improved diagnostic capability over the T1 and T2 contrast agents alone. However, to fully benefit from its application, the contrast should provide as strong as possible T1 and T2 shortening (maximal r1 and r2), should be targeted, and then T1w and T2w images should be collected and subtracted. These improvements hold the potential to enhance the diagnostic capabilities of contrast enhanced MRI.

Author Contributions

Methodology, D.M., B.B., B.T. and F.C.J.M.v.V.; software, D.M.; validation, D.M.; formal analysis, D.M.; investigation, D.M., B.B. and B.T.; data curation, D.M.; writing—original draft preparation, D.M., B.B. and B.T.; writing—review and editing, D.M., B.B., B.T. and F.C.J.M.v.V.; visualization, D.M.; supervision, B.B. and B.T.; conducting experiment, B.B. All authors have read and agreed to the published version of the manuscript.

Funding

This work was funded by the National Science Center, Poland grants. OPUS 2018/31/B/ST5/03605 and Harmonia: 2018/30/M/NZ5/00844.

Institutional Review Board Statement

Animal experiment approved by the local Animal Care Committee.

Informed Consent Statement

Not applicable.

Data Availability Statement

Not applicable.

Acknowledgments

We thank Armita Dash for providing nanoparticles.

Conflicts of Interest

The authors declare no conflict of interest.

References

  1. Demer, J.L.; Dushyanth, A. T2-weighted fast spin-echo magnetic resonance imaging of extraocular muscles. J. Am. Assoc. Pediatr. Ophthalmol. Strabismus 2011, 15, 17–23. [Google Scholar] [CrossRef] [PubMed] [Green Version]
  2. Müller, C.J.; Löffler, R.; Deimling, M.; Peller, M.; Reiser, M. MR lung imaging at 0.2 T with T1-weighted true FISP: Native and oxygen-enhanced. J. Magn. Reson. Imaging 2001, 14, 164–168. [Google Scholar] [CrossRef] [PubMed]
  3. Busquets, M.A.; Sabaté, R.; Estelrich, J. Potential applications of magnetic particles to detect and treat Alzheimer’s disease. Nanoscale Res. Lett. 2014, 9, 538. [Google Scholar] [CrossRef] [Green Version]
  4. Caravan, P.; Ellison, J.J.; McMurry, T.J.; Lauffer, R.B. Gadolinium(III) Chelates as MRI Contrast Agents: Structure, Dynamics, and Applications. Chem. Rev. 1999, 99, 2293–2352. [Google Scholar] [CrossRef]
  5. Zhou, Z.; Huang, D.; Bao, J.; Chen, Q.; Liu, G.; Chen, Z.; Chen, X.; Gao, J. A Synergistically Enhanced T1T2 Dual-Modal Contrast Agent. Adv. Mater. 2012, 24, 6223–6228. [Google Scholar] [CrossRef] [Green Version]
  6. Nazir, S.; Hussain, T.; Ayub, A.; Rashid, U.; MacRobert, A.J. Nanomaterials in combating cancer: Therapeutic applications and developments. Nanomed. Nanotechnol. Biol. Med. 2014, 10, 19–34. [Google Scholar] [CrossRef] [PubMed]
  7. Huang, H.-C.; Barua, S.; Sharma, G.; Dey, S.K.; Rege, K. Inorganic nanoparticles for cancer imaging and therapy. J. Control. Release 2011, 155, 344–357. [Google Scholar] [CrossRef]
  8. Ravichandran, M.; Oza, G.; Velumani, S.; Ramirez, J.T.; Vera, A.; Leija, L. Design and evaluation of surface functionalized superparamagneto-plasmonic nanoparticles for cancer therapeutics. Int. J. Pharm. 2017, 524, 16–29. [Google Scholar] [CrossRef]
  9. Kievit, F.M.; Zhang, M. Surface Engineering of Iron Oxide Nanoparticles for Targeted Cancer Therapy. Acc. Chem. Res. 2011, 44, 853–862. [Google Scholar] [CrossRef] [Green Version]
  10. Blasiak, B.; Van Veggel, F.C.J.M.; Tomanek, B. Applications of Nanoparticles for MRI Cancer Diagnosis and Therapy. J. Nanomater. 2013, 148578. [Google Scholar] [CrossRef] [Green Version]
  11. Anzai, Y. Superparamagnetic Iron Oxide Nanoparticles Nodal Metastases and Beyond. Top. Mag. Reson. 2004, 15, 103–111. [Google Scholar] [CrossRef] [PubMed]
  12. Carr, D.H.; Graif, M.; Niendorf, H.P.; Brown, J.; Steiner, R.E.; Blumgart, L.H.; Young, I.R. Gadolinium-DTPA in the assessment of liver tumours by magnetic resonance imaging. Clin. Radiol. 1986, 37, 347–353. [Google Scholar] [CrossRef] [PubMed]
  13. Silva, C.J.; Rocha, A.J.; Mendes, M.F.; Maia, A.C.; Braga, F.T.; Tilbery, C.P. Trigeminal involvement in multiple sclerosis: Magnetic resonance imaging findings with clinical correlation in a series of patients. Mult Scler. 2005, 11, 282–285. [Google Scholar] [CrossRef] [PubMed]
  14. Dash, A.; Blasiak, B.; Tomanek, B.; Latta, P.; van Veggel, F.C.J.M. Target-Specific Magnetic Resonance Imaging of Human Prostate Adenocarcinoma Using NaDyF4–NaGdF4 Core–Shell Nanoparticles. ACS Appl. Mater. Interfaces 2021, 13, 24345–24355. [Google Scholar] [CrossRef]
  15. Harel, N.; Lin, J.; Moeller, S.; Ugurbil, K.; Yacoub, E. Combined imaging–histological study of cortical laminar specificity of fMRI signals. Neuroimage 2006, 29, 879–887. [Google Scholar] [CrossRef]
  16. Carvalho, A.; Domingues, I.; Gonçalves, M.C. Core–shell superparamagnetic nanoparticles with interesting properties as contrast agents for MRI. Mater. Chem. Phys. 2015, 168, 42–49. [Google Scholar] [CrossRef]
  17. Sounderya, N.; Zhang, Y. Use of Core/Shell Structured Nanoparticles for Biomedical Applications. Recent Pat. Biomed. Eng. 2008, 1, 34–42. [Google Scholar] [CrossRef]
  18. Yang, H.; Zhuang, Y.; Sun, Y.; Dai, A.; Shi, X.; Wu, D.; Li, F.; Hu, H.; Yang, S. Targeted dual-contrast T1- and T2-weighted magnetic resonance imaging of tumors using multifunctional gadolinium-labeled superparamagnetic iron oxide nanoparticles. Biomaterials 2011, 32, 4584–4593. [Google Scholar] [CrossRef]
  19. Norek, M.; Peters, J.A. MRI contrast agents based on dysprosium or holmium. Prog. Nucl. Magn. Reson. Spectrosc. 2011, 59, 64–82. [Google Scholar] [CrossRef]
  20. Li, F.; Zhi, D.; Luo, Y.; Zhang, J.; Nan, X.; Zhang, Y.; Zhou, W.; Qiu, B.; Wen, L.-P.; Liang, G. Core/shell Fe3O4/Gd2O3 nanocubes as T1–T2 dual modal MRI contrast agents. Nanoscale 2016, 8, 12826–12833. [Google Scholar] [CrossRef]
  21. Cheng, K.; Yang, M.; Zhang, R.; Qin, C.; Su, X.; Cheng, Z. Hybrid Nanotrimers for Dual T1 and T2-Weighted Magnetic Resonance Imaging. ACS Nano 2014, 8, 9884–9896. [Google Scholar] [CrossRef] [PubMed] [Green Version]
  22. Girard, O.M.; Du, J.; Agemy, L.; Sugahara, K.N.; Kotamraju, V.R.; Ruoslahti, E.; Bydder, G.M.; Mattrey, R.F. Optimization of iron oxide nanoparticle detection using ultrashort echo time pulse sequences: Comparison of T1, T2*, and synergistic T1T2* contrast mechanisms. Magn. Reson. Med. 2011, 65, 1649–1660. [Google Scholar] [CrossRef] [Green Version]
  23. Wang, Z.; Xue, X.; Lu, H.; He, Y.; Lu, Z.; Chen, Z.; Yuan, Y.; Tang, N.; Dreyer, C.A.; Quigley, L.; et al. Two-way magnetic resonance tuning and enhanced subtraction imaging for non-invasive and quantitative biological imaging. Nat. Nanotechnol. 2020, 15, 482–490. [Google Scholar] [CrossRef]
  24. Hendrick, R.E. High-Quality Breast MRI. Radiol. Clin. N. Am. 2014, 52, 547–562. [Google Scholar] [CrossRef] [PubMed]
  25. Strijkers, G.J.; Mulder, W.J.M.; van Tilborg, G.A.F.; Nicolay, K. MRI Contrast Agents: Current Status and Future Perspectives. Anti-Cancer Agents Med. Chem. 2007, 7, 291–305. [Google Scholar] [CrossRef] [PubMed]
  26. Xiao, Y.-D.; Paudel, R.; Liu, J.; Ma, C.; Zhang, Z.-S.; Zhou, S.-K. MRI contrast agents: Classification and application (Review). Int. J. Mol. Med. 2016, 38, 1319–1326. [Google Scholar] [CrossRef] [Green Version]
  27. Johnson, N.J.J.; Korinek, A.; Dong, C.; van Veggel, F.C.J.M. Self-Focusing by Ostwald Ripening: A Strategy for Layer-by-Layer Epitaxial Growth on Upconverting Nanocrystals. J. Am. Chem. Soc. 2012, 134, 11068–11071. [Google Scholar] [CrossRef]
  28. Tomanek, B.; Iqbal, U.; Blasiak, B.; Abulrob, A.; Albaghdadi, H.; Matyas, J.R.; Ponjevic, D.; Sutherland, G.R. Evaluation of brain tumor vessels specific contrast agents for glioblastoma imaging. Neuro-Oncology 2012, 14, 53–63. [Google Scholar] [CrossRef] [PubMed] [Green Version]
  29. Li, Y.; Dong, H.; Tao, Q.; Ye, C.; Yu, M.; Li, J.; Zhou, H.; Yang, S.; Ding, G.; Xie, X. Enhancing the magnetic relaxivity of MRI contrast agents via the localized superacid microenvironment of graphene quantum dots. Biomaterials 2020, 250, 120056. [Google Scholar] [CrossRef]
  30. Shang, L.; Li, Y.; Xiao, Y.; Xu, Y.; Chen, L.; Wang, H.; Tao, Q.; Ma, P.; Yang, S.; Ding, G.; et al. Synergistic Effect of Oxygen- and Nitrogen-Containing Groups in Graphene Quantum Dots: Red Emitted Dual-Mode Magnetic Resonance Imaging Contrast Agents with High Relaxivity. ACS Appl. Mater. Interfaces 2022, 14, 39885–39895. [Google Scholar] [CrossRef]
Figure 1. An image of a phantom tumor model comprising tumor (tu) surrounded by a normal adjacent tissue (ti) used for contrast analysis.
Materials 16 03096 g001
Figure 2. Selection of the ROIs in the mouse abdomen MRI: green line delineates the adjacent tissue, and the red line delineates the tumor.
Materials 16 03096 g002
Figure 3. MR images of the tumor phantom model before contrast injection: (A) T1w. (B) T2w. (C) Subtracted T1w − T2w. (D) Added T1w + T2w. TC = 1.00 in all images.
Materials 16 03096 g003
Figure 4. MR images of the tumor phantom model after injection of the T1 contrast agent. (A) T1w. (B) T2w. (C) Subtracted T1w − T2w. (D) Added T1w + T2w. The highest TC value is 2.67 in image (C).
Materials 16 03096 g004
Figure 5. MR images of the tumor phantom model after injection of the T2 contrast agent. (A) T1w. (B) T2w. (C) subtracted T1w − T2w. (D) Added T1w + T2w. The highest TC value is 2.17 in image (C).
Materials 16 03096 g005
Figure 6. MR images of the tumor phantom model after injection of the T1/T2 contrast agent: (A) T1w. (B) T2w. (C) Subtracted T1w- T2w. (D) Added T1w+ T2w. The highest TC value is 3.83 in image (C).
Materials 16 03096 g006
Figure 7. MR images of a mouse bearing TNB tumor pre-injection of the NaDyF4/NaGdF4 contrast agent: (A) T1w. (B) T2w. (C) Image obtained by the subtraction of (B) from (A). (D) Image obtained by the addition of (A,B). The highest contrast is obtained in image (C) and is equal to TC = 1.52.
Materials 16 03096 g007
Figure 8. MR images of a mouse bearing TNB tumor 15 min post-injection of non-targeted NaDyF4/NaGdF4 contrast agent: (A) T1w. (B) T2w. (C) Image obtained by the subtraction of (B) from (A). (D) image obtained by the addition of (A,B). The highest tumor contrast is obtained in image (C) and is equal to TC = 1.56.
Materials 16 03096 g008
Table 1. The signal values from the phantom model of tumor (Stu), normal adjacent tissue (Sti), and the corresponding contrast, were obtained before and after the application of the “perfect” T1, T2, and T1/T2 contrast agents. Contrast values (TC) obtained by subtraction (T1w − T2w) and addition (T1w + T2w) of signals are also shown.
StuStiTC = Stu/Sti
Pre-injectionT1w1001001.00
T2w70701.00
T1w − T2w30301.00
T1w + T2w1701701.00
Post-T1 contrast injectionT1w1501001.50
T2w70701.00
T1w − T2w80302.67
T1w + T2w1201700.71
Post-T2 contrast injectionT1w1001001.00
T2w35700.47
T1w − T2w65302.17
T1w + T2w2222081.07
Post-T1/T2 contrast injectionT1w1501001.50
T2w35700.50
T1w − T2w115303.83
T1w + T2w1851701.09
Table 2. The values of Stu, Sti, and TC pre- and 15 min post-injection of non-targeted NaDyF4/NaGdF4 contrast agent obtained from the images in Figure 7 and Figure 8. The highest tumor contrast is observed for subtracted images both before and after injection.
StuStiTC = Stu/Sti
Pre-injectionT1w187.0162.01.15
T2w20.060.90.33
T1w − T2w167.0110.01.52
T1w + T2w204.0204.01.00
Post T1/T2 contrast injectionT1w230.0186.01.24
T2w18.657.60.32
T1w − T2w216.0138.01.56
T1w + T2w239.0219.01.09
Disclaimer/Publisher’s Note: The statements, opinions and data contained in all publications are solely those of the individual author(s) and contributor(s) and not of MDPI and/or the editor(s). MDPI and/or the editor(s) disclaim responsibility for any injury to people or property resulting from any ideas, methods, instructions or products referred to in the content.

