
Toward the Improvement of Silicon-Based Composite Electrodes via an In-Situ Si@C-Graphene Composite Synthesis for Li-Ion Battery Applications

 ,
,
Abstract
1. Introduction
2. Materials and Methods
2.1. Synthesis of Si@C Core/Shell Nanoparticles by Laser Pyrolysis
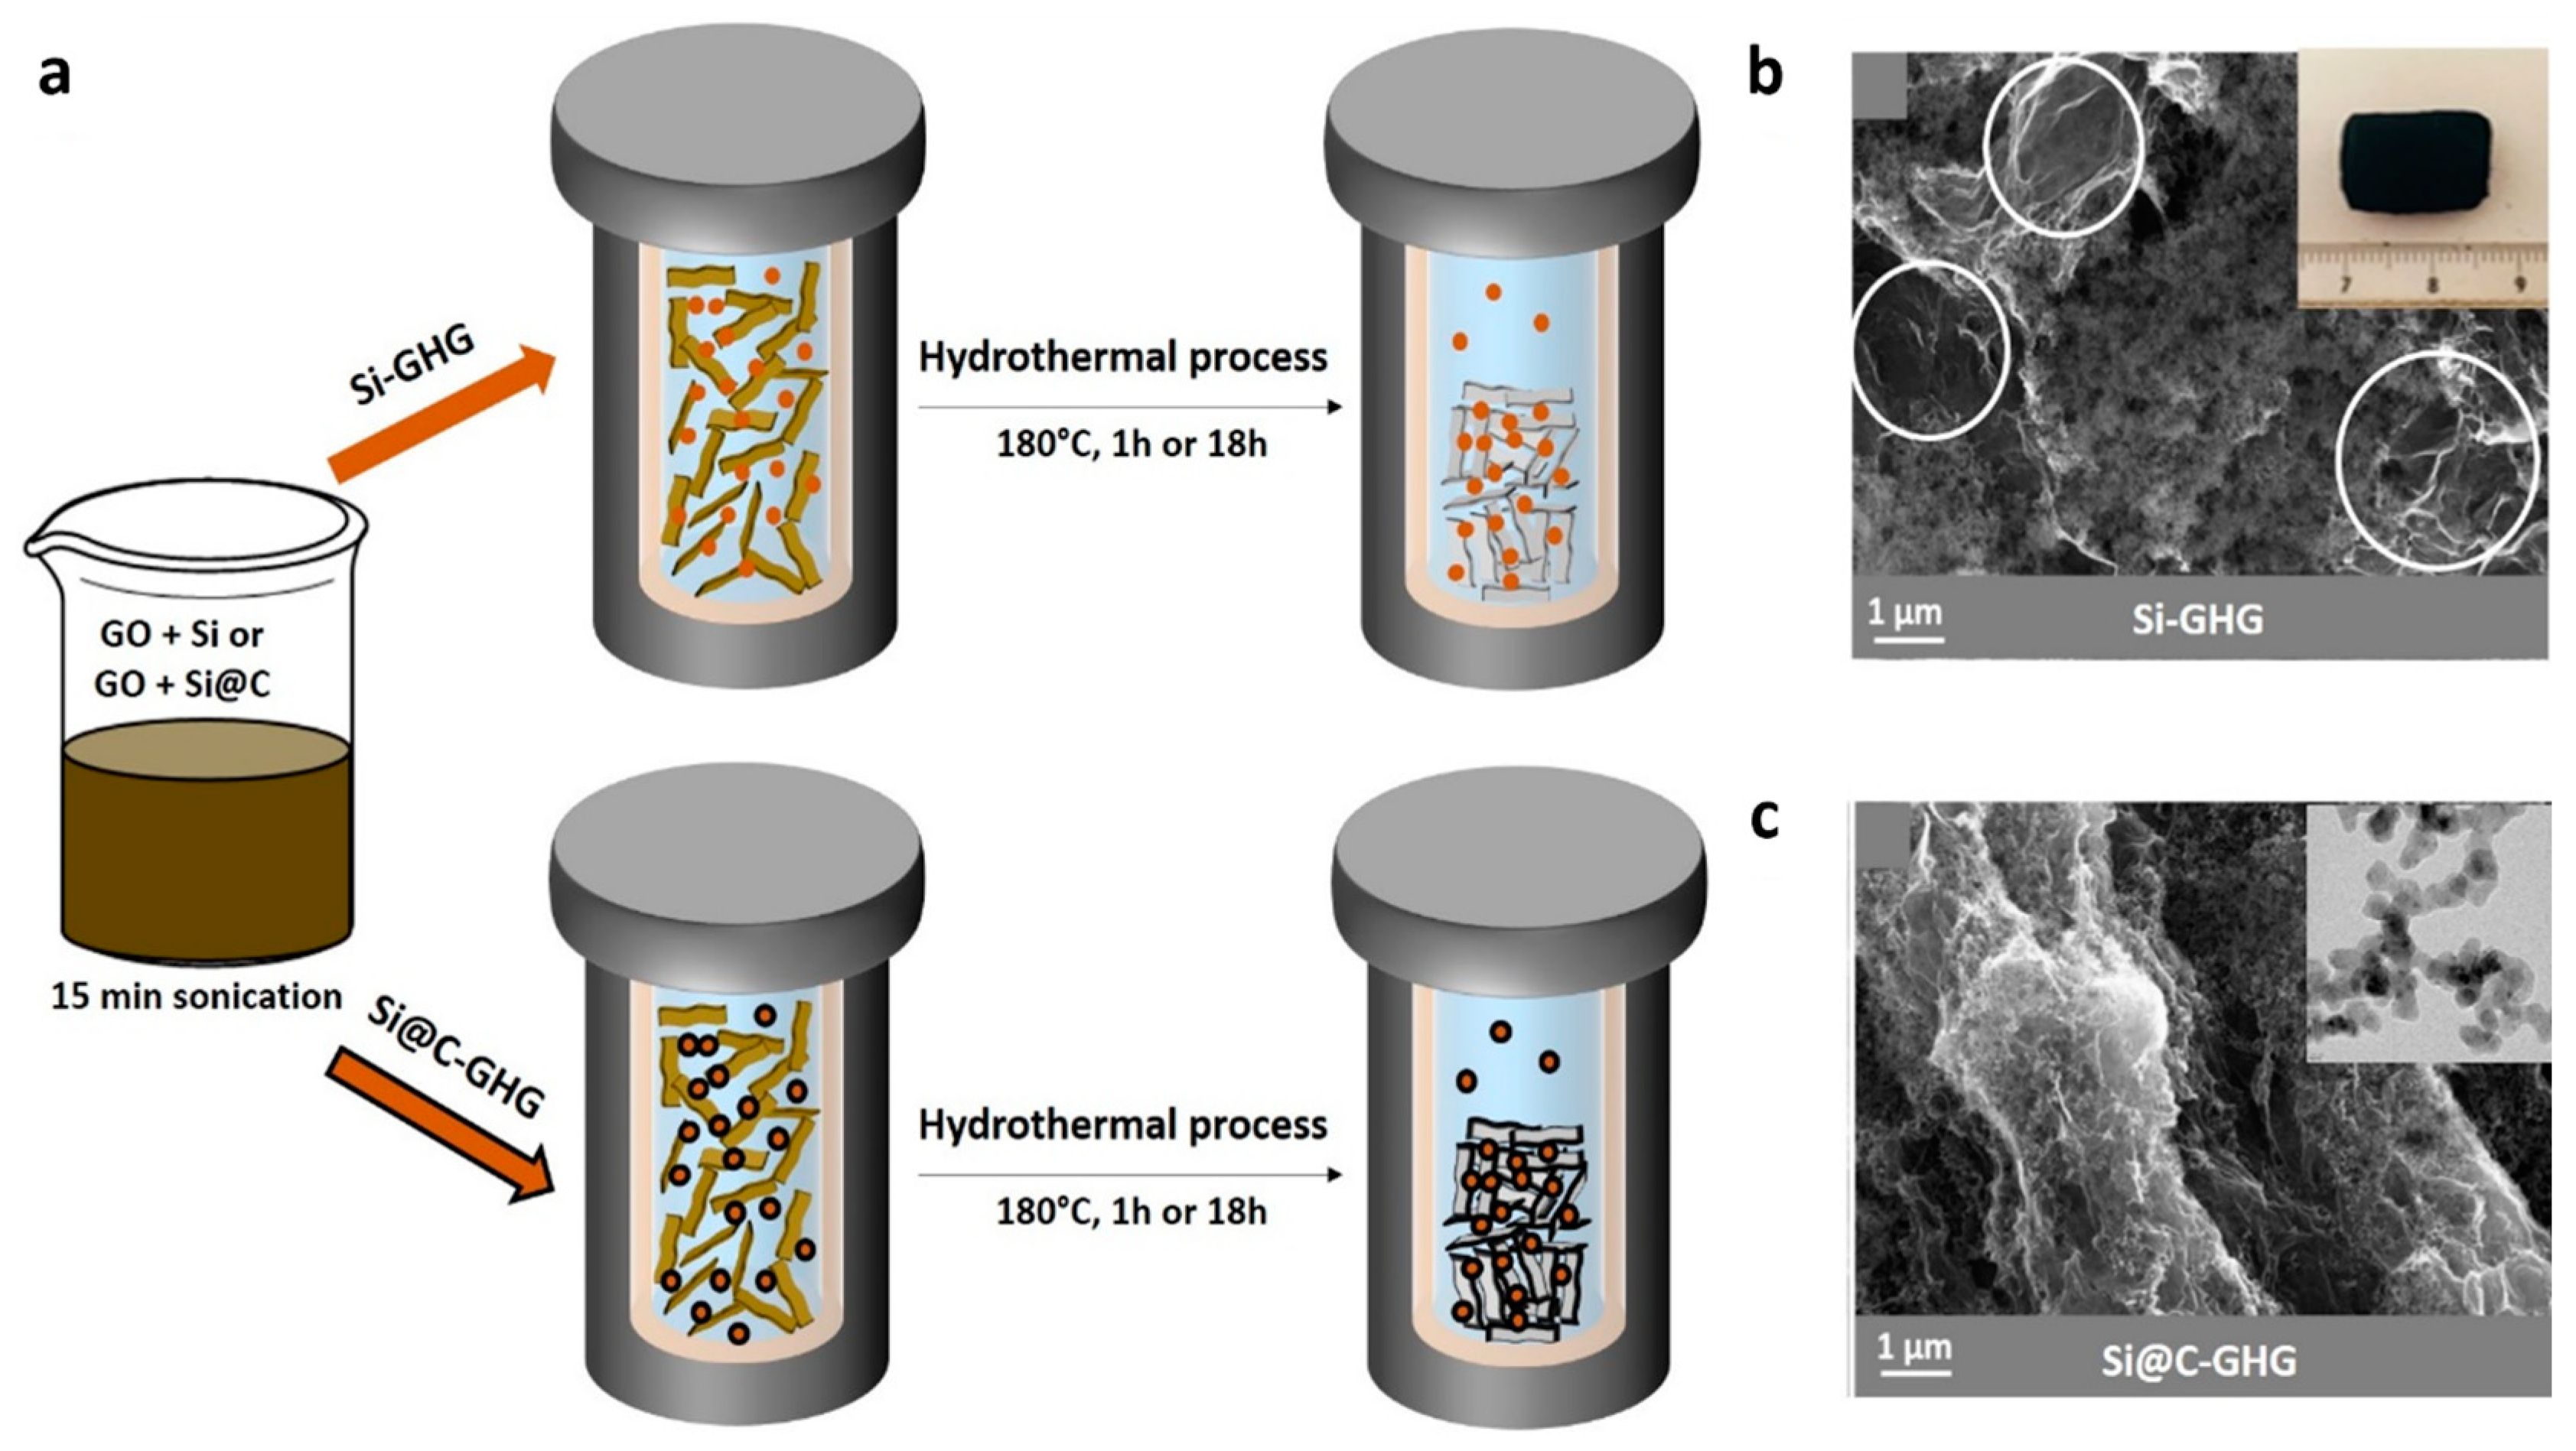
2.2. Synthesis of the Si-GHG and Si@C-GHG Composites under Hydrothermal Conditions
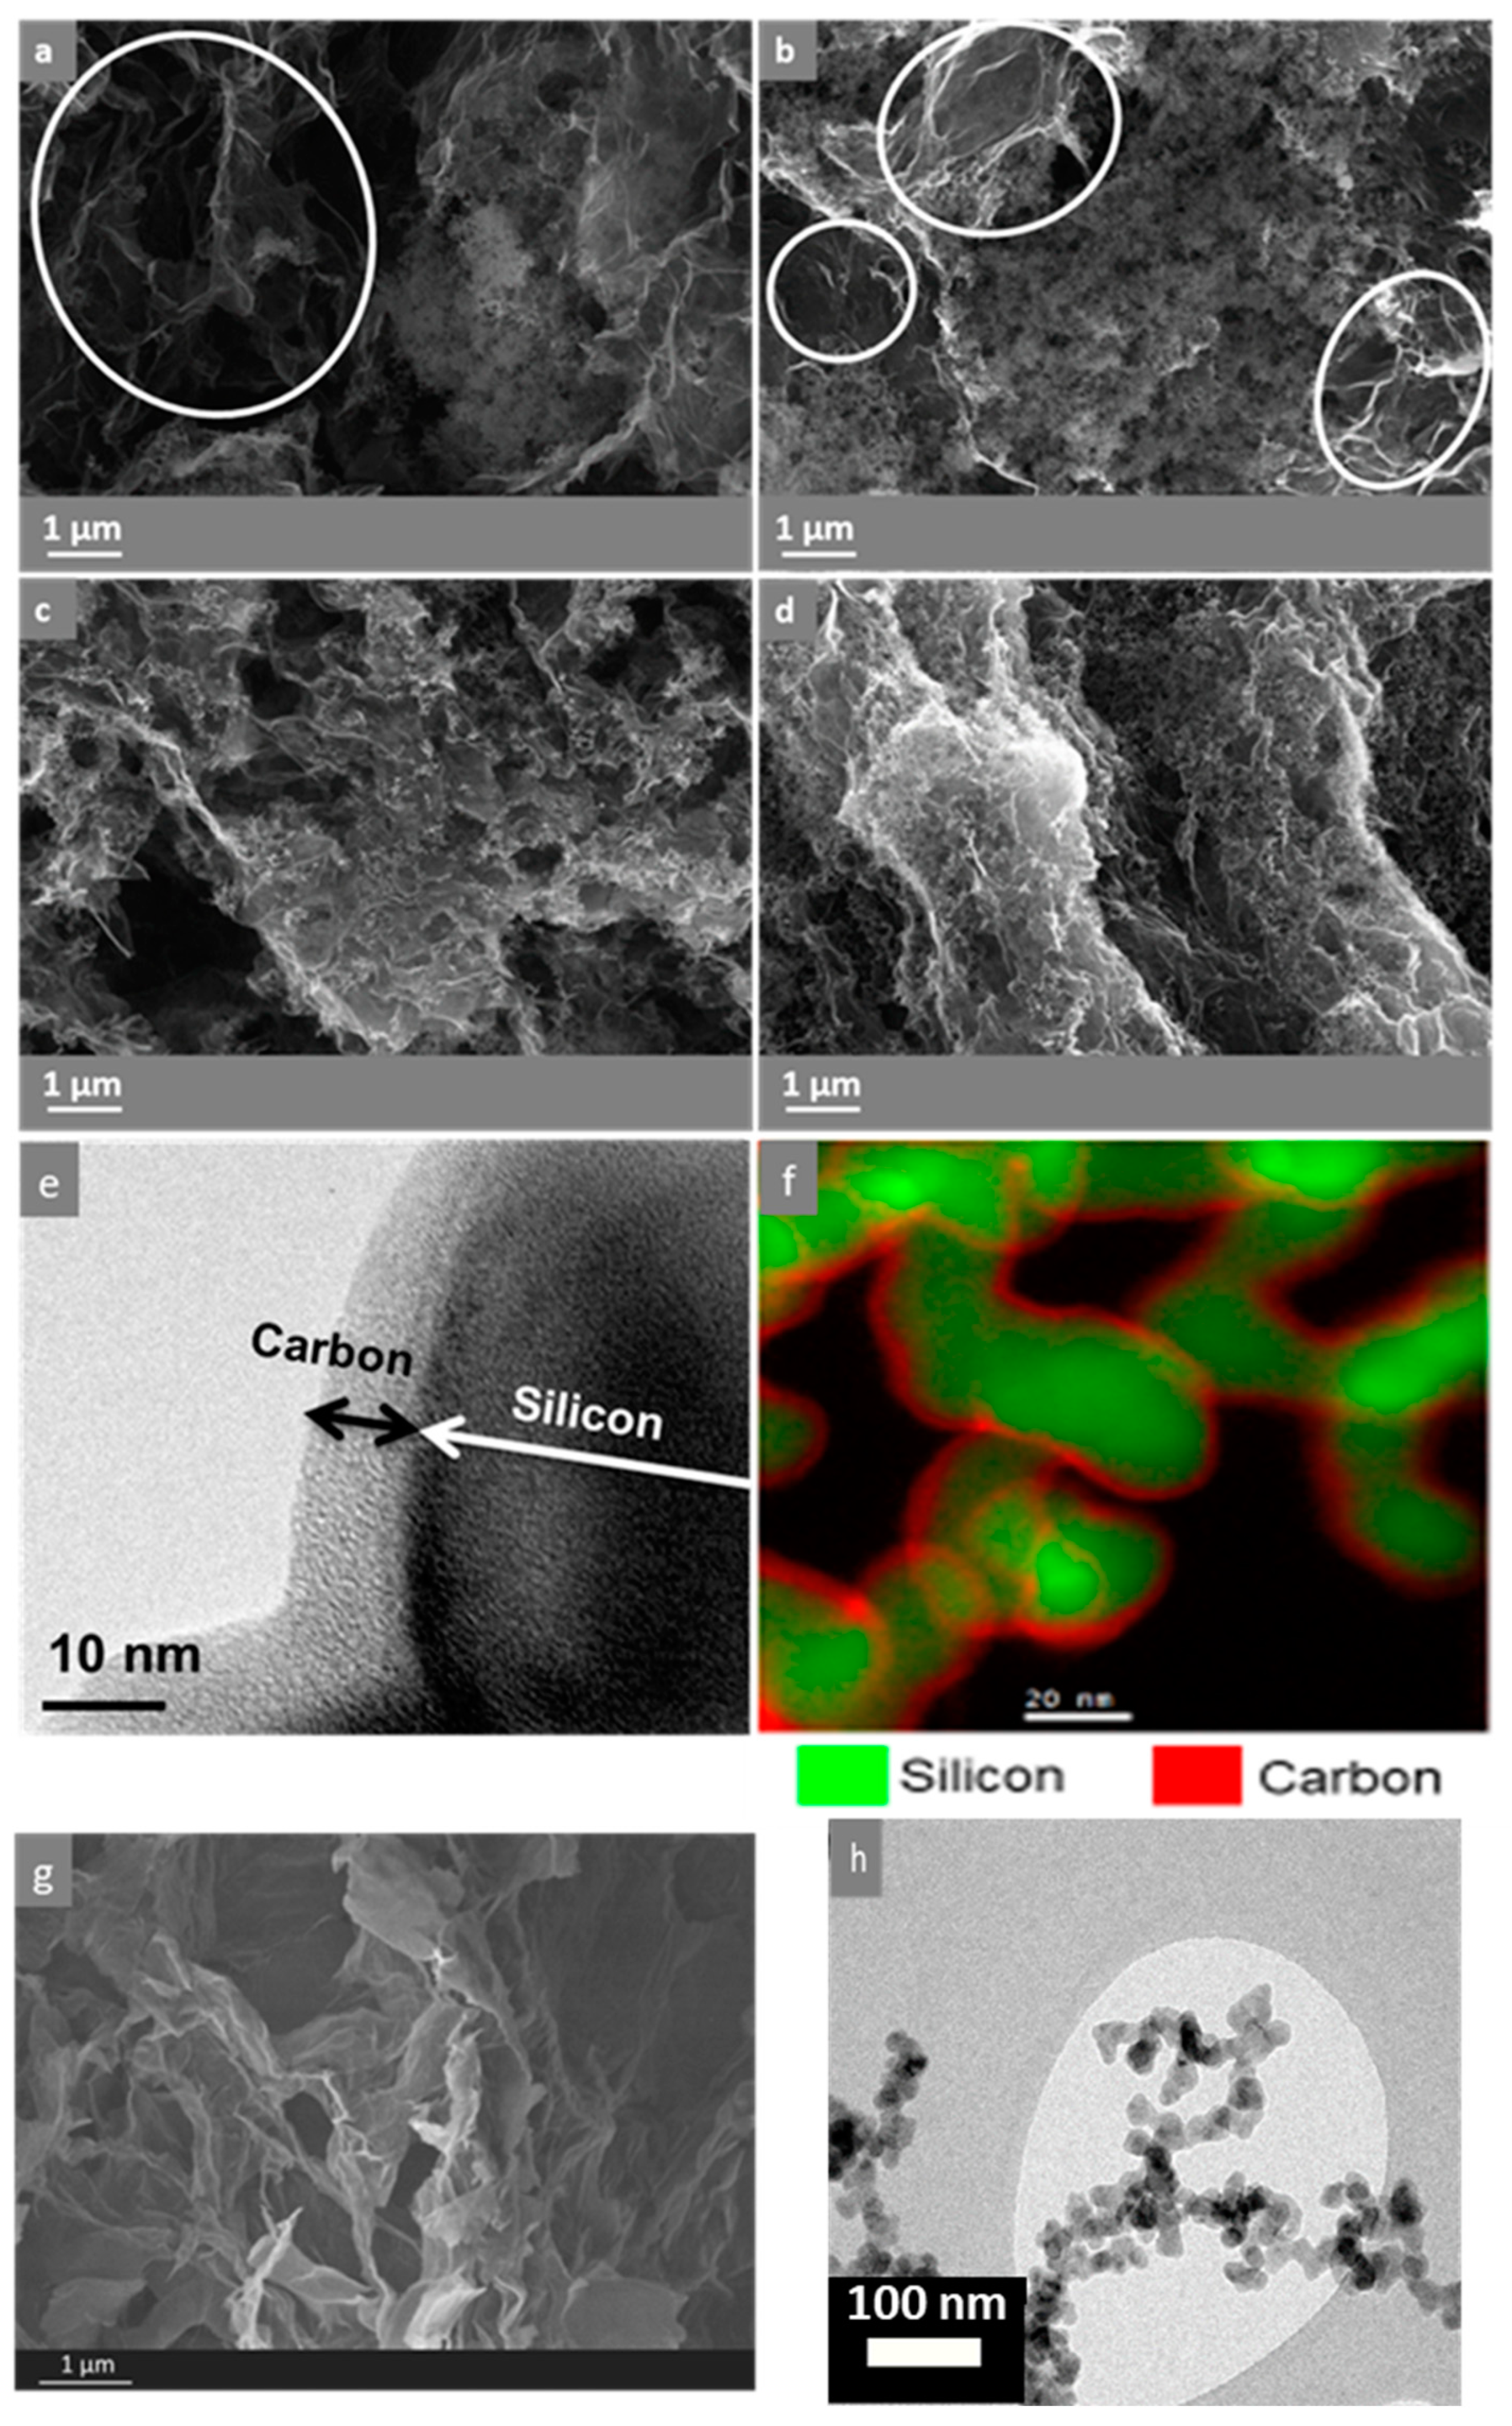
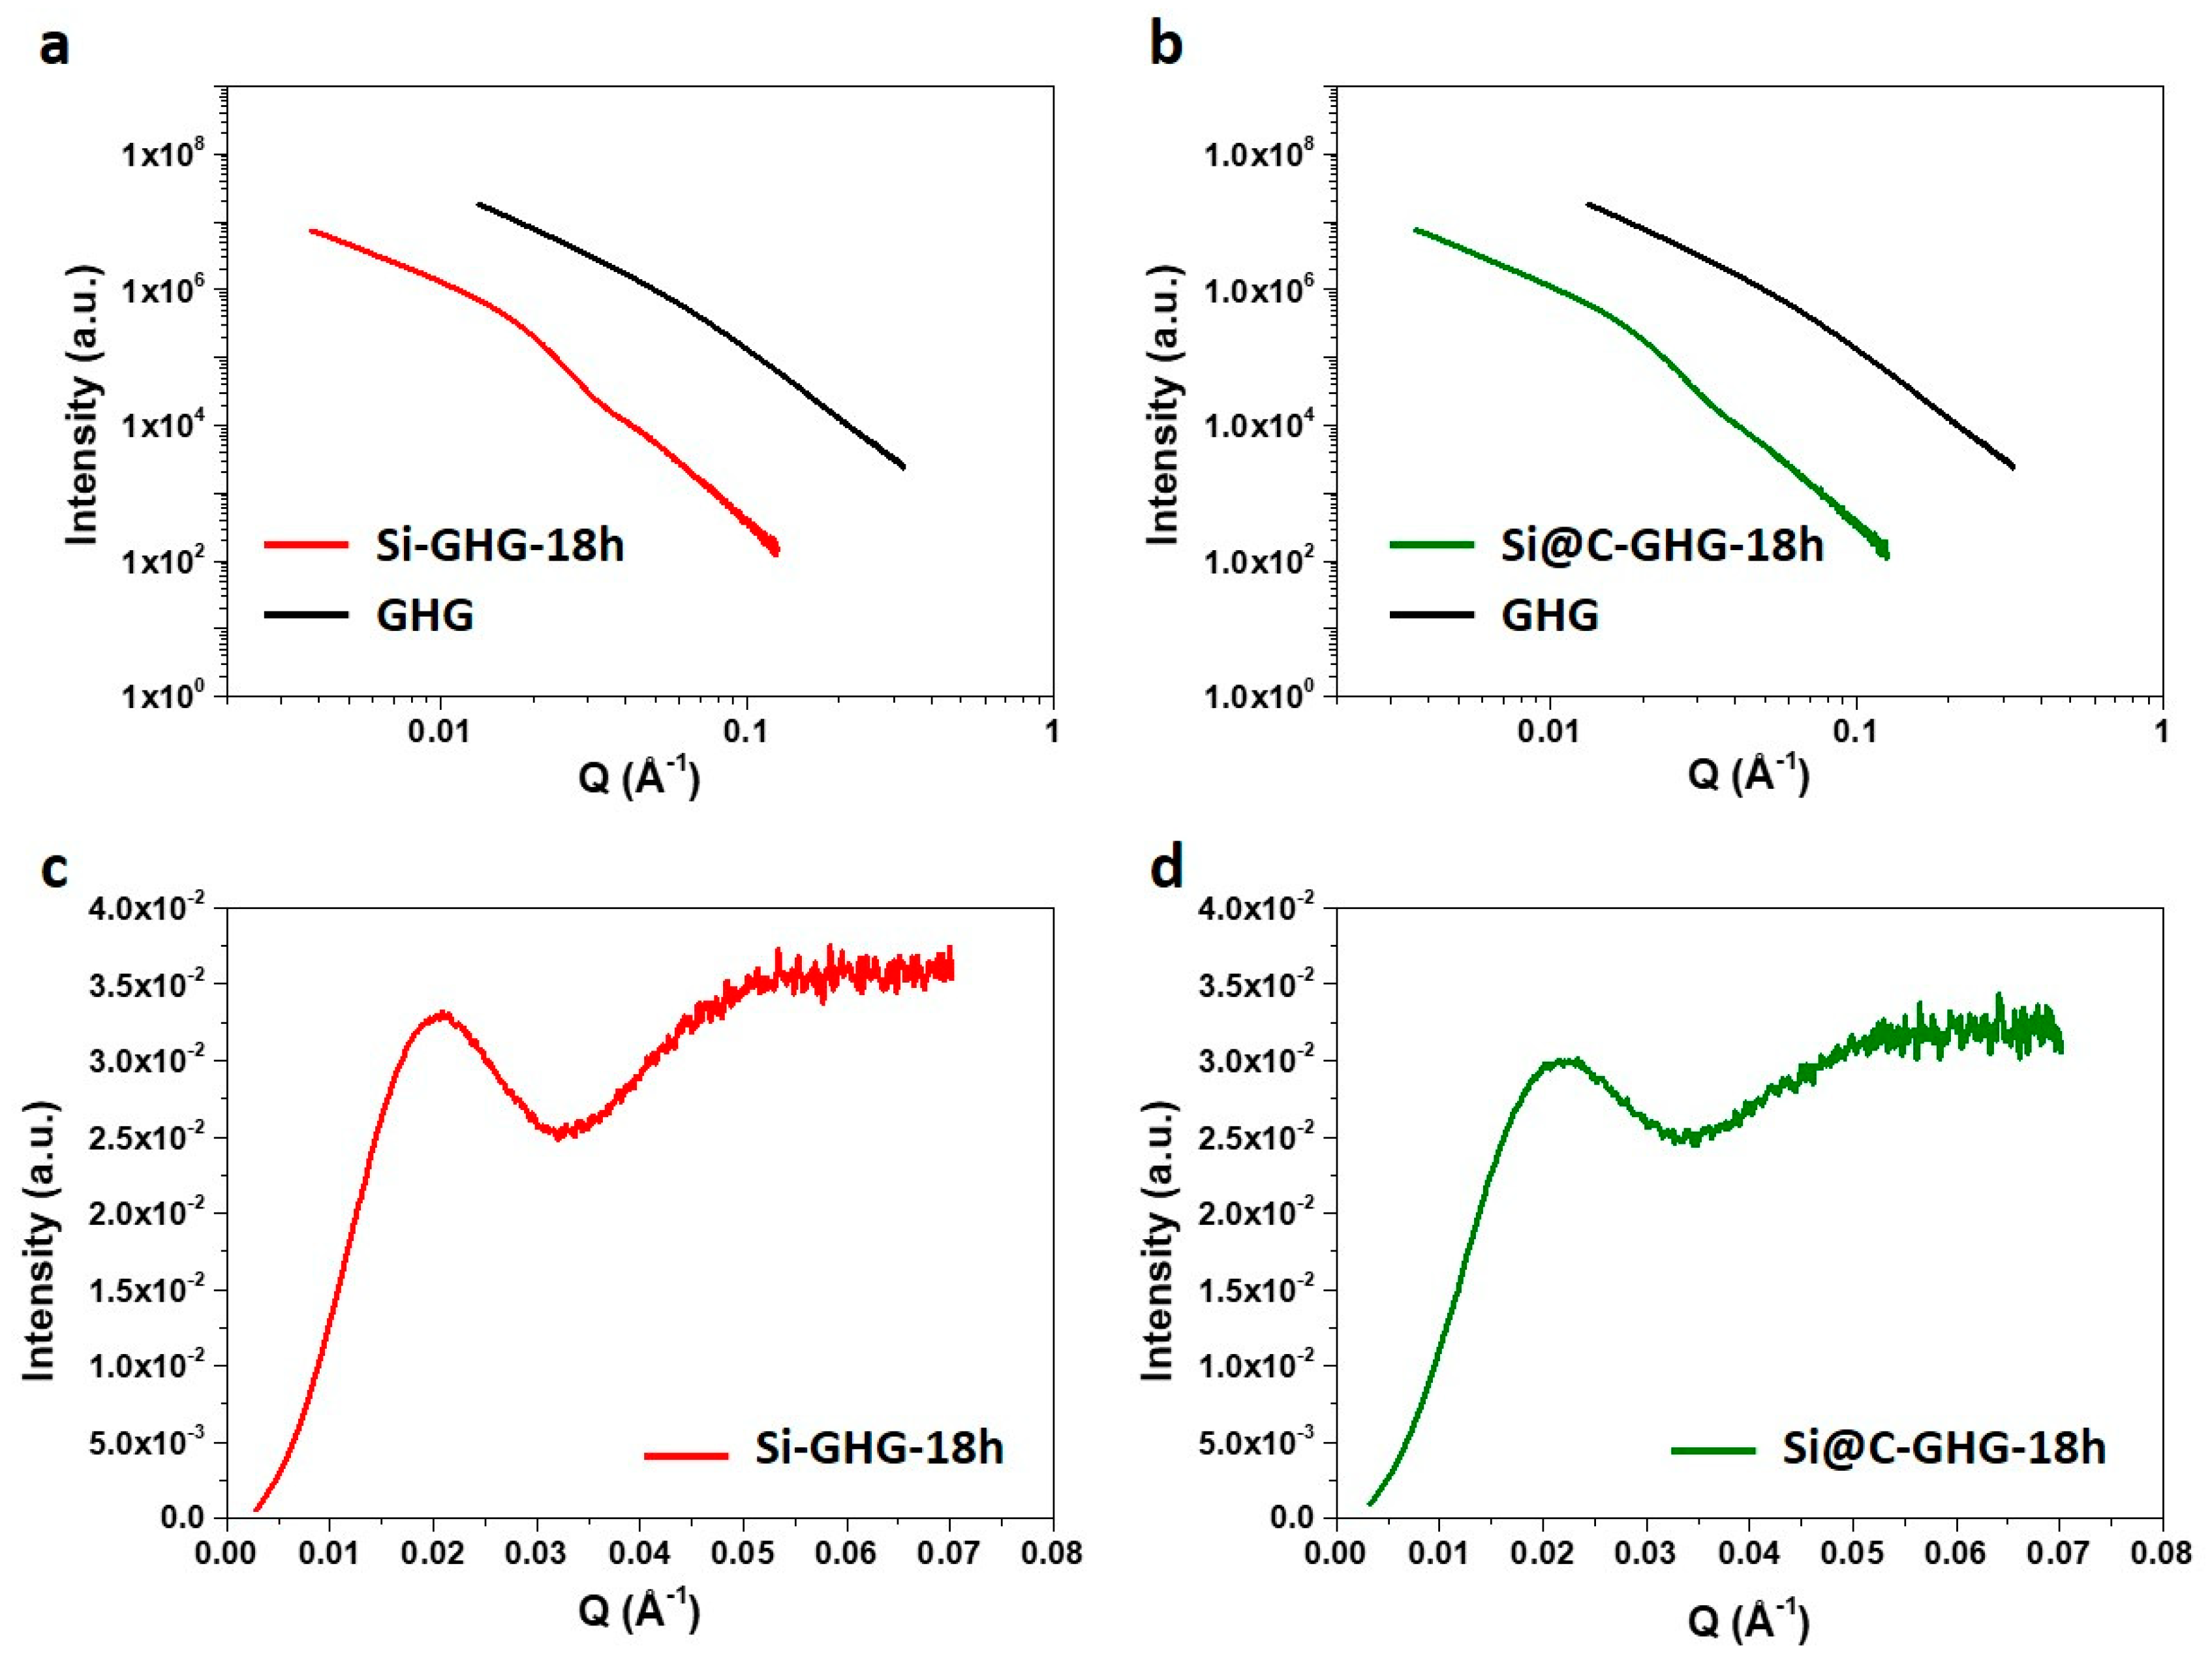
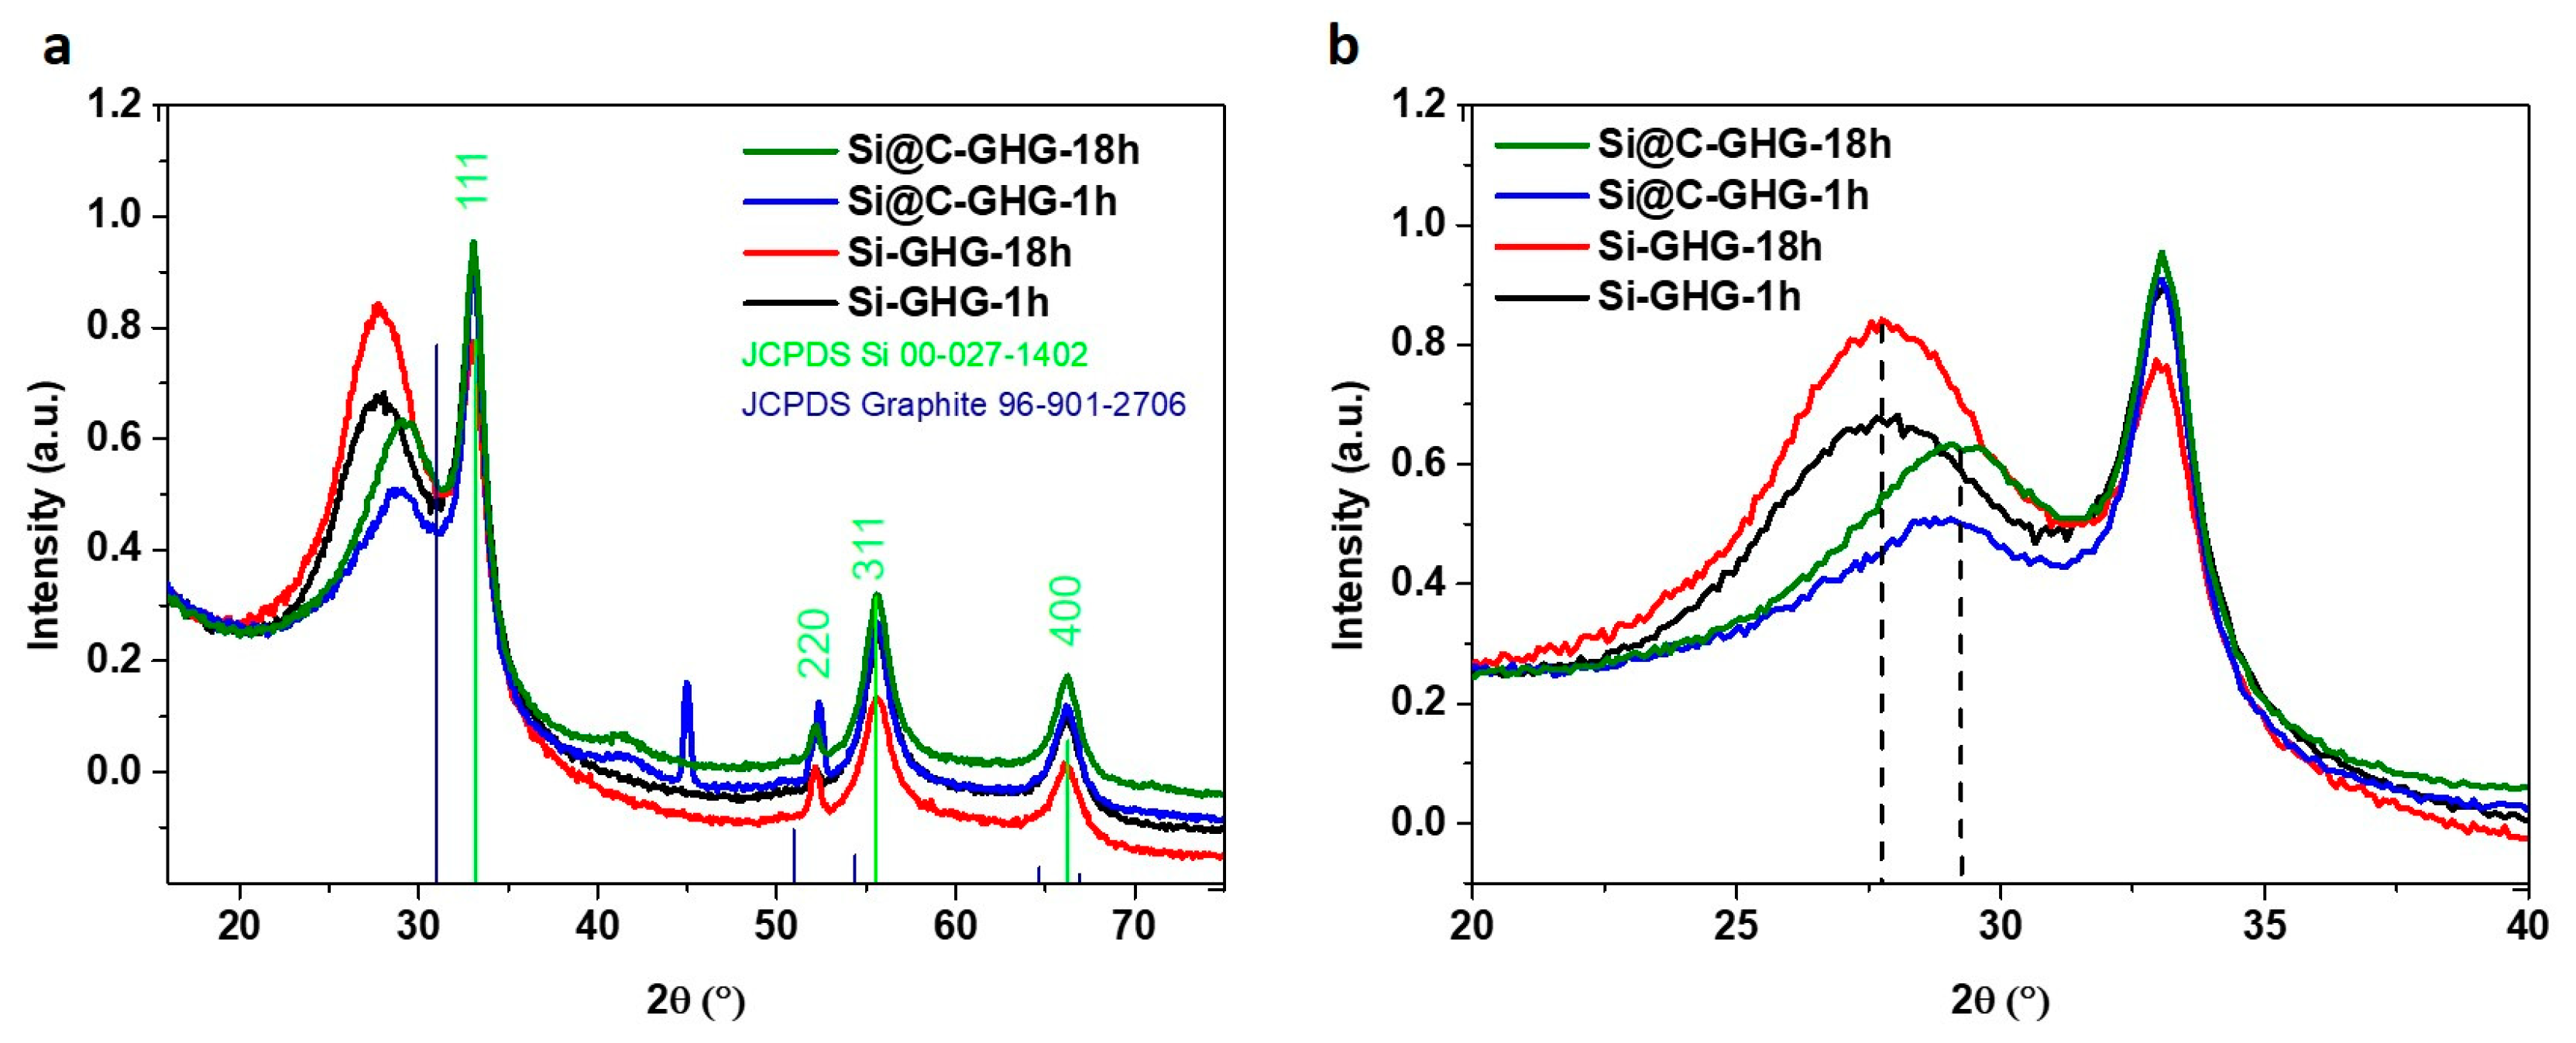
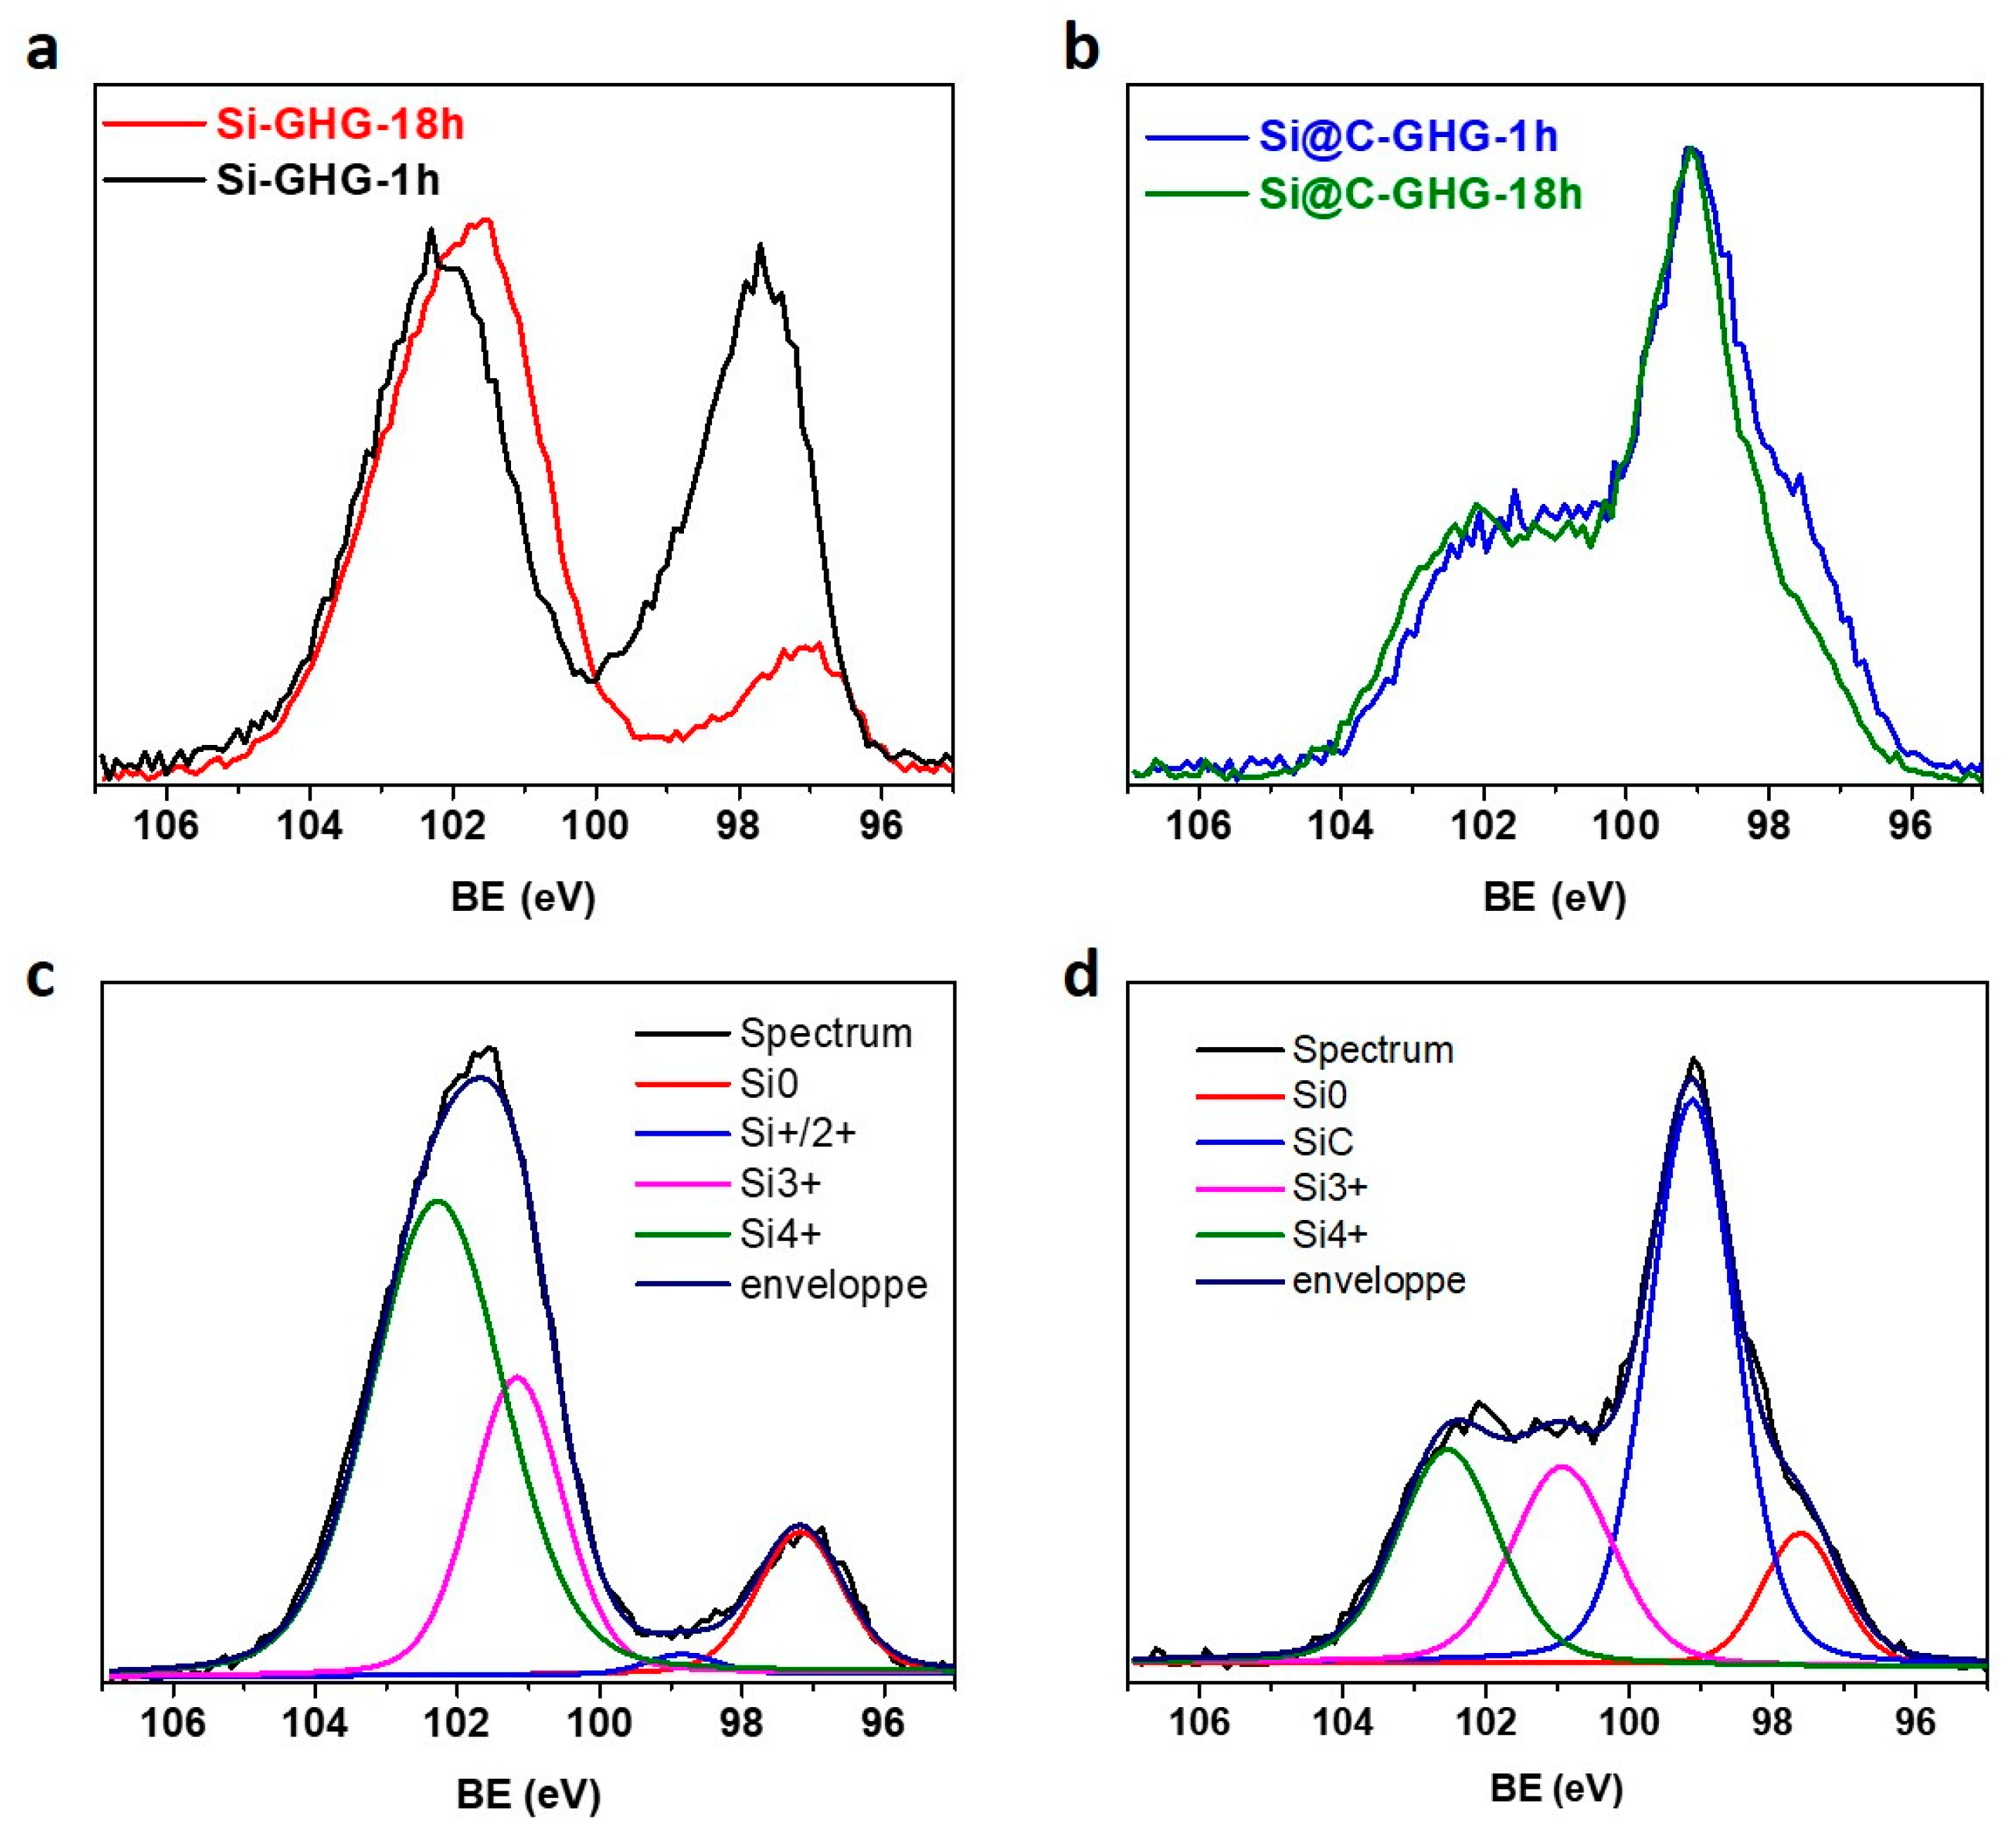
2.3. Structural and Chemical Analysis
2.4. Electrode Preparation and Electrochemical Characterizations
3. Results
4. Conclusions
Supplementary Materials
Author Contributions
Funding
Institutional Review Board Statement
Informed Consent Statement
Data Availability Statement
Acknowledgments
Conflicts of Interest
References
- Moshtev, R.; Johnson, B. State of the Art of Commercial Li Ion Batteries. J. Power Sources 2000, 91, 86–91. [Google Scholar] [CrossRef]
- Goriparti, S.; Miele, E.; De Angelis, F.; Di Fabrizio, E.; Proietti Zaccaria, R.; Capiglia, C. Review on Recent Progress of Nanostructured Anode Materials for Li-Ion Batteries. J. Power Sources 2014, 257, 421–443. [Google Scholar] [CrossRef]
- Deng, D. Li-Ion Batteries: Basics, Progress, and Challenges. Energy Sci. Eng. 2015, 3, 385–418. [Google Scholar] [CrossRef]
- Jaguemont, J.; Boulon, L.; Dubé, Y. A Comprehensive Review of Lithium-Ion Batteries Used in Hybrid and Electric Vehicles at Cold Temperatures. Appl. Energy 2016, 164, 99–114. [Google Scholar] [CrossRef]
- Gandoman, F.H.; Jaguemont, J.; Goutam, S.; Gopalakrishnan, R.; Firouz, Y.; Kalogiannis, T.; Omar, N.; Van Mierlo, J. Concept of Reliability and Safety Assessment of Lithium-Ion Batteries in Electric Vehicles: Basics, Progress, and Challenges. Appl. Energy 2019, 251, 113343. [Google Scholar] [CrossRef]
- Lu, J.; Chen, Z.; Ma, Z.; Pan, F.; Curtiss, L.A.; Amine, K. The Role of Nanotechnology in the Development of Battery Materials for Electric Vehicles. Nat. Nanotechnol. 2016, 11, 1031–1038. [Google Scholar] [CrossRef] [PubMed]
- Ding, Y.; Cano, Z.P.; Yu, A.; Lu, J.; Chen, Z. Automotive Li-Ion Batteries: Current Status and Future Perspectives. Electrochem. Energy Rev. 2019, 2, 1–28. [Google Scholar] [CrossRef]
- Kim, J.G.; Son, B.; Mukherjee, S.; Schuppert, N.; Bates, A.; Kwon, O.; Choi, M.J.; Chung, H.Y.; Park, S. A Review of Lithium and Non-Lithium Based Solid State Batteries. J. Power Sources 2015, 282, 299–322. [Google Scholar] [CrossRef]
- Meng, J.; Guo, H.; Niu, C.; Zhao, Y.; Xu, L.; Li, Q.; Mai, L. Advances in Structure and Property Optimizations of Battery Electrode Materials. Joule 2017, 1, 522–547. [Google Scholar] [CrossRef]
- Li, P.; Zhao, G.; Zheng, X.; Xu, X.; Yao, C.; Sun, W.; Dou, S.X. Recent Progress on Silicon-Based Anode Materials for Practical Lithium-Ion Battery Applications. Energy Storage Mater. 2018, 15, 422–446. [Google Scholar] [CrossRef]
- Zuo, X.; Zhu, J.; Müller-Buschbaum, P.; Cheng, Y.-J. Silicon Based Lithium-Ion Battery Anodes: A Chronicle Perspective Review. Nano Energy 2017, 31, 113–143. [Google Scholar] [CrossRef]
- Feng, K.; Li, M.; Liu, W.; Kashkooli, A.G.; Xiao, X.; Cai, M.; Chen, Z. Silicon-Based Anodes for Lithium-Ion Batteries: From Fundamentals to Practical Applications. Small 2018, 14, 1702737. [Google Scholar] [CrossRef]
- Liu, N.; Wu, H.; McDowell, M.T.; Yao, Y.; Wang, C.; Cui, Y. A Yolk-Shell Design for Stabilized and Scalable Li-Ion Battery Alloy Anodes. Nano Lett. 2012, 12, 3315–3321. [Google Scholar] [CrossRef] [PubMed]
- Wang, D.; Zhou, C.; Cao, B.; Xu, Y.; Zhang, D.; Li, A.; Zhou, J.; Ma, Z.; Chen, X.; Song, H. One-Step Synthesis of Spherical Si/C Composites with Onion-like Buffer Structure as High-Performance Anodes for Lithium-Ion Batteries. Energy Storage Mater. 2020, 24, 312–318. [Google Scholar] [CrossRef]
- Ashuri, M.; He, Q.; Shaw, L.L. Improving Cycle Stability of Si Anode through Partially Carbonized Polydopamine Coating. J. Electroanal. Chem. 2020, 876, 114738. [Google Scholar] [CrossRef]
- Uctepe, A.; Demir, E.; Tekin, B.; Dursun, B.; Ozturk, O.; Sel, O.; Demir-Cakan, R. Prompt Microwave-Assisted Synthesis of Carbon Coated Si Nanocomposites as Anode for Lithium-Ion Batteries. Solid State Ion. 2020, 354, 115409. [Google Scholar] [CrossRef]
- Zhang, X.; Hayashida, R.; Tanaka, M.; Watanabe, T. Synthesis of Carbon-Coated Silicon Nanoparticles by Induction Thermal Plasma for Lithium Ion Battery. Powder Technol. 2020, 371, 26–36. [Google Scholar] [CrossRef]
- Zhang, L.; Hao, W.; Wang, H.; Zhang, L.; Feng, X.; Zhang, Y.; Chen, W.; Pang, H.; Zheng, H. Porous Graphene Frame Supported Silicon@graphitic Carbon via in Situ Solid-State Synthesis for High-Performance Lithium-Ion Anodes. J. Mater. Chem. A 2013, 11, 7601–7611. [Google Scholar] [CrossRef]
- Zhang, X.; Yang, Y.; Xia, S.; Huang, Z.; Yu, J.; Pi, Y.; Wang, F.; Ding, Y. N-Rich Porous Si@SiOx/NC Composites Derived from in Situ Polymerisation of Acrylic Acid as Anode for Li-Ion Batteries. J. Alloys Compd. 2023, 939, 168811. [Google Scholar] [CrossRef]
- Ke, C.-Z.; Liu, F.; Zheng, Z.-M.; Zhang, H.-H.; Cai, M.-T.; Li, M.; Yan, Q.-Z.; Chen, H.-X.; Zhang, Q.-B. Boosting Lithium Storage Performance of Si Nanoparticles via Thin Carbon and Nitrogen/Phosphorus Co-Doped Two-Dimensional Carbon Sheet Dual Encapsulation. Rare Met. 2021, 40, 1347–1356. [Google Scholar] [CrossRef]
- Liu, J.; Kopold, P.; van Aken, P.A.; Maier, J.; Yu, Y. Energy Storage Materials from Nature through Nanotechnology: A Sustainable Route from Reed Plants to a Silicon Anode for Lithium-Ion Batteries. Angew. Chem. Int. Ed. 2015, 54, 9632–9636. [Google Scholar] [CrossRef]
- Sohn, M.; Park, H.-I.; Kim, H. Foamed Silicon Particles as a High Capacity Anode Material for Lithium-Ion Batteries. Chem. Commun. 2017, 53, 11897–11900. [Google Scholar] [CrossRef]
- Men, X.; Wang, T.; Xu, B.; Kong, Z.; Liu, X.; Fu, A.; Li, Y.; Guo, P.; Guo, Y.-G.; Li, H.; et al. Hierarchically Structured Microspheres Consisting of Carbon Coated Silicon Nanocomposites with Controlled Porosity as Superior Anode Material for Lithium-Ion Batteries. Electrochim. Acta 2019, 324, 134850. [Google Scholar] [CrossRef]
- Nguyen, Q.H.; Kim, I.T.; Hur, J. Core-Shell Si@c-PAN Particles Deposited on Graphite as Promising Anode for Lithium-Ion Batteries. Electrochim. Acta 2019, 297, 355–364. [Google Scholar] [CrossRef]
- Liu, Z.; Du, J.; Jia, H.; Wang, W.; Zhang, M.; Ma, J.; Nie, Y.; Liu, T.; Song, K. Design of Hierarchical Buffer Structure for Silicon/Carbon Composite as a High-Performance Li-Ion Batteries Anode. J. Mater. Sci. Mater. Electron. 2022, 33, 3002–3015. [Google Scholar] [CrossRef]
- Wang, H.; Fu, J.; Wang, C.; Wang, J.; Yang, A.; Li, C.; Sun, Q.; Cui, Y.; Li, H. A Binder-Free High Silicon Content Flexible Anode for Li-Ion Batteries. Energy Environ. Sci. 2020, 13, 848–858. [Google Scholar] [CrossRef]
- Zhang, L.; Wang, C.; Dou, Y.; Cheng, N.; Cui, D.; Du, Y.; Liu, P.; Al-Mamun, M.; Zhang, S.; Zhao, H. A Yolk–Shell Structured Silicon Anode with Superior Conductivity and High Tap Density for Full Lithium-Ion Batteries. Angew. Chem. Int. Ed. 2019, 58, 8824–8828. [Google Scholar] [CrossRef]
- Mazouzi, D.; Karkar, Z.; Reale Hernandez, C.; Jimenez Manero, P.; Guyomard, D.; Roué, L.; Lestriez, B. Critical Roles of Binders and Formulation at Multiscales of Silicon-Based Composite Electrodes. J. Power Sources 2015, 280, 533–549. [Google Scholar] [CrossRef]
- Maroni, F.; Raccichini, R.; Birrozzi, A.; Carbonari, G.; Tossici, R.; Croce, F.; Marassi, R.; Nobili, F. Graphene/Silicon Nanocomposite Anode with Enhanced Electrochemical Stability for Lithium-Ion Battery Applications. J. Power Sources 2014, 269, 873–882. [Google Scholar] [CrossRef]
- Ren, J.-G.; Wang, C.; Wu, Q.-H.; Liu, X.; Yang, Y.; He, L.; Zhang, W. A Silicon Nanowire–Reduced Graphene Oxide Composite as a High-Performance Lithium Ion Battery Anode Material. Nanoscale 2014, 6, 3353–3360. [Google Scholar] [CrossRef] [PubMed]
- Wei, L.; Hou, Z.; Wei, H. Porous Sandwiched Graphene/Silicon Anodes for Lithium Storage. Electrochim. Acta 2017, 229, 445–451. [Google Scholar] [CrossRef]
- Li, Y.; Yan, K.; Lee, H.-W.; Lu, Z.; Liu, N.; Cui, Y. Growth of Conformal Graphene Cages on Micrometre-Sized Silicon Particles as Stable Battery Anodes. Nat. Energy 2016, 1, 1–9. [Google Scholar] [CrossRef]
- Li, B.; Jiang, Y.; Jiang, F.; Cao, D.; Wang, H.; Niu, C. Bird’s Nest-like Nanographene Shell Encapsulated Si Nanoparticles—Their Structural and Li Anode Properties. J. Power Sources 2017, 341, 46–52. [Google Scholar] [CrossRef]
- Ding, X.; Wang, Y. Bilayer-Graphene-Coated Si Nanoparticles as Advanced Anodes for High-Rate Lithium-Ion Batteries. Electrochim. Acta 2020, 329, 134975. [Google Scholar] [CrossRef]
- Han, X.-Y.; Zhao, D.-L.; Meng, W.-J.; Yang, H.-X.; Zhao, M.; Duan, Y.-J.; Tian, X.-M. Graphene Caging Silicon Nanoparticles Anchored on Graphene Sheets for High Performance Li-Ion Batteries. Appl. Surf. Sci. 2019, 484, 11–20. [Google Scholar] [CrossRef]
- Alkarmo, W.; Aqil, A.; Ouhib, F.; Thomassin, J.-M.; Mazouzi, D.; Guyomard, D.; Detrembleur, C.; Jérôme, C. Nanostructured 3D Porous Hybrid Network of N-Doped Carbon, Graphene and Si Nanoparticles as an Anode Material for Li-Ion Batteries. New J. Chem. 2017, 41, 10555–10560. [Google Scholar] [CrossRef]
- Xu, H.; Wang, Y.; Chen, R.; Bai, Y.; Li, T.; Jin, H.; Wang, J.; Xia, H. A Green-Synthetic Spiderweb-like Si@Graphene-Oxide Anode Material with Multifunctional Citric Acid Binder for High Energy-Density Li-Ion Batteries. Carbon 2020, 157, 330–339. [Google Scholar] [CrossRef]
- Wu, Y.; Yang, C.; Wu, S.; Wu, Z.; Wei, C.; Yang, M.; Lue, S.J. Preparation of Ternary Hierarchical Silicon/Reduced Graphene Oxide/Carbon Composites as Anodes for Lithium–Ion Batteries. J. Alloys Compd. 2019, 793, 433–445. [Google Scholar] [CrossRef]
- Huang, H.; Rao, P.; Choi, W.M. Carbon-Coated Silicon/Crumpled Graphene Composite as Anode Material for Lithium-Ion Batteries. Curr. Appl. Phys. 2019, 19, 1349–1354. [Google Scholar] [CrossRef]
- Ou, J.; Jin, F.; Wang, H.; Wu, S.; Zhang, H. Carbon Coated Si Nanoparticles Anchored to Graphene Sheets with Excellent Cycle Performance and Rate Capability for Lithium-Ion Battery Anodes. Surf. Coat. Technol. 2021, 418, 127262. [Google Scholar] [CrossRef]
- Yi, X.; Yu, W.-J.; Tsiamtsouri, M.A.; Zhang, F.; He, W.; Dai, Q.; Hu, S.; Tong, H.; Zheng, J.; Zhang, B.; et al. Highly Conductive C-Si@G Nanocomposite as a High-Performance Anode Material for Li-Ion Batteries. Electrochim. Acta 2019, 295, 719–725. [Google Scholar] [CrossRef]
- Kim, M.K.; Shin, W.H.; Jeong, H.M. Protective Carbon-Coated Silicon Nanoparticles with Graphene Buffer Layers for High Performance Anodes in Lithium-Ion Batteries. Appl. Surf. Sci. 2019, 467–468, 926–931. [Google Scholar] [CrossRef]
- Li, X.; Bai, Y.; Wang, M.; Wang, G.; Ma, Y.; Huang, Y.; Zheng, J. Dual Carbonaceous Materials Synergetic Protection Silicon as a High-Performance Free-Standing Anode for Lithium-Ion Battery. Nanomaterials 2019, 9, 650. [Google Scholar] [CrossRef] [PubMed]
- Ma, Y.; Qu, H.; Wang, W.; Yu, Y.; Zhang, X.; Li, B.; Wang, L. Si/SiO2@Graphene Superstructures for High-Performance Lithium-Ion Batteries. Adv. Funct. Mater. 2023, 33, 2211648. [Google Scholar] [CrossRef]
- Lin, N.; Zhou, J.; Wang, L.; Zhu, Y.; Qian, Y. Polyaniline-Assisted Synthesis of Si@C/RGO as Anode Material for Rechargeable Lithium-Ion Batteries. ACS Appl. Mater. Interfaces 2015, 7, 409–414. [Google Scholar] [CrossRef] [PubMed]
- Lin, N.; Xu, T.; Li, T.; Han, Y.; Qian, Y. Controllable Self-Assembly of Micro-Nanostructured Si-Embedded Graphite/Graphene Composite Anode for High-Performance Li-Ion Batteries. ACS Appl. Mater. Interfaces 2017, 9, 39318–39325. [Google Scholar] [CrossRef]
- Huang, G.; Han, J.; Lu, Z.; Wei, D.; Kashani, H.; Watanabe, K.; Chen, M. Ultrastable Silicon Anode by Three-Dimensional Nanoarchitecture Design. ACS Nano 2020, 14, 4374–4382. [Google Scholar] [CrossRef]
- Feng, Z.; Huang, C.; Fu, A.; Chen, L.; Pei, F.; He, Y.; Fang, X.; Qu, B.; Chen, X.; Ng, A.M.C.; et al. A Three-Dimensional Network of Graphene/Silicon/Graphene Sandwich Sheets as Anode for Li-Ion Battery. Thin Solid Films 2020, 693, 137702. [Google Scholar] [CrossRef]
- Deng, B.; Xu, R.; Wang, X.; An, L.; Zhao, K.; Cheng, G.J. Roll to Roll Manufacturing of Fast Charging, Mechanically Robust 0D/2D Nanolayered Si-Graphene Anode with Well-Interfaced and Defect Engineered Structures. Energy Storage Mater. 2019, 22, 450–460. [Google Scholar] [CrossRef]
- Wei, Q.; Liu, G.-C.; Zhang, C.; Hong, X.-J.; Song, C.-L.; Yang, Y.; Zhang, M.; Huang, W.; Cai, Y.-P. Novel Honeycomb Silicon Wrapped in Reduced Graphene Oxide/CNT System as High-Stability Anodes for Lithium-Ion Batteries. Electrochim. Acta 2019, 317, 583–593. [Google Scholar] [CrossRef]
- Hsieh, C.-C.; Liu, W.-R. Carbon-Coated Si Particles Binding with Few-Layered Graphene via a Liquid Exfoliation Process as Potential Anode Materials for Lithium-Ion Batteries. Surf. Coat. Technol. 2020, 387, 125553. [Google Scholar] [CrossRef]
- Chang, P.; Liu, X.; Zhao, Q.; Huang, Y.; Huang, Y.; Hu, X. Constructing Three-Dimensional Honeycombed Graphene/Silicon Skeletons for High-Performance Li-Ion Batteries. ACS Appl. Mater. Interfaces 2017, 9, 31879–31886. [Google Scholar] [CrossRef]
- Ding, X.; Wang, H.; Liu, X.; Gao, Z.; Huang, Y.; Lv, D.; He, P.; Huang, Y. Advanced Anodes Composed of Graphene Encapsulated Nano-Silicon in a Carbon Nanotube Network. RSC Adv. 2017, 7, 15694–15701. [Google Scholar] [CrossRef]
- Yan, Y.; Chen, Y.; Li, Y.; Wu, X.; Jin, C.; Wang, Z. Synthesis of Si/Fe2O3-Anchored RGO Frameworks as High-Performance Anodes for Li-Ion Batteries. Int. J. Mol. Sci. 2021, 22, 11041. [Google Scholar] [CrossRef] [PubMed]
- Wang, F.; Lin, S.; Lu, X.; Hong, R.; Liu, H. Poly-Dopamine Carbon-Coated Stable Silicon/Graphene/CNT Composite as Anode for Lithium Ion Batteries. Electrochim. Acta 2022, 404, 139708. [Google Scholar] [CrossRef]
- Ma, X.; Yin, Z.; Tong, H.; Yu, S.; Li, Y.; Ding, Z. 3D Graphene-like Nanosheets/Silicon Wrapped by Catalytic Graphite as a Superior Lithium Storage Anode. J. Electroanal. Chem. 2020, 873, 114350. [Google Scholar] [CrossRef]
- Yi, N. Three-Dimensional Polyaniline-Coated Si/Reduced Graphene Oxide as High-Performance Anode Material for Lithium-Ion Batteries. In Proceedings of the 2020 International Conference on Artificial Intelligence and Electromechanical Automation (AIEA), Tianjin, China, 26–28 June 2020; pp. 815–818. [Google Scholar] [CrossRef]
- Zhang, K.; Xia, Y.; Yang, Z.; Fu, R.; Shen, C.; Liu, Z. Structure-Preserved 3D Porous Silicon/Reduced Graphene Oxide Materials as Anodes for Li-Ion Batteries. RSC Adv. 2017, 7, 24305–24311. [Google Scholar] [CrossRef]
- Dyck, O.; Yeom, S.; Dillender, S.; Lupini, A.R.; Yoon, M.; Jesse, S. The Role of Temperature on Defect Diffusion and Nanoscale Patterning in Graphene. Carbon 2023, 201, 212–221. [Google Scholar] [CrossRef]
- You, X.; Zhang, Q.; Yang, J.; Dong, S. Review on 3D-Printed Graphene-Reinforced Composites for Structural Applications. Compos. Part Appl. Sci. Manuf. 2023, 167, 107420. [Google Scholar] [CrossRef]
- Li, N.; Liu, Y.; Ji, X.; Feng, J.; Wang, K.; Xie, J.; Lei, G.; Liu, X.; Guo, X.; Zhang, J. Polydopamine-Mediated Synthesis of Si@carbon@graphene Aerogels for Enhanced Lithium Storage with Long Cycle Life. Chin. Chem. Lett. 2021, 32, 3787–3792. [Google Scholar] [CrossRef]
- Sourice, J.; Quinsac, A.; Leconte, Y.; Sublemontier, O.; Porcher, W.; Haon, C.; Bordes, A.; De Vito, E.; Boulineau, A.; Jouanneau Si Larbi, S.; et al. One-Step Synthesis of Si@C Nanoparticles by Laser Pyrolysis: High-Capacity Anode Material for Lithium-Ion Batteries. ACS Appl. Mater. Interfaces 2015, 7, 6637–6644. [Google Scholar] [CrossRef] [PubMed]
- Banda, H.; Daffos, B.; Périé, S.; Chenavier, Y.; Dubois, L.; Aradilla, D.; Pouget, S.; Simon, P.; Crosnier, O.; Taberna, P.-L.; et al. Ion Sieving Effects in Chemically Tuned Pillared Graphene Materials for Electrochemical Capacitors. Chem. Mater. 2018, 30, 3040–3047. [Google Scholar] [CrossRef]
- Dalavi, S.; Guduru, P.; Lucht, B.L. Performance Enhancing Electrolyte Additives for Lithium Ion Batteries with Silicon Anodes. J. Electrochem. Soc. 2012, 159, A642. [Google Scholar] [CrossRef]
- García-Bordejé, E.; Víctor-Román, S.; Sanahuja-Parejo, O.; Benito, A.M.; Maser, W.K. Control of the Microstructure and Surface Chemistry of Graphene Aerogels via PH and Time Manipulation by a Hydrothermal Method. Nanoscale 2018, 10, 3526–3539. [Google Scholar] [CrossRef]
- Desrues, A. Matériaux composites Si@C nanostructurés pour anodes de batterie Li-ion à haute densité d’énergie. Relations entre structure/morphologie et mécanismes de dégradation. Ph.D. Thesis, Université Paris Saclay (COmUE), Gif-sur-Yvette, France, 2019. [Google Scholar]
- Beyssac, O.; Goffé, B.; Petitet, J.-P.; Froigneux, E.; Moreau, M.; Rouzaud, J.-N. On the Characterization of Disordered and Heterogeneous Carbonaceous Materials by Raman Spectroscopy. Spectrochim. Acta. A. Mol. Biomol. Spectrosc. 2003, 59, 2267–2276. [Google Scholar] [CrossRef] [PubMed]
- Benayad, A.; Hajjaji, H.; Coustier, F.; Benmansour, M.; Chabli, A. Surface Chemical-Bonds Analysis of Silicon Particles from Diamond-Wire Cutting of Crystalline Silicon. J. Appl. Phys. 2016, 120, 235308. [Google Scholar] [CrossRef]
- Jo, D.Y.; Kim, J.K.; Oh, H.G.; Kang, Y.C.; Park, S.-K. Chemically Integrating MXene Nanosheets with N-Doped C-Coated Si Nanoparticles for Enhanced Li Storage Performance. Scr. Mater. 2021, 199, 113840. [Google Scholar] [CrossRef]


| Characteristic Size (nm) | |||
|---|---|---|---|
| TEM | BET | SAXS | |
| Si NPs | 22.1 | 28.7 | 27.3 |
| Si@C NPs | 23.3 | 29.2 | 26.5 |
| Samples | d (nm) | C/O | σ (S/m) | ρ (g/L) |
|---|---|---|---|---|
| Si-GHG-1h | 0.37 | 1.7 | 232 | - |
| Si-GHG-18h | 0.37 | 1.8 | 308 | 0.04 |
| Si@C-GHG-1h | 0.35 | 3.1 | 388 | - |
| Si@C-GHG-18h | 0.35 | 3.0 | 696 | 0.11 |
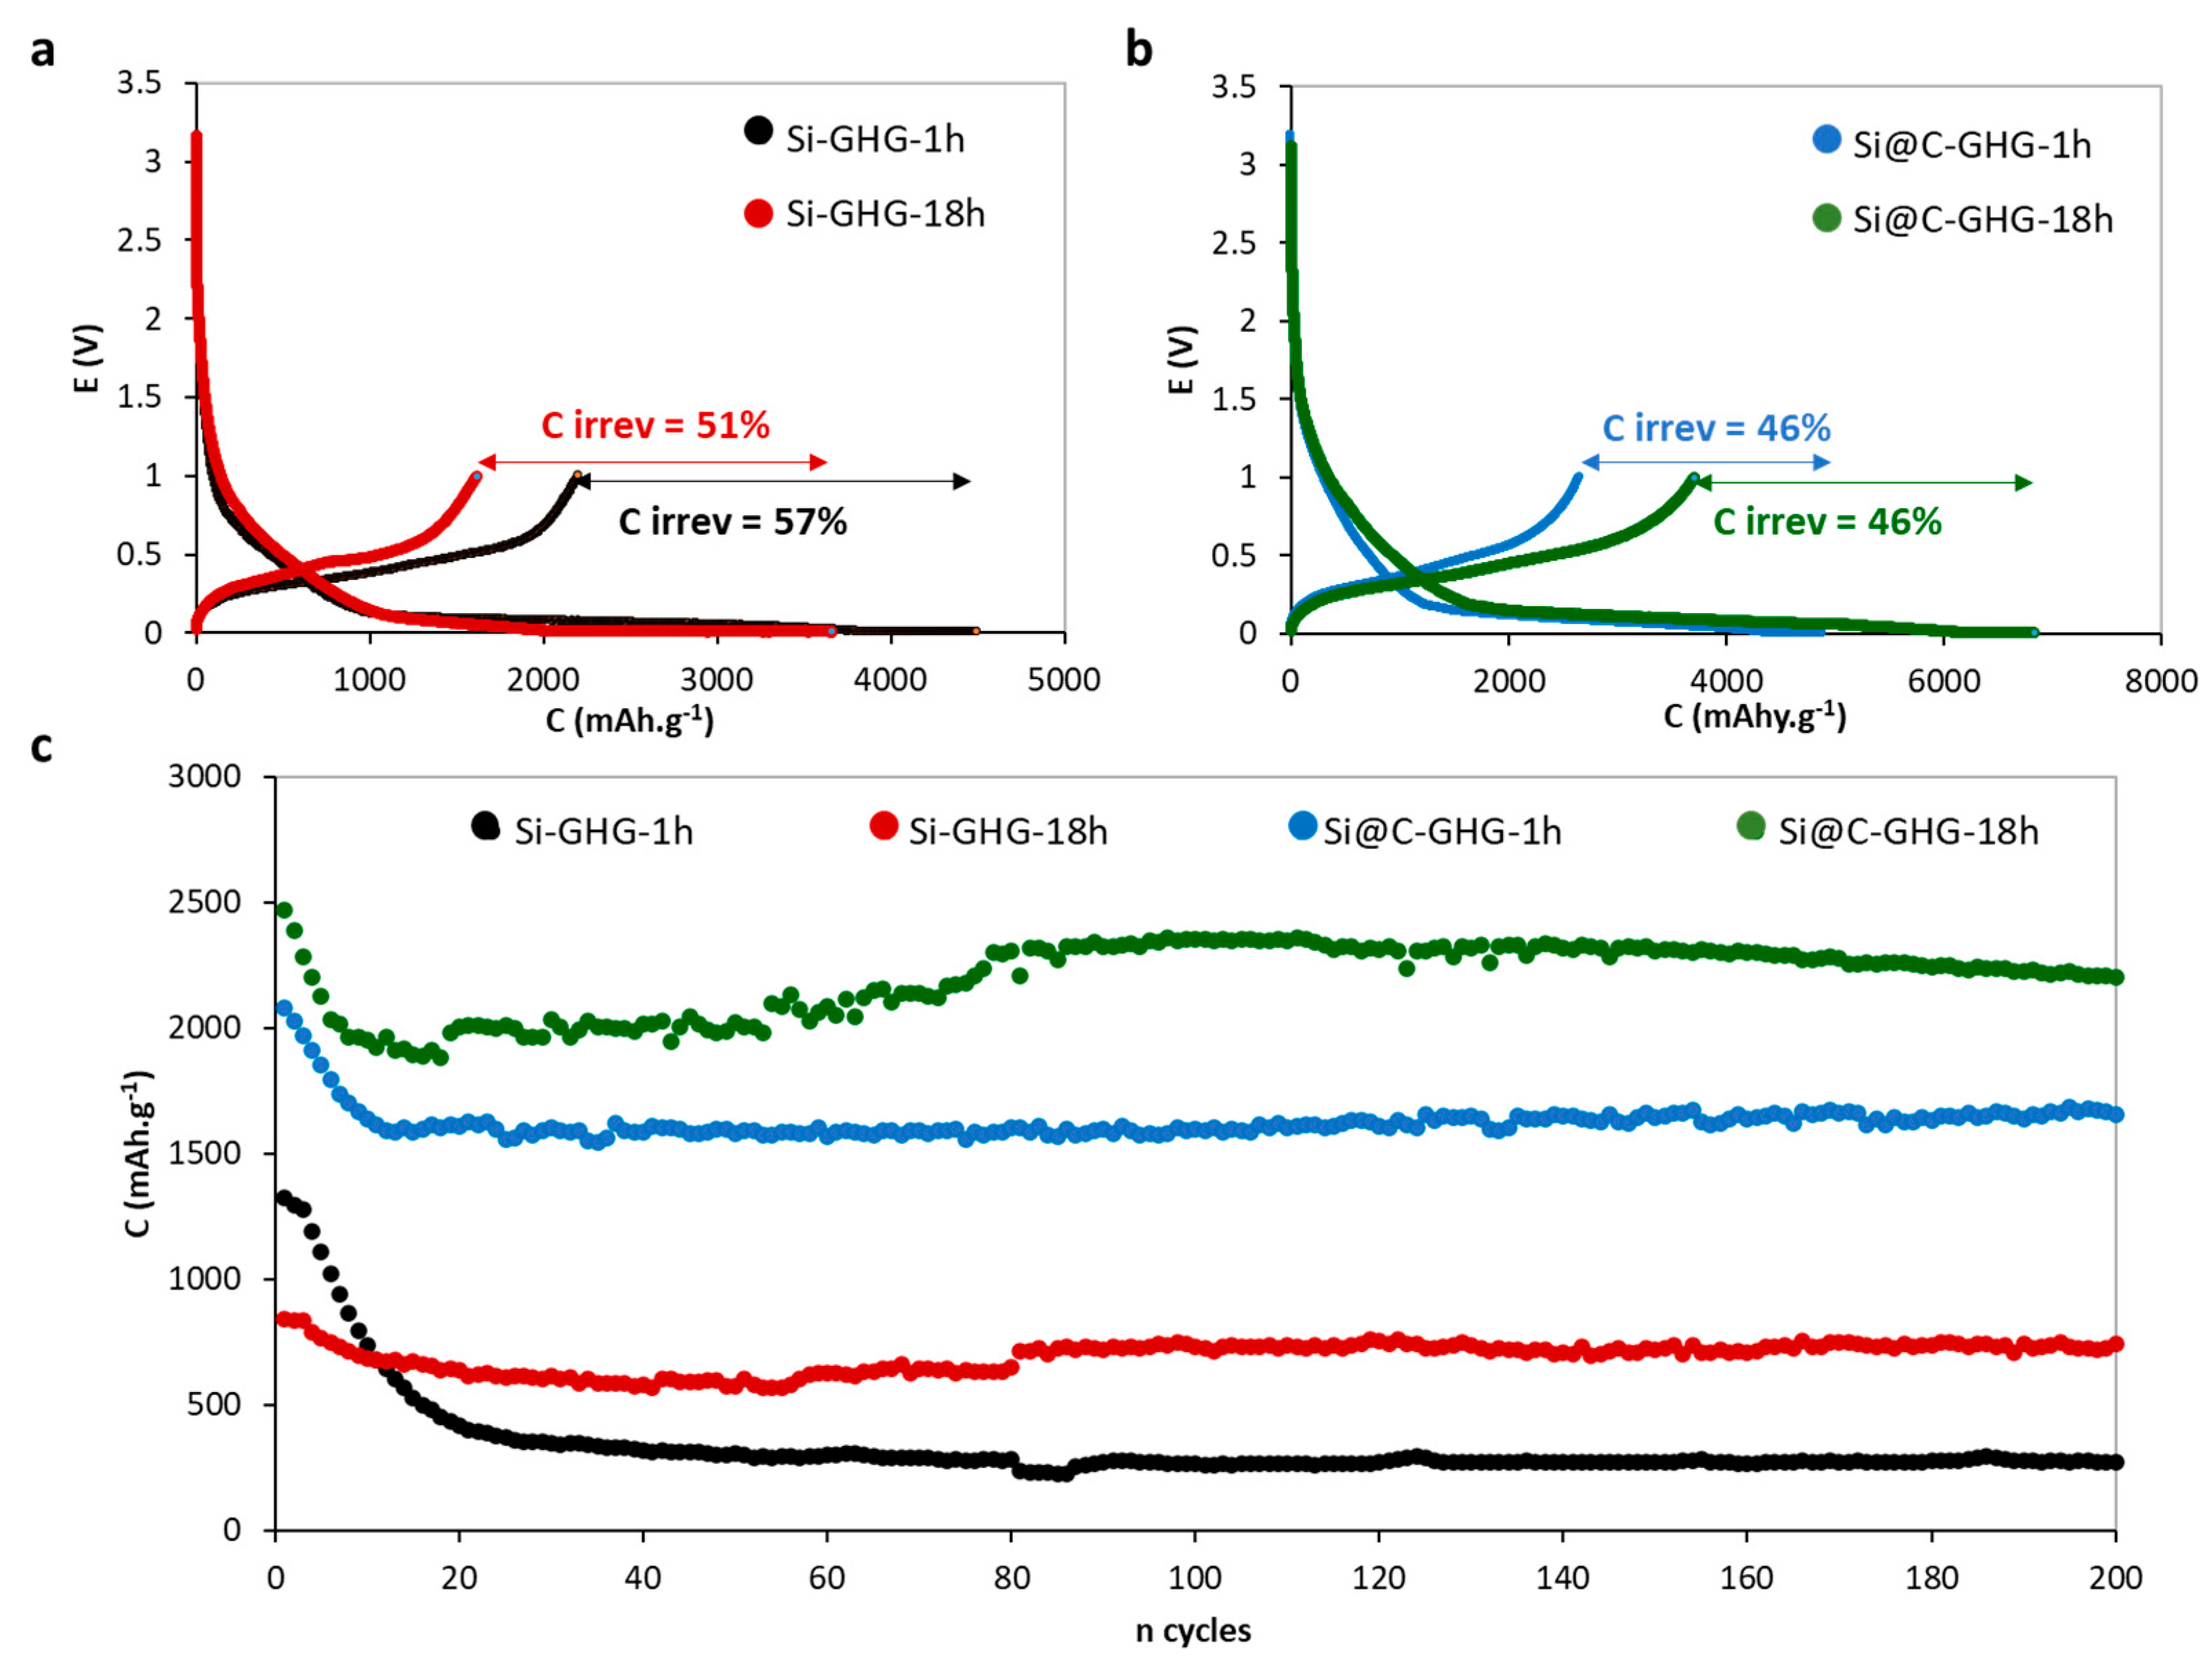
| Samples | Cirrev (%) 1st Cycle | C (after 200 Cycles) mAh.g−1 | Average Efficiency (%) at 200 Cycles | σ (S/m) |
|---|---|---|---|---|
| Si-GHG-1h | 57 | 273 | 99.3 | 232 |
| Si-GHG-18h | 51 | 745 | 99.1 | 308 |
| Si@C-GHG-1h | 46 | 1670 | 99 | 388 |
| Si@C-GHG-18h | 46 | 2205 | 99.1 | 696 |
Disclaimer/Publisher’s Note: The statements, opinions and data contained in all publications are solely those of the individual author(s) and contributor(s) and not of MDPI and/or the editor(s). MDPI and/or the editor(s) disclaim responsibility for any injury to people or property resulting from any ideas, methods, instructions or products referred to in the content. |
© 2023 by the authors. Licensee MDPI, Basel, Switzerland. This article is an open access article distributed under the terms and conditions of the Creative Commons Attribution (CC BY) license (https://creativecommons.org/licenses/by/4.0/).
Share and Cite
Mery, A.; Chenavier, Y.; Marcucci, C.; Benayad, A.; Alper, J.P.; Dubois, L.; Haon, C.; Boime, N.H.; Sadki, S.; Duclairoir, F. Toward the Improvement of Silicon-Based Composite Electrodes via an In-Situ Si@C-Graphene Composite Synthesis for Li-Ion Battery Applications. Materials 2023, 16, 2451. https://doi.org/10.3390/ma16062451
Mery A, Chenavier Y, Marcucci C, Benayad A, Alper JP, Dubois L, Haon C, Boime NH, Sadki S, Duclairoir F. Toward the Improvement of Silicon-Based Composite Electrodes via an In-Situ Si@C-Graphene Composite Synthesis for Li-Ion Battery Applications. Materials. 2023; 16(6):2451. https://doi.org/10.3390/ma16062451
Chicago/Turabian StyleMery, Adrien, Yves Chenavier, Coralie Marcucci, Anass Benayad, John P. Alper, Lionel Dubois, Cédric Haon, Nathalie Herlin Boime, Saïd Sadki, and Florence Duclairoir. 2023. "Toward the Improvement of Silicon-Based Composite Electrodes via an In-Situ Si@C-Graphene Composite Synthesis for Li-Ion Battery Applications" Materials 16, no. 6: 2451. https://doi.org/10.3390/ma16062451
APA StyleMery, A., Chenavier, Y., Marcucci, C., Benayad, A., Alper, J. P., Dubois, L., Haon, C., Boime, N. H., Sadki, S., & Duclairoir, F. (2023). Toward the Improvement of Silicon-Based Composite Electrodes via an In-Situ Si@C-Graphene Composite Synthesis for Li-Ion Battery Applications. Materials, 16(6), 2451. https://doi.org/10.3390/ma16062451