Article

Phase Equilibria of the Fe–Cr–Er Ternary System in the Range 973–1273 K

School of Material Science and Engineering, Central South University, Changsha 410083, China
*
Author to whom correspondence should be addressed.
Materials 2023, 16(4), 1705; https://doi.org/10.3390/ma16041705
Submission received: 18 January 2023 / Revised: 10 February 2023 / Accepted: 14 February 2023 / Published: 17 February 2023

Abstract

:
Phase relations of the Fe–Cr–Er system in the temperature range 973–1273 K were experimentally investigated using equilibrated alloys. The isothermal sections consisted of 9 single-phase regions, 16 two-phase regions, and 8 three-phase regions at 973 K and 1073 K. At 1273 K, the σ phase disappeared, and liquid appeared. All single phases had a solid solubility range that showed a downward trend with a decrease in temperature. The homogeneity range of the ErFe12−xCrx ternary compound was determined to be x = 1.8–4.5. The more accurate phase relations obtained in this work can better guide the preparation of Fe–Cr–Er alloys in actual production.

1. Introduction

Oxide dispersion-strengthened (ODS) steel, which developed from martensitic and ferritic steels, is the most promising candidate for nuclear reaction cladding [1]. ODS steel is strengthened by dispersing oxide particles, which strongly impede dislocation motion and thereby increase the onset stress of plastic deformation and creep resistance [2,3]. ODS ferritic/martensitic steels containing 9–12 mass% Cr have been developed as fuel cladding material because of their high creep strength at elevated temperatures and adequate resistance to neutron irradiation embrittlement [4,5,6,7,8,9]. The performance of ODS steel largely depends on the particle size and stability of the dispersed oxide nanoparticles [10,11]. Oxide particles containing rare earth elements, especially Y2O3, are the most widely used; however, the concentration of oxide particles containing Y is readily saturated in ODS steel [12]. To further increase the concentration of oxide particles to improve the material properties, it is necessary to add other rare earth elements. Er not only forms oxide particles but can also form magnetic intermetallic compounds with transition metals, which can play a magnetic refrigeration role and prevent the reactor from overheating and causing accidents [13,14,15,16,17,18,19,20]. Therefore, ODS steel containing the Fe–Cr–Er system is a potential nuclear reactor cladding material.
To study the Fe–Cr–Er system, it is very important to know the thermodynamic information of the ternary system. Phase diagrams are an effective means to intuitively express the relationship between phases in a thermodynamic equilibrium state and are the basic theoretical guidance for the research, development, and design of new materials [21,22,23,24,25,26]. However, the phase diagram information of the Fe–Cr–Er ternary system is still lacking. Only Pan et al. [27] measured its isothermal section at 773 K in 2014. The chemical composition and phase content of multi-component iron-based alloys at different temperatures directly affect macroscopic properties of the material [28,29,30]. Considering that the nuclear reactor is operated at high temperatures, only studying 773 K is far from practical. Therefore, the isothermal section of the Fe–Cr–Er ternary system needs to be completed. In this work, the isothermal sections of the Fe–Cr–Er ternary system at 1273 K, 1073 K, and 973 K were determined by the equilibrium alloy method.
The Fe–Cr binary system has been extensively studied as the basis for the study of many engineering materials [31,32,33,34]. The σ phase is the most prominent characteristic phase in the Fe–Cr binary system. Menezes et al. [35] found the existence of the σ phase by X-ray diffraction (XRD) characterization. Bergman et al. [36] analyzed the crystal structure of the σ phase. Andersson et al. [37] performed the first thermodynamic evaluation of the Fe–Cr system. Based on Andersson’s work, Lee [34] modified the model of the liquid phase and improved the Fe–Cr phase diagram. Xiong et al. [38] provided a comprehensive summary of thermodynamic calculations for the Fe–Cr system and updated descriptions concerning the miscibility gap band, Curie temperature, and magnetic moment. Jacob et al. [31] adopted first-principles calculations to re-select the σ phase model and further optimized the Fe–Cr phase diagram, as shown in Figure 1.
There are four compounds (ErFe2, ErFe3, Er6Fe23, and Er2Fe17) in the Fe–Er binary system. Meyer [39] obtained the Fe–Er binary phase diagram by thermal analysis, electron probe microanalysis (EPMA), and XRD. Buschow and Goot [40] studied the phase relationship, crystal structure, magnetic properties, and lattice constants of various intermetallic compounds in the Fe–Er system and noticed that Fe and Er show mutual solubility. The Miedema model was employed to calculate the enthalpy of the formation of an intermetallic compound in the Fe–Er system [41]. Recently, Zhou et al. [42] conducted a detailed thermodynamic evaluation of the Fe–Er system, as shown in Figure 2.
No intermetallic compounds in the Cr–Er binary system have been reported. The calculated phase diagram used in this work adopted the latest thermodynamic parameters reported by Ray et al. [43] in 1996, as shown in Figure 3.
In the Fe–Cr–Er ternary system, it is generally believed that there are two types of intermetallic compounds: ErCr12−xFex and Er3Cr29−xFex [44,45]. Stefanski et al. [46] identified ErCr2Fe10 and studied its structure. On this basis, Bara [47] further discussed the magnetic properties of ErCr2Fe10. Luo [48] synthesized a series of Er3Cr29−xFex compounds to investigate their structures and magnetic properties by XRD and magnetic measurements. Luo [48] found that all Er3Cr29−xFex compounds crystallized in disordered Th2Ni17-type structures. By combining the three related binary phase diagrams, Pan et al. [27] measured an isothermal section of the Fe–Cr–Er ternary phase diagram and analyzed the relationship between different phases at 773 K, as shown in Figure 4. Previously reported binary and ternary phases, crystal structures, and lattice parameters are listed in Table 1.

2. Materials and Methods

The equilibrium alloy method of static measurement was adopted in this work. Iron rod (99.99 mass%), chromium rod (99.99 mass%), and erbium block (99.99 mass%) were selected as raw materials. Considering the high density of Er, the mass of each alloy sample was designed to be 18 g. The compositions of each alloy are listed in Table 2, Table 3 and Table 4. To prevent the alloy samples from being oxidized, sponge titanium was used as an oxygen absorbent in the arc-melting process. Each sample was melted on a water-cooled copper crucible under a high-purity argon atmosphere. To ensure homogeneity, each sample was remelted at least six times. The prepared alloy samples were sealed in quartz tubes filled with argon as a protective gas and annealed at 973 K and 1073 K for 90 days and at 1273 K for 60 days. After annealing, the alloys were quenched in ice water to retain the high-temperature microstructure.
EPMA (JAXA-8800 R, JEOL, 15 kV, 1 × 10⁻⁸ A, Tokyo, Japan) equipped with an OXFORD INCA 500 wave-dispersive X-ray spectrometer (WDS, JAXA-8800 R, JEOL, 15 kV, 1 × 10⁻⁸ A, Tokyo, Japan) was used to detect the microstructure of equilibrated alloys and composition of each phase, including solubility. XRD (Rigaku d-max/2550 VB, Cu K, 40 kV, 250 mA, Tokyo, Japan) was employed to analyze the crystal structure of typical alloys within the scanning range of 10°–90° and speed of 0.133°/s. The data were analyzed by JADE 8.7 software. Backscattered electron (BSE) images of the alloy samples were acquired using a scanning electron microscope (SEM; TESCAN MIRA3 LMH, 15 kV, working distance of 15 mm, Brno, Czech Republic).

3. Results

The isothermal section of the Fe–Cr–Er system at 1273 K was obtained based on the analysis of typical alloy samples at 1273 K. The maximum solid solution solubilities of Cr were 15.19 at.%, 2.46 at.%, 18.67 at.%, and 18.89 at.% in ErFe2, ErFe3, Er6Fe23, and Er2Fe17, respectively. Only ErCr2Fe10 was found as a ternary compound at this temperature and could dissolve about 20.43 at.% Cr at most. In addition to the solution of Cr mentioned above, this work found that Er also can dissolve as ErFe2, ErFe3, Er6Fe23, and Er2Fe17. This is a clear difference from the results of Pan et al. [27]. This phenomenon may be due to the influence of the experimental temperature. The Fe–Er binary phase diagram also showed no solid solubility of Er in Fe–Er binary compounds. After repeatedly confirming the accuracy of the experimental data, we speculate that the addition of Cr may affect the solubility of Er in Fe–Er binary compounds. Comparison between this work and published literature [31,39,43] shows that the phase relationships are accurate, except that solubility differs slightly in the relevant binary phase diagrams. This confirmed the reliability of the Fe–Cr–Er isothermal section at 1273 K, shown in Figure 5.
The isothermal section of the Fe–Cr–Er ternary system at 1073 K is similar to that at 1273 K, except that the maximum solid solubilities of ErCr2Fe10, ErFe2, ErFe3, Er6Fe23, Er2Fe17, and Er are slightly lower. Additionally, α(Fe,Cr) appears at the Fe-enriched corner instead of γ(Fe) at 1073 K. This is consistent with the binary optimized phase diagram, and therefore its appearance is reasonable and in accordance with expectation [31]. The 1073 K isothermal section obtained in this work is shown in Figure 6.
The isothermal section of the Fe–Cr–Er ternary system at 973 K was determined based on phase equilibrium data for 13 alloy samples at 973 K, as shown in Figure 7. Eight three-phase regions and 16 two-phase regions were measured. In this isothermal section, there was only one ternary compound, ErCr2Fe10, and four binary compounds, all having a solid solubility interval. In the region with low Er content, Fe and Cr also formed α(Fe, Cr). The solid solution range of all compounds in this system became narrower than that at 1073 K, so it can be speculated that the solid solution range narrowed as the temperature decreased.

4. Discussion

The experimental data obtained from SEM, EPMA, and XRD examination were analyzed to determine the isothermal sections and phase relationships of the Fe–Cr–Er ternary system at 1273 K, 1073 K, and 973 K. In the following context, the phase relations in several key alloys are discussed in detail.

4.1. Phase Equilibria at 1273 K

Twenty alloy samples were prepared to determine the isothermal section and phase relationships of the Fe–Cr–Er ternary system at 1273 K. The constituent phases of each alloy sample are listed in Table 2. The nominal composition was set before synthesizing each alloy, and the content of each element in each phase was measured by WDS.
Figure 8 presents BSE images and XRD patterns of alloys A2 and A7 annealed at 1273 K. From the observed phase distribution in Figure 8a, there were three different phases in A2. Analysis of the X-ray diffraction pattern in Figure 8b indicated that the phase composition of A2 was the three-phase equilibrium of ErFe2 + ErFe3 + Er6Fe23. WDS further showed Cr concentrations of 11.73 at.%, 1.72 at.%, and 3.56 at.% in Er6Fe23, ErFe3, and ErFe2, respectively. Compared with alloy A2, shown in Figure 8c,d, it was determined that alloy A7 was located in the three-phase equilibrium region of ErFe2 + α(Fe,Cr) + Er6Fe23. The WDS results further showed solid solubilities of Cr in Er6Fe23 and ErFe2 of 18.34 at.% and 6.94 at.%, respectively. These two phases can dissolve each other to a large extent between Fe and Cr, which is considered a reasonable phenomenon from the speculation of the Fe–Cr phase diagram.
BSE images and XRD patterns of alloys A8 and A12 are shown in Figure 9. Figure 9a illustrates the phase composition in alloy A8, which comprises three phases. By comparing standard powder diffraction file (PDF) cards with the diffraction peaks in Figure 9b, it was concluded that A8 was located in a three-phase equilibrium of ErFe2 + Er + α(Fe,Cr). The WDS results further showed approximately 14.80 at.% Cr dissolved in ErFe2. Combined with information extracted from XRD, the black area in Figure 9c was identified as the ternary intermetallic compound ErCr2Fe10. The other two phases with different contrasts are Er2Fe17 and Er6Fe23. The WDS results further showed approximately 13.46 at.% Cr dissolved in Er6Fe23 and 18.32 at.% Cr in Er2Fe17. As the solitary ternary compound in this system, ErCr2Fe10 dissolved more Cr and had a certain width in the direction of Er in this work compared with that of Pan et al. [27].
BSE images and XRD patterns of alloys A13 and A16 are shown in Figure 10. Figure 10a illustrates the phase composition of alloy A13, which comprises three phases. According to the analysis of characteristic peak positions in Figure 10b, ErCr2Fe10, Er6Fe23, and α(Fe,Cr) were determined in A13 and formed a three-phase equilibrium. WDS further determined that approximately 16.75 at.% and 11.90 at.% Cr were dissolved in Er6Fe23 and ErCr2Fe10, respectively. Figure 10c,d show BSE images and XRD patterns of A16. Although there is only one characteristic peak of γ(Fe) in the 2θ range from 20° to 80°, the peak exists independently. By combining the law of phase equilibrium and the Fe–Cr phase diagram, A16 was defined in the three-phase area of Er2Fe17 + ErCr2Fe10 + γ(Fe). According to WDS data, the maximum atomic percentage of Cr in γ(Fe) was 10.02 at 1273 K in A16. The solubility of Cr in γ(Fe) conforms to the description of Jacob et al. [31].

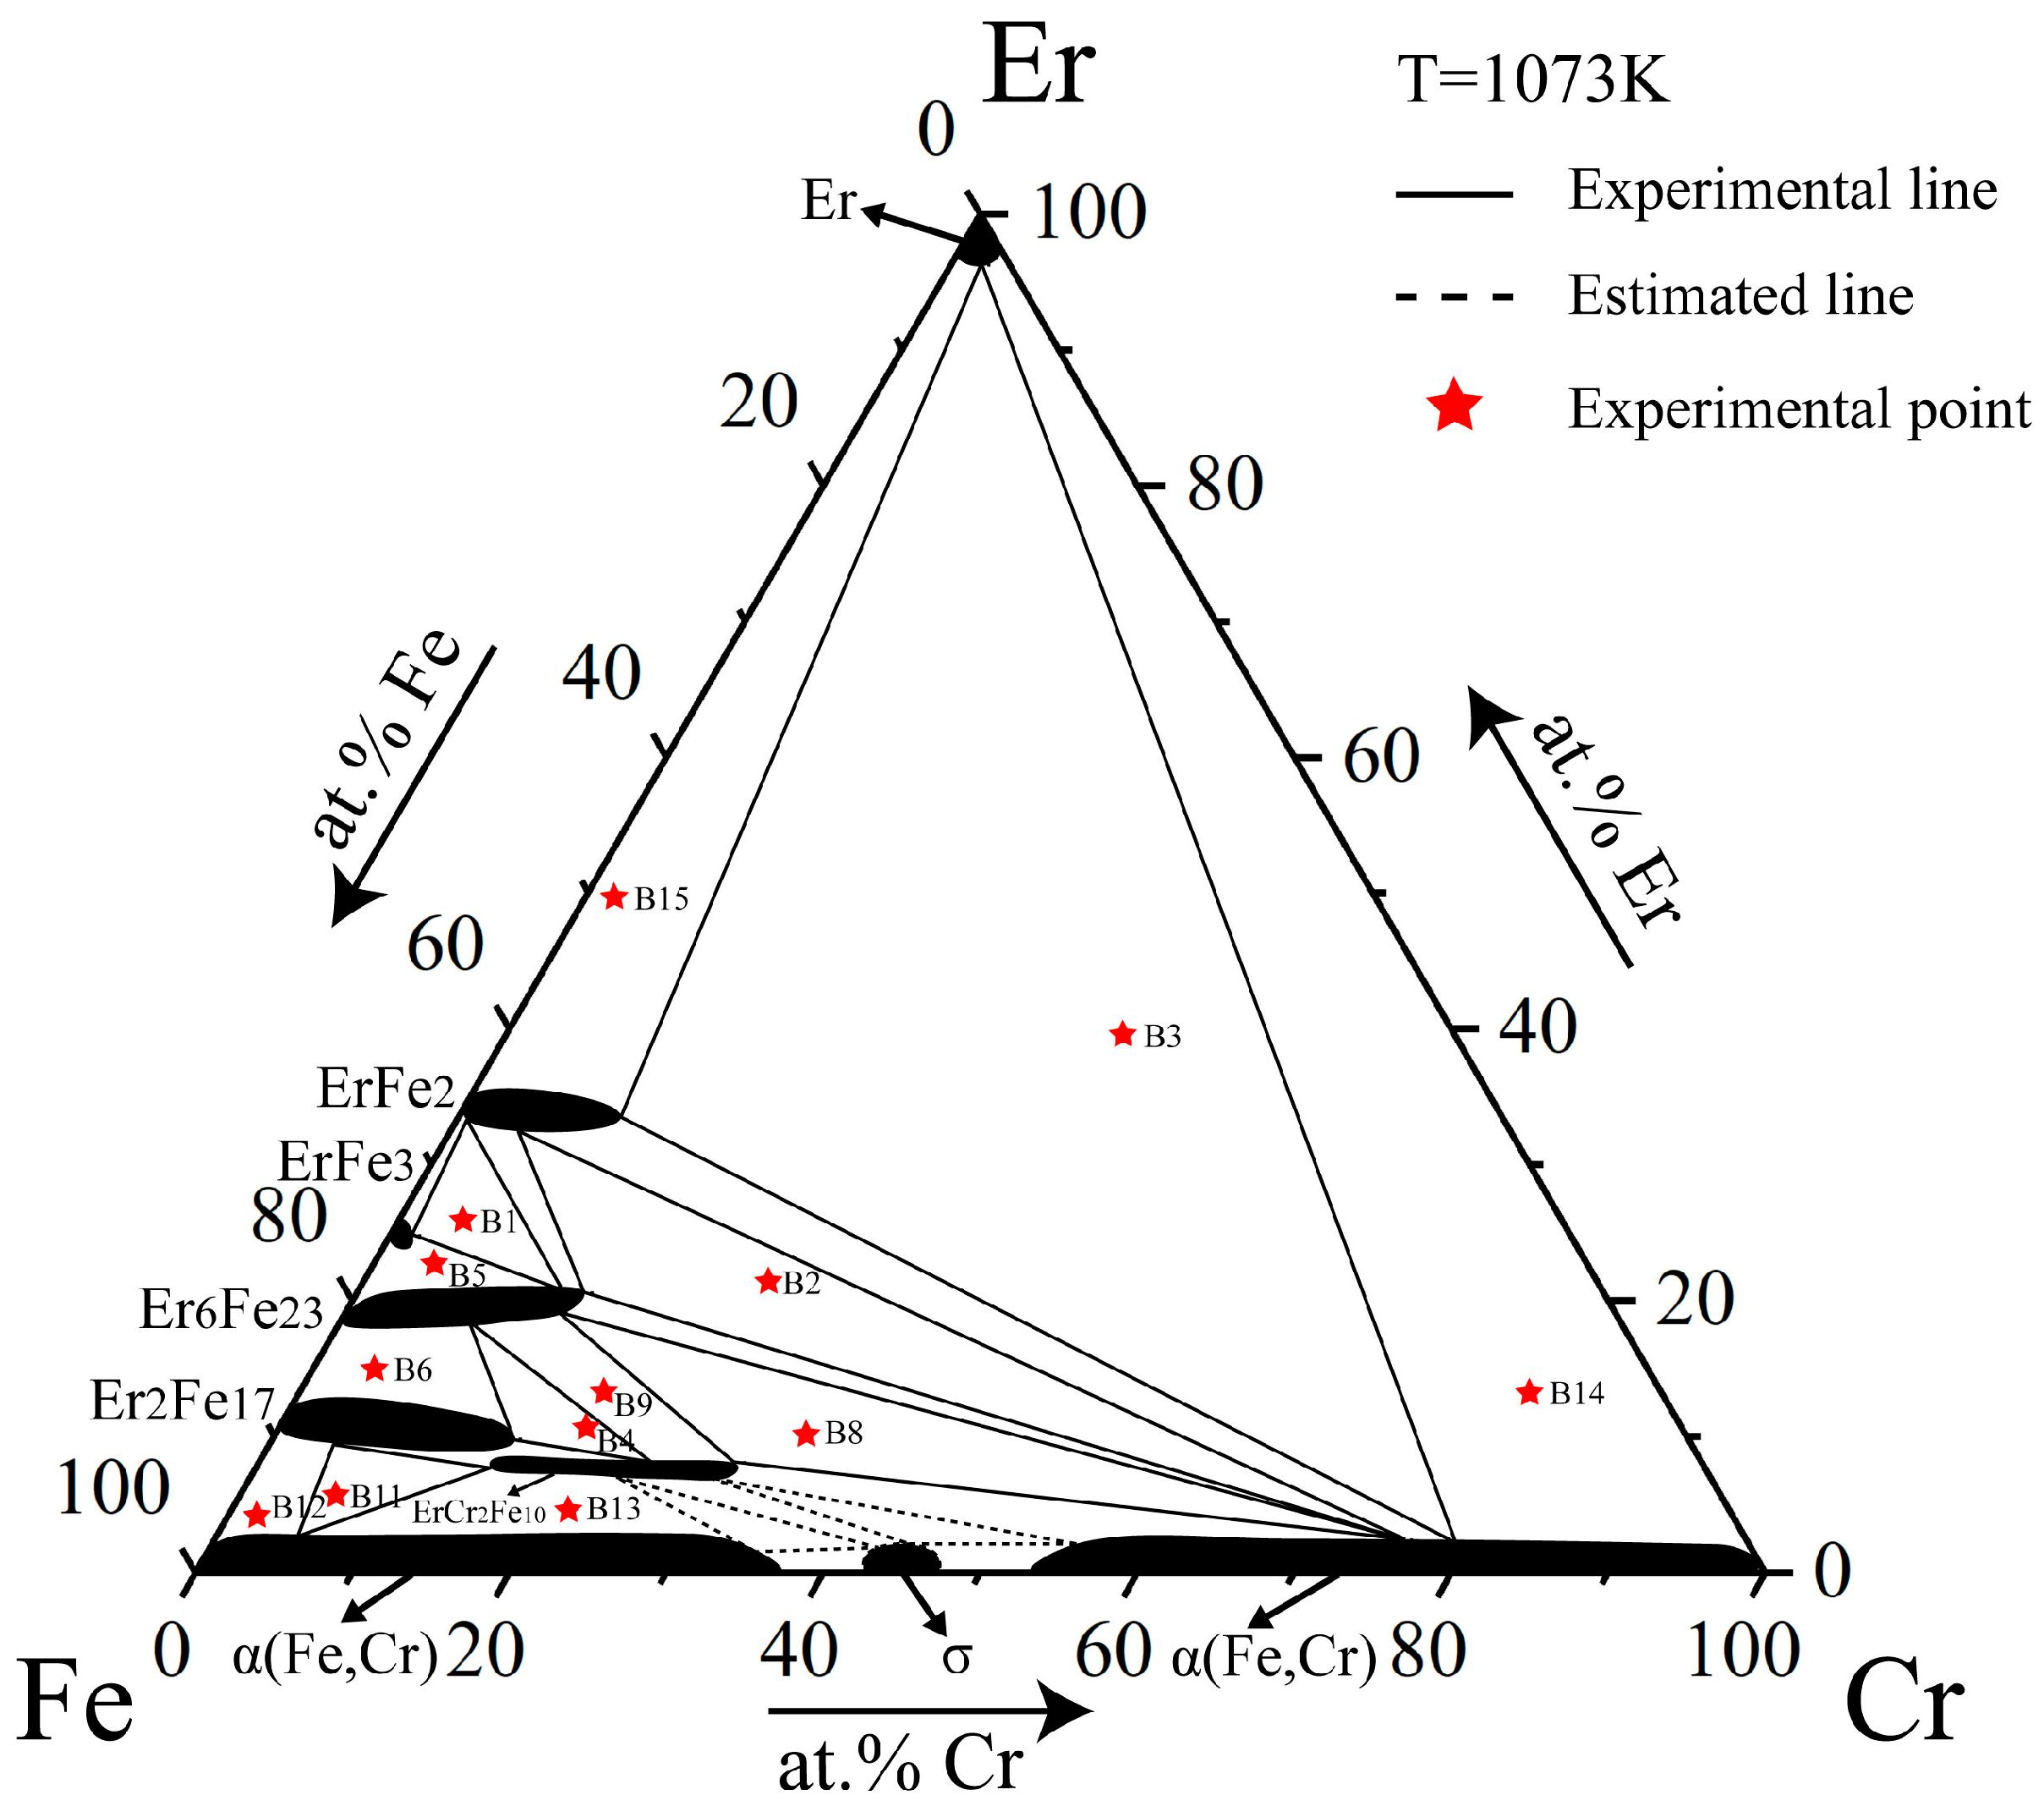
4.2. Phase Equilibria at 1073 K

Fourteen alloy samples were prepared to determine the isothermal section and phase relationships of the Fe–Cr–Er ternary system at 1073 K. The constituent phases of each alloy sample are listed in Table 3.
Both B1 and B2 had three phases based on the BSE images (Figure 11a,c). According to the XRD and WDS results, all phases are already identified. B1 and B2 are located in three-phase equilibria of ErFe2 + Er6Fe23 + ErFe3 and ErFe2 + Er6Fe23 + α(Fe,Cr), respectively. Cr was present at 13.49 at.% and 14.85 at.% in the compound Er6Fe23 in B1 and B2. There was less than 18.67 at.% Cr, which is the maximum solid solution solubility of Cr at 1273 K. As the temperature decreased by 200 K, the solid solubility of Cr in Er6Fe23 showed a significant declining trend.
BSE images of alloy samples B8 and B11 are shown in Figure 12a,c. The gray phase in B8 and dark gray phase in B11 have the same atomic ratios of ErCr2Fe10, and the XRD characteristic peaks of ErCr2Fe10 (shown in Figure 12b,d) are basically consistent with the PDF card of the known compound, ErCr2Fe10. To sum up, ErCr2Fe10 does not disappear with the decrease in temperature and is a phase that can exist stably at low temperatures. Noticeably, γ(Fe) was replaced by α(Fe,Cr) in the Fe-enriched corner. This is reasonable and consistent with the Fe–Cr phase diagram.
Figure 13 shows BSE images and XRD patterns of alloys B3 and B7. By combining the data shown in Figure 13a,b, the ErFe2, Er, and α(Fe,Cr) phases were found in B3, indicating a three-phase equilibrium of ErFe2 + Er + α(Fe,Cr). The WDS results further validate these phases and indicate a solid solubility of Cr of 10.48 at.% in ErFe2. In Figure 13a, the uniform distribution of Er in the area also proved that it precipitated in a later stage. This can be used to judge whether the sample was in equilibrium. Compared with alloy B3, shown in Figure 13c,d, it can be determined that alloy B7 was located in the three-phase equilibrium region of Er2Fe17 + Er6Fe23 + ErCr2Fe10. The WDS results further showed that approximately 8.35 at.% Cr was dissolved in Er6Fe23 and approximately 17.77 at.% of Cr was dissolved in Er2Fe17.

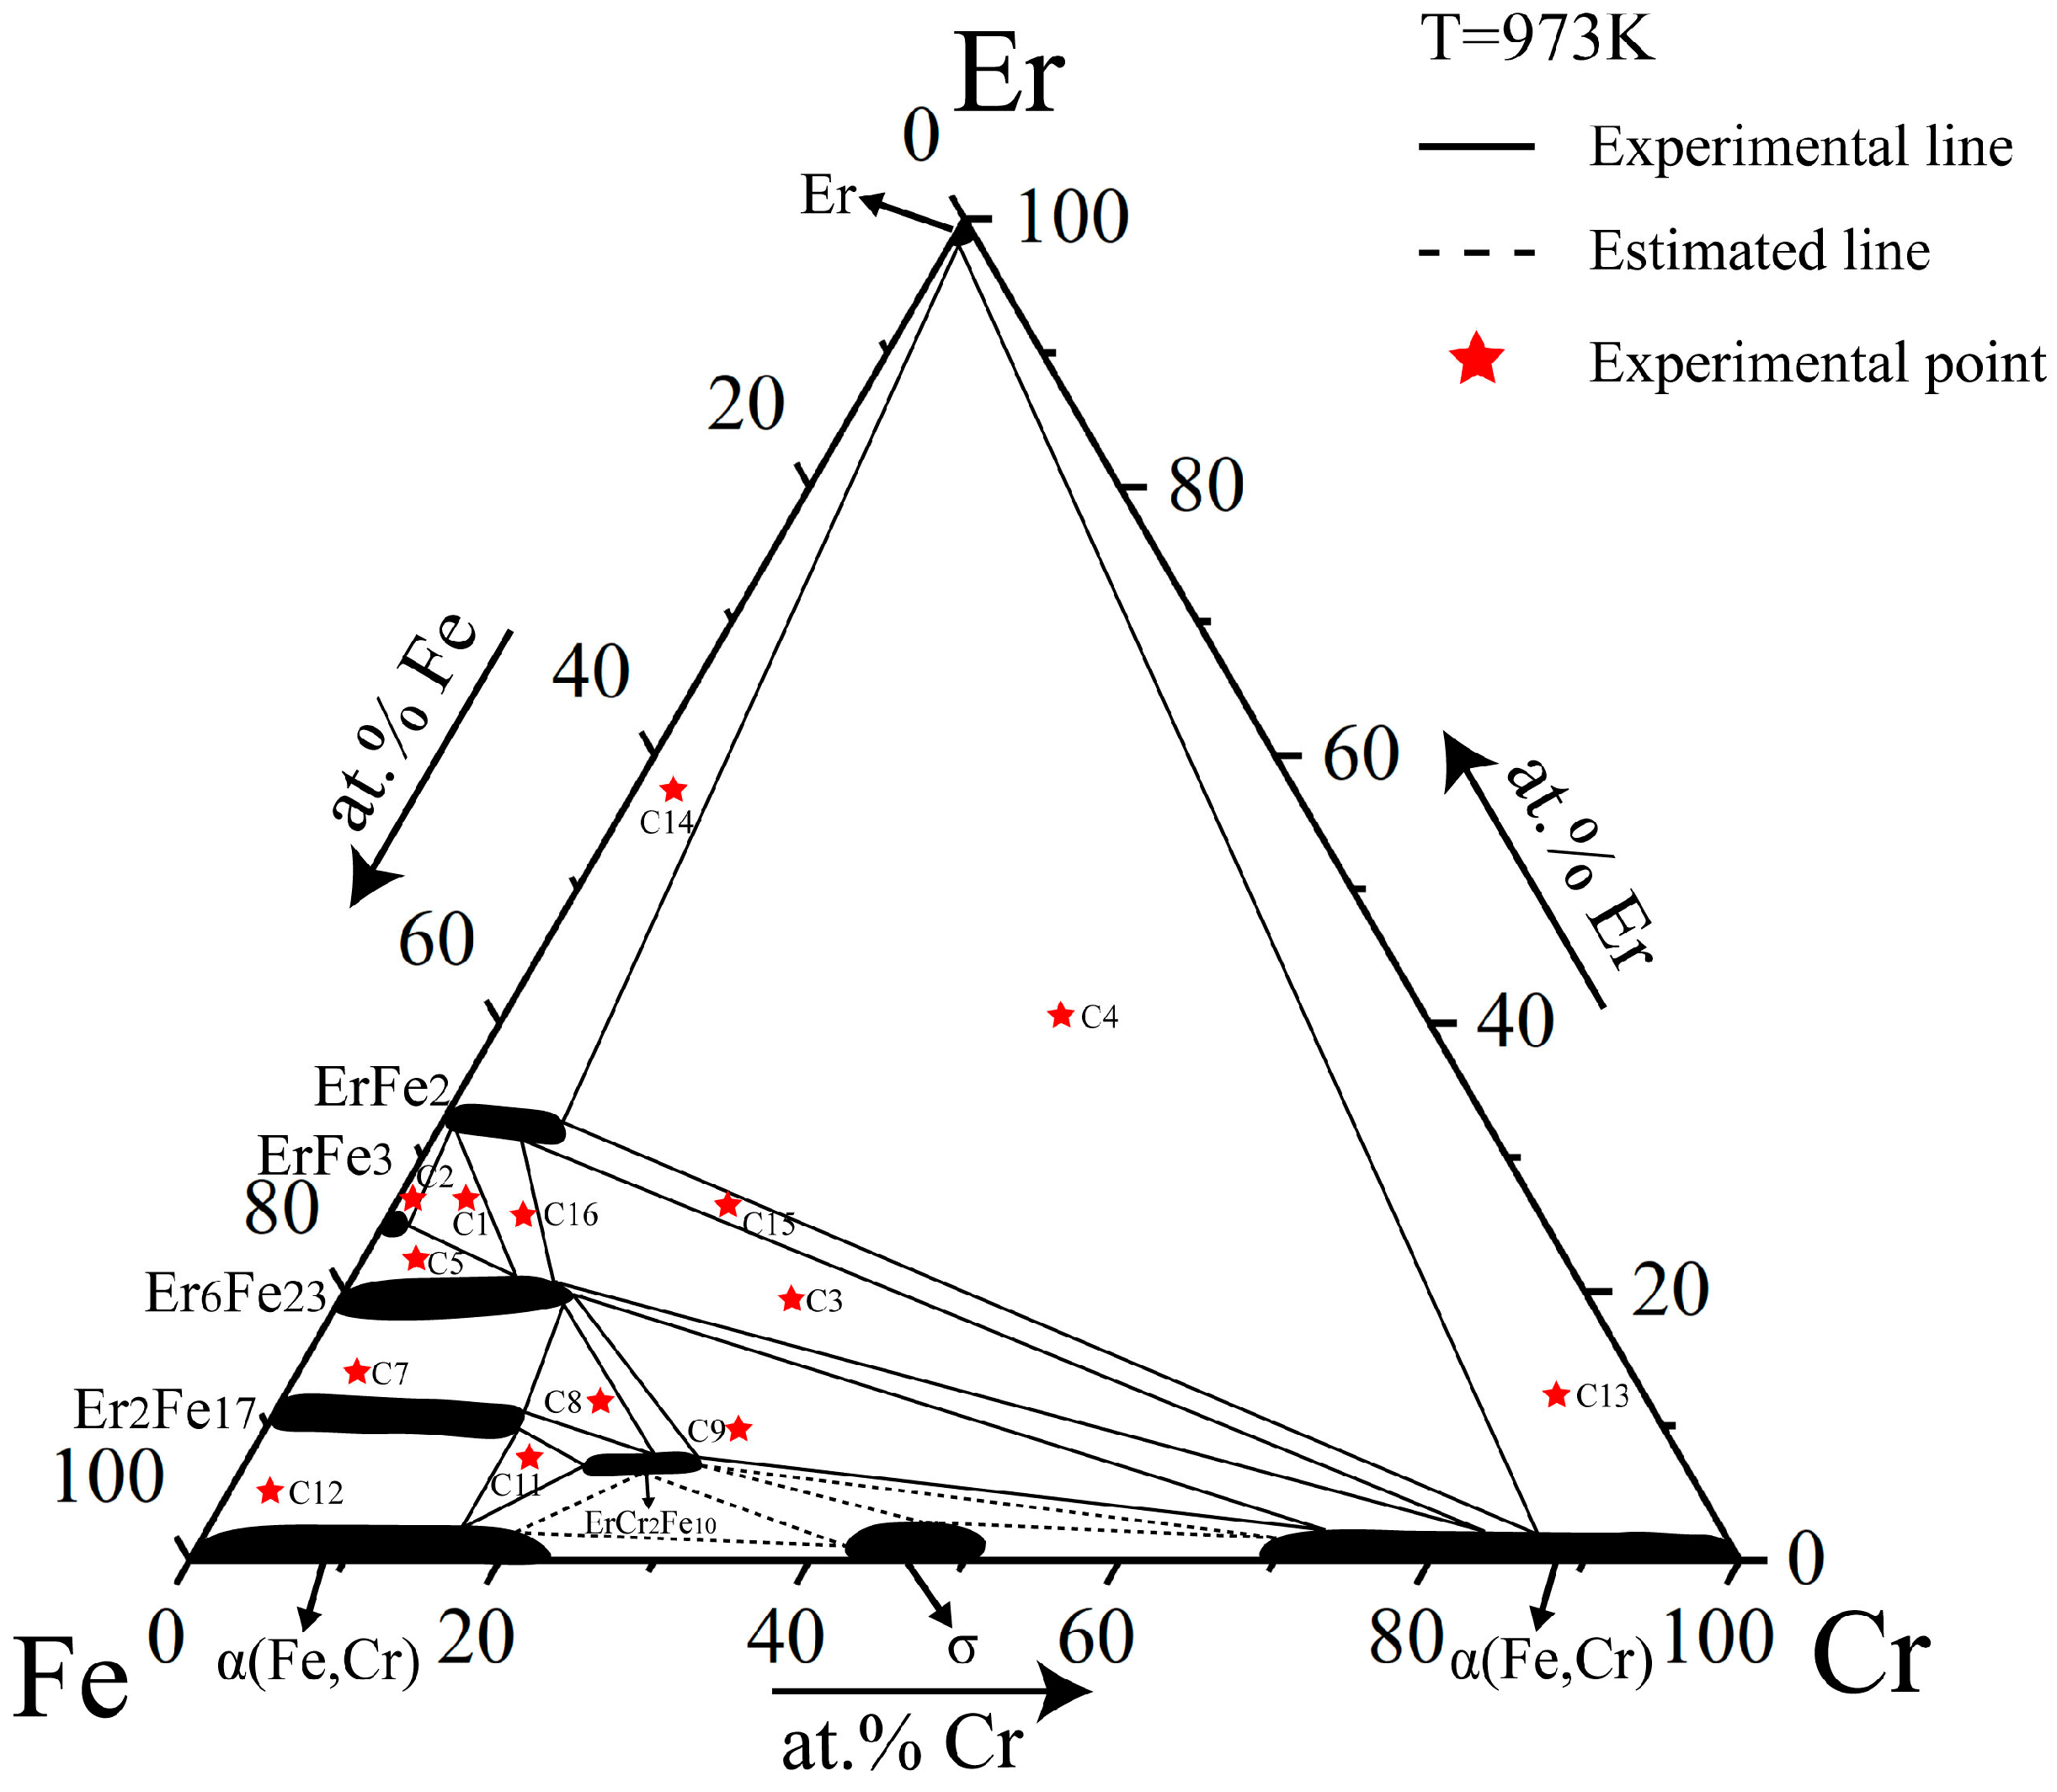
4.3. Phase Equilibria at 973 K

Thirteen alloy samples were prepared to determine the isothermal section and phase relationships of the Fe–Cr–Er ternary system at 973 K. The constituent phases of each alloy sample are listed in Table 4.
There are three obvious contrasts in the BSE images of alloy samples C4 and C8, as shown in Figure 14a,c. By comparing standard PDF cards and the characteristic peaks in Figure 14b,d, C4 and C8 belong to the three-phase equilibria ErFe2 + Er + α(Fe,Cr) and Er2Fe17 + Er6Fe23 + ErCr2Fe10, respectively. By analyzing WDS data, the maximum solid solubilities of Cr in ErFe2 and Er2Fe17 were 7.50 at.% and 16.23 at.%, respectively. The solubility of Cr in Fe–Er binary compounds was significantly reduced compared with that at 1073 K and 1273 K.
There are three obvious contrasts in the BSE images of alloy samples C9 and C11, as shown in Figure 15a,c. By comparing standard PDF cards and the characteristic peaks in Figure 15b,d, C9 and C11 belong to three-phase equilibrium ErFe2 + Er + α(Fe,Cr) and Er2Fe17 + Er6Fe23 + ErCr2Fe10, respectively. By analyzing WDS data obtained, the maximum solid solubilities of Cr in ErFe2 and Er2Fe17 were 7.50 at.% and 16.23 at.%, respectively. The solubility of Cr in Fe–Er binary compounds is significantly reduced compared with that at 1073 K and 1273 K.

5. Conclusions

In this work, the phase relationships of the Fe–Cr–Er ternary system at 1273 K, 1073 K, and 973 K results were systematically studied by combining data from WDS, XRD, and SEM measurements. There are nine single-phase regions, 16 two-phase regions, and eight three-phase regions at 973 K and 1073 K. At 1273 K, the σ phase disappeared, and liquid appeared. Phase equilibrium relationships are similar in the different isothermal sections studied in this work. Although the solid solubility of Fe–Er binary compounds is not completely consistent with the marginal binary phase diagram due to the influence of Cr, the phase relationship is basically similar. The maximum solid solubilities of Cr in ErFe2, ErFe3, Er6Fe23, and Er2Fe17 were 15.19 at.%, 2.47 at.%, 18.67 at.%, and 18.89 at.% at 1273 K, respectively. These values reduced to 10.70 at.%, 1.81 at.%, 14.85 at.%, and 17.77 at.% at 1073 K and continued to decrease to 8.12 at.%, 1.79 at.%, 14.33 at.%, and 16.23 at.% at 973 K, respectively. ErCr2Fe10 existed in all three isothermal sections, from which it can be determined that it forms a stable ternary compound from 973 K to 1273 K. At 1273 K, Cr had the strongest solubility in ErCr2Fe10, and the solid solubility ranged from Fe10.2Cr1.8Er to Fe7.5Cr4.5Er. Accurate determination of solubility range can help to analyze the existence and movement behavior of elements in phases. These isothermal sections at 1273 K, 1073 K, and 973 K provide the possibility of obtaining a thermodynamic description using the CALPHAD (CALculation of PHAse Diagrams) method. Thermodynamic optimization can calculate the phase relationship of the system at any temperature, combine the physical, chemical, and mechanical properties of the phase, and guide alloy composition design in actual production to obtain a desired material.

Author Contributions

Conceptualization, L.Z. and C.L.; methodology, Y.N.; software, R.Y.; validation, J.Y.; formal analysis, C.L. and L.Y.; investigation, C.L. and Y.N.; resources, J.Y. and R.Y.; data curation, Y.N.; writing—original draft preparation, C.L.; writing—review and editing, C.L.; visualization, L.L.; supervision, L.Z.; project administration, L.Z.; funding acquisition, L.Z. All authors have read and agreed to the published version of the manuscript.

Funding

The work was financially supported by the National MCF Energy R&D Program of China (no. 2018YFE0306100), the National Natural Science Foundation of China (no. 51871248), and the Natural Science Foundation of Hunan Province, China (no. 2020JJ4739).

Institutional Review Board Statement

Not applicable.

Informed Consent Statement

Not applicable.

Data Availability Statement

Not applicable.

Acknowledgments

The authors appreciate Kathryn Sole, from Liwen Bianji (Edanz) (www.liwenbianji.cn (accessed on 3 February 2023)) for linguistic assistance during the preparation of this manuscript. The authors would be thankful to BASF Shanshan Battery Materials Co., Ltd. for the help of XRD analysis.

Conflicts of Interest

The authors declare no conflict of interest.

References

  1. Svoboda, J.; Bořil, P.; Holzer, J. Substantial Improvement of High Temperature Strength of New-Generation Nano-Oxide-Strengthened Alloys by Addition of Metallic Yttrium. Materials 2022, 15, 504. [Google Scholar] [PubMed]
  2. Sun, Y.; Lin, N.; Zhang, W.; Zhang, Y.; Li, Z.; Han, X.; Wu, Z.; Wang, Z.; Ma, C. Microstructure and properties of Al-doped ODS steels prepared by wet-milling and SPS methods. J. Cent. South Univ. 2021, 28, 1219–1232. [Google Scholar]
  3. Berthod, P.; Himeur, Z. Experimental and thermodynamic investigations regarding the effect of chromium on the carbides population in cast {Ni (bal.)-0.4 C-6Ta-xCr} alloys with x varying from 0 to 50 wt%. Calphad 2018, 62, 30–41. [Google Scholar] [CrossRef]
  4. Yu, H.-Q.; Wang, S.-L.; Zhang, Y.-F.; Liu, Q.; Diao, S.-Z.; Liu, P.-P.; Oono, N.-H.; Ukai, S.; Wan, F.-R.; Ohnuki, S.; et al. Response of nanoclusters to heavy-ion irradiation in an Fe-12Cr ODS steel. Fusion Eng. Des. 2021, 172, 112759. [Google Scholar]
  5. Li, Y.; Zhang, L.; Long, D.; Yue, L.; Li, H. The Precipitated Particle Refinement in High-Cr ODS Steels by Microalloying Element Addition. Materials 2021, 14, 7767. [Google Scholar] [PubMed]
  6. Ukai, S.; Kato, S.; Furukawa, T.; Ohtsuka, S. High-temperature creep deformation in FeCrAl-oxide dispersion strengthened alloy cladding. Mater. Sci. Eng. A-Struct. Mater. Prop. Microstruct. Process. 2020, 794, 139863. [Google Scholar]
  7. Xu, L.; Shi, X.; Xia, D.; Huang, D.; Tang, H. Experimental investigation and thermodynamic assessment of the Al–Er system. Calphad 2022, 79, 102482. [Google Scholar]
  8. Zeng, L.; Liu, L.; Huang, S.; Zhang, L. Experimental investigation of phase equilibria in the Ti-Fe-Cr ternary system. Calphad-Comput. Coupling Phase Diagr. Thermochem. 2017, 58, 58–69. [Google Scholar]
  9. Liu, Z.; Chen, J.; Liu, W.; Liu, H.; Du, P.; Zhang, R. Recrystallization and texture evolution of cold-rolled FeCrAl thin-wall tube with large Laves phase during annealing: Effect of Nb content. J. Cent. South Univ. 2021, 28, 2612–2627. [Google Scholar]
  10. Ren, J.; Yu, L.; Liu, C. Effects of Al addition on high temperature oxidation behavior of 16Cr ODS steel. Corros. Sci. 2022, 195, 110008. [Google Scholar]
  11. Ren, J.; Yu, L.; Liu, C. Creep properties, microstructural evolution, and fracture mechanism of an Al added high Cr ODS steel during creep deformation at 600 °C. J. Nucl. Mater. 2022, 558, 153376. [Google Scholar]
  12. Li, C.; Song, Q.; Yang, X.; Wei, Y.; Hu, Q.; Liu, L. Experimental Investigation of the Phase Relations in the Fe-Zr-Y Ternary System. Materials 2022, 15, 593. [Google Scholar] [PubMed]
  13. Leal, L.R.F.; Milani, R.; Oliveira, D.M.; Guerra, Y.; Padron-Hernandez, E.; Franco, A., Jr.; Viana, B.C.; Santos, F.E.P.; Pena-Garcia, R. Competitive effect of dopants on magnetic and structural properties in yttrium iron garnet co-doped with Er and Cr. Ceram. Int. 2020, 46, 18584–18591. [Google Scholar]
  14. Khedr, D.M.S.; Aly, H.; Shabara, R.M.; Yehia, S. A molecular-field study on the magnetocaloric effect in Er2Fe17. J. Magn. Magn. Mater. 2019, 475, 436–444. [Google Scholar] [CrossRef]
  15. Hu, F.; Yuan, C.; Luo, Q.; Yang, W.; Shen, B. Effects of heavy rare-earth addition on glass-forming ability, thermal, magnetic, and mechanical properties of Fe-RE-B-Nb (RE = Dy, Ho, Er or Tm) bulk metallic glass. J. Non-Cryst. Solids 2019, 525, 119681. [Google Scholar]
  16. Lin, K.; Li, W.; Yu, C.; Jiang, S.; Cao, Y.; Li, Q.; Chen, J.; Zhang, M.; Xia, M.; Chen, Y.; et al. High performance and low thermal expansion in Er-Fe-V-Mo dual-phase alloys. Acta Mater. 2020, 198, 271–280. [Google Scholar]
  17. Zheng, L.H.; Zhang, L.; Zhao, F.Y.; Liu, L.B.; Wang, D.; Wu, C.J. Phase Equilibria of the Al-Co-Er System at 400 °C and 600 °C. J. Min. Metall. Sect. B-Metall. 2021, 57, 359–370. [Google Scholar] [CrossRef]
  18. Zhao, F.; Zhang, L.; Wang, H.; Liu, L. Phase equilibria investigation of the Al-Ni-Er ternary system at 600 °C and 700 °C. Calphad-Comput. Coupling Phase Diagr. Thermochem. 2021, 75, 102353. [Google Scholar] [CrossRef]
  19. Deng, Z.; Hu, Q.; Tian, Y.; Xue, R.; Zhang, L.; Liu, L. Experimental investigation and thermodynamic assessment of the Al–Ag–Sc system. J. Alloys Compd. 2023, 934, 167980. [Google Scholar] [CrossRef]
  20. Yadav, K.; Kaur, G.; Sharma, M.K.; Mukherjee, K. Magnetocaloric effect and spin-phonon correlations in RFe0.5Cr0.5O3 (R = Er and Yb) compounds. Phys. Lett. A 2020, 384, 126638. [Google Scholar] [CrossRef]
  21. Miao, H.T.; Zhang, L.G.; Wang, H.; Liu, L.B. Experimental investigation and thermodynamic optimization of the Al-Ni-Sc ternar system. Calphad-Comput. Coupling Phase Diagr. Thermochem. 2022, 79, 102397. [Google Scholar] [CrossRef]
  22. Dovbenko, O.; Dreval, L.; Du, Y.; Liu, Y.; Liu, S.; Iljenko, S.; Effenberg, G. Critical evaluation of ternary phase diagram data: Important considerations in the scrutiny of the correctness, coherence, and interpretation. Calphad-Comput. Coupling Phase Diagr. Thermochem. 2020, 68, 101719. [Google Scholar]
  23. Liu, W.; Chen, C.; Tang, Y.; Long, Q.; Wei, S.; Zhang, G.; Mao, F.; Jiang, Q.; Zhang, T.; Liu, M. Thermodynamic evaluation and investigation of solidification microstructure in the Fe-Cr-Ni-C system. Calphad-Comput. Coupling Phase Diagr. Thermochem. 2020, 69, 101763. [Google Scholar]
  24. Zhang, L.G.; Song, Q.; Tan, M.Y.; Jiang, Y.; Liu, L.B. Phase Equilibria of Bi-Te-RE (Yb, Nd, Sm, Er, Tb) ternary systems at 673K. J. Min. Metall. Sect. B Metall. 2022, 58, 229–242. [Google Scholar]
  25. Fartushna, I.; Mardani, M.; Khvan, A.; Cheverikin, V.; Kondratiev, A. Experimental investigation of phase equilibria in the Co-Fe-La system at 600 and 500 °C. Calphad-Comput. Coupling Phase Diagr. Thermochem. 2020, 70, 101794. [Google Scholar]
  26. Li, C.; Guo, H.; Zheng, L.; Yang, J.; Ye, L.; Liu, L.; Zhang, L. Phase Equilibria of the Ti-Nb-Mn Ternary System at 1173K, 1273K and 1373K. Processes 2023, 11, 424. [Google Scholar]
  27. Pan, S.; Liu, X.; Cheng, L.; Wang, X.; Rao, G.; Yao, Q.; Zhou, H. Phase equilibria at 773 K and microwave absorbing properties of Er-Fe-Cr alloys. J. Alloys Compd. 2014, 605, 164–167. [Google Scholar] [CrossRef]
  28. Zubar, T.I.; Sharko, S.A.; Tishkevich, D.I.; Kovaleva, N.N.; Trukhanov, S.V.; Trukhanov, A.V. Anomalies in Ni-Fe nanogranular films growth. J. Alloys Compd. 2018, 748, 970–978. [Google Scholar] [CrossRef]
  29. Sharko, S.A.; Serokurova, A.I.; Zubar, T.I.; Trukhanov, S.V.; Fedosyuk, V.M.; Trukhanov, A.V. Multilayer spin-valve CoFeP/Cu nanowires with giant magnetoresistance. J. Alloys Compd. 2020, 846, 156474. [Google Scholar]
  30. Deng, Z.; Xu, K.; Tian, Y.; Zhang, L.; Liu, L. Experimental investigation and thermodynamic re-assessment of the Ti–Zn system and atomic mobility of its bcc phase. Calphad-Comput. Coupling Phase Diagr. Thermochem. 2022, 76, 102392. [Google Scholar]
  31. Jacob, A.; Povoden-Karadeniz, E.; Kozeschnik, E. Revised thermodynamic description of the Fe-Cr system based on an improved sublattice model of the sigma phase. Calphad-Comput. Coupling Phase Diagr. Thermochem. 2018, 60, 16–28. [Google Scholar]
  32. Houserova, J.; Friak, M.; Sob, M.; Vrest’al, J. Ab initio calculations of lattice stability of sigma-phase and phase diagram in the Cr-Fe system. Comput. Mater. Sci. 2002, 25, 562–569. [Google Scholar] [CrossRef]
  33. Tomiska, J. The system Fe-Ni-Cr: Revision of the thermodynamic description. J. Alloys Compd. 2004, 379, 176–187. [Google Scholar]
  34. Byeong-Joo, L. Revision of thermodynamic descriptions of the Fe-Cr & Fe-Ni liquid phases. Calphad 1993, 17, 251–268. [Google Scholar]
  35. Menezes, L.; Roros, J.; Read, T. The Tetragonality of the Sigma Phase in the Iron-Chromium System. J. Iron Steel Inst. Jpn. 1950, 148, 217. [Google Scholar]
  36. Bergman, B.G.; Shoemaker, D.-P. The Space Group of the σ-FeCr Crystal Structure. J. Chem. Phys. 1951, 19, 515. [Google Scholar] [CrossRef]
  37. Andersson, J.O.; Sundman, B. Thermodynamic properties of the Cr-Fe system. Calphad 1987, 11, 83–92. [Google Scholar] [CrossRef]
  38. Xiong, W.; Selleby, M.; Chen, Q.; Odqvist, J.; Du, Y. Phase Equilibria and Thermodynamic Properties in the Fe-Cr System. Crit. Rev. Solid State Mater. Sci. 2010, 35, 125–152. [Google Scholar]
  39. Meyer, A. Das system Erbium-Eisen. J. Less Common Met. 1969, 18, 41–48. [Google Scholar] [CrossRef]
  40. Buschow, K.H.J.; Goot, A.S.V.D. Phase Relations, Crystal Structures, and Magnetic Properties of Erbium—Iron Compounds. Phys. Status Solidi A-Appl. Mater. Sci. 2010, 35, 515–522. [Google Scholar]
  41. Niessen, A.K.; de Boer, F.-R.; Boom, R.; de Châtel, P.-F.; Mattens, W.C.M.; Miedema, A.R. Model predictions for the enthalpy of formation of transition metal alloys II. Calphad 1983, 7, 51–70. [Google Scholar] [CrossRef]
  42. Zhou, G.J.; Liu, Z.W.; Zeng, D.C.; Jin, Z.P. Thermodynamic assessment of the Fe–Er system. Phys. B Condens. Matter 2010, 405, 3590–3593. [Google Scholar]
  43. Ray, S.; Neumann, J.P. Calculation of the binary chromiun-lanthanide phase diagrams. J. Phase Equilibria 1996, 17, 179–185. [Google Scholar]
  44. Anagnostou, M.; Christides, C.; Niarchos, D. Nitrogenation of the RFe10Mo2 (R = rare earth) compounds with ThMn12 type structure. Solid State Commun. 1991, 78, 681–684. [Google Scholar]
  45. Kalogirou, O.; Sarafidis, C.; Gjoka, M.; Litsardakis, G. Effects of Co substitution on structural and magnetic properties of R3(Fe1−xCox)29−yVy (R = Tb, Dy). J. Magn. Magn. Mater. 2002, 247, 34–41. [Google Scholar]
  46. Stefański, P.; Kowalczyk, A.; Wrzeciono, A. Structural and magnetic properties of RFe10Cr2 compounds. J. Magn. Magn. Mater. 1989, 81, 155–158. [Google Scholar] [CrossRef]
  47. Bara, J.-J.; Bogacz, B.-F.; Pędziwiatr, A.-T.; Stefański, P.; Szlaferek, A.; Wrzeciono, A. Mössbauer spectral and magnetic investigations of RFe10Cr2 compounds (R=rare earth). J. Alloys Compd. 1998, 265, 70–76. [Google Scholar] [CrossRef]
  48. Luo, H.-Z.; Li, Y.-X.; Jia, L.; Meng, F.-B.; Qu, J.-P.; Shen, J.; Chen, N.-X.; Wu, G.-H.; Yang, F.-M. Structure and magnetic properties of Er3Fe29−xCrx compounds. J. Alloys Compd. 2005, 397, 31–36. [Google Scholar] [CrossRef]
Figure 1. The calculated Fe–Cr phase diagram based on the work of Jacob et al. [31].
Materials 16 01705 g001
Figure 2. The calculated Er-Fe phase diagram based on the work of Zhou et al. [42].
Materials 16 01705 g002
Figure 3. The calculated Cr–Er phase diagram based on the work of Ray et al. [43].
Materials 16 01705 g003
Figure 4. Isothermal section of Fe–Cr–Er ternary system at 773 K by Pan et al. [27].
Materials 16 01705 g004
Figure 5. Isothermal section of the Fe–Cr–Er ternary system at 1273 K determined in this work.
Materials 16 01705 g005
Figure 6. Isothermal section of the Fe–Cr–Er ternary system at 1073 K obtained in this work.
Materials 16 01705 g006
Figure 7. Isothermal section of the Fe–Cr–Er ternary system at 973 K obtained in this work.
Materials 16 01705 g007
Figure 8. (a) BSE image of alloy A2, (b) XRD result of alloy A2, (c) BSE image of alloy A7, (d) XRD result of alloy A7.
Materials 16 01705 g008
Figure 9. (a) BSE image of alloy A8, (b) XRD result of alloy A8, (c) BSE image of alloy A12, (d) XRD result of alloy A12.
Materials 16 01705 g009
Figure 10. (a) BSE image of alloy A13, (b) XRD result of alloy A13, (c) BSE image of alloy A16, (d) XRD result of alloy A16.
Materials 16 01705 g010
Figure 11. (a) BSE image of alloy B1, (b) XRD result of alloy B1, (c) BSE image of alloy B2, (d) XRD result of alloy B2.
Materials 16 01705 g011
Figure 12. (a) BSE image of alloy B8, (b) XRD result of alloy B8, (c) BSE image of alloy B11, (d) XRD result of alloy B11.
Materials 16 01705 g012
Figure 13. (a) BSE image of alloy B3, (b) XRD result of alloy B3, (c) BSE image of alloy B7, (d) XRD result of alloy B7.
Materials 16 01705 g013
Figure 14. (a) BSE image of alloy C4, (b) XRD result of alloy C4, (c) BSE image of alloy C8, (d) XRD result of alloy C8.
Materials 16 01705 g014
Figure 15. (a) BSE image of alloy C9, (b) XRD result of alloy C9, (c) BSE image of alloy C11, (d) XRD result of alloy C11.
Materials 16 01705 g015
Table 1. Experimental and literature data on crystal structures and lattice parameters of the solid phases in the Fe–Cr–Er system.
PhasePhase
Prototype
Space Group Lattice Parameters (nm) Reference
abc
αFecI2 Im 3 ¯ m 0.28620.28620.2862[1]
γFecF4 F m 3 ¯ m 0.36130.36130.3613[1]
CrcI2 Im 3 ¯ m 0.29100.29100.2910[2]
ErhP2P63/mmc0.35550.35550.5584[15]
σtP30P42/mmm0.88020.88020.4548[35]
ErFe2cF24 Fd 3 ¯ m 0.73160.73160.7316[39]
ErFe3hR36 R 3 ¯ m 0.50860.508624464[39]
Er6Fe23cF116 F m 3 ¯ m 1.19941.19941.1994[39]
Er2Fe17hP38P63/mmc0.84440.84440.8268[39]
ErCr2Fe10t/26I4/mmm0.85340.85340.4761[46]
Er3Cr12-xFexhP80P63/mmc0.84160.84160.8325[48]
Table 2. Constituent phases and compositions in the annealed Fe–Cr–Er alloys at 1273 K for 60 days.
Alloys
No.
Nominal Composition (at.%)Experimental Results (at.%)Phase
Determination
FeCrErFeCrEr
A14055546.9215.2637.82ErFe2
1.570.5597.88Er
A27052567.5611.7320.71Er6Fe23
73.81.7224.48ErFe3
63.443.5633ErFe2
A37022863.042.3534.61ErFe2
74.011.0724.92ErFe3
A465102557.8911.7230.39ErFe2
61.6716.8721.46Er6Fe23
A559113060.1510.0829.77ErFe2
A653252211.1586.072.78α(Fe,Cr)
62.157.8230.03ErFe2
A760202061.7218.3419.94Er6Fe23
61.896.9431.17ErFe2
21.5675.932.51α(Fe,Cr)
A820404052.5314.832.67ErFe2
1.214.4894.31Er
5.0392.032.94α(Fe,Cr)
A97082273.922.4724.61ErFe3
70.188.6921.13Er6Fe23
A1073101872.439.717.87Er6Fe23
A118051568.8610.1121.03Er6Fe23
85.613.3211.07Er2Fe17
A1268201264.22287.78ErCr2Fe10
69.8113.4616.73Er6Fe23
71.9518.329.73Er2Fe17
A135635966.7516.7516.5Er6Fe23
57.4334.997.58ErCr2Fe10
26.6371.082.29α(Fe,Cr)
A1465251067.7415.7616.5Er6Fe23
61.8130.867.33ErCr2Fe10
A158351284.164.6111.23Er2Fe17
A168510586.724.578.71Er2Fe17
78.1115.026.87ErCr2Fe10
8710.022.98γFe
A17932594.742.282.98γFe
88.782.288.94Er2Fe17
A187125468.3524.267.39ErCr2Fe10
80.0217.882.1α(Fe,Cr)
A1957271663.8818.2417.87Er6Fe23
23.6774.082.25α(Fe,Cr)
A2029262.8595.311.83α(Fe,Cr)
0.655.4193.94Er
Table 3. Constituent phases and compositions in the annealed Fe–Cr–Er alloys at 1073 K for 90 days.
Alloys
No.
Nominal Composition (at.%)Experimental Results (at.%)Phase
Determination
FeCrErFeCrEr
B17052564.613.4920.01Er6Fe23
73.261.8124.93ErFe3
65.651.0433.31ErFe2
B250302064.614.8520.55Er6Fe23
62.874.5432.59ErFe2
21.7175.742.55α(Fe,Cr)
B320404055.9610.4833.56ErFe2
1.422.4596Er
17.6680.112.23α(Fe,Cr)
B470201066.8225.098.09ErCr2Fe10
74.9315.229.85Er2Fe17
72.948.5618.5Er6Fe23
B57342372.436.3421.22Er6Fe23
74.371.4424.19ErFe3
B68051577.554.318.15Er6Fe23
82.914.212.89Er2Fe17
B768201266.425.717.89ErCr2Fe10
73.268.3518.39Er6Fe23
72.4317.779.8Er2Fe17
B85635966.314.1719.53Er6Fe23
61.1330.97.97ErCr2Fe10
22.6974.922.39α(Fe,Cr)
B967201368.8112.4518.75Er6Fe23
64.9327.277.8ErCr2Fe10
B108351284.254.6811.07Er2Fe17
B11905585.984.89.22Er2Fe17
77.0115.387.61ErCr2Fe10
91.435.712.85α(Fe,Cr)
B12932595.072.082.85α(Fe,Cr)
88.021.7810.2Er2Fe17
B137520572.0420.617.35ErCr2Fe10
76.2920.713α(Fe,Cr)
B14880127.9990.061.95α(Fe,Cr)
0.392.7396.87Er
B15482502.161.1296.72Er
61.053.1535.8ErFe2
Table 4. Constituent phases and compositions in the annealed Fe–Cr–Er alloys at 973 K for 90 days.
Alloys
No.
Nominal Composition (at.%)Experimental Results (at.%)Phase
Determination
FeCrErFeCrEr
C17052568.1311.0920.78Er6Fe23
72.922.2124.87ErFe3
67.081.0231.9ErFe2
C27212767.310.5132.18ErFe2
73.041.1125.86ErFe3
C350302066.1513.2120.64Er6Fe23
63.245.731.05ErFe2
15.3982.751.85α(Fe,Cr)
C425354059.157.533.35ErFe2
1.410.7797.82Er
12.2185.662.13α(Fe,Cr)
C57532274.321.6524.03ErFe3
75.573.6320.8Er6Fe23
C673101871.5910.8717.54Er6Fe23
C78051578.653.7817.56Er6Fe23
84.133.6412.22Er2Fe17
C868201272.8416.2210.94ErCr2Fe10
67.4613.7318.81Er6Fe23
73.4816.2310.28Er2Fe17
C960301067.0613.2819.66Er6Fe23
63.6228.647.74ErCr2Fe10
25.6772.322.01α(Fe,Cr)
C108351283.435.1911.38Er2Fe17
C117418873.9116.569.53Er2Fe17
71.1621.847ErCr2Fe10
80.7716.582.65α(Fe,Cr)
C12932594.92.712.39α(Fe,Cr)
88.511.939.55Er2Fe17
C13583126.6591.791.56α(Fe,Cr)
0.471.2998.24Er
Disclaimer/Publisher’s Note: The statements, opinions and data contained in all publications are solely those of the individual author(s) and contributor(s) and not of MDPI and/or the editor(s). MDPI and/or the editor(s) disclaim responsibility for any injury to people or property resulting from any ideas, methods, instructions or products referred to in the content.

