
Fabrication of Al-Ni Alloys for Fast Hydrogen Production from Hydrolysis in Alkaline Water

Abstract
:1. Introduction
2. Experimental
3. Results and Discussion
4. Conclusions
Author Contributions
Funding
Institutional Review Board Statement
Informed Consent Statement
Data Availability Statement
Conflicts of Interest
References
- Dunn, S. Hydrogen futures: Toward a sustainable energy system. Int. J. Hydrogen Energy 2002, 27, 235–264. [Google Scholar] [CrossRef]
- Pivovar, B.; Rustagi, N.; Satyapal, S. Hydrogen at Scale (H2@ Scale): Key to a Clean, Economic, and Sustainable Energy System. Electrochem. Soc. Interface 2018, 27, 47. [Google Scholar] [CrossRef]
- Anzelmo, B.; Wilcox, J.; Liguori, S. Natural gas steam reforming reaction at low temperature and pressure conditions for hydrogen production via Pd/PSS membrane reactor. J. Membr. Sci. 2017, 522, 343–350. [Google Scholar] [CrossRef]
- Wang, L.; Li, Z.; Zhang, Y.; Zhang, T.; Xie, G. Hydrogen generation from alkaline NaBH4 solution using electroless-deposited Co-Ni-W-P/g-Al2O3 as catalysts. J. Alloys Compd. 2017, 702, 649–658. [Google Scholar] [CrossRef]
- Keçebaş, A.; Kayfeci, M.; Bayat, M. Electrochemical hydrogen generation. In Solar Hydrogen Production: Processes, Systems and Technologies; Academic Press: Cambridge, MA, USA, 2019; pp. 299–317. [Google Scholar]
- Cheng, X.; Tong, Y. Interface coupling of cobalt hydroxide/molybdenum disulfide heterostructured nanosheet arrays for highly efficient hydrazine-assisted hydrogen generation. ACS Sustain. Chem. Eng. 2023, 11, 3219–3227. [Google Scholar] [CrossRef]
- Wang, H.; Zhou, L.; Han, M.; Tao, Z.; Cheng, F.; Chen, J. CuCo nanoparticles supported on hierarchically porous carbon as catalysts for hydrolysis of ammonia borane. J. Alloys Compd. 2015, 651, 382–388. [Google Scholar] [CrossRef]
- Gray, H.R.; Nelson, H.G.; Johnson, R.E.; McPherson, W.B.; Howard, F.S.; Swisher, J.H. Potential Structural Material Problems in a Hydrogen Energy System. Int. J. Hydrogen Energy 1978, 3, 105–118. [Google Scholar] [CrossRef]
- Sanz-Moral, L.; Navarrete, A.; Sturm, G.; Link, G.; Rueda, M.; Stefanidis, G.; Martín, A. Release of hydrogen from nanoconfined hydrides by application of Microwaves. J. Power Sources 2017, 353, 131–137. [Google Scholar] [CrossRef]
- Cao, N.; Hu, K.; Luo, W.; Cheng, G. RuCu nanoparticles supported on graphene: A highly efficient catalyst for hydrolysis of ammonia borane. J. Alloys Compd. 2014, 590, 41–246. [Google Scholar] [CrossRef]
- Oh, S.; Song, D.; Kim, H.; Sohn, D.; Hong, K.; Lee, M.; Son, S.; Cho, E.; Kwon, H. Cobalt-iron-phosphorus catalysts for efficient hydrogen generation from hydrolysis of ammonia borane solution. J. Alloys Compd. 2019, 806, 643–649. [Google Scholar] [CrossRef]
- Oh, S.; Kim, M.; Eom, K.; Kyung, J.; Kim, D.; Cho, E.; Kwon, H. Design of Mg-Ni alloys for fast hydrogen generation from seawater and their application in polymer electrolyte membrane fuel cells. Int. J. Hydrogen Energy 2016, 41, 5296–5303. [Google Scholar] [CrossRef]
- Oh, S.; Jo, T.; Kim, M.; Lim, J.; Eom, K.; Kim, D.; Cho, E.; Kwon, H. Fabrication of Mg-Ni-Sn alloys for fast hydrogen generation in seawater. Int. J. Hydrogen Energy 2017, 42, 7761–7769. [Google Scholar] [CrossRef]
- Konno, C.; Cruz, C.; Costa, T.; Barros, A.; Goulart, P.; Garcia, A.; Cheung, N. Solidification microstructure-dependent hydrogen generation behavior of Al–Sn and Al–Fe alloys in alkaline medium. Int. J. Hydrogen Energy 2021, 46, 12654–12671. [Google Scholar] [CrossRef]
- Razavi-Tousi, S.S.; Szpunar, J.A. Effect of addition of water-soluble salts on the hydrogen generation of aluminum in reaction with hot water. J. Alloys Compd. 2016, 679, 364–374. [Google Scholar] [CrossRef]
- Jia, Y.; Shen, J.; Meng, H.; Dong, Y.; Chai, Y.; Wang, N. Hydrogen generation using a ball-milled Al/Ni/NaCl mixture. J. Alloys Compd. 2014, 588, 259–264. [Google Scholar] [CrossRef]
- Zou, H.; Chen, S.; Zhao, Z.; Lin, W. Hydrogen production by hydrolysis of aluminum. J. Alloys Compd. 2013, 578, 380–384. [Google Scholar] [CrossRef]
- Baniameriana, M.J.; Moradib, S.E. Al–Ga doped nanostructured carbon as a novel material for hydrogen production in water. J. Alloys Compd. 2011, 509, 6307–6310. [Google Scholar] [CrossRef]
- Dawood, F.; Anda, M.; Shafiullah, G.M. Hydrogen Production for Energy: An Overview. Int. J. Hydrogen Energy 2020, 45, 3847–3869. [Google Scholar] [CrossRef]
- Kalamaras, C.M.; Efstathiou, A.M. Hydrogen Production Technologies: Current State and Future Developments. Conf. Pap. Energy 2013, 2013, e690627. [Google Scholar] [CrossRef]
- Megía, P.J.; Vizcaíno, A.J.; Calles, J.A.; Carrero, A. Hydrogen Production Technologies: From Fossil Fuels toward Renewable Sources. A Mini Review. Energy Fuels 2021, 35, 16403–16415. [Google Scholar] [CrossRef]
- Zou, L.; Qiao, Y.; Gu, S.; Huang, Y.; Zhong, C.; Long, Z. Nano-porous Mo2C in-situ grafted on macroporous carbon electrode as an efficient 3D hydrogen evolution cathode. J. Alloys Compd. 2017, 712, 103–110. [Google Scholar] [CrossRef]
- Guo, P.; Wu, Y.; Lau, W.; Liu, H.; Liu, L. CoS nanosheet arrays grown on nickel foam as an excellent OER Catalyst. J. Alloys Compd. 2017, 723, 772–778. [Google Scholar] [CrossRef]
- Oh, S.; Kim, H.; Kwon, Y.; Kim, M.; Cho, E.; Kwon, H. Porous Co–P foam as an efficient bifunctional electrocatalyst for hydrogen and oxygen evolution reactions. J. Mater. Chem. A 2016, 4, 18272–18277. [Google Scholar] [CrossRef]
- Liu, S.; Tang, Y.; Guo, C.; Liu, Y.; Tang, Z. Heterostructure of NiFe@NiCr-LDH for Active and Durable Oxygen Evolution Reactions in Alkaline Media. Materials 2023, 16, 2968. [Google Scholar] [CrossRef] [PubMed]
- Wang, A.; Zhang, X.; Xu, H.J.; Gao, L.J.; Li, L.; Cao, R.; Hao, Q.Y. Engineering Cu/NiCu LDH Heterostructure Nanosheet Arrays for Highly-Efficient Water Oxidation. Materials 2023, 16, 3372. [Google Scholar] [CrossRef] [PubMed]
- Zabielaite, A.; Balciunaite, A.; Upskuviene, D.; Simkunaite, D.; Levinas, R.; Niaura, G.; Vaiciuniene, J.; Jasulaitiene, V.; Tamasauskaite-Tamasiunaite, L.; Norkus, E. Investigation of Hydrogen and Oxygen Evolution on Cobalt-Nanoparticles-Supported Graphitic Carbon Nitride. Materials 2023, 16, 5923. [Google Scholar] [CrossRef] [PubMed]
- Zhao, C.; Wei, F.; Lv, H.; Zhao, D.; Wang, N.; Li, L.; Li, N.; Wang, X. Fe(III) Ions-Assisted Aniline Polymerization Strategy to Nitrogen-Doped Carbon-Supported Bimetallic CoFeP Nanospheres as Efficient Bifunctional Electrocatalysts toward Overall Water Splitting. Materials 2021, 14, 1473. [Google Scholar] [CrossRef]
- Chen, T.W.; Kalimuthu, P.; Anushya, G.; Chen, S.M.; Ramachandran, R.; Mariyappan, V.; Muthumala, D.C. High-Efficiency of Bi-Functional-Based Perovskite Nanocomposite for Oxygen Evolution and Oxygen Reduction Reaction: An Overview. Materials 2021, 14, 2976. [Google Scholar] [CrossRef]
- Wang, H.; Leung, D.; Leung, M.; Ni, M. A review on hydrogen production using aluminum and aluminum alloys. Renew. Sustain. Energy Rev. 2009, 13, 845–853. [Google Scholar] [CrossRef]
- Uehara, K.; Takeshita, H.; Kotaka, H. Hydrogen gas generation in the wet cutting of aluminium and its alloys. J. Mater. Process. Technol. 2002, 127, 174–177. [Google Scholar] [CrossRef]
- American Society for Testing and Materials (ASTM) International. ASTM Standards and Engineering Digital Library; G 62; University of Southern California: Los Angeles, CA, USA, 2006. [Google Scholar]
- Jones, D. Principles and Prevention of Corrosion; Prentice Hall: Upper Saddle River, NJ, USA, 1996. [Google Scholar]
- Barik, R.C.; Wharton, J.A.; Wood, R.J.K.; Stokes, K.R. Galvanic corrosion of nickel–aluminium bronze coupled to titanium or Cu–15Ni alloy in brackish seawater. In Corrosion Behaviour and Protection of Copper and Aluminium Alloys in Seawater; Woodhead Publishing: Sawston, UK, 2007; Volume 49, pp. 128–141. [Google Scholar]
- Badawy, W.A.; Ismail, K.M.; Fathi, A.M. Effect of Ni content on the corrosion behavior of Cu–Ni alloys in neutral chloride solutions. Electrochim. Acta 2005, 50, 3603–3608. [Google Scholar] [CrossRef]


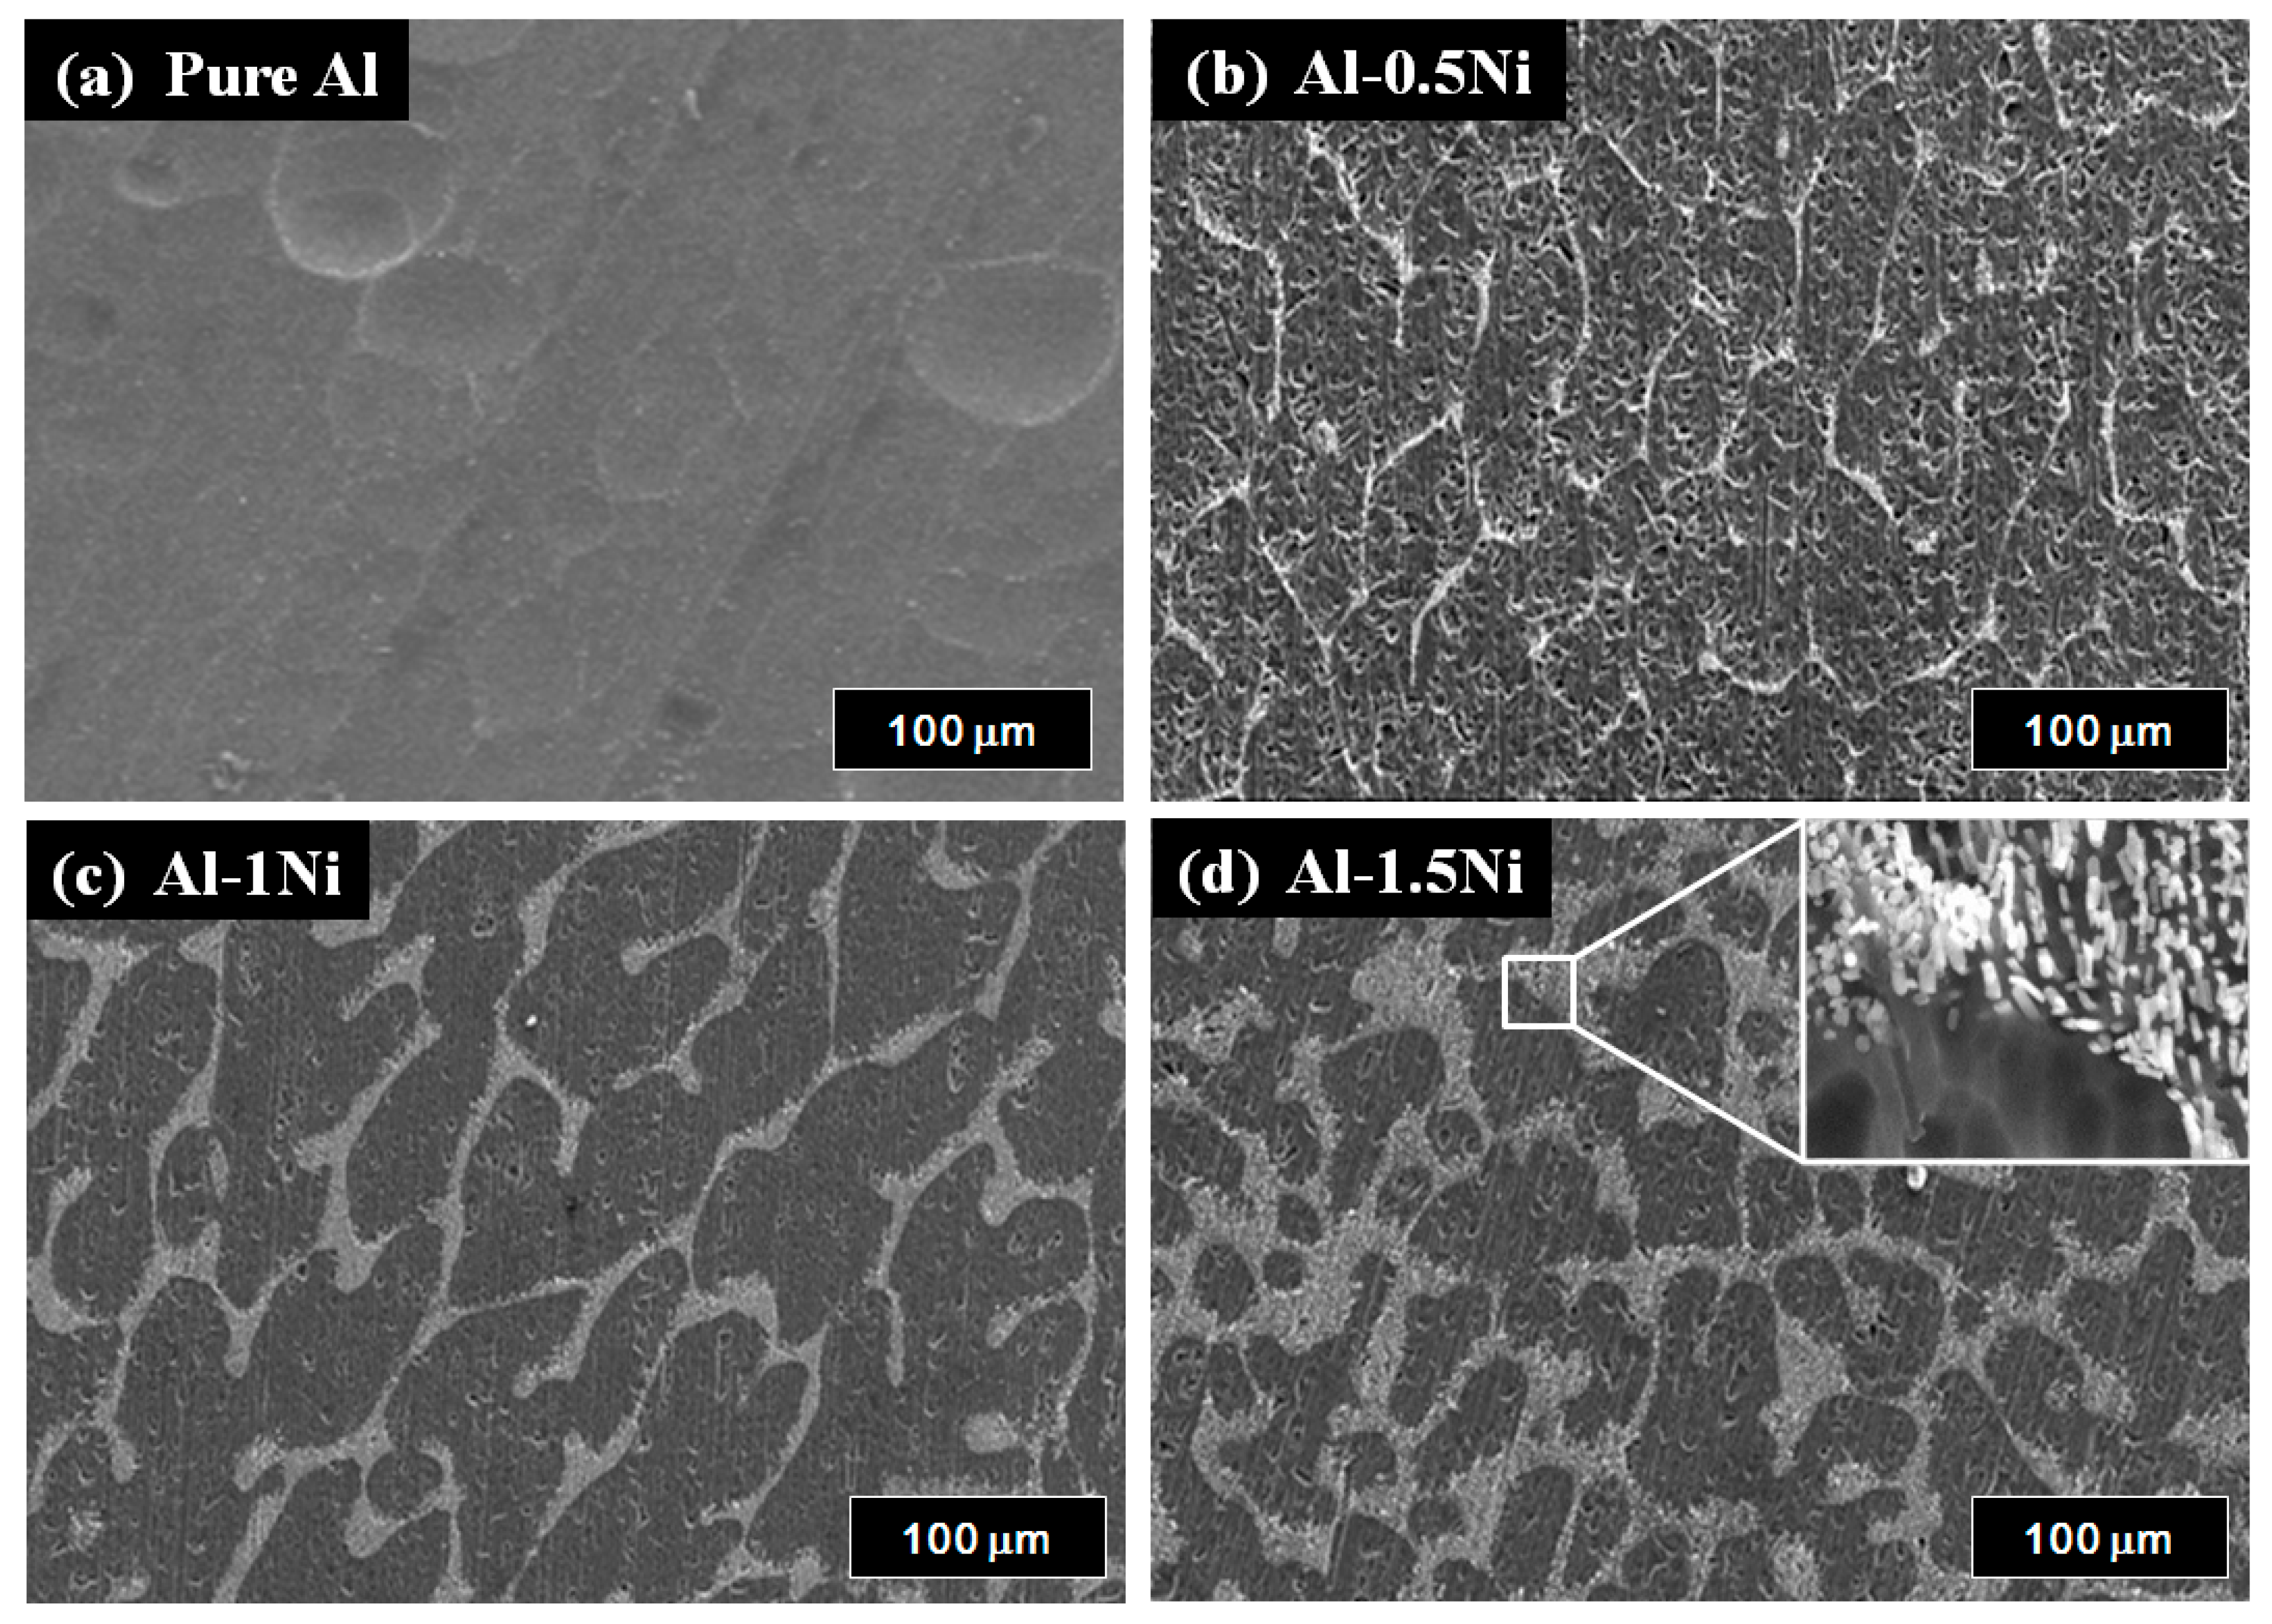
| Element | wt.% | at.% | |
|---|---|---|---|
| Bright region | Al | 89.39 | 93.78 |
| Ni | 12.61 | 6.22 | |
| Dark region | Al | 99.52 | 99.78 |
| Ni | 0.48 | 0.22 |
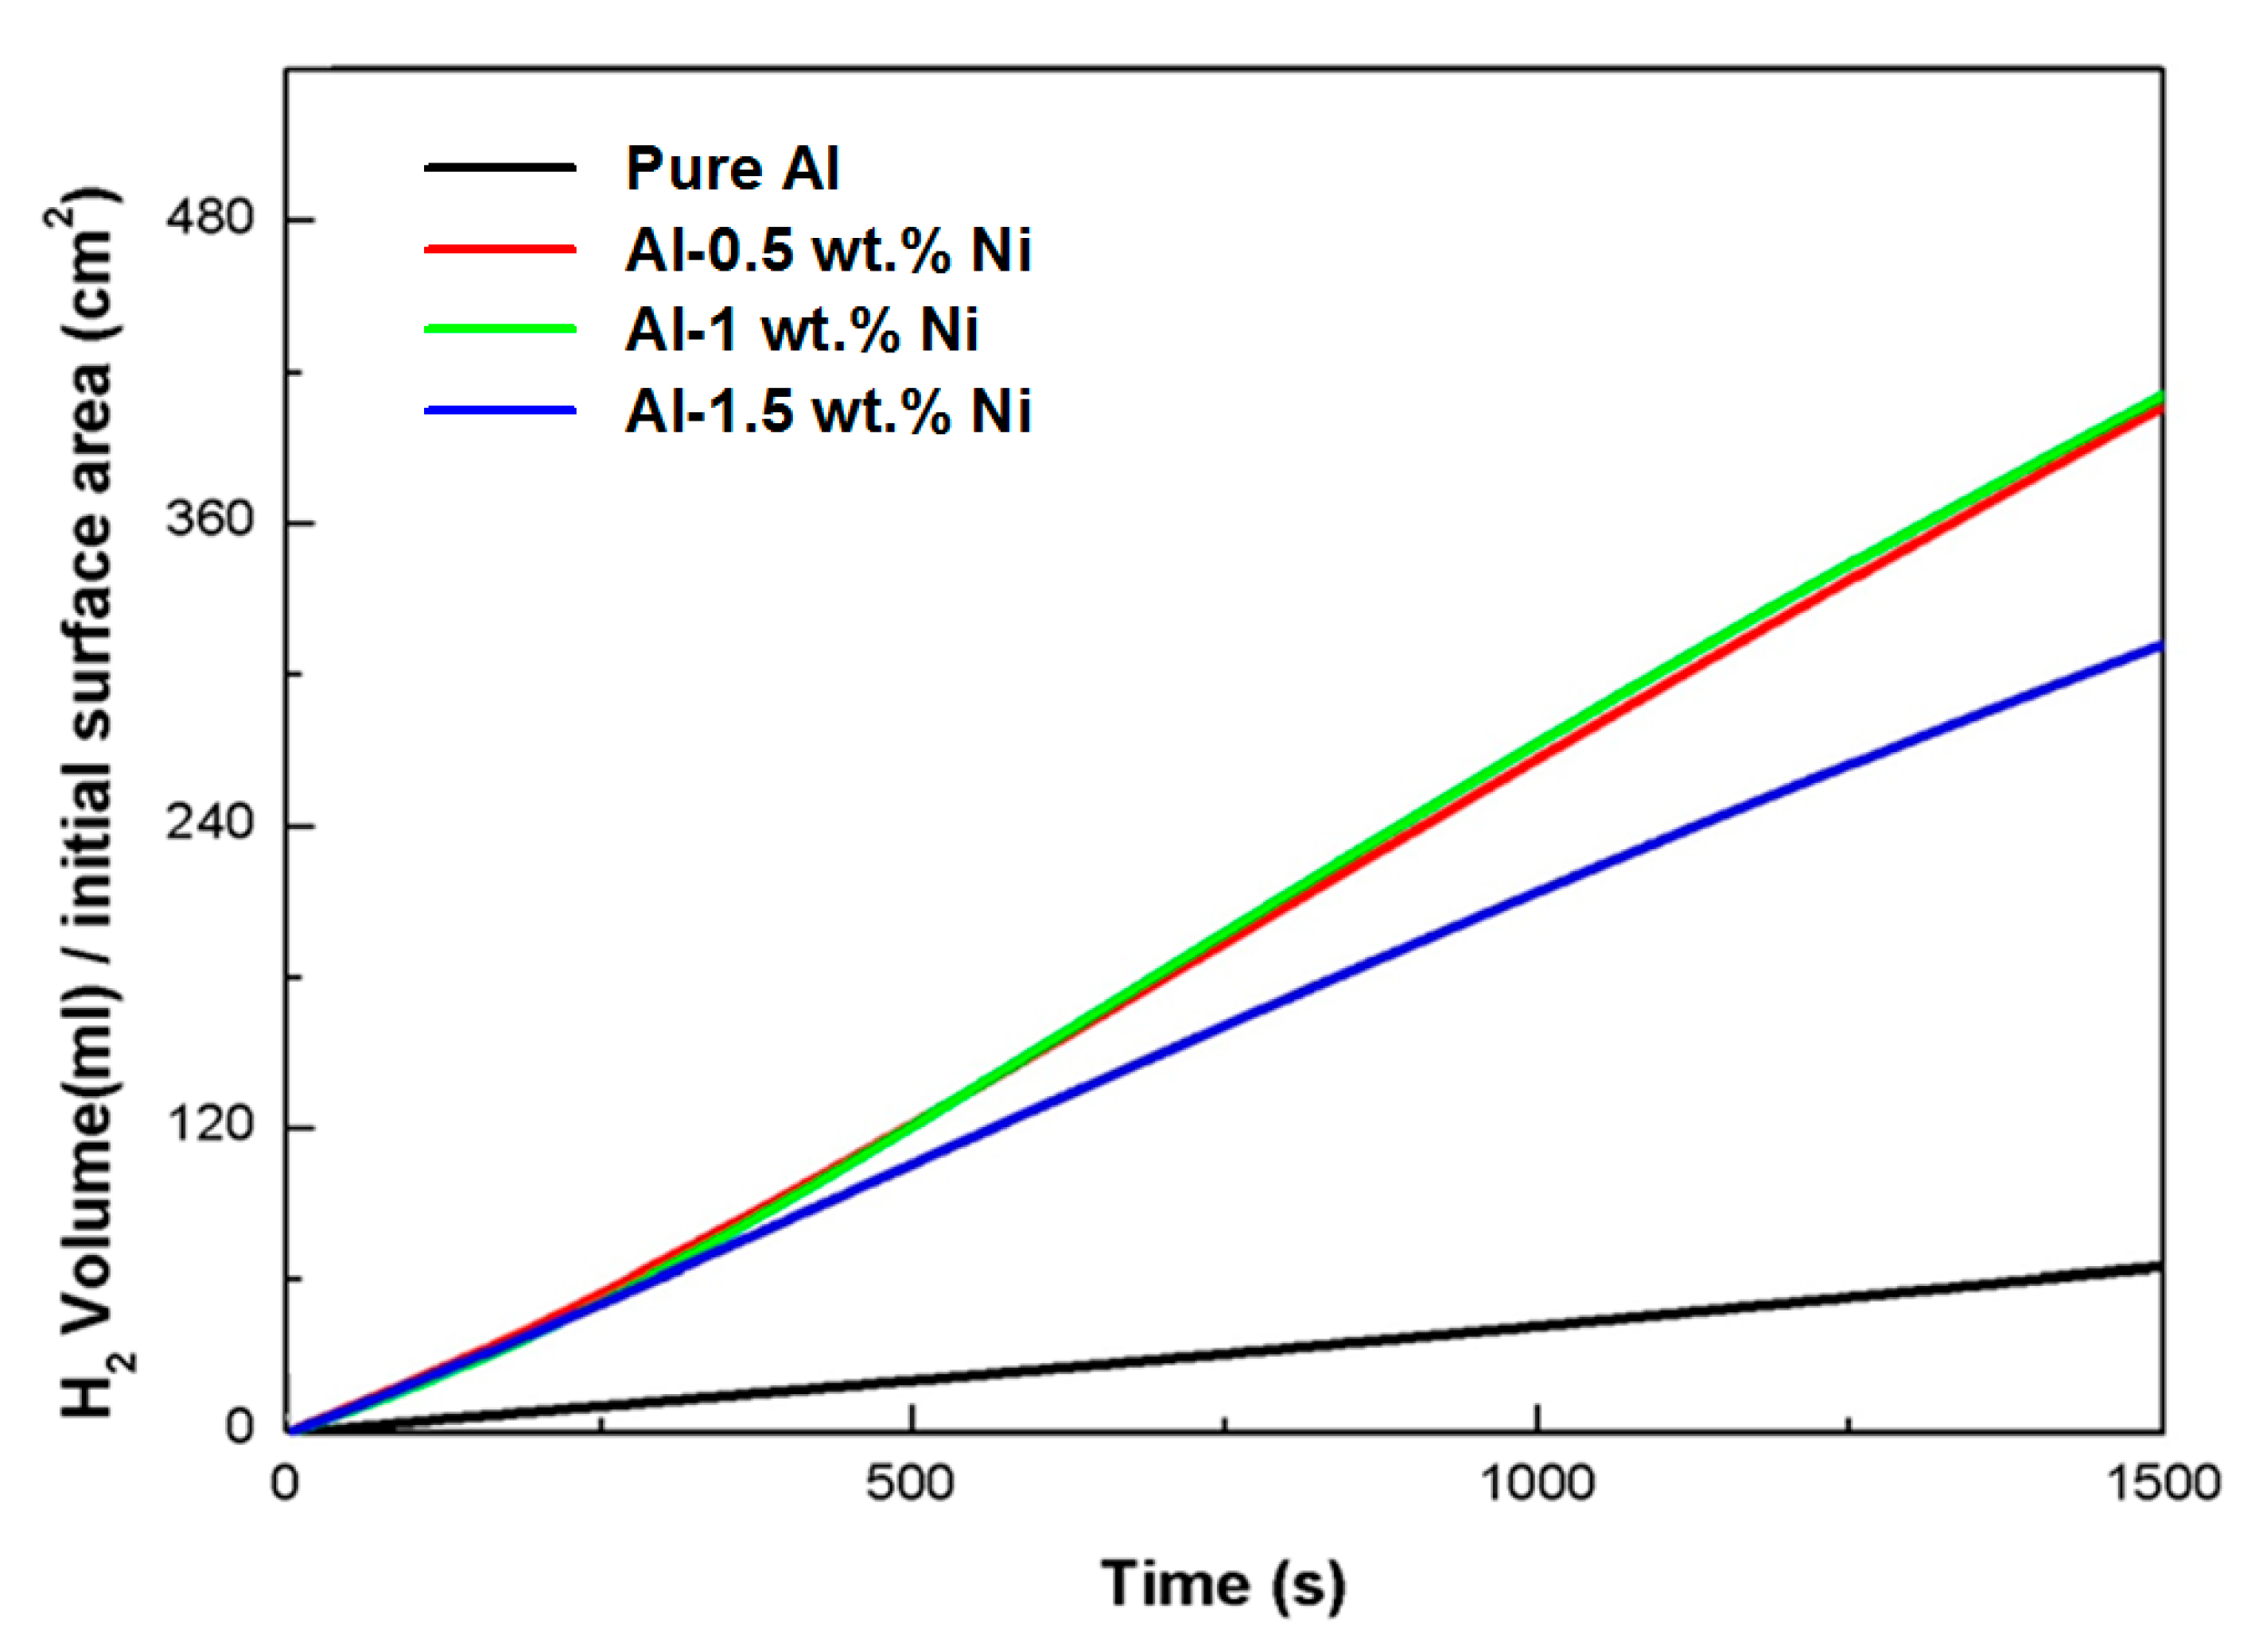
| Ni Content (wt.%) | Hydrogen Generation Rate (mL/cm2·min) |
|---|---|
| 0 | 2.58 |
| 0.5 | 16.60 |
| 1 | 16.64 |
| 1.5 | 12.54 |
| Ecorr (V) | icorr (mA/cm2) | |
|---|---|---|
| Al | −1.88 | 1.94 |
| Al3Ni | −1.19 | 1.17 |
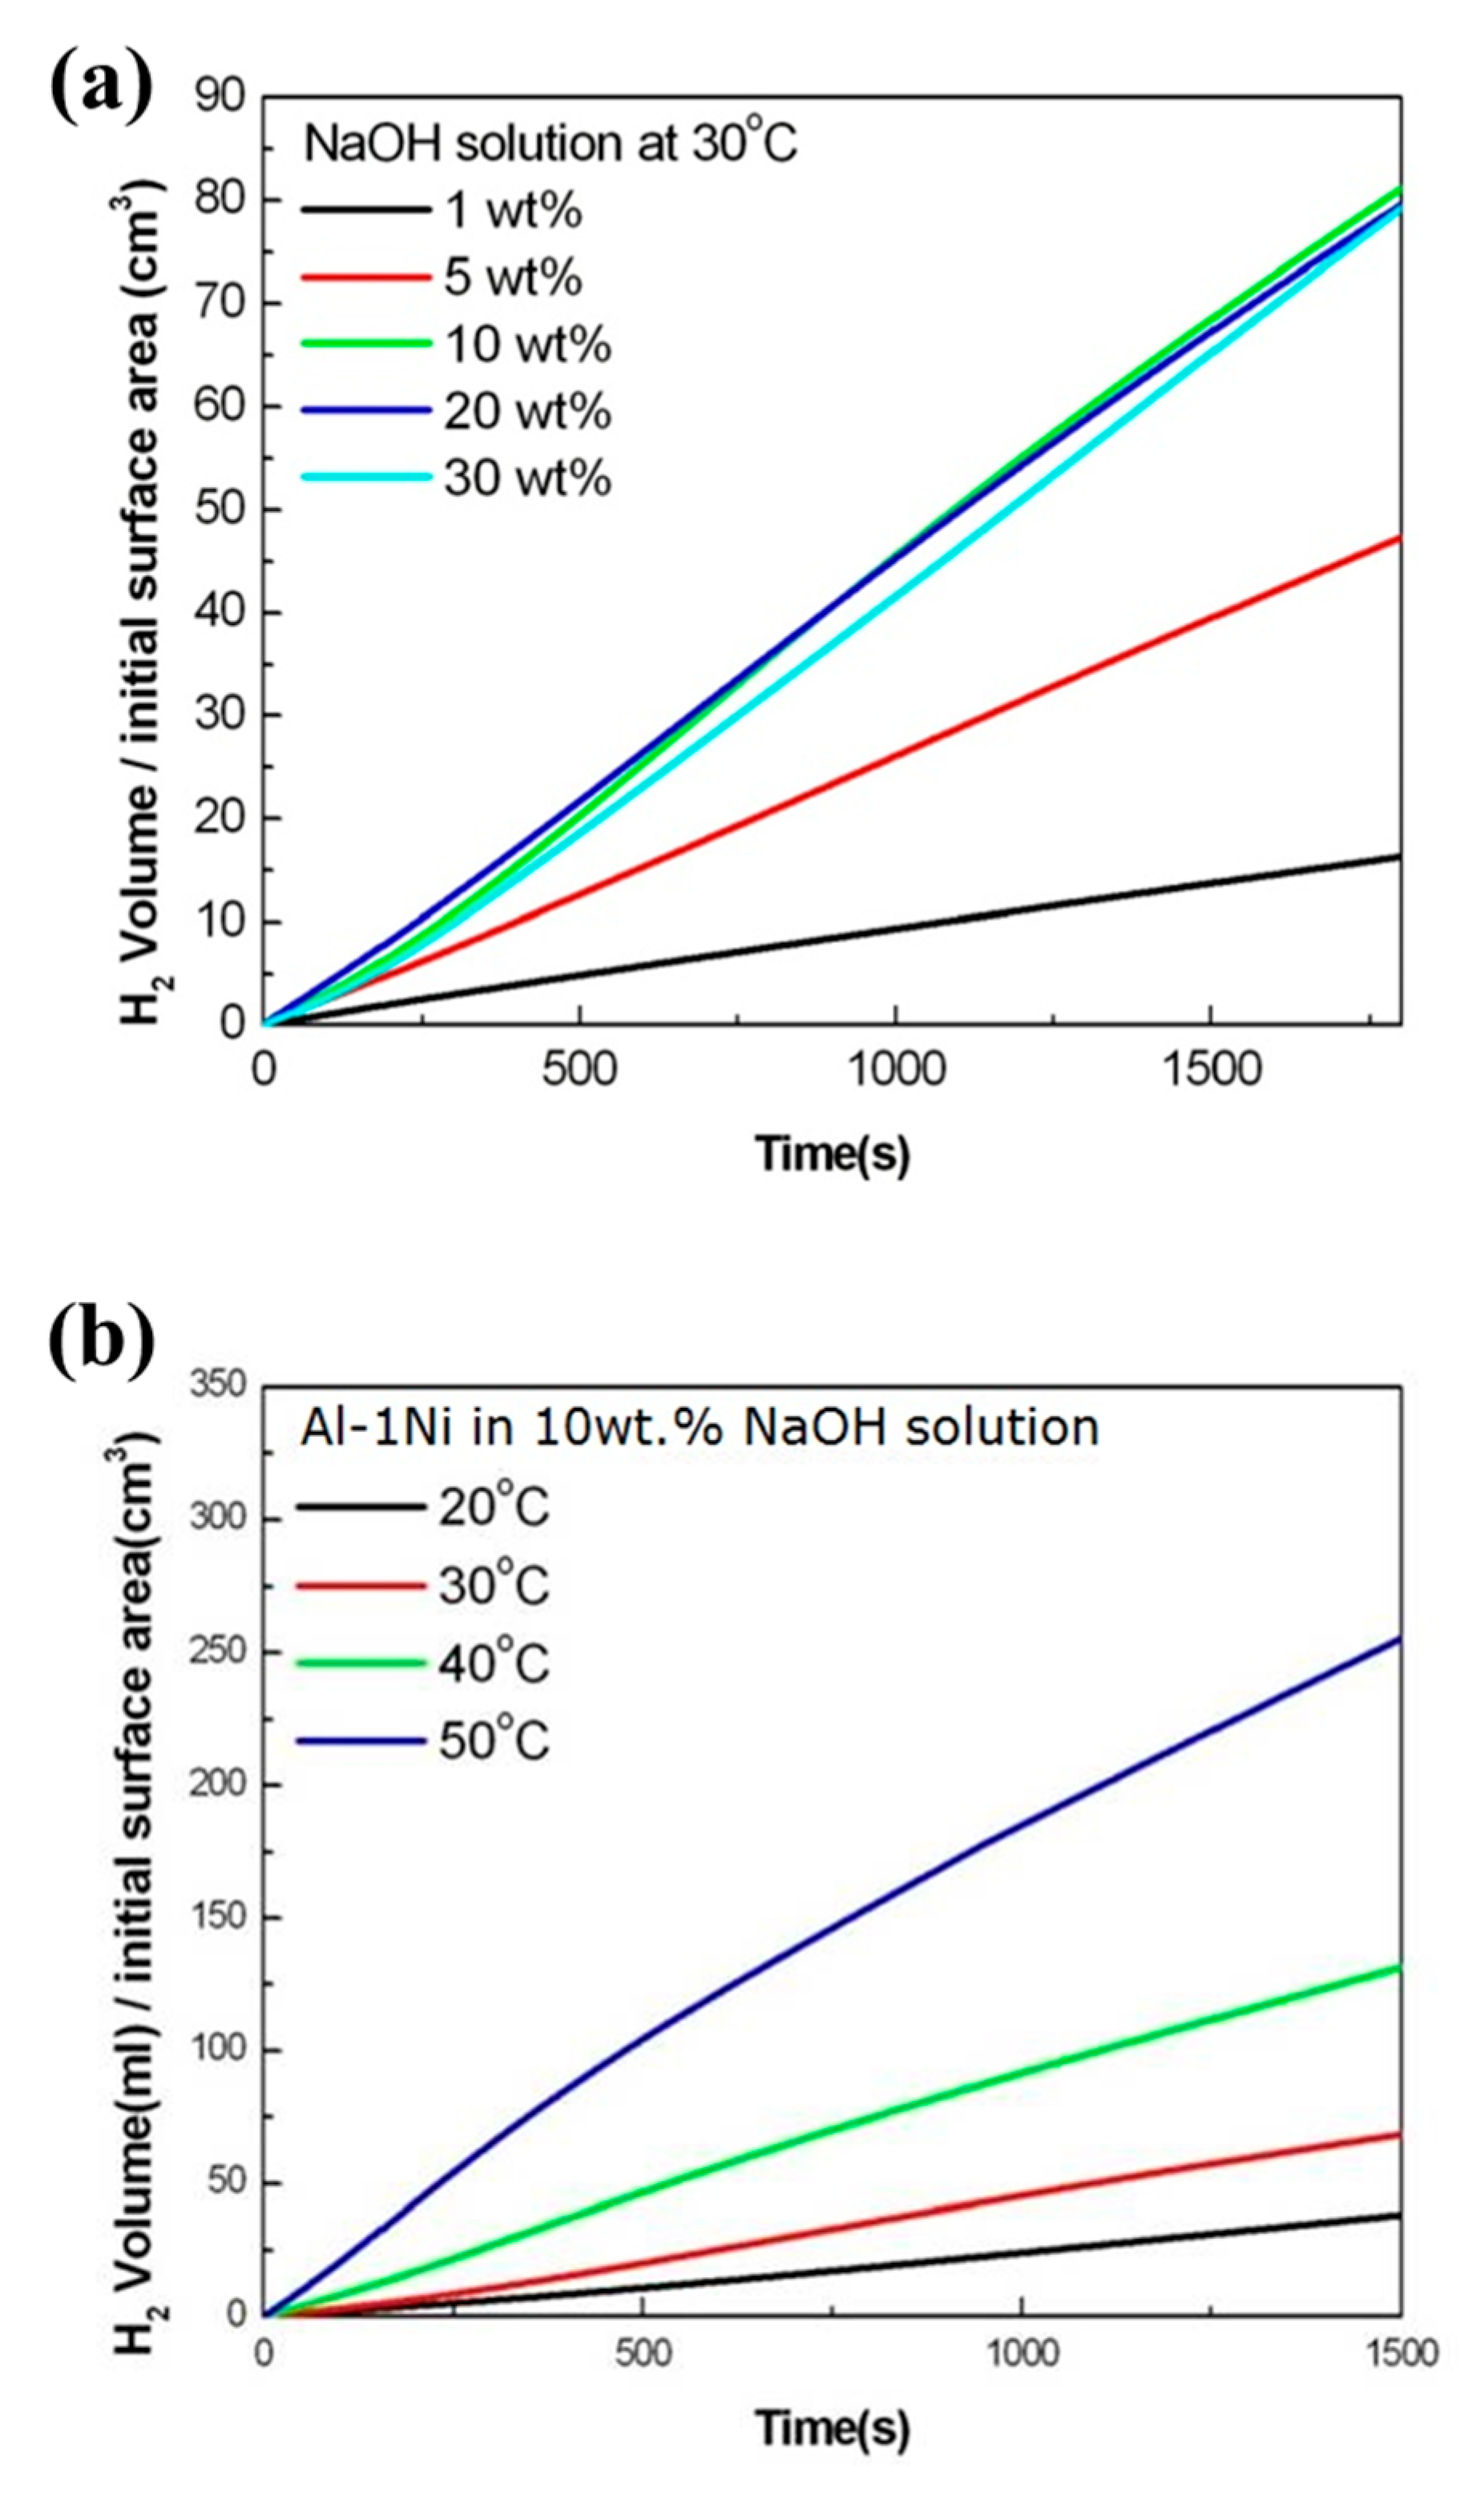
| NaOH Concentration (wt.%) | Hydrogen Generation Rate (mL/cm2·min) |
|---|---|
| 1 | 3.15 |
| 5 | 8.76 |
| 10 | 16.64 |
| 20 | 15.94 |
| 30 | 16.94 |
| Solution Temperature (°C) | Hydrogen Generation Rate (mL/cm2·min) |
|---|---|
| 20 | 8.90 |
| 30 | 16.64 |
| 40 | 31.32 |
| 50 | 53.49 |
Disclaimer/Publisher’s Note: The statements, opinions and data contained in all publications are solely those of the individual author(s) and contributor(s) and not of MDPI and/or the editor(s). MDPI and/or the editor(s) disclaim responsibility for any injury to people or property resulting from any ideas, methods, instructions or products referred to in the content. |
© 2023 by the authors. Licensee MDPI, Basel, Switzerland. This article is an open access article distributed under the terms and conditions of the Creative Commons Attribution (CC BY) license (https://creativecommons.org/licenses/by/4.0/).
Share and Cite
Kwon, J.; Eom, K.; Kim, M.; Toor, I.; Oh, S.; Kwon, H. Fabrication of Al-Ni Alloys for Fast Hydrogen Production from Hydrolysis in Alkaline Water. Materials 2023, 16, 7425. https://doi.org/10.3390/ma16237425
Kwon J, Eom K, Kim M, Toor I, Oh S, Kwon H. Fabrication of Al-Ni Alloys for Fast Hydrogen Production from Hydrolysis in Alkaline Water. Materials. 2023; 16(23):7425. https://doi.org/10.3390/ma16237425
Chicago/Turabian StyleKwon, JaeYoung, KwangSup Eom, MinJoong Kim, Ihsan Toor, SeKwon Oh, and HyukSang Kwon. 2023. "Fabrication of Al-Ni Alloys for Fast Hydrogen Production from Hydrolysis in Alkaline Water" Materials 16, no. 23: 7425. https://doi.org/10.3390/ma16237425
APA StyleKwon, J., Eom, K., Kim, M., Toor, I., Oh, S., & Kwon, H. (2023). Fabrication of Al-Ni Alloys for Fast Hydrogen Production from Hydrolysis in Alkaline Water. Materials, 16(23), 7425. https://doi.org/10.3390/ma16237425