Influence of Photoinitiator Type and Curing Conditions on the Photocuring of Soft Polymer Network


Abstract
:
1. Introduction
- dα/dt—reaction rate (1/s);
- k—rate constant (1/s);
- α—conversion degree;
- m, n—rection orders;
- Eα—activation Energy (J/mol);
- Z—pre-exponential factor (1/s);
- T—absolute temperature (K);
- R—gas constant (8.314 J/mol × K).
- α—conversion degree;
- k—rate constant (1/s);
- p—Avrami reaction order (often = 4);
- t—time (s).
2. Materials and Methods
2.1. Materials
2.2. Characterization Methods
- Mz—molar mass;
- f—the average number of core moieties per one macromer molecule, as calculated from 1H-NMR;
- M1—molar mass of the raw material (Priplast 1838);
- LI1—iodine value of the raw material (Priplast 1838);
- LI2—iodine value of the monomer.
- M—molar mass of the monomer;
- ΔH—enthalpy (J/g);
- n—the number of methacrylate groups in the molecule—2;
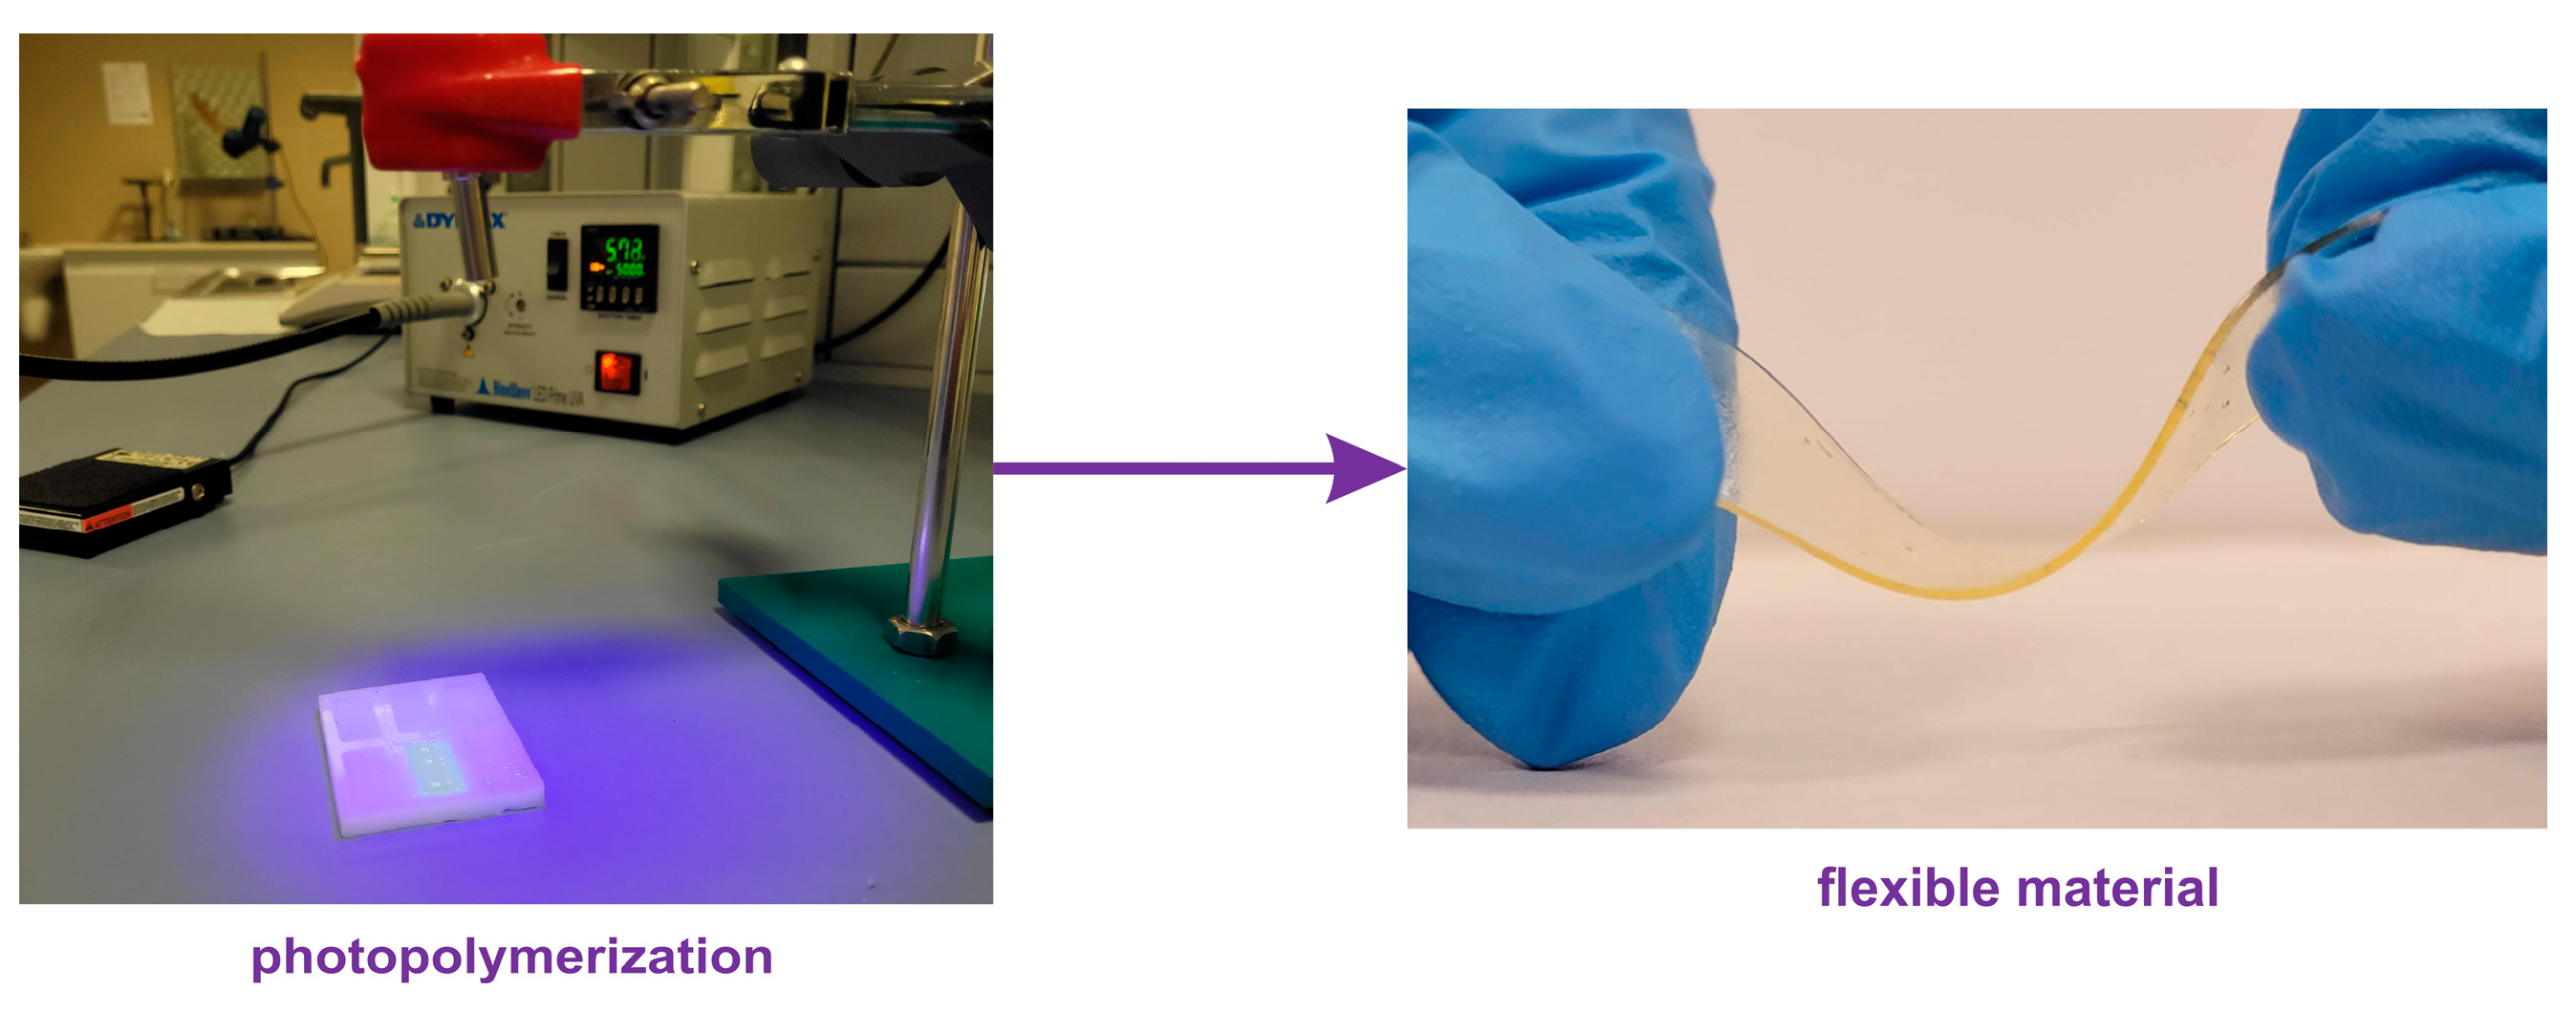
2.3. Photopolymerization of Elastomeric Films
3. Results
3.1. Macromonomer Characterization
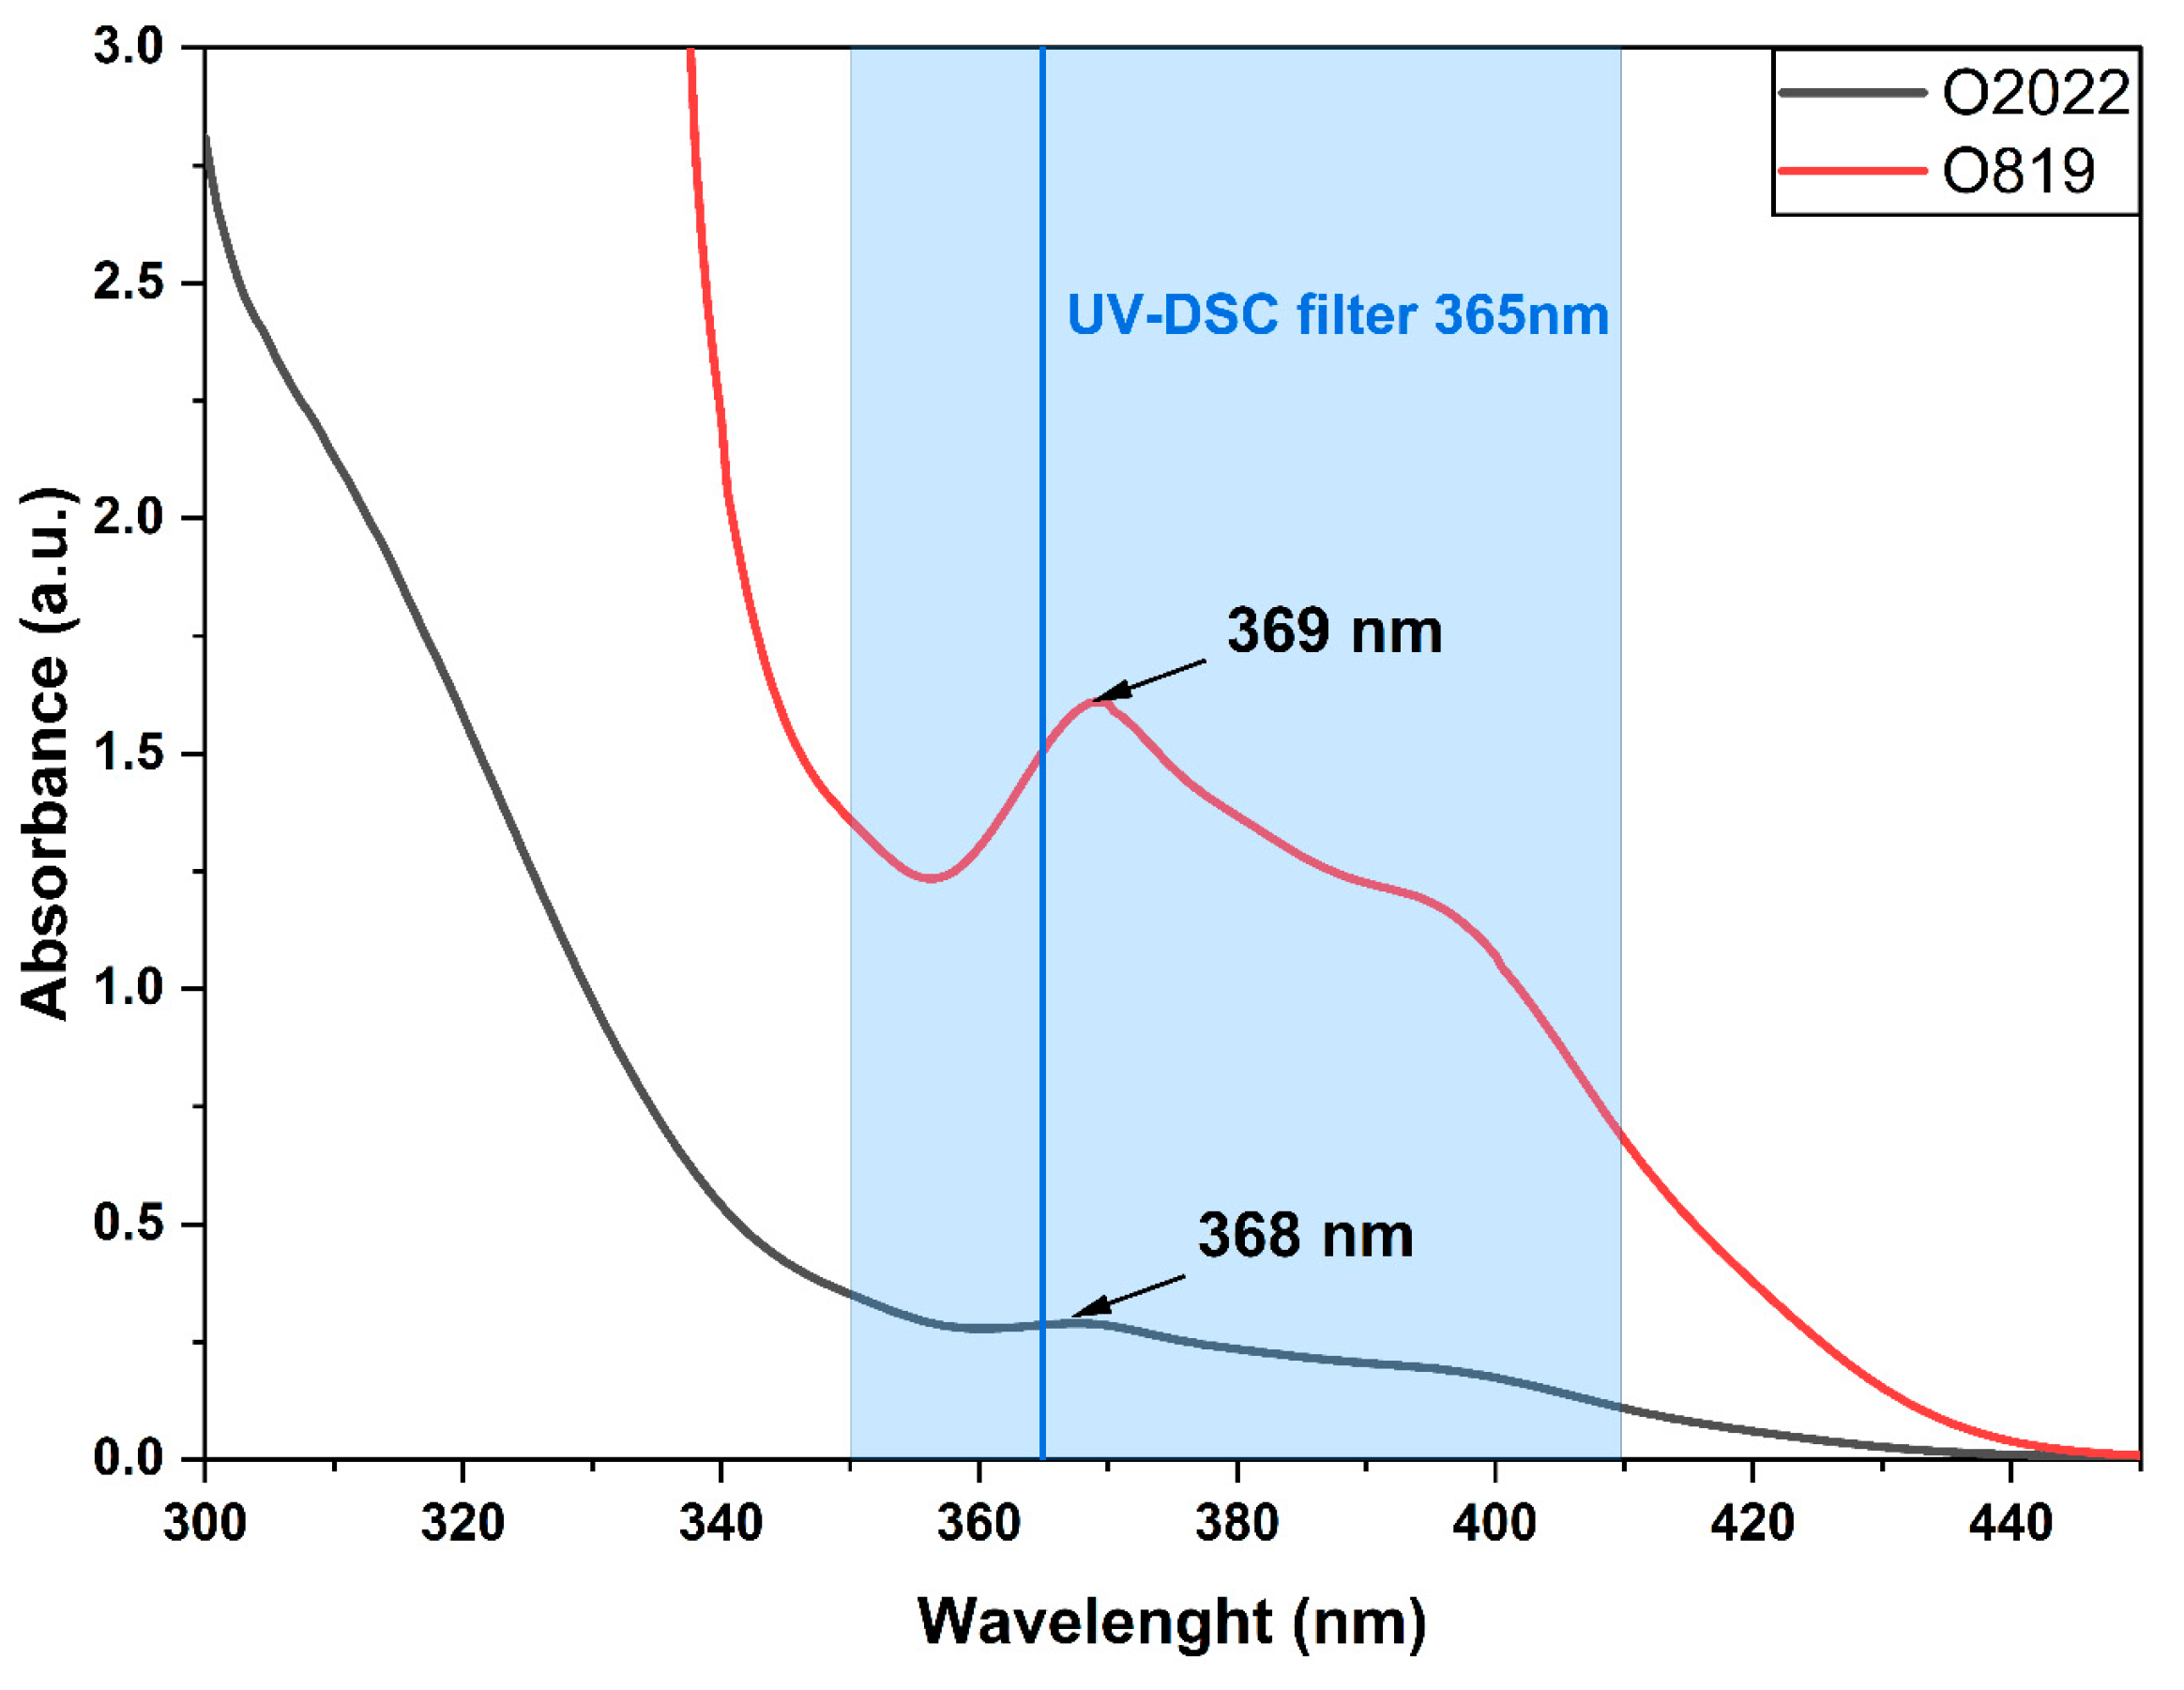
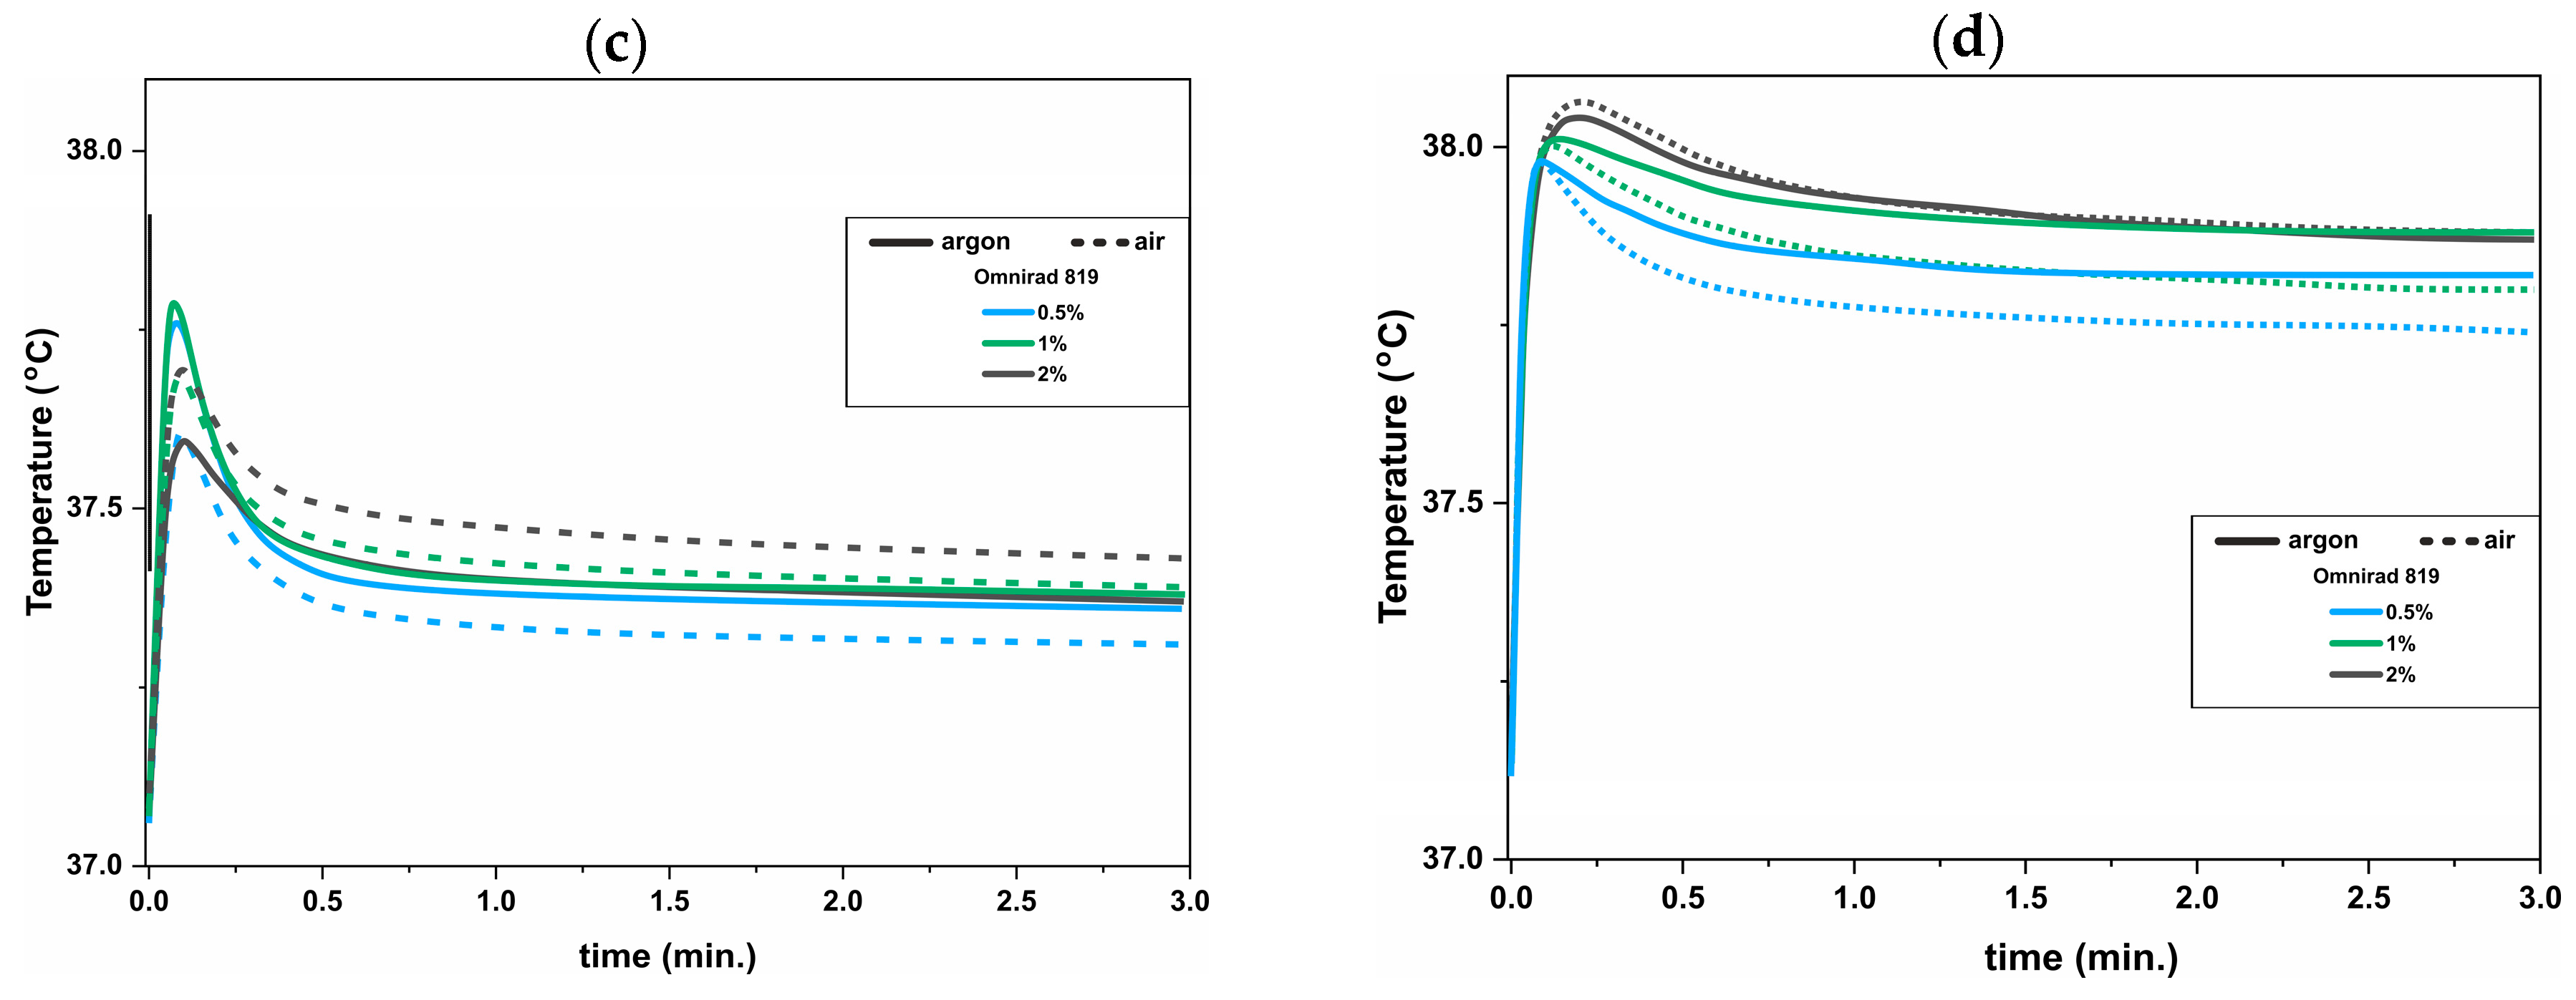
3.2. UV-DSC Study
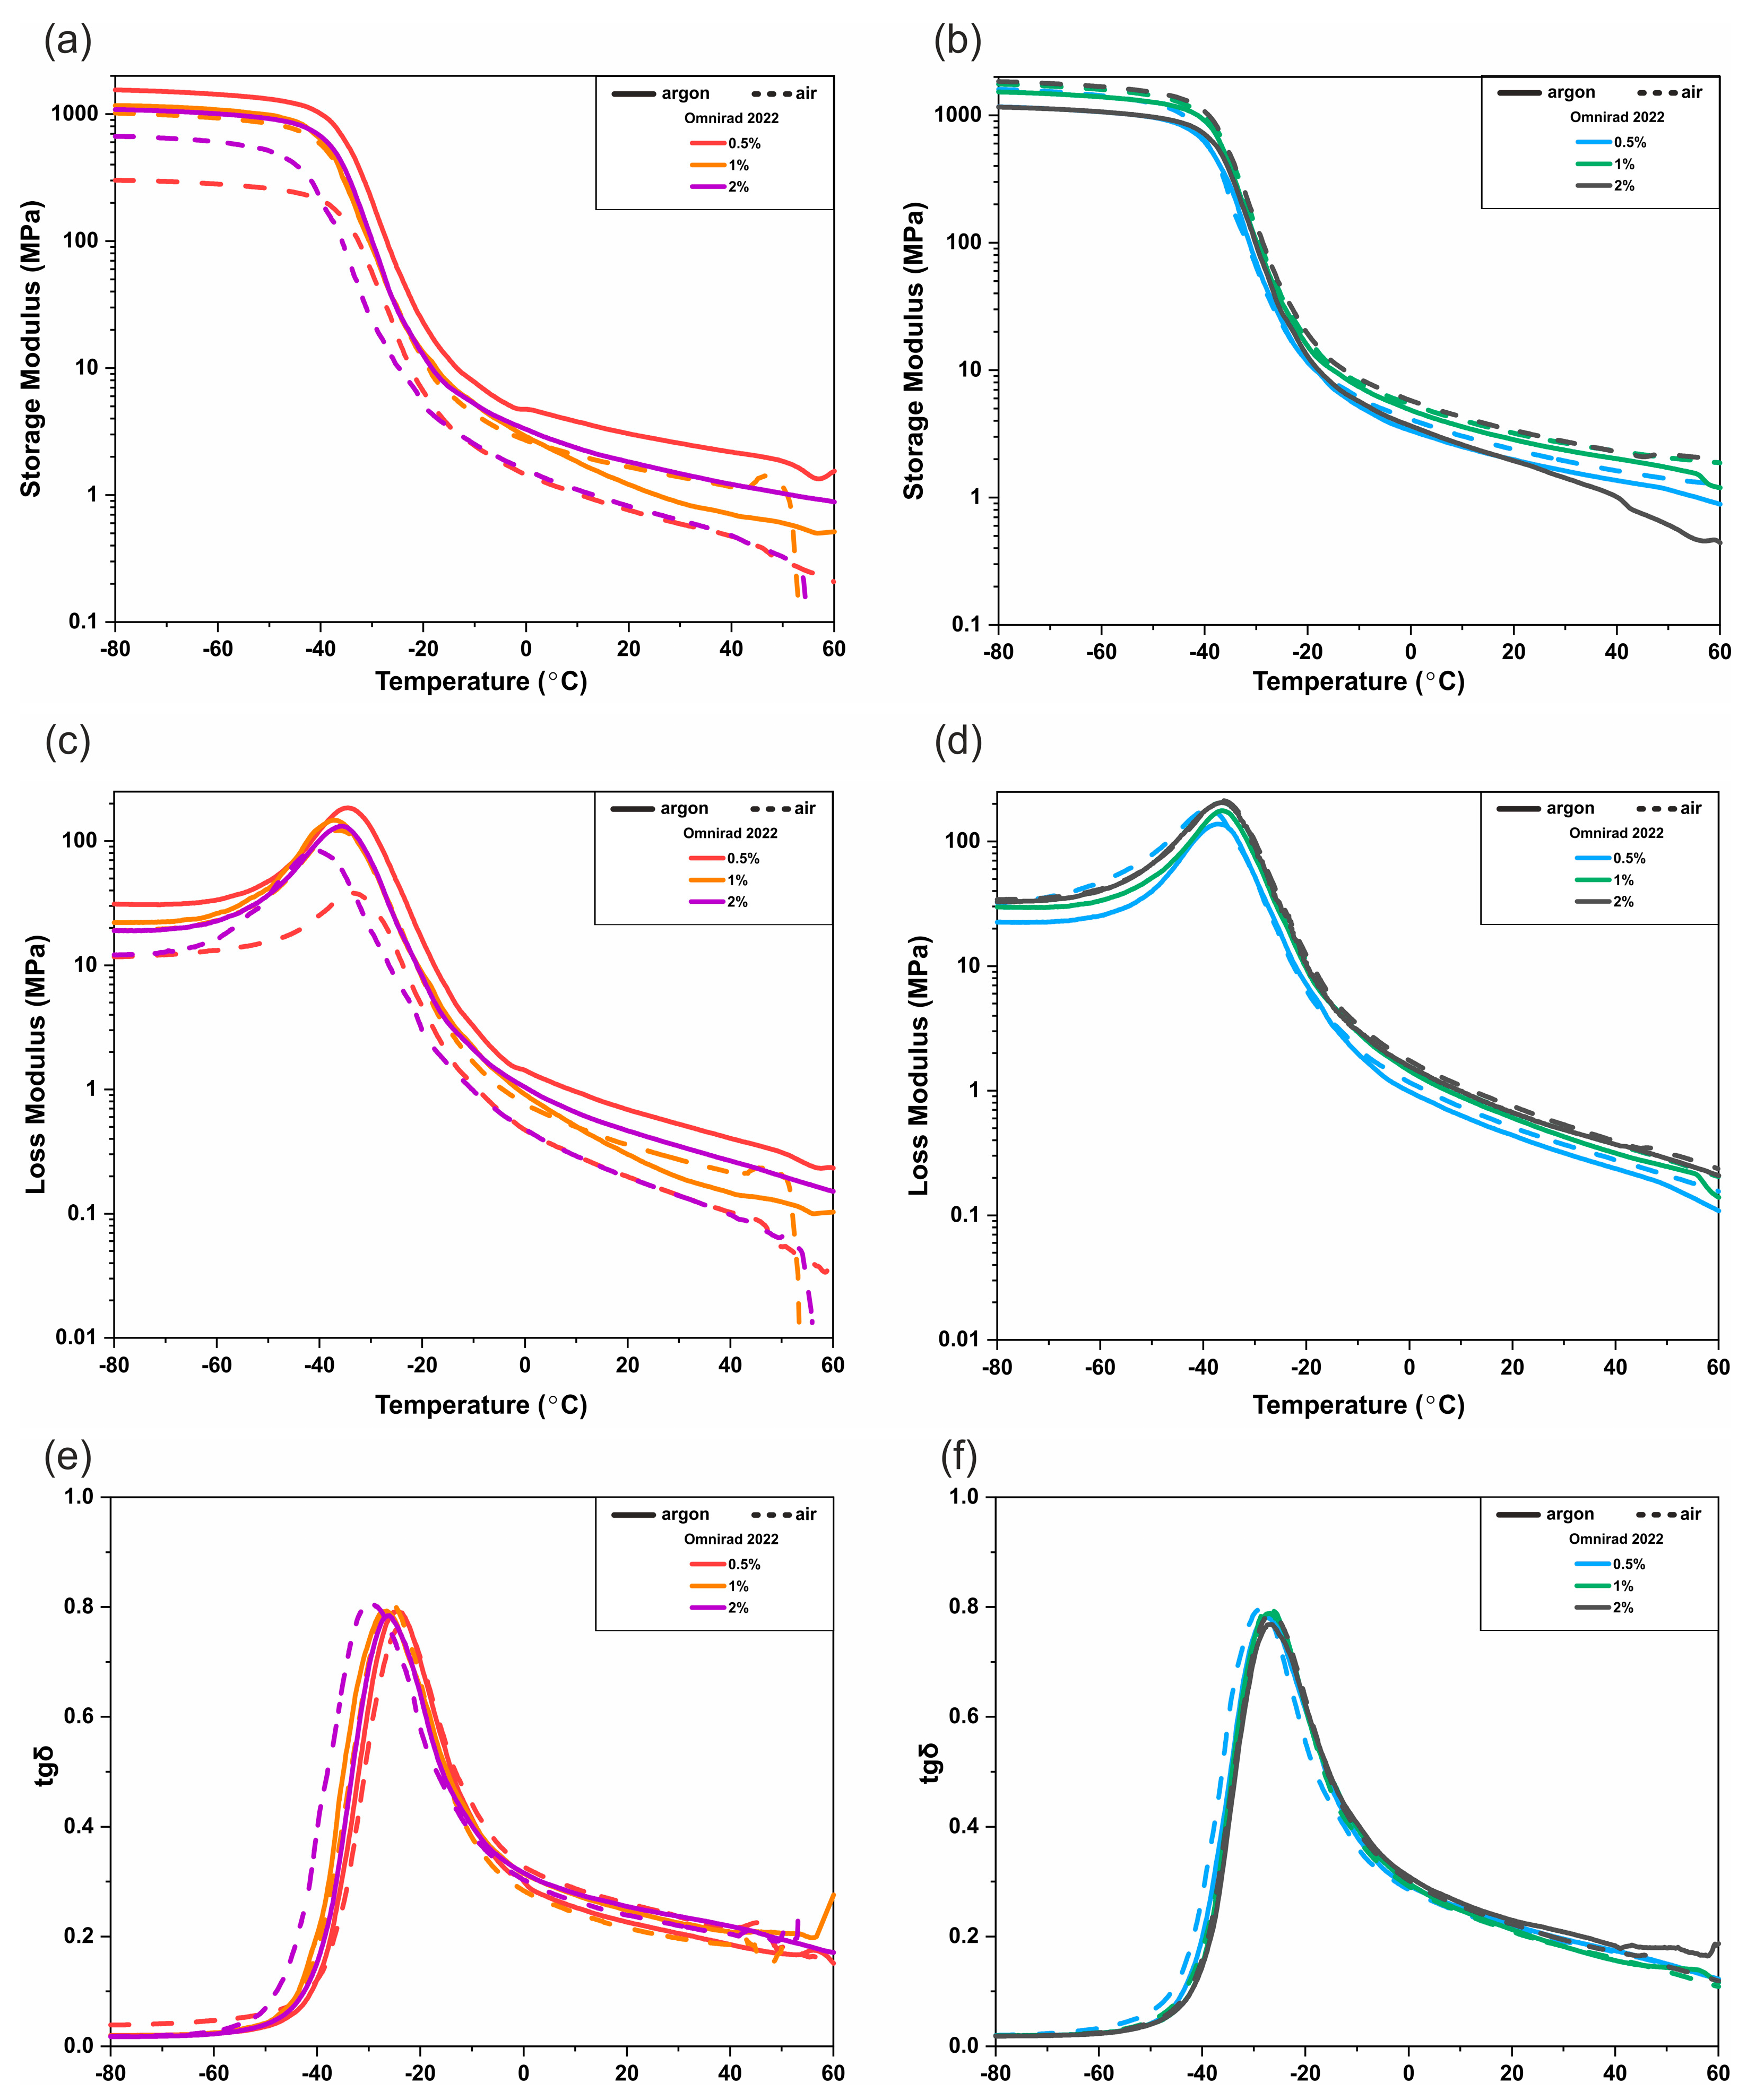
3.3. DMTA
4. Conclusions
Supplementary Materials
Author Contributions
Funding
Data Availability Statement
Conflicts of Interest
References
- Ruiz, C.S.B.; Machado, L.D.B.; Vanin, J.A.; Volponi, J.E. Cure Degree Estimation of Photocurable Coatings by Dsc and Differential Photo-Calorimetry. J. Therm. Anal. Calorim. 2002, 67, 335–341. [Google Scholar] [CrossRef]
- Véchot, L.; Bombard, I.; Laurent, P.; Lieto, J. Experimental and Modelling Study of the Radiative Curing of a Polyester-Based Coating. Int. J. Therm. Sci. 2006, 45, 86–93. [Google Scholar] [CrossRef]
- Huang, J.; Xiong, Y.; Zhou, X.; Yang, Z.; Yuan, T. A Novel Polyfunctional Polyurethane Acrylate Prepolymer Derived from Bio-Based Polyols for UV-Curable Coatings Applications. Polym. Test. 2022, 106, 17–28. [Google Scholar] [CrossRef]
- Tenorio-Alfonso, A.; Sánchez, M.C.; Franco, J.M. A Review of the Sustainable Approaches in the Production of Bio-Based Polyurethanes and Their Applications in the Adhesive Field. J. Polym. Environ. 2020, 28, 749–774. [Google Scholar] [CrossRef]
- Yan, J.; Lai, H.; Zeng, B.; Wang, L.; Xing, F.; Xiao, P. Photoinduced Free Radical-Releasing Systems and Their Anticancer Properties. Photochem. Photobiol. Sci. 2022, 21, 1405–1417. [Google Scholar] [CrossRef]
- Applications, B.; Tomal, W. Water-Soluble Photoinitiators. Polymers 2020, 12, 1073. [Google Scholar] [CrossRef]
- Dong, X.; Ren, J.; Duan, Y.; Wu, D. Preparation and Properties of Green UV-Curable Itaconic Acid Cross-Linked Modified Waterborne Polyurethane Coating. J. Appl. Polym. Sci. 2022, 17, 52042. [Google Scholar] [CrossRef]
- Hata, K.; Ikeda, H.; Nagamatsu, Y.; Masaki, C.; Hosokawa, R.; Shimizu, H. Dental Poly(Methyl Methacrylate)-Based Resin Containing a Nanoporous Silica Filler. J. Funct. Biomater. 2022, 13, 32. [Google Scholar] [CrossRef]
- Hamidi, A.S.; Hadis, M.A.; Palin, W.M. Alternative Co-Initiators for Photocurable Dental Resins: Polymerisation, Quantum Yield of Conversion and Cytotoxicity. Dent. Mater. 2022, 38, 1330–1343. [Google Scholar] [CrossRef]
- Fiedor, P. A New Approach to Micromachining: High-Precision and Innovative Additive Manufacturing Solutions Based on Photopolymerization Technology. Materials 2020, 13, 2951. [Google Scholar] [CrossRef]
- Light, V. Thioxanthone Derivatives as a New Class of Organic Photocatalysts for Photopolymerisation Processes and the 3D Printing of Photocurable Resins under Visible Light. Catalysts 2020, 10, 903. [Google Scholar] [CrossRef]
- Tomal, W.; Ortyl, J.; Chachaj-brekiesz, A.; Popielarz, R. Multifunctional Biphenyl Derivatives as Photosensitisers in Various Types of Photopolymerization Processes, Including IPN. RSC Adv. 2020, 10, 32162–32182. [Google Scholar] [CrossRef]
- Bagheri, A.; Jin, J. Photopolymerization in 3D Printing. ACS Appl. Polym. Mater. 2019, 1, 593–611. [Google Scholar] [CrossRef]
- Layani, M.; Wang, X.; Magdassi, S. Novel Materials for 3D Printing by Photopolymerization. Adv. Mater. 2018, 1706344, 1706344. [Google Scholar] [CrossRef] [PubMed]
- Bagheri, A.; Engel, K.E.; Bainbridge, C.W.A.; Xu, J.; Boyer, C.; Jin, J. 3D Printing of Polymeric Materials Based on Photo-RAFT Polymerization. Polym. Chem. 2019, 11, 641–647. [Google Scholar] [CrossRef]
- Chang, P.; Mei, H.; Zhou, S.; Dassios, K.G.; Cheng, L. 3D Printed Electrochemical Energy Storage Devices. J. Mater. Chem. A Mater. 2019, 7, 4230–4258. [Google Scholar] [CrossRef]
- Li, R.; Zhang, L.; Chen, T.; Wang, D. On-Surface Two-Dimensional Polymerization: Advances, Challenges, and Prospects. Langmuir 2023, 39, 12521–12532. [Google Scholar] [CrossRef] [PubMed]
- Andrzejewska, E. Free-Radical Photopolymerization of Multifunctional Monomers. In Three-Dimensional Microfabrication Using Two-Photon Polymerization; Elsevier: Amsterdam, The Netherlands, 2020; pp. 77–99. ISBN 9780128178270. [Google Scholar]
- Li, X.; Bian, F.; Li, S.; Gui, X.; Yao, M.; Hu, J.; Lin, S. Preparation of Multifunctional Silicone Acrylate Prepolymers with Anti-Oxygen Inhibition Ability for Application in UV-Curable Anti-Smudge Coatings. Eur. Polym. J. 2022, 169, 111136. [Google Scholar] [CrossRef]
- Bednarczyk, P.; Nowak, M.; Mozelewska, K.; Czech, Z. Photocurable Coatings Based on Bio-Renewable Oligomers and Monomers. Materials 2021, 14, 7731. [Google Scholar] [CrossRef]
- Yin, B.; Zhang, J. A Novel Photocurable Modified Epoxy Resin for High Heat Resistance Coatings. Colloid Polym. Sci. 2020, 298, 1303–1312. [Google Scholar] [CrossRef]
- Gziut, K.; Kowalczyk, A.; Schmidt, B. Free-Radical Bulk-Photopolymerization Process as a Method of Obtaining Thermally Curable Structural Self-Adhesive Tapes and Effect of Used Type I Photoinitiators. Polymers 2020, 12, 2191. [Google Scholar] [CrossRef] [PubMed]
- Opris, D.M. Polar Elastomers as Novel Materials for Electromechanical Actuator Applications. Adv. Mater. 2018, 30, 1703678. [Google Scholar] [CrossRef] [PubMed]
- Jeon, O.; Powell, C.; Ahmed, S.M.; Alsberg, E. Biodegradable, Photocrosslinked Alginate Hydrogels with Independently Tailorable Physical Properties and Cell Adhesivity. Tissue Eng. Part A 2010, 16, 2915–2925. [Google Scholar] [CrossRef] [PubMed]
- Dou, J.; Sprague, C.H.; Chen, L.; Wang, Z.; Wang, S.; Dou, J.; Sprague, C.H.; Chen, L.; Wang, Z.; Wang, S.; et al. Injectable Polymeric Biomaterials: A Brief Review Injectable Polymeric Biomaterials: A Brief Review. Mater. Technol. Adv. Peformance Mater. 2016, 7857, B273–B282. [Google Scholar] [CrossRef]
- Xu, Y.; Jia, L.; Wang, Z.; Jiang, G.; Zhou, G.; Chen, W.; Chen, R. Injectable Photo-Crosslinking Cartilage Decellularized Extracellular Matrix for Cartilage Tissue Regeneration. Mater. Lett. 2020, 268, 127609. [Google Scholar] [CrossRef]
- Oliveira, M.B.; Kossover, O.; Mano, J.F.; Seliktar, D. Injectable PEGylated Fibrinogen Cell-Laden Microparticles Made with a Continuous Solvent- and Oil-Free Preparation Method. Acta Biomater. 2015, 13, 78–87. [Google Scholar] [CrossRef]
- Ferreira, P.; Coelho, J.F.J.; Almeida, J.F.; Gil, M.H. Photocrosslinkable Polymers for Biomedical Applications. In Biomedical Engineering; InTech Publisher: New York, NY, USA, 2009. [Google Scholar]
- Andrzejewska, E. Photopolymerization Kinetics of Multifunctional Monomers. Prog. Polym. Sci. 2001, 26, 605–665. [Google Scholar] [CrossRef]
- Assumption, H.J.; Mathias, L.J. Photopolymerization of Urethane Dimethacrylates Synthesized via a Non-Isocyanate Route. Polymer 2003, 44, 5131–5136. [Google Scholar] [CrossRef]
- Fu, J.; Wang, L.; Yu, H.; Haroon, M.; Haq, F.; Shi, W.; Wu, B.; Wang, L. Progress in Organic Coatings Research Progress of UV-Curable Polyurethane Acrylate-Based Hardening Coatings. Prog. Org. Coat. 2019, 131, 82–99. [Google Scholar] [CrossRef]
- Kowalczyk, A.; Weisbrodt, M.; Schmidt, B.; Kraśkiewicz, A. The Effect of Type-I Photoinitiators on the Kinetics of the UV-Induced Cotelomerization Process of Acrylate Monomers and Properties of Obtained Pressure-Sensitive Adhesives. Materials 2021, 14, 4563. [Google Scholar] [CrossRef]
- Li, C.; Cheng, J.; Jian, Y.; Chang, W.; Nie, J. Photopolymerization Kinetics and Thermal Properties of Dimethacrylate Based on Bisphenol-S. J. Appl. Polym. Sci. 2013, 127, 3418–3423. [Google Scholar] [CrossRef]
- Musanje, L.; Ferracane, J.L.; Sakaguchi, R.L. Determination of the Optimal Photoinitiator Concentration in Dental Composites Based on Essential Material Properties. Dent. Mater. 2009, 25, 994–1000. [Google Scholar] [CrossRef] [PubMed]
- El Fray, M.; Skrobot, J.; Bolikal, D.; Kohn, J. Synthesis and Characterization of Telechelic Macromers Containing Fatty Acid Derivatives. React. Funct. Polym. 2012, 72, 781–790. [Google Scholar] [CrossRef]
- Skrobot, J.; Zair, L.; Ostrowski, M.; El Fray, M. New Injectable Elastomeric Biomaterials for Hernia Repair and Their Biocompatibility. Biomaterials 2016, 75, 182–192. [Google Scholar] [CrossRef] [PubMed]
- Tanzi, M.C.; Verderio, P.; Lampugnani, M.G.; Resnati, M.; Dejana, E.; Sturani, E. Cytotoxicity of Some Catalysts Commonly Used in the Synthesis of Copolymers for Biomedical Use. J. Mater. Sci. Mater. Med. 1994, 5, 393–396. [Google Scholar] [CrossRef]
- Niedźwiedź, M.J.; Demirci, G.; Kantor-Malujdy, N.; Sobolewski, P.; El Fray, M. Fatty-Acid-Derived Ester-Urethane Macromonomers Synthesized Using Bismuth and Zinc Catalysts. Eur. Polym. J. 2022, 170, 111168. [Google Scholar] [CrossRef]
- Prout, E.G. The Thermal Decomposition of Irradiated Potassium Permanganate. J. Inorg. Nucler Chem. 1958, 7, 368–377. [Google Scholar] [CrossRef]
- Šesták, J.; Berggren, G. Study of the Kinetics of the Mechanism of Solid-State Reactions at Increasing Temperatures. Thermochim. Acta 1971, 3, 1–12. [Google Scholar] [CrossRef]
- Kamal, M.R.; Sourour, S. Kinetics and Thermal Characterization of Thermoset Cure. Polym. Eng. Sci. 1973, 13, 59–64. [Google Scholar] [CrossRef]
- PN-EN ISO 3961:2018-09; Oleje i Tłuszcze Roślinne Oraz Zwierzęce—Oznaczanie Liczby Jodowej. Polski Komitet Normalizacyjny: Warszawa, Poland, 2018.
- McCurdy, K.G.; Laidler, K.J. Thermochemical studies of some acrylate and methacrylate polymerizations in emulsion systems. Can. J. Chem. 1964, 42, 818–824. [Google Scholar] [CrossRef]
- Andrzejewska, E.; Socha, E.; Bogacki, M.; Andrzejewski, M. Chain Length Dependent Termination in Radical Cross-Linking Polymerization. Polymer 2005, 46, 5437–5446. [Google Scholar] [CrossRef]
- Hutchinson, R.A.; Paquet, D.A.; Beuermann, S.; McMinn, J.H. Investigation of Methacrylate Free-Radical Depropagation Kinetics by Pulsed-Laser Polymerization. Ind. Eng. Chem. Res. 1998, 37, 3567–3574. [Google Scholar] [CrossRef]
- Lee, K.; Kim, J.; Lee, B. Free Radical Polymerization of Nitropropyl Acrylates and Methacrylates. I. Heat of Polymerization. J. Appl. Polym. Sci. 2001, 81, 2929–2935. [Google Scholar] [CrossRef]
- Odian, G. Principles of Polymerization; John Wiley & Sons: Hoboken, NJ, USA, 2004; ISBN 978-0-471-27400-1. [Google Scholar]
- Andrzejewska, E. Sulfur-Containing Polyacrylates: V. Temperature Effects on the Photoinitiated Polymerization of Diacrylates. Polymer 1996, 37, 1039–1045. [Google Scholar] [CrossRef]
- Ligon, S.C.; Husár, B.; Wutzel, H.; Holman, R.; Liska, R. Strategies to Reduce Oxygen Inhibition in Photoinduced Polymerization. Chem. Rev. 2014, 114, 557–589. [Google Scholar] [CrossRef]
- Green, W.A. Industrial Photoinitiators: A Technical Guide; CRC Press: Boca Raton, FL, USA, 2010; ISBN 9780429103827. [Google Scholar]
- Jin, S.; Kareliussen, E.; Cheng, C.-M. Photoinitiator Effect on Depth of Cure in Visible Light Cure Polymerization. In Proceedings of the RadTech 2020, Orlando, FL, USA, 9–11 March 2020; UV + EB Technology: Topeka, KS, USA, 2020; Volume 6, pp. 30–40. [Google Scholar]
- Tian, N.; Ning, R.; Kong, J. Self-Toughening of Epoxy Resin through Controlling Topology of Cross-Linked Networks. Polymer 2016, 99, 376–385. [Google Scholar] [CrossRef]
- He, H.; Li, L.; Lee, L.J. Photopolymerization and Structure Formation of Methacrylic Acid Based Hydrogels: The Effect of Light Intensity. React Funct. Polym. 2008, 68, 103–113. [Google Scholar] [CrossRef]
- Szalewski, L.; Szalewska, M.; Jarosz, P.; Woś, M.; Szymańska, J. Temperature Changes in Composite Materials during Photopolymerization. Appl. Sci. 2021, 11, 474. [Google Scholar] [CrossRef]
- Goodner, M.D.; Bowman, C.N. Development of a Comprehensive Free Radical Photopolymerization Model Incorporating Heat and Mass Transfer e Ects in Thick Ÿlms. Chem. Eng. Sci. 2002, 57, 887–900. [Google Scholar] [CrossRef]
- Dionysopoulos, D.; Papadopoulos, C.; Kouros, P.; Tsitrou, E.; Koliniotou-Koumpia, E. Temperature Rise during Photo-Polymerization under Ceramic Restorations. Oral Health Dent. Manag. 2013, 12, 273–278. [Google Scholar]


(from GPC) (g/mol) | (from GPC) (g/mol) | (from GPC) | Molecular Mass (from IV) (g/mol) | Dynamic Viscosity at 37 °C (Pa×) | Dynamic Viscosityat 25 °C (Pa × s) |
|---|---|---|---|---|---|
| 7800 | 13,300 | 1.69 | 5426 | 170 ± 4 | 571 ± 17 |
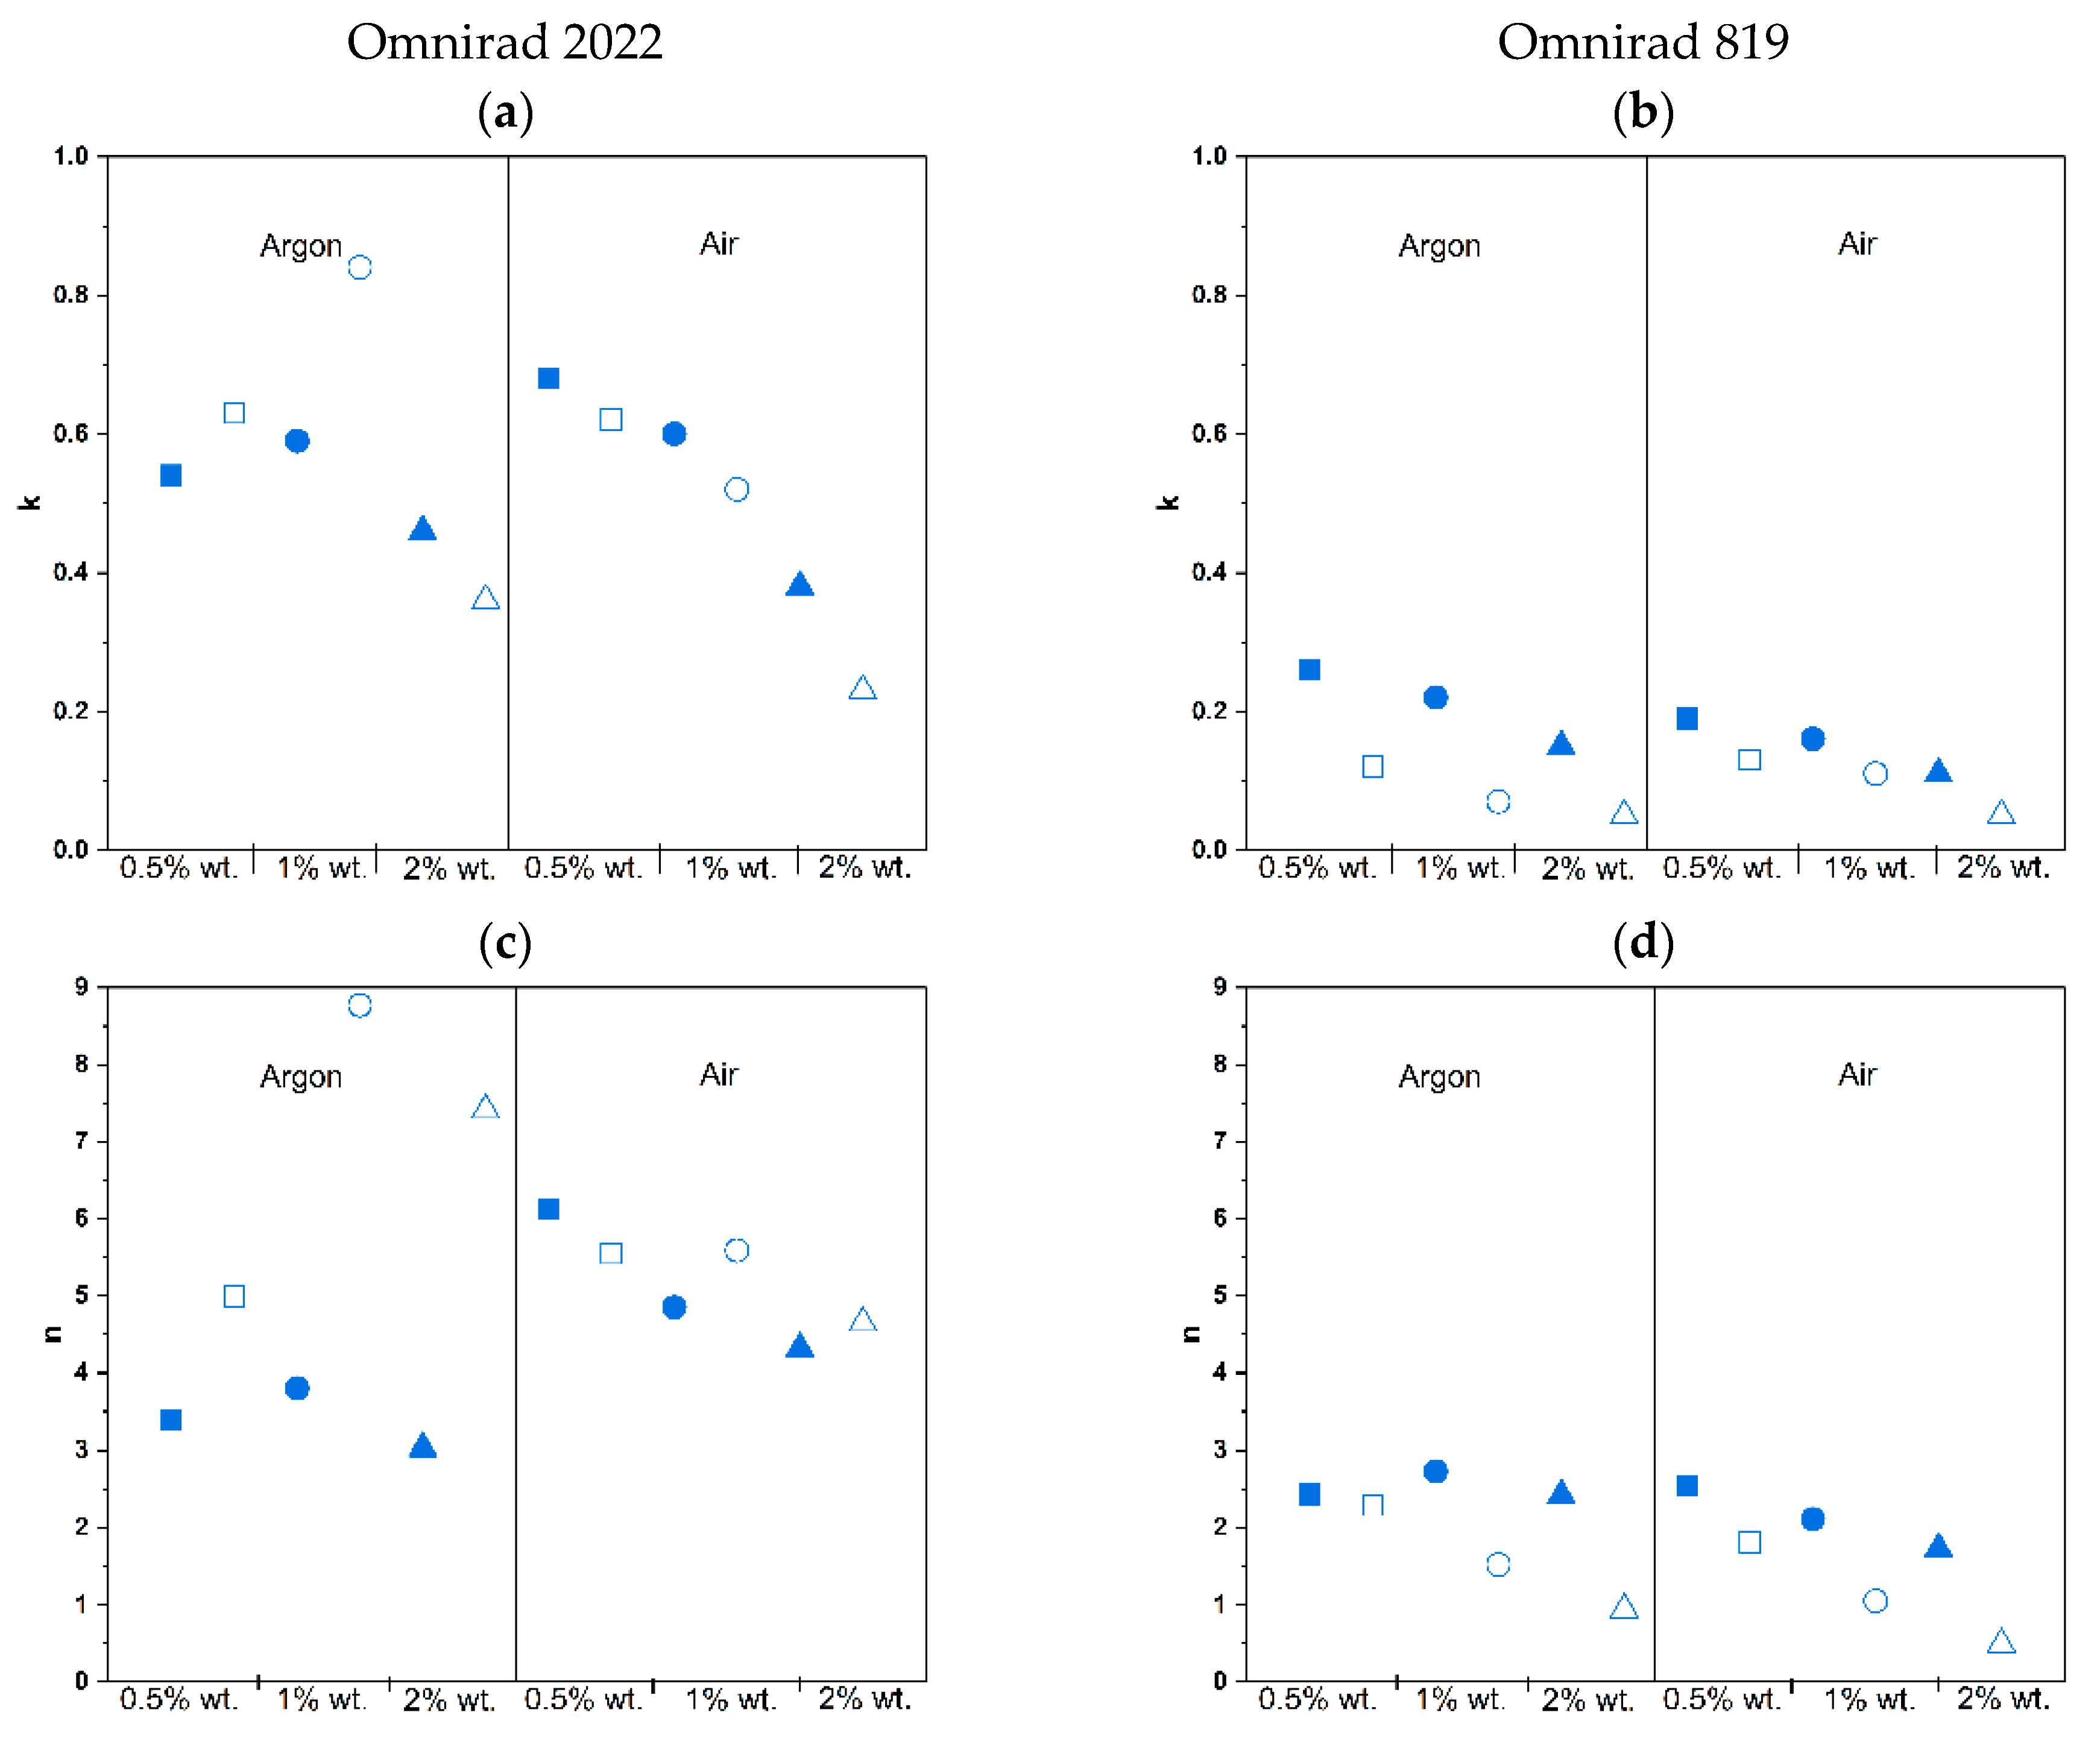
| Photoinitiator | Concentration of Photoinitiator (% wt.) | Atmosphere | k | n | m |
|---|---|---|---|---|---|
| Omnirad 2022 | 0.5 | Argon | 0.54 ± 0.07 | 3.39 ± 0.25 | 0.74 ± 0.03 |
| Air | 0.68 ± 0.21 | 6.12 ± 0.24 | 0.80 ± 0.08 | ||
| 1 | Argon | 0.59 ± 0.03 | 3.80 ± 0.07 | 0.67 ± 0.01 | |
| Air | 0.60 ± 0.01 | 4.85 ± 0.38 | 0.68 ± 0.02 | ||
| 2 | Argon | 0.46 ± 0.02 | 3.03 ± 0.45 | 0.54 ± 0.06 | |
| Air | 0.38 ± 0.01 | 4.32 ± 0.68 | 0.53 ± 0.02 | ||
| Omnirad 819 | 0.5 | Argon | 0.26 ± 0.00 | 2.43 ± 0.20 | 0.42 ± 0.00 |
| Air | 0.19 ± 0.02 | 2.55 ± 0.06 | 0.36 ± 0.01 | ||
| 1 | Argon | 0.22 ± 0.03 | 2.73 ± 0.36 | 0.38 ± 0.02 | |
| Air | 0.16 ± 0.01 | 2.11 ± 0.24 | 0.29 ± 0.02 | ||
| 2 | Argon | 0.15 ± 0.05 | 2.42 ± 0.09 | 0.30 ± 0.05 | |
| Air | 0.11 ± 0.01 | 1.73 ± 0.02 | 0.23 ± 0.03 |
| Photoinitiator | Concentration of Photoinitiator (% wt.) | Atmosphere | k | n | m |
|---|---|---|---|---|---|
| Omnirad 2022 | 0.5 | Argon | 0.63 ± 0.03 | 4.99 ± 0.45 | 0.65 ± 0.02 |
| Air | 0.62 ± 0.02 | 5.55 ± 0.86 | 0.64 ± 0.01 | ||
| 1 | Argon | 0.84 ± 0.14 | 8.77 ± 1.88 | 0.70 ± 0.05 | |
| Air | 0.52 ± 0.01 | 5.59 ± 0.08 | 0.54 ± 0.00 | ||
| 2 | Argon | 0.36 ± 0.04 | 7.41 ± 0.06 | 0.47 ± 0.04 | |
| Air | 0.23 ± 0.04 | 4.65 ± 0.72 | 0.34 ± 0.03 | ||
| Omnirad 819 | 0.5 | Argon | 0.12 ± 0.02 | 2.29 ± 0.04 | 0.21 ± 0.03 |
| Air | 0.13 ± 0.02 | 1.81 ± 0.34 | 0.18 ± 0.01 | ||
| 1 | Argon | 0.07 ± 0.01 | 1.52 ± 0.23 | 0.10 ± 0.05 | |
| Air | 0.11 ± 0.04 | 1.05 ± 0.02 | 0.11 ± 0.03 | ||
| 2 | Argon | 0.05 ± 0.01 | 0.94 ± 0.01 | 0.05 ± 0.03 | |
| Air | 0.05 ± 0.00 | 0.49 ± 0.04 | 0.02 ± 0.01 |
Disclaimer/Publisher’s Note: The statements, opinions and data contained in all publications are solely those of the individual author(s) and contributor(s) and not of MDPI and/or the editor(s). MDPI and/or the editor(s) disclaim responsibility for any injury to people or property resulting from any ideas, methods, instructions or products referred to in the content. |
© 2023 by the authors. Licensee MDPI, Basel, Switzerland. This article is an open access article distributed under the terms and conditions of the Creative Commons Attribution (CC BY) license (https://creativecommons.org/licenses/by/4.0/).
Share and Cite
Niedźwiedź, M.J.; Demirci, G.; Kantor-Malujdy, N.; El Fray, M. Influence of Photoinitiator Type and Curing Conditions on the Photocuring of Soft Polymer Network. Materials 2023, 16, 7348. https://doi.org/10.3390/ma16237348
Niedźwiedź MJ, Demirci G, Kantor-Malujdy N, El Fray M. Influence of Photoinitiator Type and Curing Conditions on the Photocuring of Soft Polymer Network. Materials. 2023; 16(23):7348. https://doi.org/10.3390/ma16237348
Chicago/Turabian StyleNiedźwiedź, Malwina J., Gokhan Demirci, Nina Kantor-Malujdy, and Miroslawa El Fray. 2023. "Influence of Photoinitiator Type and Curing Conditions on the Photocuring of Soft Polymer Network" Materials 16, no. 23: 7348. https://doi.org/10.3390/ma16237348
APA StyleNiedźwiedź, M. J., Demirci, G., Kantor-Malujdy, N., & El Fray, M. (2023). Influence of Photoinitiator Type and Curing Conditions on the Photocuring of Soft Polymer Network. Materials, 16(23), 7348. https://doi.org/10.3390/ma16237348