


A New Method to Predict Damage to Composite Structures Using Convolutional Neural Networks


Abstract
:
1. Introduction
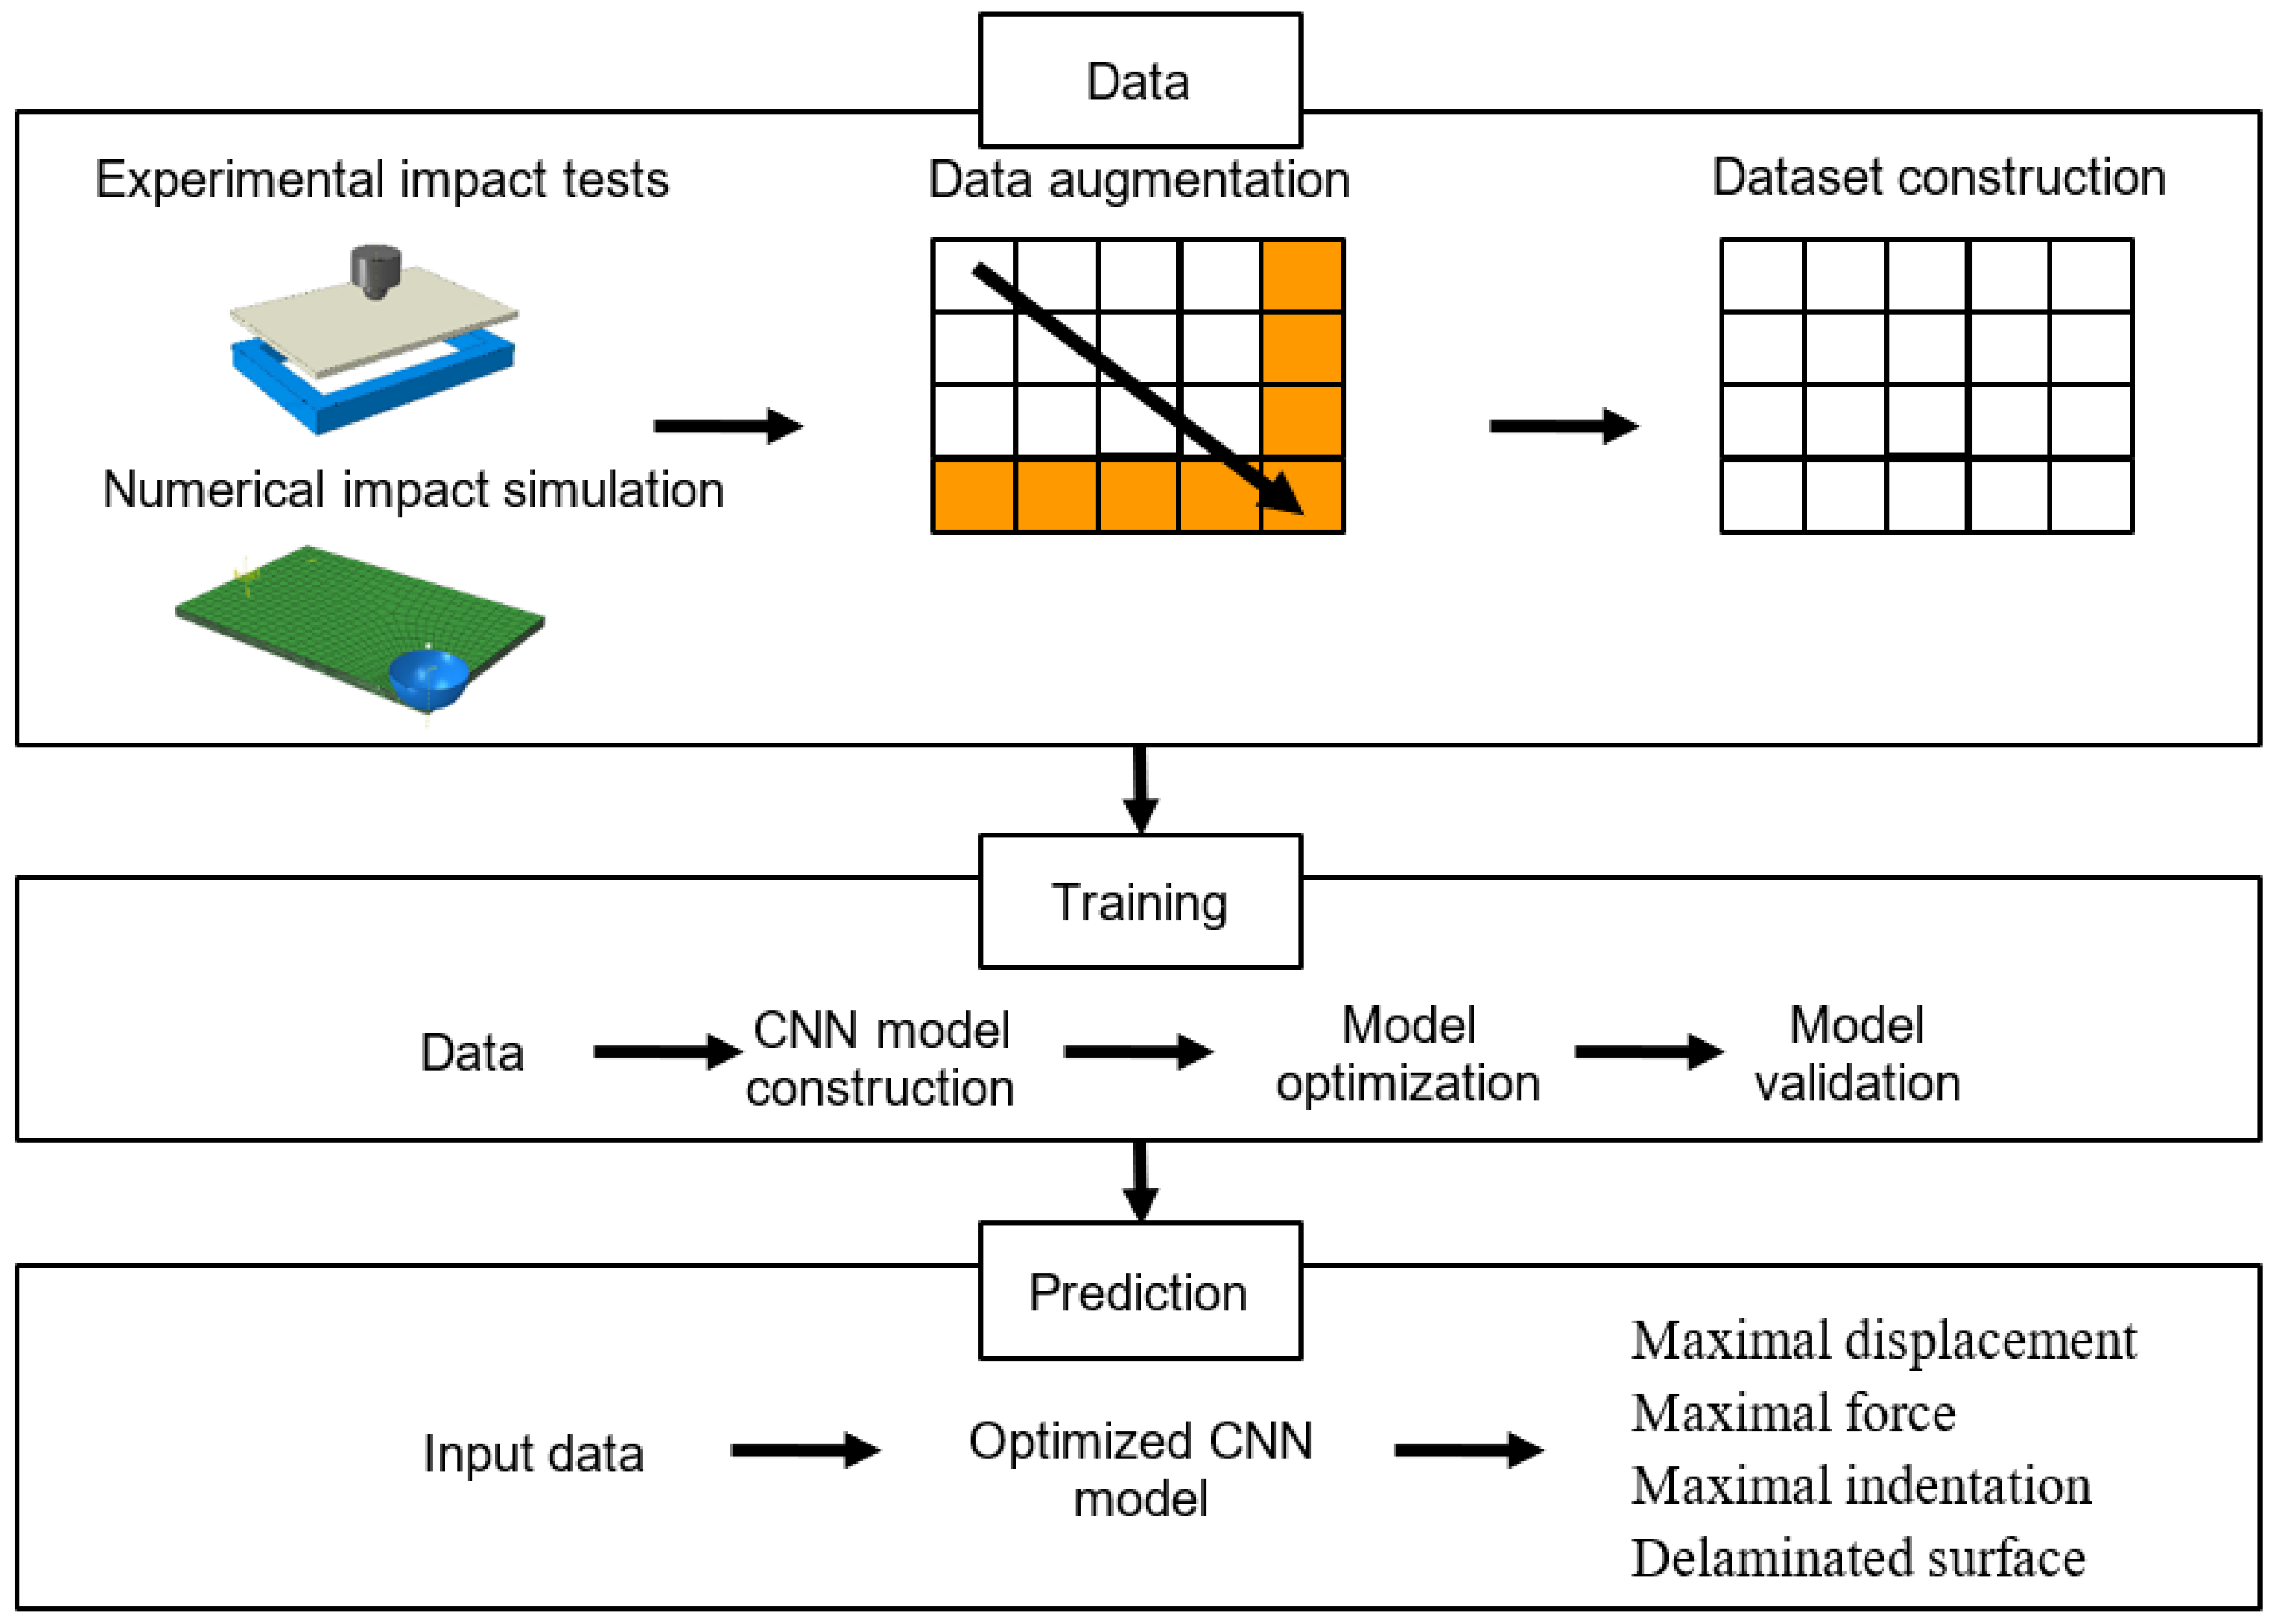
2. Methods
2.1. Data
2.2. Dataset Construction
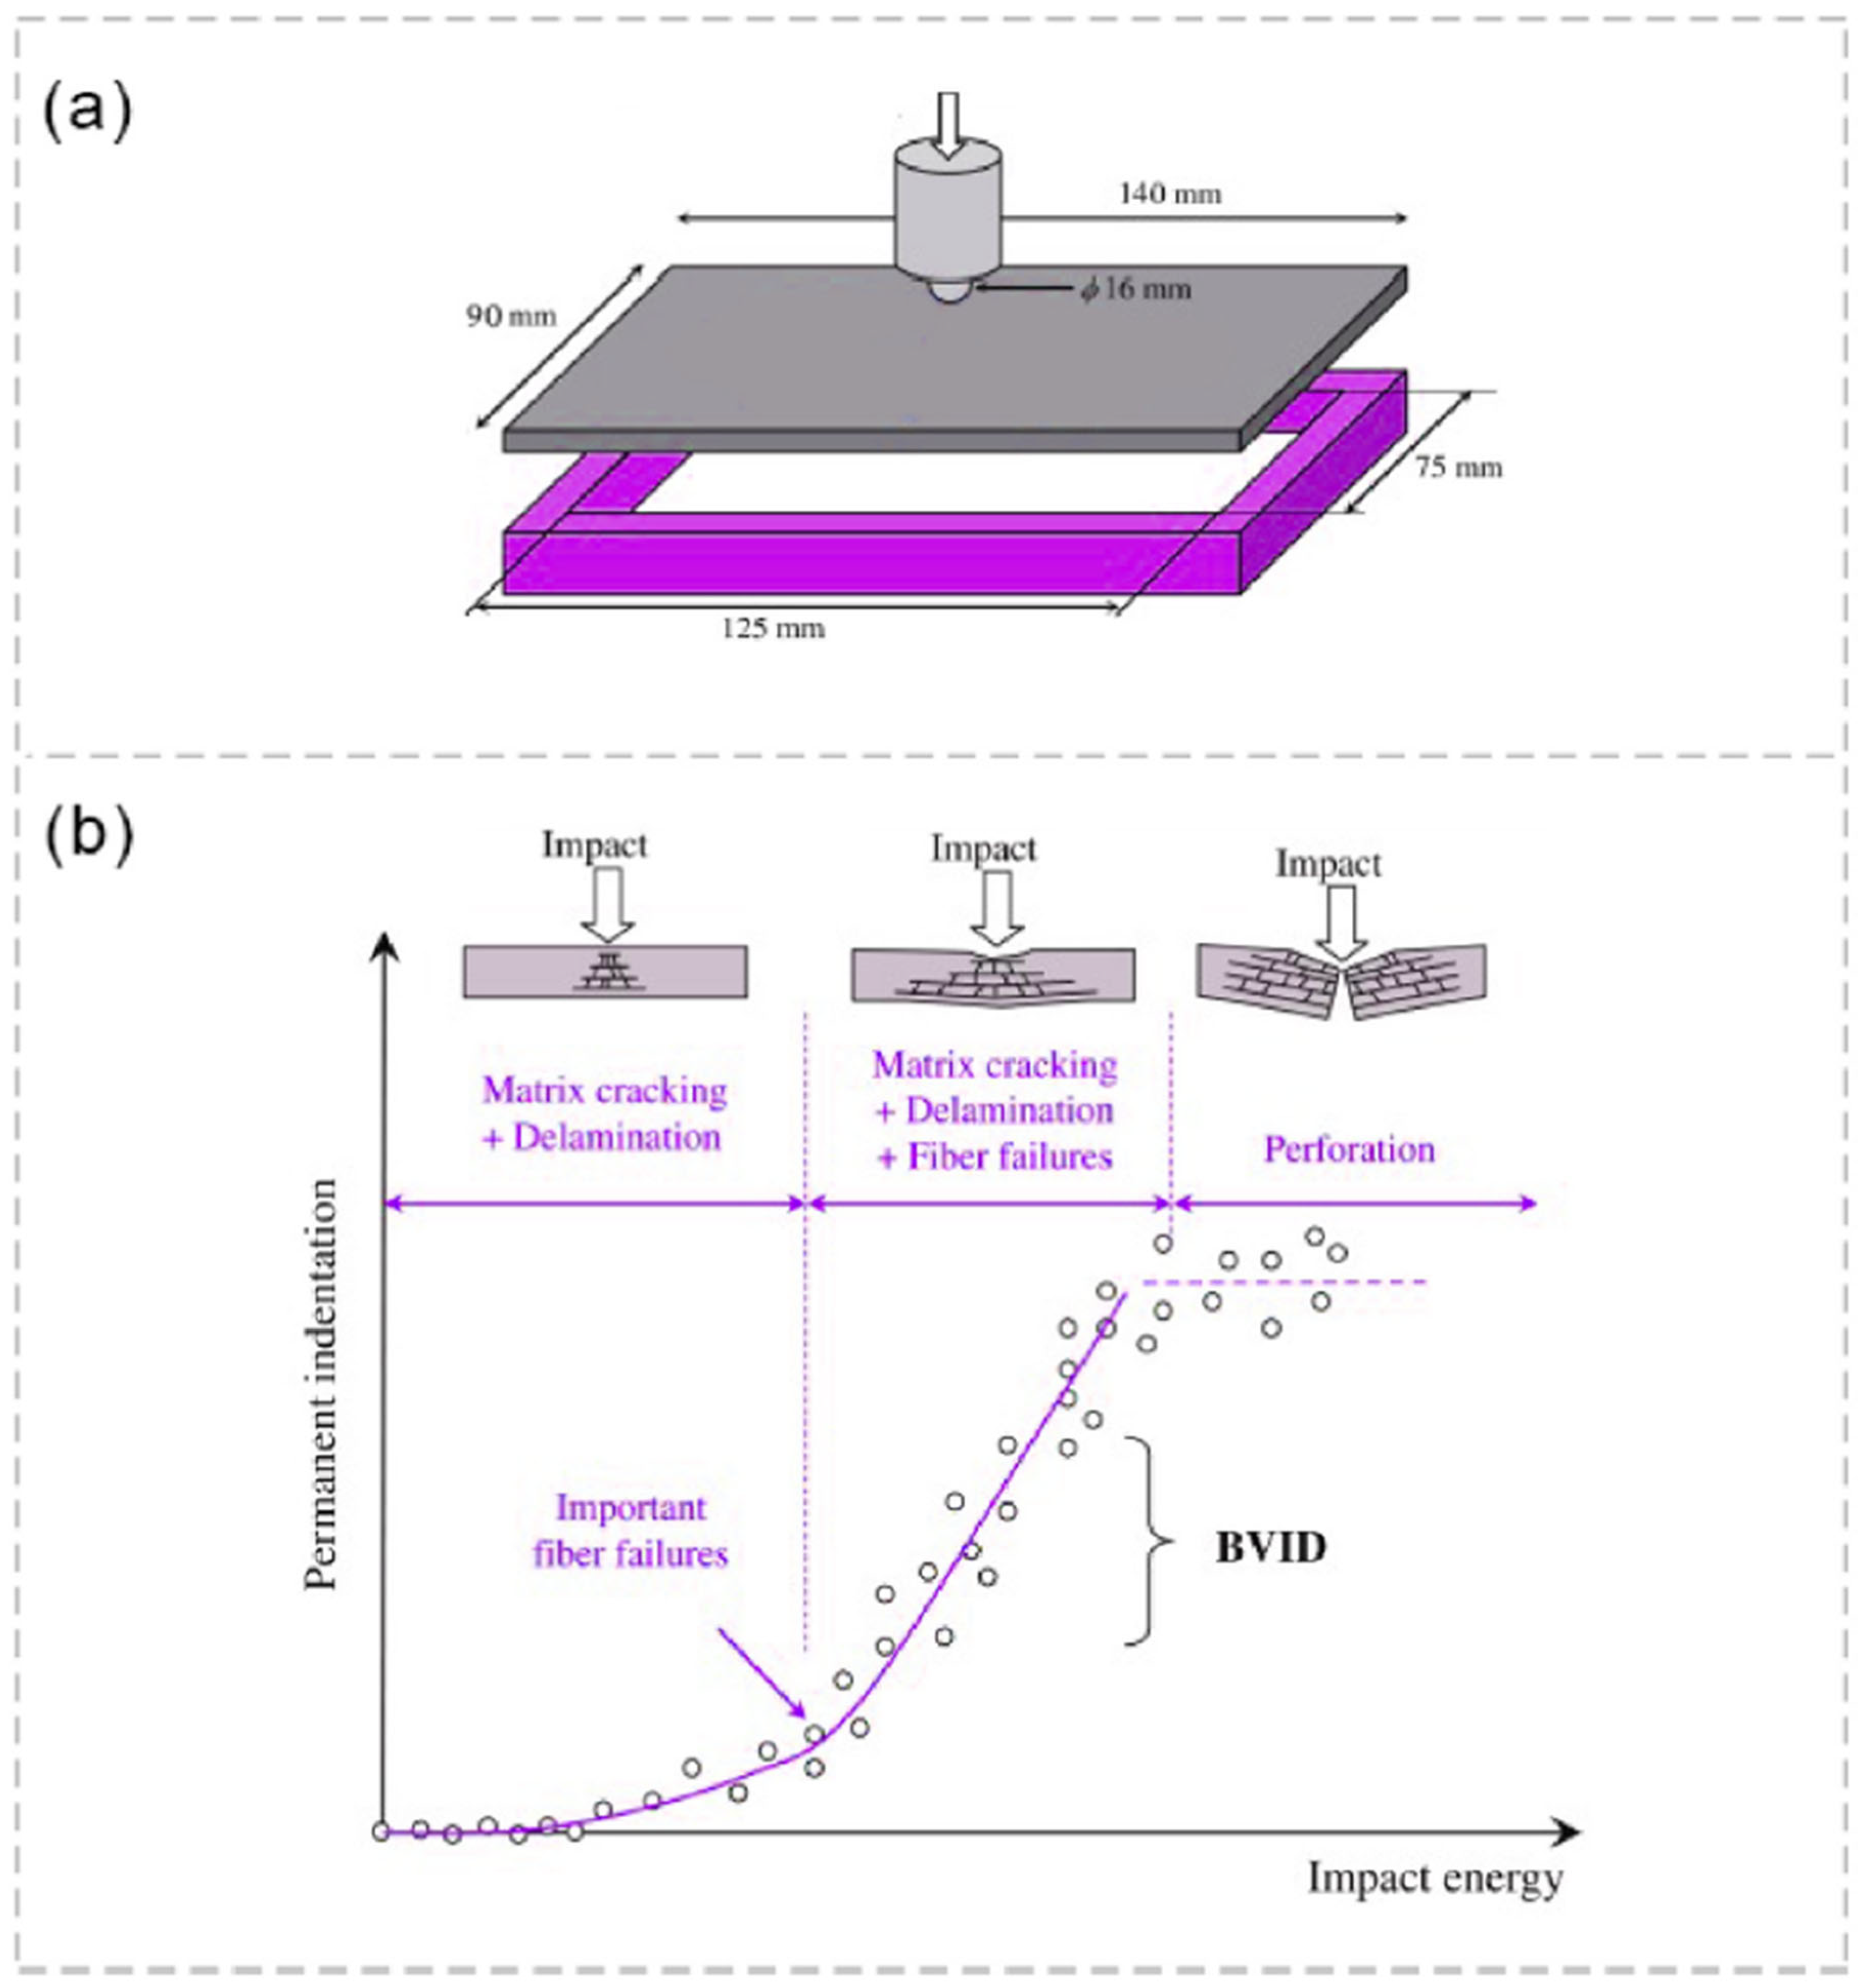
2.2.1. Literature Data
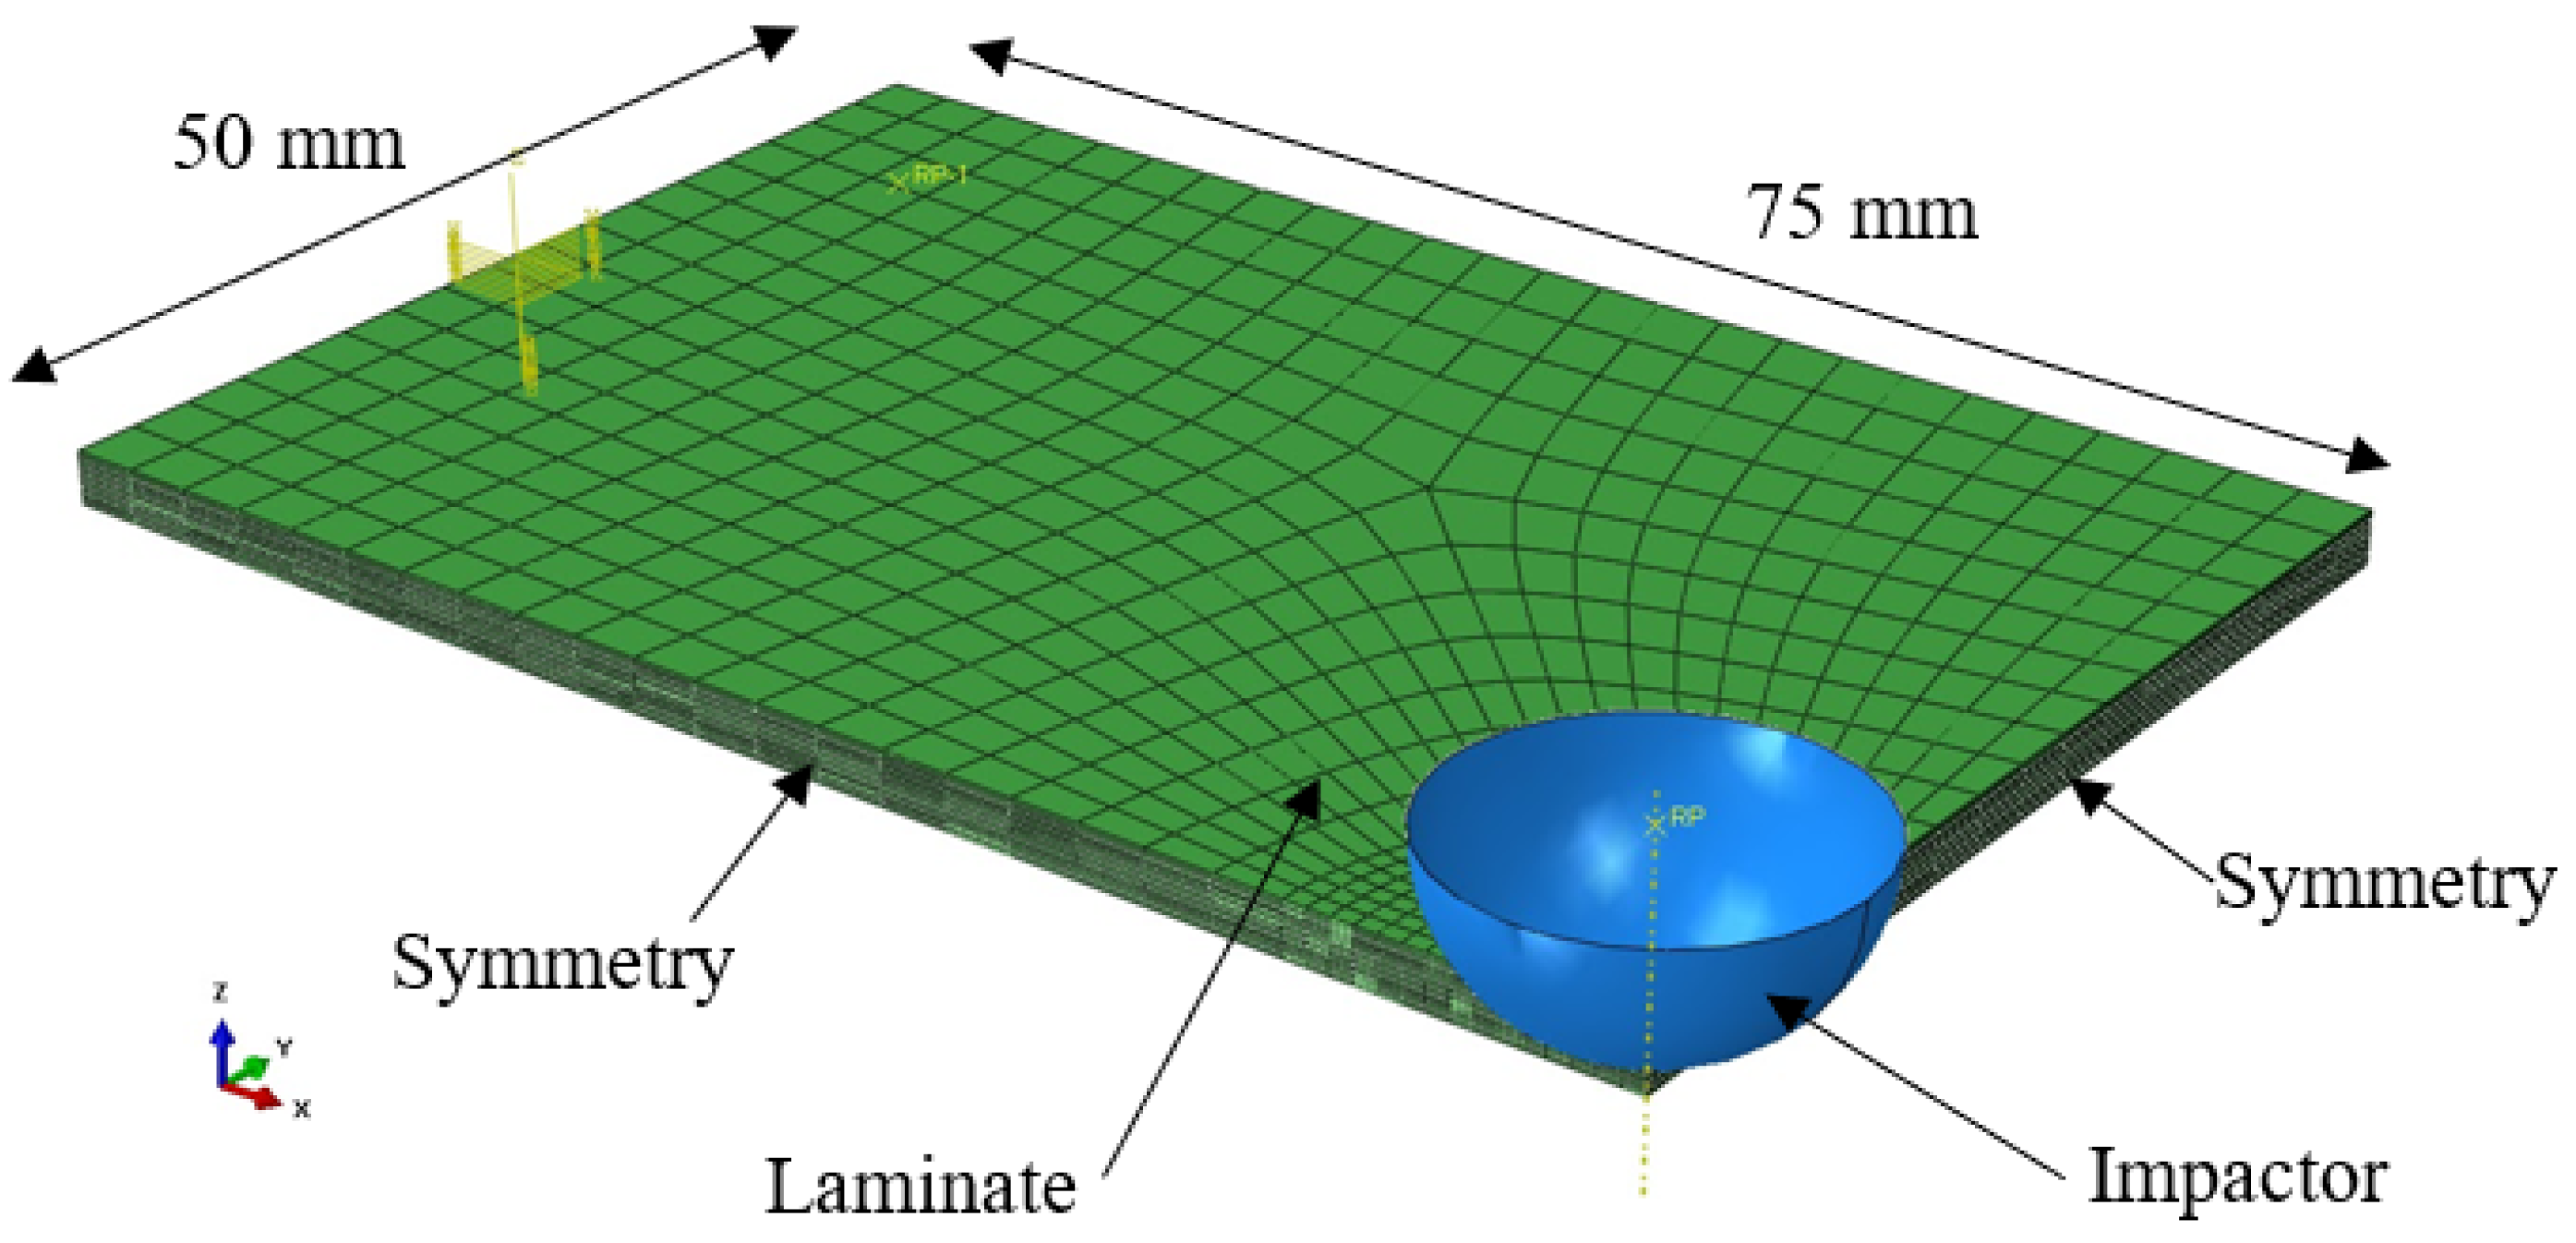
2.2.2. Abaqus Model
2.2.3. Data Augmentation
2.3. Input and Output Definitions
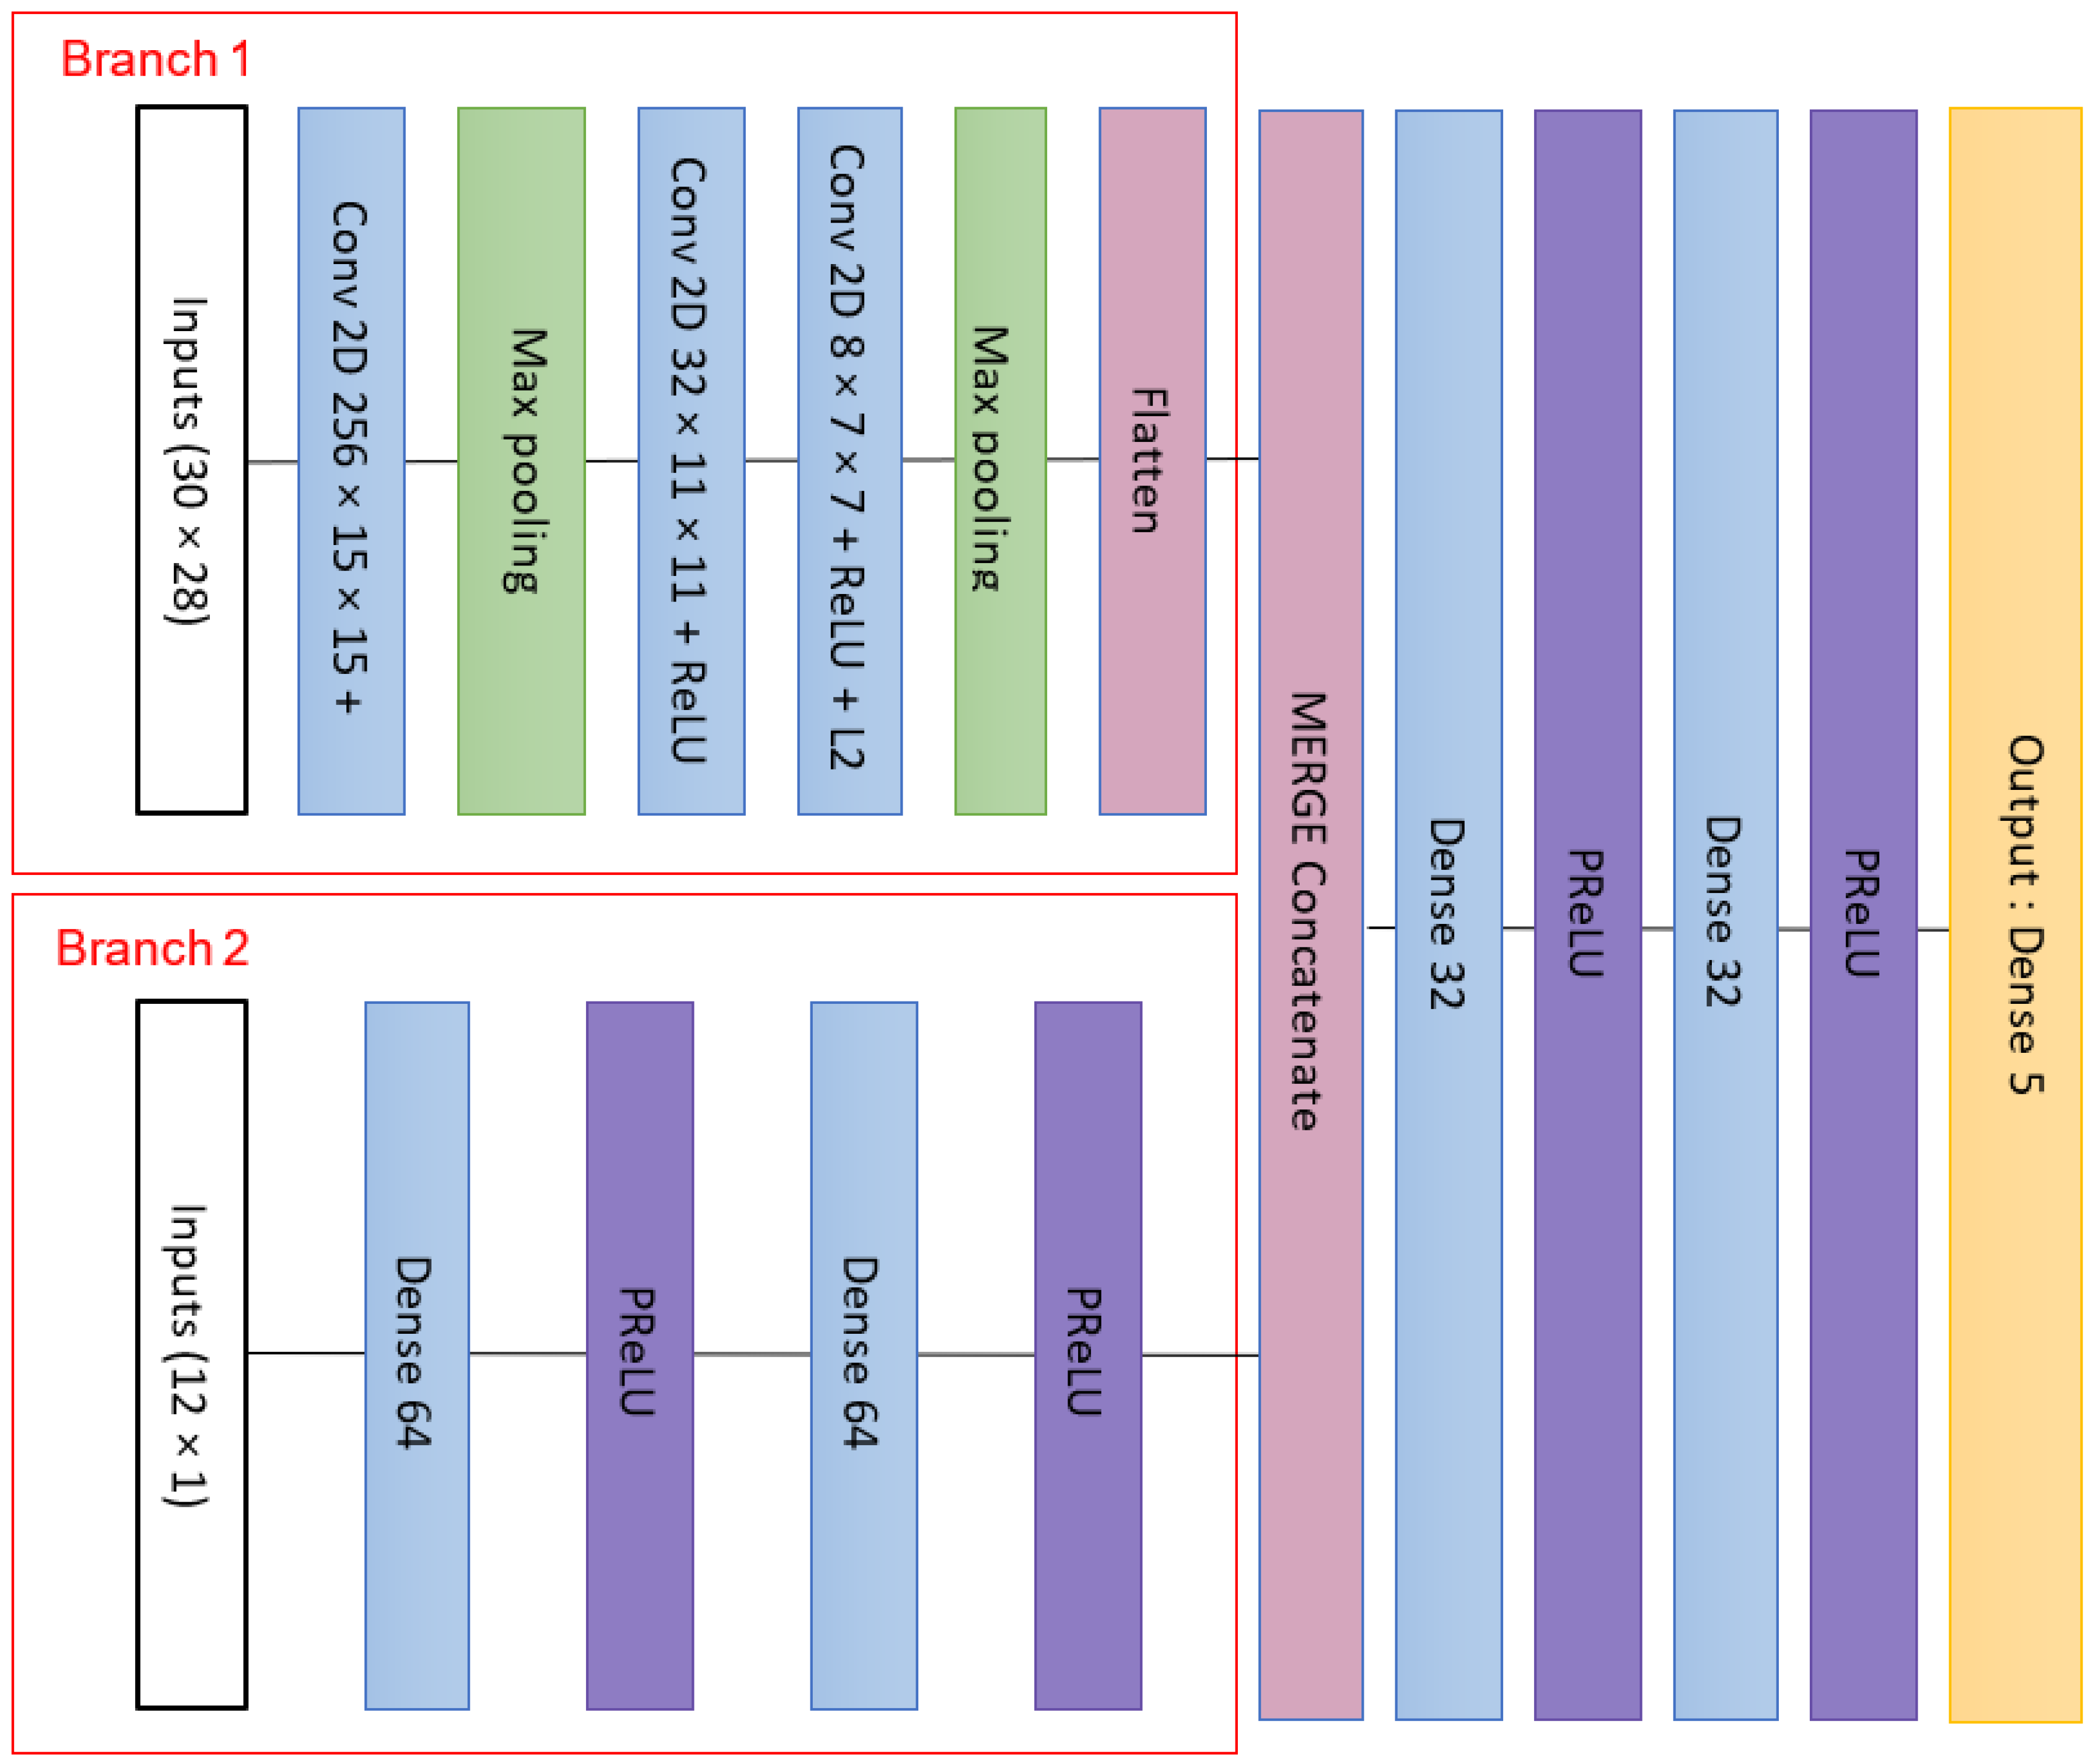
2.4. CNN Model’s Construction
2.4.1. Description of the First Supervised Network
2.4.2. Description of the Second Supervised Network (TwIN_Z6_Net)
3. Results and Discussion
3.1. First Supervised Network
3.2. Second Supervised Network
3.3. Perspective
4. Conclusions
Author Contributions
Funding
Institutional Review Board Statement
Informed Consent Statement
Data Availability Statement
Conflicts of Interest
References
- Flore, D.; Wegener, K.; Mayer, H.; Karr, U.; Oetting, C.C. Investigation of the high and very high cycle fatigue behaviour of continuous fibre reinforced plastics by conventional and ultrasonic fatigue testing. Compos. Sci. Technol. 2017, 141, 130–136. [Google Scholar] [CrossRef]
- Bouvet, C.; Rivallant, S. 2—Damage tolerance of composite structures under low-velocity impact. In Dynamic Deformation, Damage and Fracture in Composite Materials and Structures; Silberschmidt, V.V., Ed.; Woodhead Publishing: Sawston, UK, 2016; pp. 7–33. [Google Scholar] [CrossRef]
- Rozylo, P.; Debski, H.; Kubiak, T. A model of low-velocity impact damage of composite plates subjected to Compression-After-Impact (CAI) testing. Compos. Struct. 2017, 181, 158–170. [Google Scholar] [CrossRef]
- Dubary, N.; Bouvet, C.; Rivallant, S.; Ratsifandrihana, L. Damage tolerance of an impacted composite laminate. Compos. Struct. 2018, 206, 261–271. [Google Scholar] [CrossRef]
- Morteau, E.; Fualdesairbus, C. Damage Tolerance Philosophy. In Proceedings of the FAA Workshop for Composite Damage Tolerance and Maintenances, Chicago, IL, USA, 19–21 July 2006. [Google Scholar]
- Abrate, S. Impact on Composite Structures; Cambridge University Press: New York, NY, USA, 2005. [Google Scholar]
- Hongkarnjanakul, N.; Bouvet, C.; Rivallant, S. Validation of low velocity impact modelling on different stacking sequences of CFRP laminates and influence of fibre failure. Compos. Struct. 2013, 106, 549–559. [Google Scholar] [CrossRef]
- Cantwell, W.J.; Morton, J. The impact resistance of composite materials—A review. Composites 1991, 22, 347–362. [Google Scholar] [CrossRef]
- Tropis, A.; Thomas, M.; Bounie, J.L.; Lafon, P. Certification of the Composite Outer Wing of the ATR72. Proc. Inst. Mech. Eng. Part G J. Aerosp. Eng. 1995, 209, 327–339. [Google Scholar] [CrossRef]
- Rouchon, J. Certification of Large Aircraft Composite Structures, Recent Progress and New Trends in Compliance Philosophy. In ICAS Congress Proceedings; American Institute of Aeronautics and Astronautics: Reston, VA, USA, 1990. [Google Scholar]
- Caprino, G.; Lopresto, V. The significance of indentation in the inspection of CFRP panels damaged by low-velocity impact. Compos. Sci. Technol. Compos. Sci. Technol. 2000, 60, 1003–1012. [Google Scholar] [CrossRef]
- Cheng, Z.; Zhang, L.; Jiang, C.; Dai, Y.; Meng, C.; Luo, L.; Liu, X. Aramid fiber with excellent interfacial properties suitable for resin composite in a wide polarity range. Chem. Eng. J. 2018, 347, 483–492. [Google Scholar] [CrossRef]
- ASTMD7136/D7136M; Standard Test Method for Measuring the Damage Resistance of a Fiber-Reinforced Polymer Matrix Composite to a Drop-Weight Impact Event. ASTM International: West Conshohocken, PA, USA, 2015.
- Huang, K.; de Boer, A.; Akkerman, R. Analytical Modeling of Impact Resistance and Damage Tolerance of Laminated Composite Plates. AIAA J. 2008, 46, 2760–2772. [Google Scholar] [CrossRef]
- Olsson, R. Analytical prediction of large mass impact damage in composite laminates. Compos. Part Appl. Sci. Manuf. 2001, 32, 1207–1215. [Google Scholar] [CrossRef]
- Kutlu, Z.; Chang, F. Modeling Compression Failure of laminated Composites Containing Multiple Through-the-Width Delaminations. J. Compos. Mater. 1992, 26, 350–387. [Google Scholar] [CrossRef]
- Wisnom, M.R. Modelling discrete failures in composites with interface elements. Compos. Part Appl. Sci. Manuf. 2010, 41, 795–805. [Google Scholar] [CrossRef]
- Lopes, C.S.; Sádaba, S.; González, C.; Llorca, J.; Camanho, P. Physically-Sound Simulation of Low-Velocity Impact on Fibre Reinforced Laminates. Int. J. Impact Eng. 2015, 92, 3–17. [Google Scholar] [CrossRef]
- Hornik, K.; Stinchcombe, M.; White, H. Multilayer feedforward networks are universal approximators. Neural Netw. 1989, 2, 359–366. [Google Scholar] [CrossRef]
- Manry, M.T. Neural networks: Algorithms, applications, and programming techniques: By James A. Freeman and David M. Skapura, Addison-Wesley Publishing, Reading, MA, ISBN 0-201-51376-5. Neural Netw. 1994, 7, 209–212. [Google Scholar] [CrossRef]
- Schmidhuber, J. Deep learning in neural networks: An overview. Neural Netw. 2015, 61, 85–117. [Google Scholar] [CrossRef]
- Azimi, M.; Eslamlou, A.D.; Pekcan, G. Data-Driven Structural Health Monitoring and Damage Detection through Deep Learning: State-of-the-Art Review. Sensors 2020, 20, 2778. [Google Scholar] [CrossRef]
- Mishkin, D.; Sergievskiy, N.; Matas, J. Systematic evaluation of convolution neural network advances on the Imagenet. Comput. Vis. Image Underst. 2017, 161, 11–19. [Google Scholar] [CrossRef]
- Nelon, C.; Myers, O.; Hall, A. The intersection of damage evaluation of fiber-reinforced composite materials with machine learning: A review. J. Compos. Mater. 2022, 56, 002199832110370. [Google Scholar] [CrossRef]
- Gu, J.; Wang, Z.; Kuen, J.; Ma, L.; Shahroudy, A.; Shuai, B.; Liu, T.; Wang, X.; Wang, G.; Cai, J.; et al. Recent advances in convolutional neural networks. Pattern Recognit. 2018, 77, 354–377. [Google Scholar] [CrossRef]
- Sony, S.; Dunphy, K.; Sadhu, A.; Capretz, M. A systematic review of convolutional neural network-based structural condition assessment techniques. Eng. Struct. 2021, 226, 111347. [Google Scholar] [CrossRef]
- Deng, K.; Liu, H.; Yang, L.; Addepalli, S.; Zhao, Y. Classification of barely visible impact damage in composite laminates using deep learning and pulsed thermographic inspection. Neural Comput. Applic. 2023, 35, 11207–11221. [Google Scholar] [CrossRef]
- Hasebe, S.; Higuchi, R.; Yokozeki, T.; Takeda, S. Multi-task learning application for predicting impact damage-related information using surface profiles of CFRP laminates. Compos. Sci. Technol. 2023, 231, 109820. [Google Scholar] [CrossRef]
- Alhammad, M.S.; Avdelidis, N.; Ibarra Castanedo, C.; Torbali, M.E. Automated Impact Damage Detection Technique for Composites Based on Thermographic Image Processing and Machine Learning Classification. Sensors 2022, 22, 9031. [Google Scholar] [CrossRef]
- Hasebe, S.; Higuchi, R.; Yokozeki, T.; Takeda, S. Internal low-velocity impact damage prediction in CFRP laminates using surface profiles and machine learning. Compos. Part B Eng. 2022, 237, 109844. [Google Scholar] [CrossRef]
- Zargar, S.; Yuan, F.-G. Impact diagnosis in stiffened structural panels using a deep learning approach. Struct. Health Monit. 2020, 20, 147592172092504. [Google Scholar] [CrossRef]
- Wei, Z.; Fernandes, H.; Herrmann, H. A Deep Learning Method for the Impact Damage Segmentation of Curve-Shaped CFRP Specimens Inspected by Infrared Thermography. Sensors 2021, 21, 395. [Google Scholar] [CrossRef]
- Jung, K.-C.; Chang, S.-H. Advanced Deep Learning Model-Based Impact Characterization Method for Composite Laminates. Compos. Sci. Technol. 2021, 220, 108713. [Google Scholar] [CrossRef]
- Ahmed, O.; Wang, X.; Tran, M.-V.; Ismadi, M.-Z. Advancements in fiber-reinforced polymer composite materials damage detection methods: Towards achieving energy-efficient SHM systems. Compos. Part B Eng. 2021, 223, 109136. [Google Scholar] [CrossRef]
- Tabatabaeian, A.; Jerkovic, B.; Harrison, P.; Marchiori, E.; Fotouhi, M. Barely visible impact damage detection in composite structures using deep learning networks with varying complexities. Compos. Part B Eng. 2023, 264, 110907. [Google Scholar] [CrossRef]
- Pilania, G.; Wang, C.; Jiang, X.; Rajasekaran, S.; Ramprasad, R. Accelerating materials property predictions using machine learning. Sci. Rep. 2013, 3, 2810. [Google Scholar] [CrossRef] [PubMed]
- Rong, Q.; Wei, H.; Bao, H. Deep learning methods based on cross-section images for predicting effective thermal conductivity of composites. arXiv 2019, arXiv:1904.06104. [Google Scholar]
- Ashank; Chakravarty, S.; Garg, P.; Kumar, A.; Agrawal, M.; Agnihotri, P. Deep neural networks based predictive-generative framework for designing composite materials. Model. Simul. Mater. Sci. Eng. 2022, 30, 075003. [Google Scholar] [CrossRef]
- Yang, C.; Kim, Y.; Ryu, S.; Gu, G.X. Using convolutional neural networks to predict composite properties beyond the elastic limit. MRS Commun. 2019, 9, 609–617. [Google Scholar] [CrossRef]
- Yang, C.; Kim, Y.; Ryu, S.; Gu, G.X. Prediction of composite microstructure stress-strain curves using convolutional neural networks. Mater. Des. 2020, 189, 108509. [Google Scholar] [CrossRef]
- Liu, X.; Tian, S.; Tao, F.; Yu, W. A review of artificial neural networks in the constitutive modeling of composite materials. Compos. Part B Eng. 2021, 224, 109152. [Google Scholar] [CrossRef]
- Kollmann, H.T.; Abueidda, D.W.; Koric, S.; Guleryuz, E.; Sobh, N.A. Deep learning for topology optimization of 2D metamaterials. Mater. Des. 2020, 196, 109098. [Google Scholar] [CrossRef]
- Xue, T.; Beatson, A.; Chiaramonte, M.; Roeder, G.; Ash, J.T.; Menguc, Y.; Adriaenssens, S.; Adams, R.P.; Mao, S. A data-driven computational scheme for the nonlinear mechanical properties of cellular mechanical metamaterials under large deformation. Soft Matter 2020, 16, 7524–7534. [Google Scholar] [CrossRef]
- Jiao, P.; Alavi, A.H. Artificial intelligence-enabled smart mechanical metamaterials: Advent and future trends. Int. Mater. Rev. 2021, 66, 365–393. [Google Scholar] [CrossRef]
- Liu, X.; Gasco, F.; Goodsell, J.; Yu, W. Initial failure strength prediction of woven composites using a new yarn failure criterion constructed by deep learning. Compos. Struct. 2019, 230, 111505. [Google Scholar] [CrossRef]
- Abueidda, D.; Koric, S.; Sobh, N. Topology optimization of 2D structures with nonlinearities using deep learning. Comput. Struct. 2020, 237, 106283. [Google Scholar] [CrossRef]
- Qiu, A.; Fu, K.; Lin, W.; Zhao, C.; Tang, Y. Modelling low-speed drop-weight impact on composite laminates. Mater. Des. 2014, 60, 520–531. [Google Scholar] [CrossRef]
- Vieille, B.; Casado, V.M.; Bouvet, C. Influence of matrix toughness and ductility on the compression-after-impact behavior of woven-ply thermoplastic- and thermosetting-composites: A comparative study. Compos. Struct. 2014, 110, 207–218. [Google Scholar] [CrossRef]
- Bandaru, A.K.; Chavan, V.V.; Ahmad, S.; Alagirusamy, R.; Bhatnagar, N. Low velocity impact response of 2D and 3D Kevlar/polypropylene composites. Int. J. Impact Eng. 2016, 93, 136–143. [Google Scholar] [CrossRef]
- Usta, F.; Türkmen, H.S.; Scarpa, F. Low-velocity impact resistance of composite sandwich panels with various types of auxetic and non-auxetic core structures. Thin-Walled Struct. 2021, 163, 107738. [Google Scholar] [CrossRef]
- Bhuiyan, M.d.A.; Hosur, M.V.; Jeelani, S. Low-velocity impact response of sandwich composites with nanophased foam core and biaxial (±45°) braided face sheets. Compos. Part B Eng. 2009, 40, 561–571. [Google Scholar] [CrossRef]
- Sun, X.C.; Hallett, S.R. Barely visible impact damage in scaled composite laminates: Experiments and numerical simulations. Int. J. Impact Eng. 2017, 109, 178–195. [Google Scholar] [CrossRef]
- Petit, S. Contribution à L’étude de L’influence D’une Protection Thermique sur la Tolérance aux Dommages des Structures Composites des Lanceurs. Ph.D. Thesis, University of ENSAE, Palaiseau, France, 2005. [Google Scholar]
- Hongkarnjanakul, N. Modélisation Numérique Pour la Tolérance aux Dommages D’impact sur Stratifié Composite: De L’impact à la Résistance Résiduelle en Compression. Doctoral Dissertation, ISAE, Toulouse, France, 2013. [Google Scholar]
- ISAE-SUPAERO. Fourcroyd Influence de L’armure et des Conditions de Fabrication sur le Comportement a L’impact d’un Stratifie Composite Tisse Carbone/pps; ISAE-SUPAERO: Toulouse, France, 2013. [Google Scholar]
- Broll, B. Experimental Studies on the Damage Mechanisms of CFRP-Structures. Ph.D. Thesis, ISAE-SUPAERO/Lehrstuhl fur Leichtbau, Toulouse, France, 2008. [Google Scholar]
- Warren, T.L.; Tabbara, M.R. Simulations of the penetration of 6061-T6511 aluminum targets by spherical-nosed VAR 4340 steel projectiles. Int. J. Solids Struct. 2000, 37, 4419–4435. [Google Scholar] [CrossRef]
- Abdulhamid, H.; Bouvet, C.; Michel, L.; Aboissiere, J.; Minot, C. Numerical simulation of impact and compression after impact of asymmetrically tapered laminated CFRP. Int. J. Impact Eng. 2016, 95, 154–164. [Google Scholar] [CrossRef]
- TORAYCA T700S DataSheet, n.d. Available online: https://www.rockwestcomposites.com/downloads/T700SDataSheet.pdf (accessed on 15 May 2015).
- Bieling, U. AIRBUS Reference Structure Design Principles the basis for A350XWB design. In 8th CFK-Valley Stade Convention; YUMPU: Ottenbecker, Germany, 2014. [Google Scholar]
- Abueidda, D.W.; Almasri, M.; Ammourah, R.; Ravaioli, U.; Jasiuk, I.M.; Sobh, N.A. Prediction and optimization of mechanical properties of composites using convolutional neural networks. Compos. Struct. 2019, 227, 111264. [Google Scholar] [CrossRef]
- Bishop, C.M.; Nasrabadi, N.M. Pattern Recognition and Machine Learning; Springer: New York, NY, USA, 2006. [Google Scholar]
- ASTM D7137/D7137M-17; Standard Test Method for Compressive Residual Strength Properties of Damaged Polymer Matrix Composite Plates. ASTM International: West Conshohocken, PA, USA, 2011.


| Samples Parameters | Impact Test Parameters | Impact Test Results |
|---|---|---|
| In-plane Young’s modulus (GPa) | Impact window (mm2) | Permanent indentation (mm) |
| Stacking (orientation of each ply) | Energy of impact (J) | Maximum displacement (mm) |
| Laminate thickness (mm) | Symmetrical test plate? (1 for yes, 0 for no) | Maximum force (kN) |
| Material reference (T700...) | Is the test dynamic or static? (1 for dynamic, 0 for static) | Delaminated area (mm2) |
| Type of carbon (pre-impregnated or dry) | Is there perforation? (1 for yes, 0 for no) | |
| Thermal protection (1 for yes, 0 for no) | Is there delamination? (1 for yes, 0 for no) | |
| Resin type (epoxy…) | ||
| Resin proportion (integer between 0 and 1) | ||
| Resin property GIIC (N/mm) | ||
| Number of plies (integer) | ||
| Sandwich core type (honeycomb, foam…) | ||
| Sandwich core thickness (mm) | ||
| Fiber weaving (woven or unidirectional) |
| Properties | |
|---|---|
| Tensile modulus (GPa) | 135 |
| Tensile strength (MPa) | 2550 |
| Compression strength (MPa) | 1470 |
| Flexural modulus (GPa) | 120 |
| Flexural strength (MPa) | 1670 |
| Number of Plies | Stacking | Energy of Impact (J) |
|---|---|---|
| 8 | [45/−45/45/−45]s | 2.3 |
| [45/−45/45/−45]s | 4 | |
| [0/45/−45/90]s | 4 | |
| [0/45/−45/90]s | 9 | |
| [0/45/−45/90]s | 11.5 | |
| [0/90/0/90]s | 11.5 | |
| [0/90/0/90]s | 16.8 | |
| [45/90/−45/90]s | 3.6 | |
| [45/0/−45/0]s | 13.6 | |
| [45/0/−45/0]s | 18.48 | |
| 12 | [45/−45/−45/45/0/0]s | 8.992 |
| [45/−45/90/90/90/90]s | 1.688 | |
| [45/−45/−45/45/0/0]s | 10.8 | |
| [45/−45/−45/45/90/90]s | 2.558 | |
| [45/−45/0/0/0/0]s | 15.9 | |
| [45/−45/−90/−45/45/0]s | 6.244 | |
| [0/0/45/−45/90/90]s | 10.23 | |
| [0/45/−45/−45/45/90]s | 6.244 | |
| [0/0/0/45/−45/90]s | 15.985 | |
| [90/90/90/45/−45/0]s | 5.755 | |
| [0/0/45/−45/90/90]s | 12.948 | |
| [0/45/−45/−45/45/90]s | 8.402 | |
| [0/0/0/45/−45/90]s | 18.473 | |
| 16 | [45/−45/0/−45/45/45/−45/90]s | 2.248 |
| [45/−45/0/0/−45/45/90/90]s | 2.25 | |
| [45/0/−45/−45/0/45/92/90]s | 2.247 | |
| [−45/45/0/0/0/45/−45/90]s | 2.247 | |
| [45/0/0/−45/−45/90/90/45]s | 2.247 | |
| [−45/0/0/45/90/90/90/45]s | 2.249 | |
| [45/0/0/0/0/−45/90/90]s | 7.84 | |
| [45/0/−45/90/−45/0/45/90]s | 7.83 | |
| [45/−45/0/−45/45/45/−45/90]s | 3.237 | |
| [−45/0/0/45/90/90/90/45]s | 6.243 | |
| [45/−45/0/−45/45/45/−45/90]s | 3.996 | |
| [45/−45/0/0/−45/45/90/90]s | 7.83 | |
| [45/0/−45/−45/0/45/90/90]s | 7.831 | |
| [−45/45/0/0/0/45/−45/90]s | 6.242 | |
| [45/0/0/−45/−45/90/90/45]s | 6.243 | |
| [45/−45/0/−45/45/45/−45/90]s | 4.4 | |
| [−45/45/0/0/0/45/−45/90]s | 7.83 | |
| [45/0/0/−45/−45/90/90/45]s | 7.28 | |
| [45/0/0/0/0/−45/90/90]s | 8.989 | |
| [45/0/0/0/0/−45/90/90]s | 11.546 |
| Composite Layer | ||||||||
|---|---|---|---|---|---|---|---|---|
| 1 | 2 | 3 | 4 | 5 | 6 | 7 | 8 | |
| 0° orientation | 1 | 0 | 0 | 0 | 0 | 0 | 0 | 1 |
| +45° orientation | 0 | 1 | 0 | 0 | 0 | 0 | 1 | 0 |
| −45° orientation | 0 | 0 | 1 | 0 | 0 | 1 | 0 | 0 |
| 90° orientation | 0 | 0 | 0 | 1 | 1 | 0 | 0 | 0 |
| Unidirectional or woven | 1 | 1 | 1 | 0 | 0 | 1 | 1 | 1 |
| Carbon fibers | 1 | 1 | 1 | 1 | 1 | 1 | 1 | 1 |
| Glass fibers | 0 | 0 | 0 | 0 | 0 | 0 | 0 | 0 |
| Kevlar fibers | 0 | 0 | 0 | 0 | 0 | 0 | 0 | 0 |
| Graphite fibers | 0 | 0 | 0 | 0 | 0 | 0 | 0 | 0 |
| Prepreg or ‘dry’ | 1 | 1 | 1 | 1 | 1 | 1 | 1 | 1 |
| Core material | 0 | 0 | 0 | 0 | 0 | 0 | 0 | 0 |
| Average Error of Maximum Force (kN) | Average Error of Maximum Displacement (mm) | Average Error of Permanent Indentation (mm) | Average Error of Delamination Index | Average Error of Delaminated Surface (mm2) | |
|---|---|---|---|---|---|
| Standard output | 0.30 | 0.35 | 0.48 | 0.30 | 62.17 |
| Normalized outputs | 0.23 | 0.25 | 0.28 | 0.05 | 76.56 |
| Improvement between standard and normalized output | 0.07 | 0.1 | 0.2 | 0.25 | −14.39 |
| TwIN_Z6_Net | 0.16 | 0.15 | 0.13 | 0.02 | 56.36 |
Disclaimer/Publisher’s Note: The statements, opinions and data contained in all publications are solely those of the individual author(s) and contributor(s) and not of MDPI and/or the editor(s). MDPI and/or the editor(s) disclaim responsibility for any injury to people or property resulting from any ideas, methods, instructions or products referred to in the content. |
© 2023 by the authors. Licensee MDPI, Basel, Switzerland. This article is an open access article distributed under the terms and conditions of the Creative Commons Attribution (CC BY) license (https://creativecommons.org/licenses/by/4.0/).
Share and Cite
Mezeix, L.; Rivas, A.S.; Relandeau, A.; Bouvet, C. A New Method to Predict Damage to Composite Structures Using Convolutional Neural Networks. Materials 2023, 16, 7213. https://doi.org/10.3390/ma16227213
Mezeix L, Rivas AS, Relandeau A, Bouvet C. A New Method to Predict Damage to Composite Structures Using Convolutional Neural Networks. Materials. 2023; 16(22):7213. https://doi.org/10.3390/ma16227213
Chicago/Turabian StyleMezeix, Laurent, Ainhoa Soldevila Rivas, Antonin Relandeau, and Christophe Bouvet. 2023. "A New Method to Predict Damage to Composite Structures Using Convolutional Neural Networks" Materials 16, no. 22: 7213. https://doi.org/10.3390/ma16227213
APA StyleMezeix, L., Rivas, A. S., Relandeau, A., & Bouvet, C. (2023). A New Method to Predict Damage to Composite Structures Using Convolutional Neural Networks. Materials, 16(22), 7213. https://doi.org/10.3390/ma16227213