Article

Mechanism and Kinetics of the Phase Formation and Dissolution of NaxWO3 on a Pt Electrode in a Na2WO4–WO3 Melt

by
Alexander V. Kosov
*,
Olga V. Grishenkova
*,
Olga L. Semerikova
,
Sergey V. Vakarin
and
Yuriy P. Zaikov
Institute of High Temperature Electrochemistry, Ural Branch of the Russian Academy of Sciences, Yekaterinburg 620990, Russia
*
Authors to whom correspondence should be addressed.
Materials 2023, 16(22), 7207; https://doi.org/10.3390/ma16227207
Submission received: 27 October 2023 / Revised: 11 November 2023 / Accepted: 14 November 2023 / Published: 17 November 2023
(This article belongs to the Special Issue Electrochemical Phase Formation of Materials and Its Modeling)

Abstract

:
A comprehensive study concerning the phase formation mechanism and growth/dissolution kinetics of sodium tungsten bronze crystals during the electrolysis of a 0.8Na2WO4–0.2WO3 melt was carried out. The regularities of deposit formation on a Pt(111) working electrode were investigated experimentally using cyclic voltammetry, chronoamperometry, scanning electron microscopy, and X-ray diffraction analysis. Models have been developed to calculate the current response during the formation, growth and dissolution of a two-phase deposit consisting of NaxWO3 and metallic tungsten or two oxide tungsten bronzes with different sodium content. These models consider mass transfer to the electrode and nuclei; chemical and electrochemical reactions with the participation of polytungstate ions, Na+, Na0, and O2−; as well as the ohmic drop effect. The approach was proposed to describe the dissolution of an NaxWO3 crystal with a nonuniform sodium distribution. The fitting of cyclic voltammograms was performed using the Levenberg–Marquardt algorithm. The NaxWO3 formation/growth/dissolution mechanism was determined. Concentration profiles and diffusion coefficients of [WnO3n], reaction rate constants, number density of nuclei, and time dependencies of crystal size were calculated. The proposed approaches and models can be used in other systems for the cyclic voltammogram analysis and study of the mechanism and kinetics of electrode processes complicated by phase formation; parallel and sequential electrochemical and chemical reactions; as well as the formation of a deposit characterized by a nonuniform phase and/or chemical composition.

1. Introduction

Oxide tungsten bronzes (OTBs) are nonstoichiometric compounds with the general formula MxWO3, where M is an element of the first or second groups of the periodic table, more often an alkali metal, and 0 < x < 1. Alkali metal ions are located inside channels formed by WO6 octahedra connected through a common bridging oxygen atom [1,2]. The symmetry of the OTB structure decreases as the value of x decreases, and the transition occurs from cubic (Figure S1) to tetragonal and hexagonal “tunnel” structures, which causes a cardinal change in the electrical, optical, and magnetic properties of MxWO3. Combinations of useful characteristics, including a wide range of electrophysical properties [3,4,5,6,7,8], a large color range, high corrosion resistance in water and acids, selectivity to certain cation types in aqueous solutions, etc. [9,10,11,12], allow the use of OTBs as electrodes in chemical analysis [12,13], sorbents [14,15], components of advanced materials [16,17,18,19,20] and anticorrosive coatings [21], and therapeutic agents [22]. OTB-based materials and OTB-containing hybrid systems are an inexpensive and highly efficient alternative in many important areas of catalysis and photocatalysis [23,24,25,26,27].
At present, there are many different methods for the synthesis of OTBs [24]. The electrochemical method based on the electrolysis of polytungstate melts has a number of advantages, including the low cost of the product, short synthesis time, nontoxicity (oxygen is released at the anode), and the ability to influence the composition and structure of OTBs by varying the electrolysis parameters [26,27,28,29,30,31]. However, the mechanism and kinetics of OTB electrodeposition are still poorly understood, which hinders effective control and production of OTBs with a given x value.
Various mechanisms for the formation and dissolution of OTBs in Na2WO4–WO3 melts were proposed based on the analysis of experimental dependencies obtained by electrochemical methods. In early works [30,31], it was suggested that the electroreduction of monomers (WO3), tetramers ((WO3)4) and (WO3)18 occurs at the cathode in electrolytes with a mole fraction of tungsten trioxide up to 0.15, from 0.25 to 0.50, and over 0.50, respectively. Fredlein and Damjanovic [32] noted the discrepancy between these conclusions and the actual OTB composition. To explain the formation of cubic OTB with x from 0.6 to 0.8, they assumed either subsequent sodium discharge or loss of WO3 from the lattice of a low-sodium bronze (or directly from [Na(WO3)4]ad) prior to incorporation into the lattice. Moreover, a hypothesis was put forward about simultaneous bronze dissolution and sodium dissolution from the deposit [32]. Randin [33,34] believed that the electrodeposition of sodium tungsten bronzes from melts containing 10, 20 and 50 mol% WO3 is a complex reaction controlled by at least three processes including diffusion in the electrolyte, heterogeneous reaction (adion surface diffusion), and charge transfer. Elwell et al. [35] proposed a model considering the resistances of these stages and concluded that the growth rate of OTB crystals is determined by both interfacial kinetics and diffusion in the melt, since the growth rate of a single OTB crystal increases if it rotates.
Later, high-temperature studies [36,37] proved the existence of tetrahedral anions (WO4)2− in molten sodium tungstate and anionic chains (W2O7)2− in molten sodium ditungstate. Taking into account these data, Baraboshkin and Kaliev [25,38] proposed various schemes for the formation of a cathode deposit with the participation of both simple (W6+) and bound into stable groups ( WO 4 2 , W 2 O 7 2 , W 3 O 10 2 , W 4 O 13 2 ) tungsten-containing ions, and the lowest reduced forms ( WO n ( 2 n 5 ) ) soluble in the melt. Simulation results [29,39] indicated that the experimental facts cannot be explained without assuming the presence of more complex polymer groups ( W 3 O 10 2 , W 4 O 13 2 , etc.) at a WO3 mole fraction above 0.2. Vorozhbit et al. [40] supported this conclusion but believed that the electroreduction of small sized and highly mobile alkali metal cations occurs primarily, and then the neutral atoms M0 diffuse into the diffusion layer and reduce the polymerized anionic groups.
Drobasheva and Spitsyn [28] considered polytungstate melts to be polysalts of alkali monotungstates and nonstoichiometric tungsten oxides with an intermediate oxidation state from five to six. However, this assumption was refuted in recent studies of the structure of molten M2O–WO3 mixtures (M = Na, K, Li) by high-temperature in situ Raman spectroscopy in combination with DFT analysis [41,42,43,44,45]. In these works, the formation of [WO4]2−, [W2O7]2−, [W3O10]2−, and [W4O13]2− was only proved at M2O:WO3 ratios equal to 1:1, 1:2, 1:3, and 1:4, respectively.
Our comprehensive studies of the density and ionic equilibria in the Na2WO4–WO3 melt with a WO3 mole fraction up to 0.5 [46] indicate a more complex ionic composition and intricate dependencies of the equilibrium concentrations of Na+, WO 4 2 , W 2 O 7 2 , W 3 O 10 2 , W 4 O 13 2 , WO 2 2 + , and O2– ions on the ratio of components in the initial oxide–salt mixture.
In this work, we present the results of studying the formation/growth/dissolution of a cathode deposit containing cubic OTB and the kinetics of processes occurring in the electrolyte, at the electrolyte/electrode interface, and at the electrolyte/new-phase interface during the electrolysis of the 0.8Na2WO4–0.2WO3 molten mixture at 1023 K. Another purpose of this work is the development of a general method for modeling cyclic voltammograms suitable for extracting quantitative information about the parameters of an electrochemical process complicated by the presence of stages of a different nature (electrochemical phase formation and chemical reactions in the electrolyte bulk and on interfaces).

2. Materials and Methods

Sodium tungstate and tungsten trioxide (purity 99.9 wt%, Vecton, St.-Petersburg, RF) were used to prepare the 0.8Na2WO4–0.2WO3 melt. The reagents were dried at 523 K for 2 h and then mixed into a porcelain container. The prepared mixture was melted in a platinum crucible.
The experiments were carried out at 1023 K in air. Autolab PGSTAT302N with Nova 1.9 software was used for electrochemical measurements and electrodeposition. Platinum foil with (111) texture was used as the working electrode (4 mm × 11 mm × 0.1 mm). The foil was preliminarily annealed at 973 K for 2 h to remove surface impurities. A similar piece of platinum foil semi-immersed in the melt under examination served as a reference electrode. The platinum crucible served as the auxiliary electrode. The melt temperature was measured with a Pt/Pt-Rh thermocouple and controlled using a Varta TP703 temperature controller (Varta, Moscow, Russia) with an accuracy of ±1 K.
The morphology and elemental composition of the samples synthesized under potentiostatic conditions were studied by scanning electron microscopy (SEM–EDS) using a TESCAN MIRA 3 LMU electron microscope (TESCAN, Brno, Czech Republic) with an INCA Energy 350 microanalysis system and an Oxford Instruments X–MAX80 energy dispersive spectrometer. To determine the phase composition of cathode products, X-ray diffraction analysis of the samples was carried out using a RIGAKU D/MAX-2200VL/PC X-ray diffractometer (Rigaku Corp., Tokyo, Japan) in CuKα radiation. Before the studies, the samples were washed in an alkaline solution (10–15 wt % KOH) at room temperature for 12 h [47] and rinsed in distilled water and ethanol.

3. Experimental Results

3.1. Cyclic Voltammetry

Typical cyclic voltammograms (CVs) obtained by varying the reverse potential, Eλ (V), and the scan rate, ν (V·s−1), are shown in Figure 1a,b, respectively.
At Eλ ≤ −1.05 V (Figure 1a), a current loop A is formed in the cathode part. Such nucleation loops are often recorded during the formation and growth of an electrode deposit on an indifferent electrode [48,49,50,51,52]. In this case, a significant increase in the cathode current is associated with the appearance and growth of supercritical new-phase nuclei. An increase in the electroactive area, due to the growth of the deposit up to the transition to the anodic region, leads to a higher absolute value of the cathode current during scanning in the reverse direction than in the forward one at the same potential value.
Taking into account the data from the literature on the overpotentials required for the formation of OTBs and their quasi-equilibrium potentials in Na2WO4–WO3 melts [29], the hypothesis about the connection between current loop A and the electrocrystallization of OTBs seems plausible. However, the following feature of loop A should be noted. A further shift of the reverse potential in the negative direction usually leads to a gradual transformation of the loop into a peak of a diffuse nature [52], which is not observed in this system even at Eλ of about −2 V. In addition, the behavior of the anodic peaks A′ and A″ attracts attention. The position of peak A′ shifts in a positive direction and its amplitude increases as |Eλ| or ν increases (see Figure 1). At the same time, the anodic peak A″ demonstrates a decrease in amplitude as ν increases, which is typical for dissolution of the deposit [50,51]. Variation of the scan rate has little effect on the peak A″ position, while the growth of |Eλ| causes a noticeable positive shift of A″. The ratio of amplitudes A′ and A″ changes in favor of A″ when ν decreases or |Eλ| increases. There are various possible reasons for the above facts, including mixed mass transfer, the presence of several sequential or parallel electrode processes, and the nontrivial deposition/dissolution mechanism in this system.

3.2. Chronoamperometry

Figure 2 presents two typical chronoamperograms. In the range of potentials from −0.50 to −1.00 V (Figure 2a), the chronoamperograms demonstrate behavior similar to Cottrell’s dependence. Two regions can be conventionally distinguished on the chronoamperograms recorded at higher absolute values of the potential (Figure 2b).
The maximum and subsequent decrease in the cathode current can be seen in region I (see Figure 2b). The maximum is preceded by a minimum of the cathode current at t ≤ 0.06 s. An increase in |E| leads to an increase in |I| and a decrease in the time to reach extrema. This behavior is typical for nucleation/growth processes and is usually explained by an increase in the nuclei number density and the mutual influence of neighbors on the growth as the overpotential increases [53,54,55]. Some increase in the cathode current is observed in region II. The rise begins earlier the higher the |E| value.
The SEM-EDS (Figure 3 and Table 1) and XRD (Figure 4) data confirm that the change in the shape of the chronoamperograms at E ≤ −1.05 V is indeed associated with the formation of a cathode deposit.
At an electrodeposition time of about 5–10 s, the deposit predominantly consists of cubic crystals (Figure 3a,b) with the isostructural formula NaWO3 (Figure 4a). In addition, trace amounts of tungsten are also found on the surface of the platinum substrate (Figure 3c). An increase in the electrolysis time leads to a noticeable increase in the proportion of metallic tungsten in the deposit and the degree of electrode coverage with the deposit (Figure 3d and Figure 4b), which can explain the behavior seen in the chronoamperograms in region II. Figure 3 and Figure 4 also show that an increase in the absolute value of the potential promotes an increase in the average size and number of OTB and tungsten crystals, as well as a decrease in the sodium content in bronze.
A number of models have been developed which suggest analytical expressions for the analysis of the initial stages of electrochemical phase formation uncomplicated by any other chemical/electrochemical processes in cases of diffusion [53,56], kinetic [55,57], and mixed (diffusion + charge transfer) [58,59,60] growth control. Obviously the mechanism of deposit formation in our case is more complex, so none of these models can be directly used for treatment of chronoamperograms. Nevertheless, a comparison of the shape of I(t) dependencies in Figure 3b with [53,61] apparently allows us to exclude the hypothesis of purely diffusion controlled growth. In addition, the low filling of the substrate with the deposit at t close to the time corresponding to the current maximum contradicts the theory of growth controlled by the discharge of depositing ions under potentiostatic conditions [53,57].
Comparison with works investigating the influence of various factors (multi-stage process and mixed growth control [59,60,62,63], growth controlled by diffusion in a layer of finite thickness [64,65,66], and the migration effect [67,68,69]) on the current response under potentiostatic or potentiodynamic conditions indicates the need to consider combinations of these effects. Therefore, we used numerical simulation for a more detailed study of the mechanism and kinetics of deposit formation/dissolution in this system.

4. Models

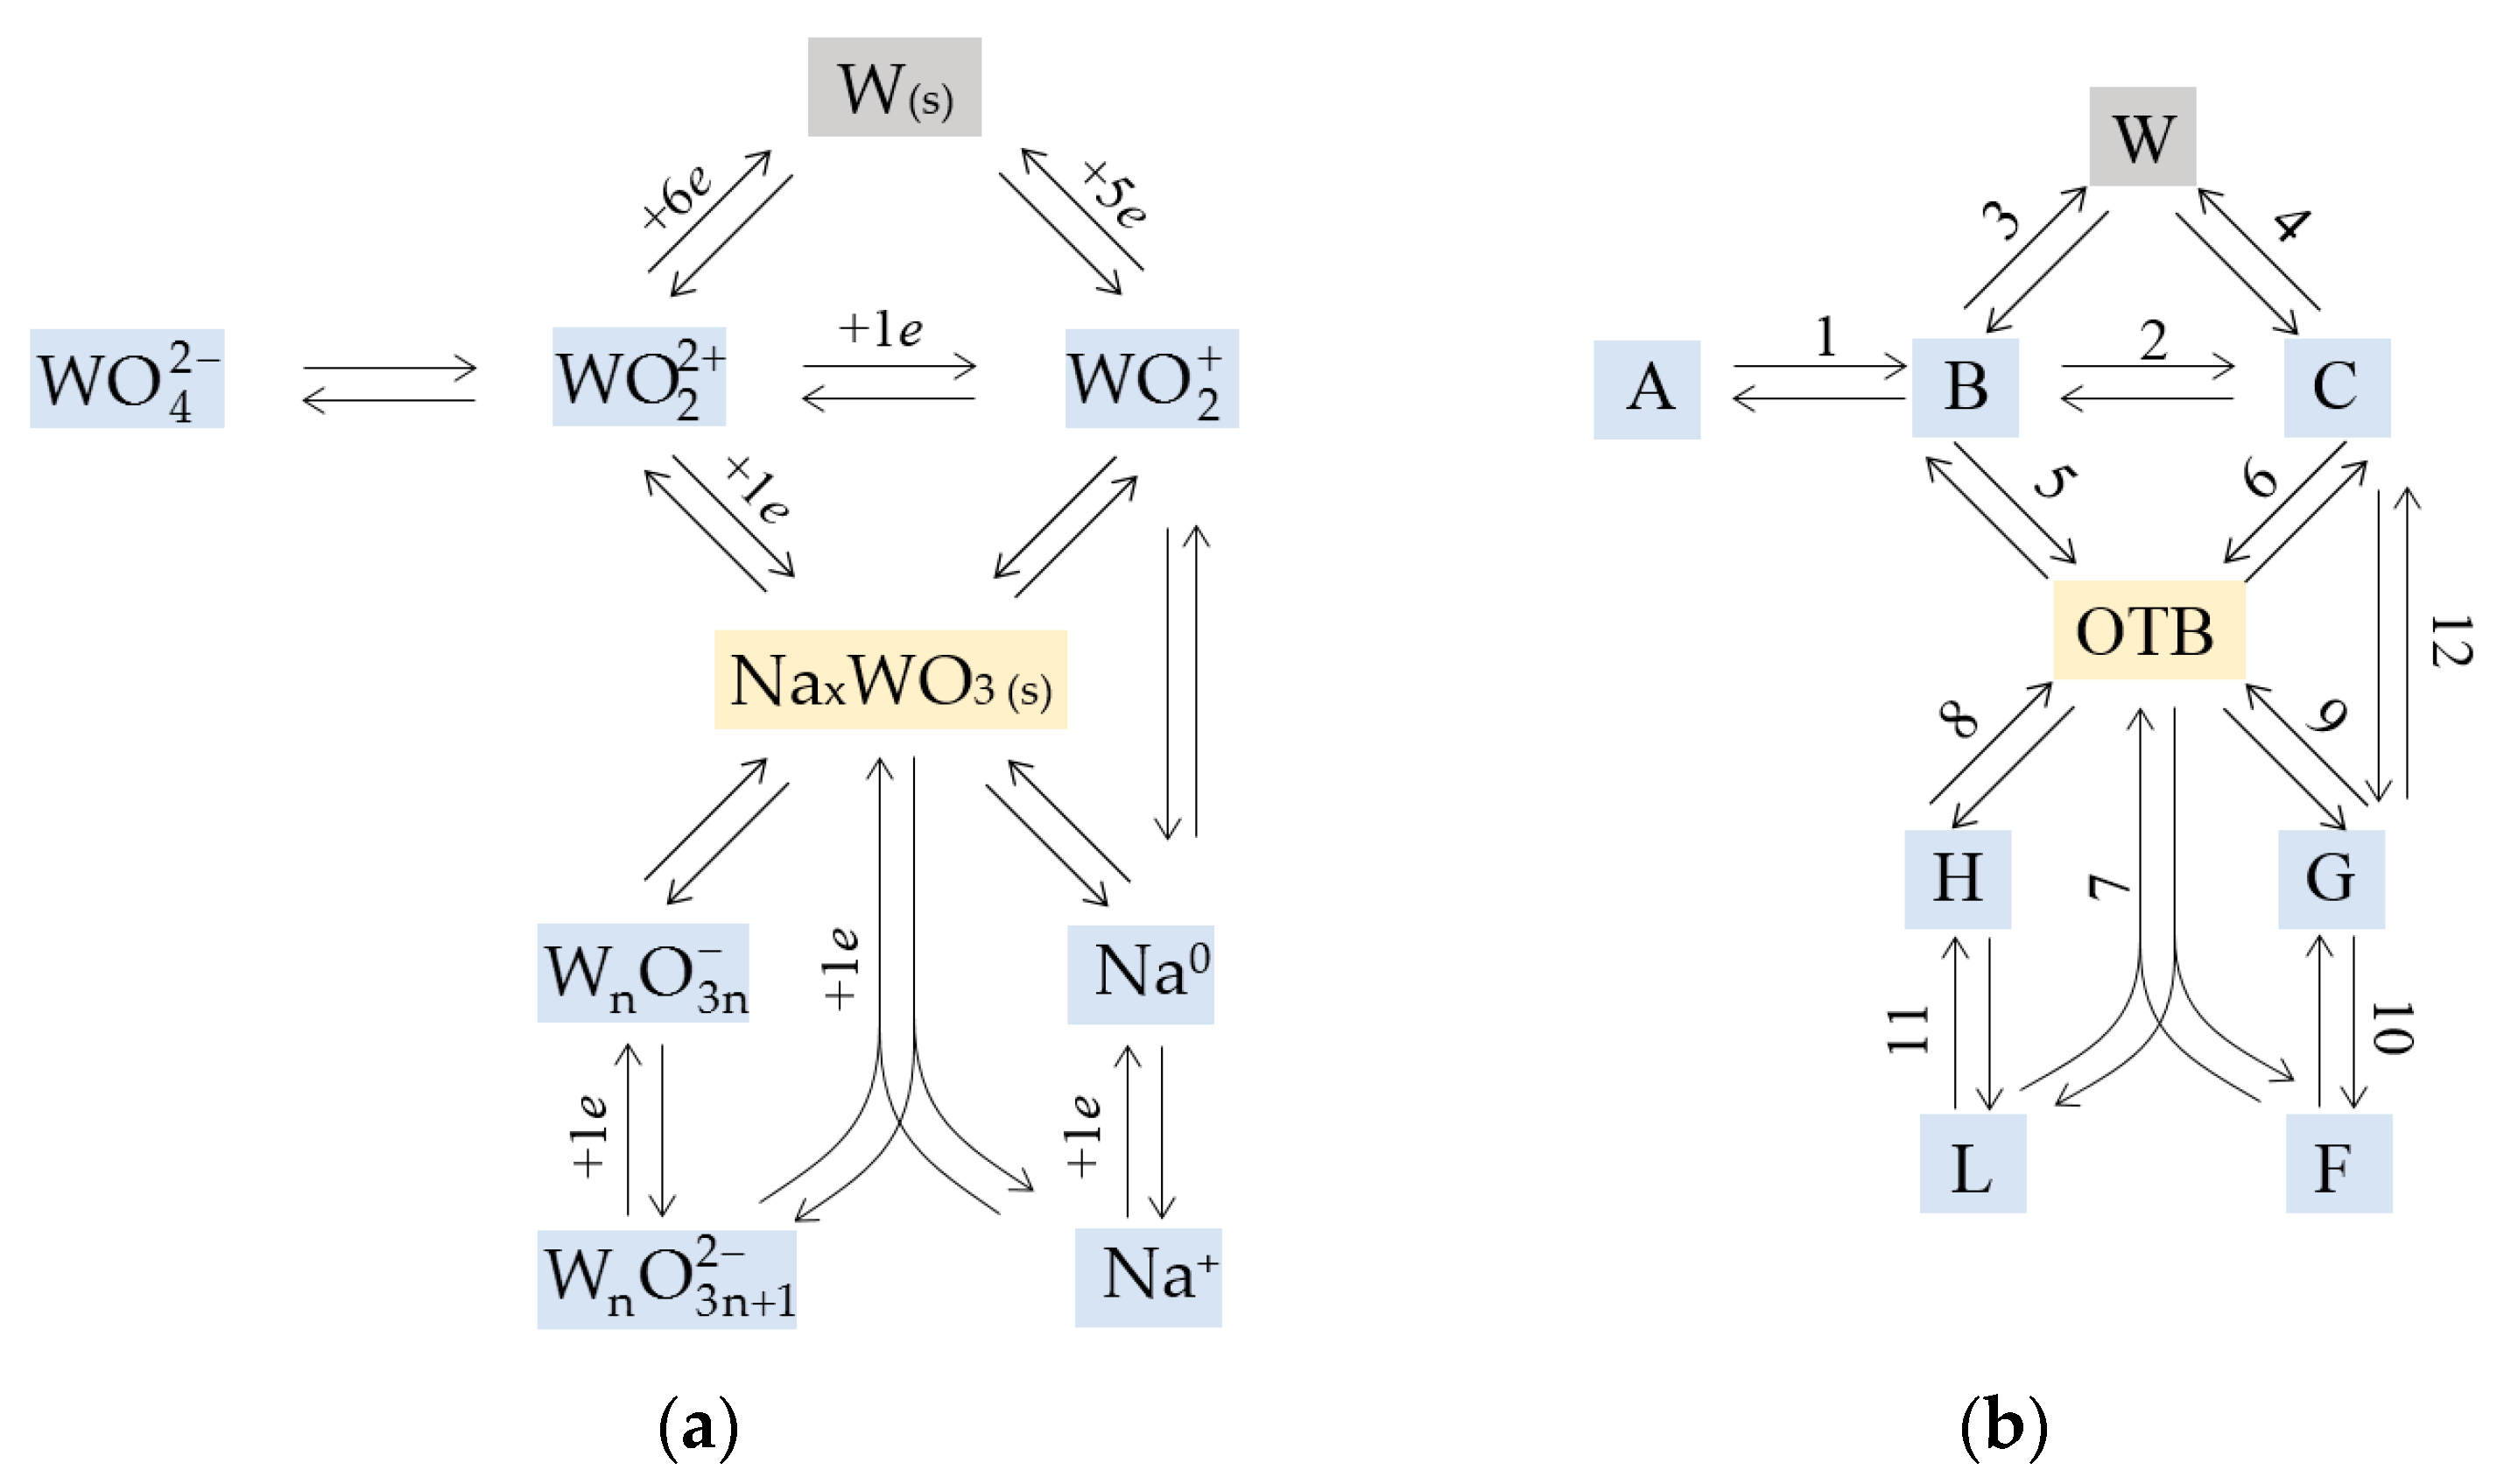
4.1. Deposit Consisting of OTB and Tungsten

Let us assume that the formation of OTB can be realized due to the occurrence of both electrochemical processes involving WO 2 2 + , W n O 3 n + 1 2 and Na+ ions and chemical processes involving WO 2 + , W n O 3 n and Na0, while the formation of metallic tungsten occurs as a result of electroreduction of WO 2 2 + , WO 2 + and W n O 3 n . Considering the most probable interactions between these particles, as well as WO 4 2 and WO 2 2 + ions [46], we obtain the following set of reactions:
WO 4 2 k b * k f   WO 2 2 + + 2 O 2 in the melt ,
WO 2 2 + + 1 e k b k f   WO 2 + on Pt ,
WO 2 2 + + 6 e k b * k f   W ( s ) + 2 O 2 on W ,
WO 2 + + 5 e k b * k f   W ( s ) + 2 O 2 on W ,
WO 2 2 + + 1 e + W n O 3 n + 1 2 + Na + k b k f *   ( n + 1 ) Na x WO 3   ( s ) on OTB ,   x = 1 / ( n + 1 ) ,
WO 2 + + W n O 3 n + 1 2 + Na + k b k f *   ( n + 1 ) Na x WO 3   ( s ) on OTB ,   x = 1 / ( n + 1 ) ,
Na + + 1 e + W n O 3 n + 1 2 k b * k f *   nNa x WO 3   ( s )   +   O 2 on OTB ,   x = 1 / n ,
W n O 3 n + Na + k b k f *   nNa x WO 3   ( s ) on OTB ,   x = 1 / n ,
Na 0 + W n O 3 n + 1 2 k b * k f *   nNa x WO 3   ( s )   +   O 2 on OTB ,   x = 1 / n ,
Na +   + 1 e k b k f   Na 0 on Pt ,
W n O 3 n + 1 2 + 1 e k b * k f   W n O 3 n + O 2 on Pt ,
Na 0 + W n O 3 n + 1 2 k b * k f *   Na + + WO 2 + + W n 1 O 3 n 2 2 + O 2 in   the   melt .
The set of these reactions can be represented in the form of a scheme shown in Figure 5a. To write the equations, we formalize this scheme (Figure 5b).
The concentrations of polytungstate anions and Na+ ions are much higher than those of tungsten-containing cations, and oxide ions participate in many equilibria [46], so the concentrations of A, F, L and O2− can be considered constant. In this case, the diffusion problem for the remaining reactants present in the melt (B, C, G and H) is described by the following system of equations:
c B t = k f 1 c A k b 1 * c B + D B 2 c B ξ 2 c C t = k f 12 * c G k b 12 * c C + D C 2 c C ξ 2 c G t = k f 12 * c G + k b 12 * c C + D G 2 c G ξ 2 c H t = D H 2 c H ξ 2 ,
where cc(ξ,t) (cm−3) and D (cm2s−1) are the concentration and diffusion coefficient of the indicated reagent, respectively, ξ (cm) is the coordinate, t (s) is the time, and kf and kb (s−1) are the rate constants of the forward and backward processes, respectively. The symbol * is used for rate constants adjusted due to the fact that not only A, B, C and G are involved in the forward and/or reverse process:
k b 1 * = k b 1 c O 2 2 ,       k f 12 * = k f 12 c W n O 3 n + 1 2 ,       k b 12 * = k b 12 c Na + c W n 1 O 3 n 2 2 c O 2 .
The equations in (13) do not contain migration terms due to the assumption that the concentrations A and F are constant. This approach allows us to avoid the significant mathematical and computational challenges associated with solving the Nernst–Planck–Poisson problem [64,65,66]. Nevertheless, the effect of a high ion concentration will be taken into account below via ohmic potential drop. The correctness of this method was proven in [70] for individual, i.e., not containing supporting electrolyte, salt melts.
To derive the boundary conditions for ξ = 0, we take into account the following points. For an arbitrary electrochemical reaction X + ze ⇄ Y, the flux, J = J X = J Y (s–1), on a surface of area S (cm2) can be written as [71,72]:
J = S ( k f s c X s k b s c Y s ) ,
J = I / z e ,
k f s = K f exp ( α f η ) ,   k b s = K b exp ( β f η ) ,
where k f s and k b s (cm·s−1) are the rate constants of the forward and backward processes occurring at the electrolyte/solid phase interface; cs (cm−3) is the surface concentration; I (A) is the current; z is the number of electrons involved in the electrochemical reaction; e (C) is the elementary electric charge; Kf and Kb are pre-exponential factors, which are conveniently written as K f = k 0 / ( c X s ) 0 and K b = k 0 / ( c Y s ) 0 if X and Y are components of the electrolyte; k0 (cm−2s−1) is the heterogeneous rate constant; (cs)0 (cm−3) is the equilibrium (initial) value of the surface concentration; α and β are the charge transfer coefficients; α + β = 1, f = z e / k T , k (J·K−1) is the Boltzmann constant; T (K) is the absolute temperature; η (V) is the overpotential; η = E0E, E0 is the equilibrium potential, i.e., the potential value established after an exposure of the electrode in the electrolyte without applying current or voltage; and E is the electrode potential. In our case, the melt does not contain a supporting electrolyte (i.e., in this sense, it can be considered to be an individual salt melt), so the ohmic drop, ηΩ (V), should be taken into account in (17) [70]:
k f s = K f exp [ α f ( η η Ω ) ] ,   k b s = K b exp [ β f ( η Ω η ) ] ,
η Ω = I R for   reaction   on   the   electrode   surface , I Σ 2 π r N κ   for   reaction   on   the   deposit   surface ,
where R (Ω) is the cell resistance; IΣ (A) is the total current to all new-phase nuclei; r (cm) is the radius of the nucleus approximated by a hemisphere (we assume that all nuclei have the same size); N is the number of nuclei; and κ (S·cm−1) is the specific electrical conductivity. Equations (15) and (17) are also applicable for a chemical reaction X ⇄ Y occurring at the liquid/solid interface if z = 0, i.e., exp(αfη) = exp(−βfη) = 1.
The diffusion flux of a reagent on the surface is equal to the algebraic sum of the fluxes associated with an increase or decrease in its surface concentration (due to participation in reactions at the interface) [71]. Thus, we obtain the following boundary conditions for B, C, G and H at ξ = 0:
D B c B ξ ξ = 0 + ( k f 2 s + p k f 3 s + q k f 5 s * ) c B s k b 2 s c C s p k b 3 s * q k b 5 s = 0 ,
D C c C ξ ξ = 0 + ( k b 2 s + p k f 4 s + q k f 6 s * ) c C s k f 2 s c B s p k b 4 s * q k b 6 s = 0 ,
D G c G ξ ξ = 0 + ( q k f 9 s * + k b 10 s * ) c G s q k b 9 s * k f 10 s c F s = 0 ,
D H c H ξ ξ = 0 + ( q k f 8 s * + k b 11 s ) c H s q k b 8 s k f 11 s c L s = 0 ,
where
p = S W / S e ,   q = S OTB / S e ,
k b 3 s * = k b 3 s c O 2 2 , k b 4 s * = k b 4 s c O 2 2 , k f 5 s * = k f 5 s c Na + c W n O 3 n + 1 2 , k f 6 s * = k f 6 s c Na + c W n O 3 n + 1 2 , k f 7 s * = k f 7 s c W n O 3 n + 1 2 , k f 8 s * = k f 8 s c Na + k f 9 s * = k f 9 s c W n O 3 n + 1 2 , k b 9 s * = k b 9 s c O 2 , k b 10 s * = k b 10 s c O 2 ,
SW and SOTB (cm2) are the electroactive areas of the tungsten and OTB, respectively, and Se (cm2) is the electrode area. Equations (20)–(25) consider that c W s = c OTB s = 1 .
Conditions (20)–(23) must be supplemented with the second boundary condition (at ξ = δ, where δ is the diffusion layer thickness) and the initial one (at t = 0). For B initially present in the melt, we have
c(δ,t) = c0,
c(ξ,0) = c0,
where c0 (cm–3) is the bulk concentration. For C, G and H, we will assume that
c(δ,t) = 0,
c(ξ,0) = (cs)0 − (cs)0ξ/δ.
Let us now consider the phase formation in this system. In this work, we will simulate the simplest case, when all nuclei of one phase appear simultaneously, have the same size, and do not overlap. This is a common approximation that can describe the initial stages of electrocrystallization of nuclei formed on an indifferent electrode in a short (compared to the entire time scale of the experiment) time interval. The formation of stable nuclei of new phases (W and OTB) on the electrode surface is realized when the algebraic sum of the substance flow to the nuclei is positive:
k f 3 s c B s + k f 4 s c C s k b 3 s * k b 4 s * > 0 ,
k f 5 s * c B s + k f 6 s * c C s + k f 7 s c F s c L s + k f 8 s * c G s + k f 9 s * c H s k b 5 s k b 6 s k b 7 s k b 8 s k b 9 s > 0 .
If expressions (30) and (31) are valid then the growth rate exceeds the dissolution rate and the increment in the nucleus volume, V (cm3), due to the attachment of g new-phase particles can be determined as follows:
d V = υ d g ,
d g = m j m S nuc d t ,
where υ(cm3) is the volume of one new-phase atom (for W) or the average volume of one attached particle (for OTB); jm (cm–2s–1) is the flux density to the nucleus due to reactions (3) and (4) for W and (5)–(8) for OTB; and Snuc (cm2) is the surface area of the nucleus,
S nuc   W = 2 π r 2 = ( 18 π ) 1 / 3 V 2 / 3 ,
S nuc OTB = 5 a 2 = 5 V 2 / 3 ,
S nuc W = S W / N W ,   S nuc OTB = S OTB / N OTB .
Here a (cm) and r (cm) are the length of the cube edge for the cubic OTB nucleus and the radius for the hemispheric tungsten nucleus, respectively; and NW and NOTB are the number of W and OTB nuclei, respectively. The equation can be derived from (32)–(35) for calculating the change in the nucleus volume:
d V d t = b υ V 2 / 3   m j m ,
where b = ( 18 π ) 1 / 3 for W and b = 5 for OTB.

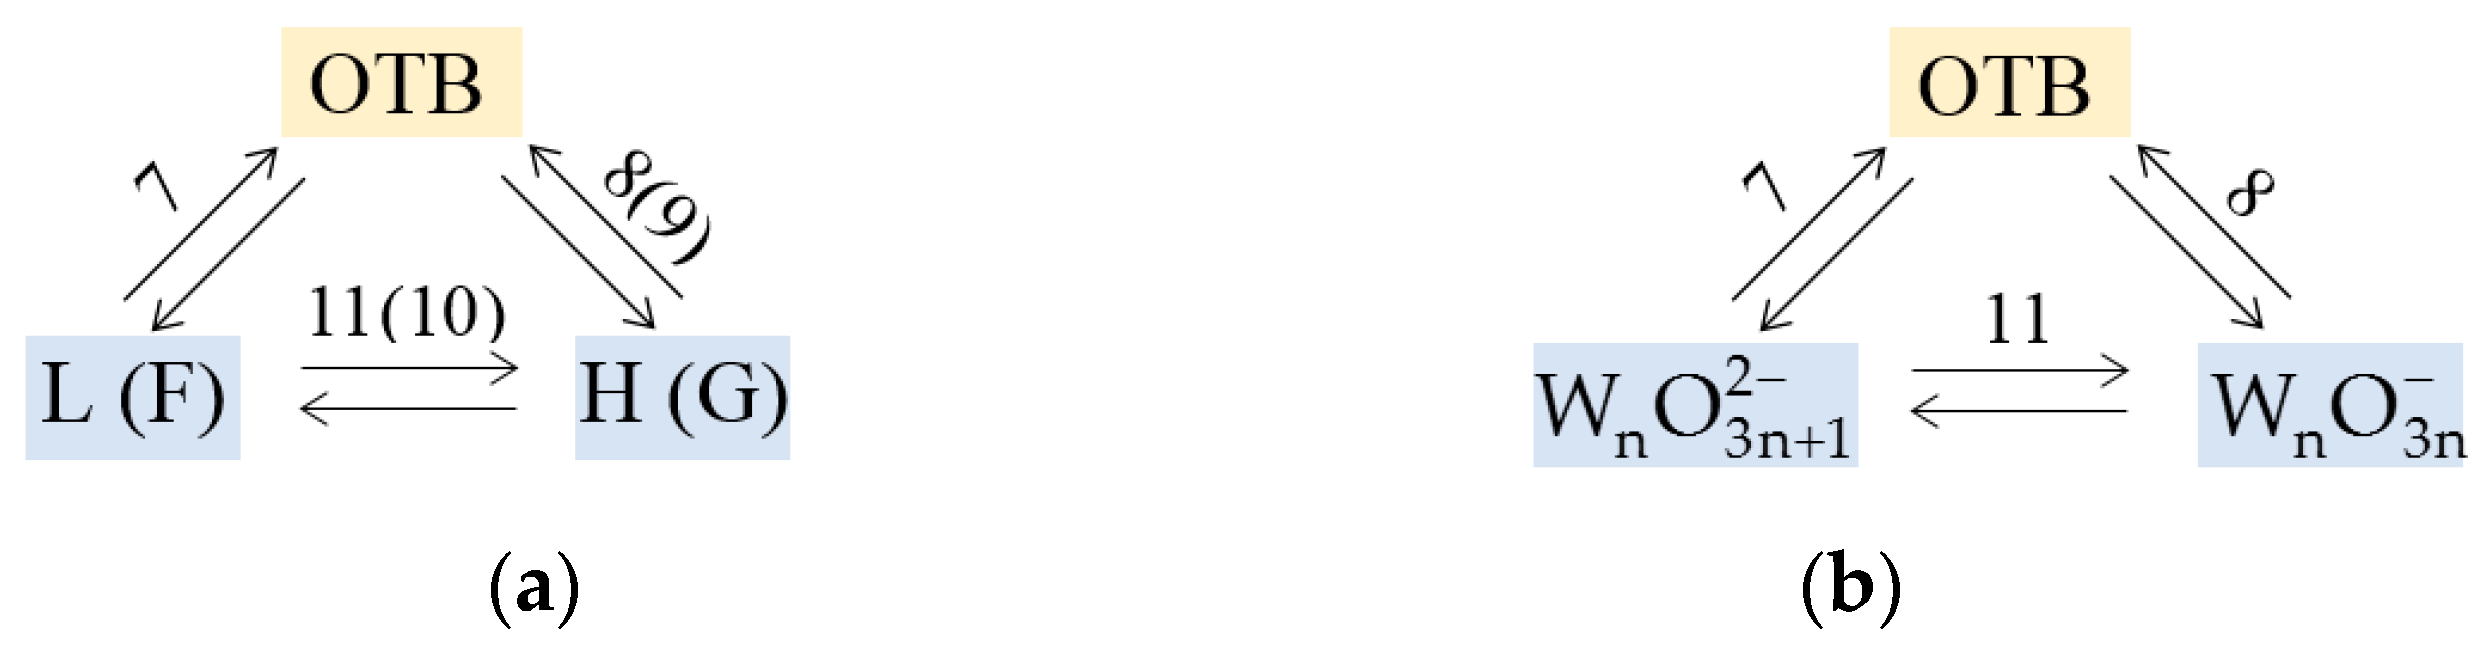
4.2. Deposit Containing Two OTBs

Experimental data show that the proportion of tungsten in the deposit is negligible at a short deposition time, and the sodium content in OTB can be lower at a higher cathodic potential. Therefore, we will also consider the case when the cathode deposit consists of two OTBs which differ in their growth/dissolution kinetics and, hence, in their x value. This leads to a modification of the scheme shown in Figure 5, namely, reactions (3) and (4) should be deleted, and reactions (5)–(9) should be duplicated by similar ones characterized by other rate constants. Accordingly, the boundary conditions for B, C, G and H at ξ = 0 should be replaced by the following:
D B c B ξ ξ = 0 + ( k f 2 s + q k f 5 s + q k f 5 s * ) c B s k b 2 s c C s q k b 5 s * q k b 5 s = 0 ,
D C c C ξ ξ = 0 + ( k b 2 s + q k f 6 s + q k f 6 s * ) c C s k f 2 s c B s q k b 6 s * q k b 6 s = 0 ,
D G c G ξ ξ = 0 + ( q k f 9 s * + q k f 9 s * + k b 10 s * ) c G s q k b 9 s * q k b 9 s * k f 10 s c F s = 0 ,
D H c H ξ ξ = 0 + ( q k f 8 s * + q k f 8 s * + k b 11 s ) c H s q k b 8 s q k b 8 s k f 11 s c L s = 0 .
All terms of Equations (38)–(41) related to the second OTB are marked with an apostrophe.

4.3. Inhomogeneity of Sodium Distribution in an OTB Crystal

The structure of OTB crystals determines the ability of sodium to move inside the channels formed by WO6 octahedra [1]. This allows us to suspect the inhomogeneity of the sodium distribution in the crystal associated with the formation of an internal region with a constant x value, which differs from that in the surface layer. In the intermediate region, the change in the x value can be approximately described by the equation
x = w x up + ( 1 w ) x in , w = 0.5 erf 4 ( ζ ζ 0 ) Δ ζ + 1 ,
where w is the weight coefficient; xup and xin are the sodium content in the upper (surface) layer and inside the crystal, respectively; ζ and ζ0 (cm) are the distances from the center of the crystal base to a given point inside the crystal and to the interface between the two regions, respectively; and Δζ is the thickness of the transition layer. Equation (42) is a solution to the diffusion problem for the contact of two solutions with different concentrations. The rate constants for reactions (5)–(8) are related to x, so we will use similar equations during the dissolution of crystals:
K f = w K f up + ( 1 w ) K f in ,
K b = w K b up + ( 1 w ) K b in .
Thus, the dissimilarity between xup and xin will lead to differences in the dissolution rates of the above crystal regions.

4.4. Parameters and Simulation Procedure

To simulate voltammograms in accordance with the model described in Section 4.1, the system of Equations (13)–(15), (17)–(31), (36) and (37) was numerically solved taking into account the time dependence of the overpotential,
η = ν t , 0 t < t λ ν ( 2 t λ t ) , t t λ ,
where ν (V·s−1) is the scan rate, and tλ (s) is the reverse time. Expressions (20)–(23) were replaced by Equations (38)–(41) to simulate the current response in the case of the formation and dissolution of two OTBs. Formulas (42)–(44) were added to this system of equations to simulate the complicated mechanism of the dissolution of OTB crystals.
The following parameter values were used in the calculations: z3 = 6; z4 = 5; z2 = z5 =z7 = z10 = z11 =1; z1 = z6 =z8 = z9 = z12 = 0; α = β = 0.5; υW = 1.6 × 10⁻²³ cm3; υOTB = 5.7 × 10⁻²³ cm3; R = 0.35 Ω; κ = 0.9 S·cm−1; δ = 0.02 cm; Se = 0.88 cm2; T = 1023 K; E0 = 0 V; ηλ from 1.13 to 1.20 V; and ν from 0.10 to 0.40 V·s−1. The υOTB value was determined by taking into account the lattice parameter calculated using the Brown–Banks equation [73]. The initial value of the number density of nuclei, N0 = 1.24 × 104 cm−2, was estimated from the experimental data. The initial values of the diffusion coefficients for B, C, G and H were taken as equal to DB = DC = DG = DH = 2 × 10⁻⁵ cm2s−1. The initial concentrations of all ions, c0 (cm−3), were taken from Table 2 in our previous work [46]. The initial values of the remaining parameters were chosen arbitrarily.
The backward Euler method was used in mass transfer modeling to ensure the stability and convergence of the solution. The forward Euler method was applied to calculate the nucleus volume using Equation (37). The finite difference code was implemented in Excel using the built-in VBA programming language [74]. The fitting of unknown parameters was performed according to the Levenberg–Marquardt algorithm.

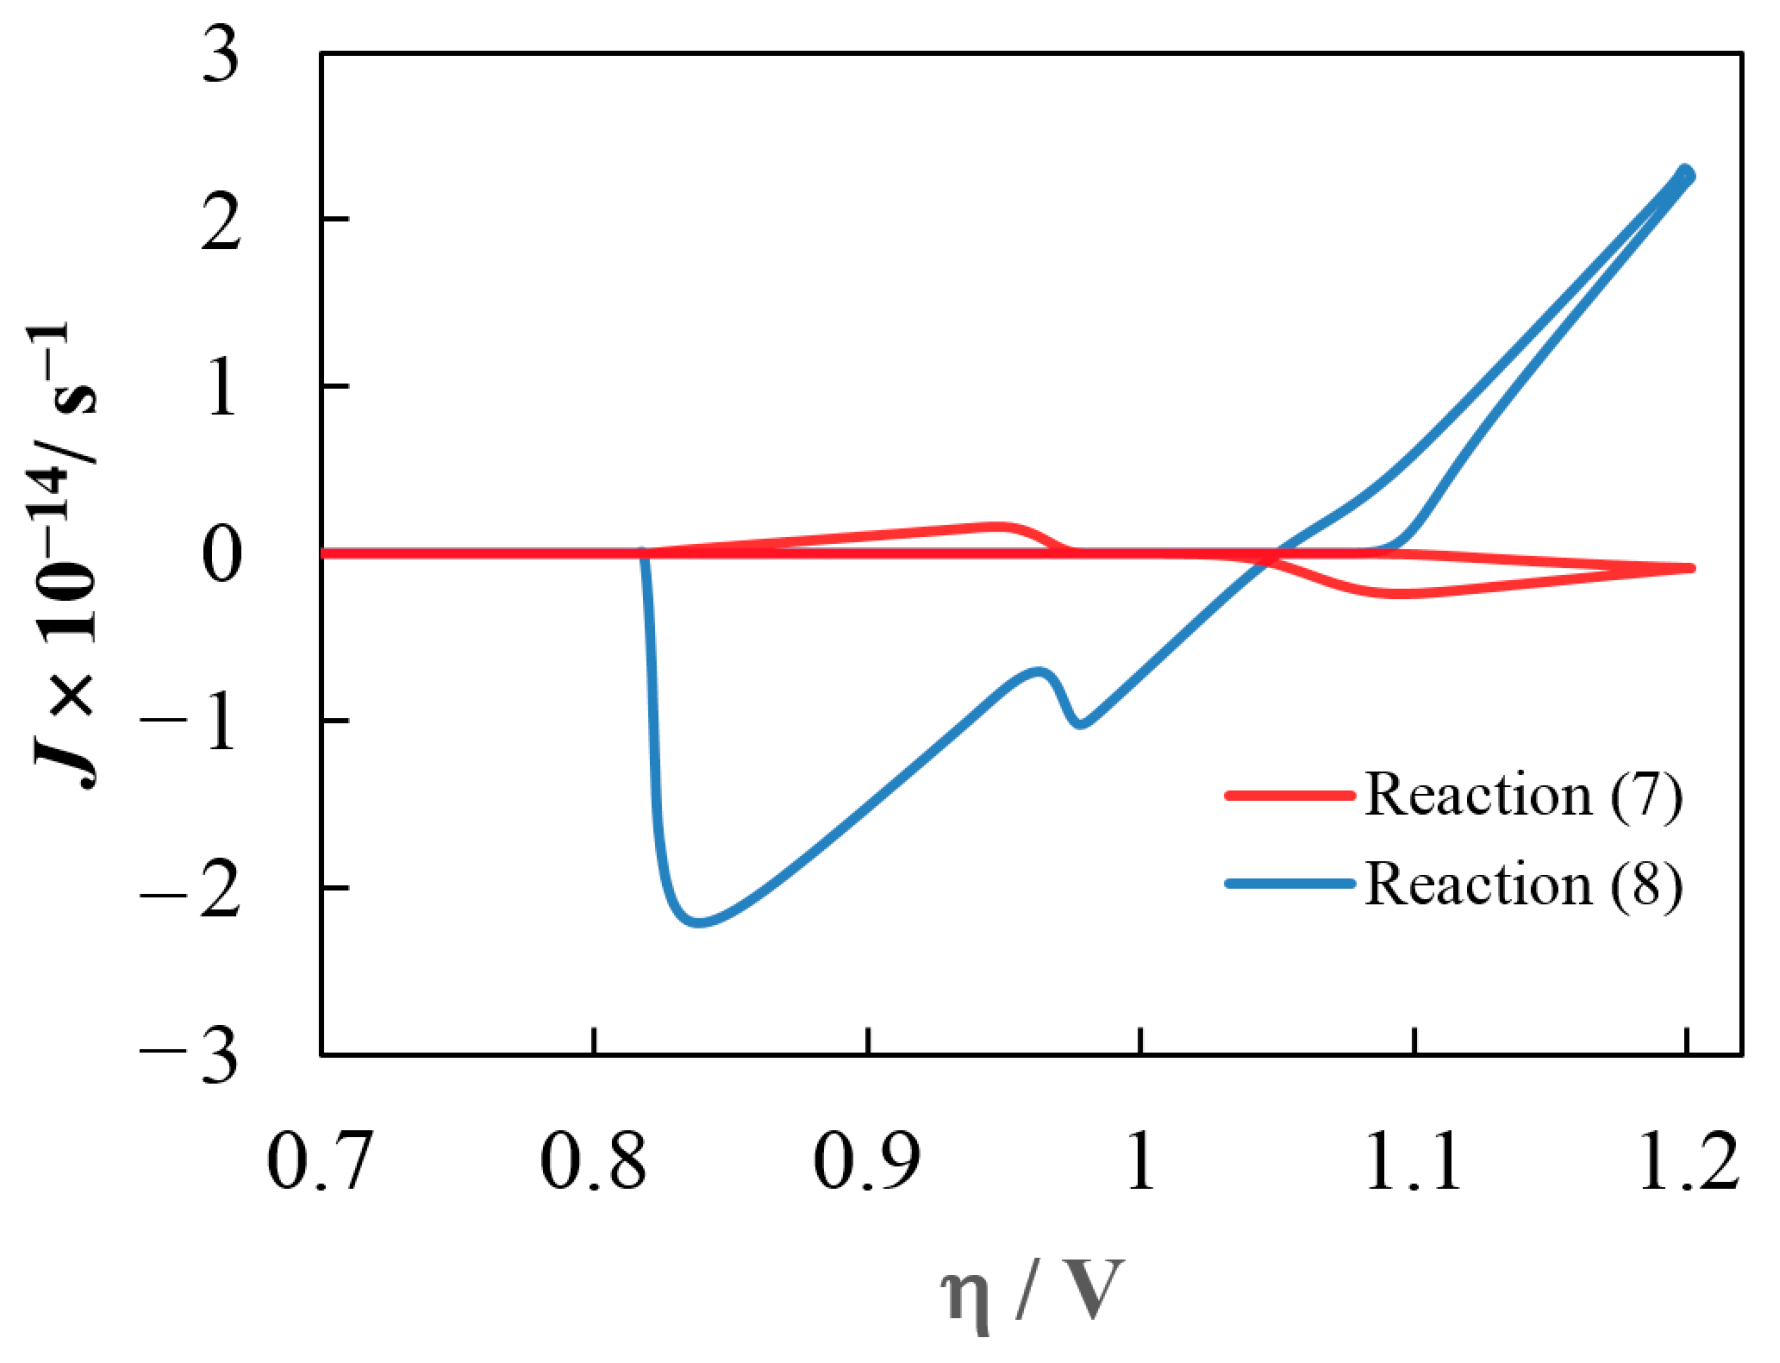
5. Simulation Results and Discussion

Figure 6 shows a comparison of experimental and fitted CVs for the formation/dissolution of deposits with different phase compositions. For a deposit consisting of tungsten and OTB, two options were simulated (Figure 6a). A good match was not achieved, regardless of whether the A′ peak was attributed to the tungsten dissolution or the OTB dissolution. When simulating the growth and dissolution of the two OTBs, a fairly good fit was observed under some conditions (Figure 6b), but it was easily broken by varying the scan parameters (Figure 6c).
Excellent agreement between the anodic branches of the experimental and fitted curves was obtained by simulating the dissolution of a single-phase deposit consisting of NaxWO3 crystals with a nonuniform distribution of sodium (Figure 6d). In this case, peaks A′ and A″ are associated with the dissolution of the surface layer and the inner region of NaxWO3 crystals, respectively. However, the calculated nucleation loop is always wider than the experimental one in this case, and the inflection at the transition to the anode region is not reproduced.
The best fitting of both the anode and cathode branches of CVs can be performed for the growth and dissolution of OTB crystals with a nonuniform distribution of sodium (Figure 7a,c) when the pre-exponential factors for the backward reactions change smoothly near the crossover overpotential η0 in the range Δη:
K b = w K b c + ( 1 w ) K b a ,   w = 0.5 erf 4 ( η η 0 ) Δ η + 1 .
Here, the superscripts “c” and “a” refer to the cathode and anode branches of the CV, respectively; η0 = 1.067 V and Δη = 0.091 V. In practice, the above variation can be associated with a change in the composition of the OTB surface layer at decreasing overpotential or with passivation of the crystal surface by impurities.
The fitting shows that reactions (5), (6) and (12) can also be excluded, in addition to reactions (3) and (4) which are associated with the formation of tungsten, since their contribution to the current response is negligible. Thus, the mechanism can be described by a simpler scheme including reactions (7)–(11). The L-H-OTB branch is similar to the F-G-OTB one (see Figure 5), because L and F are high-concentration oxidized forms, H and G are reduced forms, z = 1 in reactions (10) and (11), and z = 0 in reactions (8) and (9). Therefore, we can use the simplest scheme for fitting, in which reactions (10) and (11), and (8) and (9) are combined (Figure 8a).
The fitting results using scheme on Figure 8a show that the equilibrium concentration of the reduced form is (2.8 ± 0.1) × 1013 cm–3. If the OTB is formed mainly due to reactions (7), (9) and (10), then the standard potential for reaction (10),
E 0 = 1 f ln ( c Na + s ) 0 ( c Na 0 s ) 0 ,
is equal to −1.76 V. However, the standard potential calculated for reaction
Na 0 + WO 3 + 0.5 O 2 ( g ) = Na 2 WO 4
using the HSC software [75] is −3.03 V. Therefore, the contribution of reactions (9) and (10) can be ignored.
The simplest final scheme (Figure 8b) assumes the growth of NaxWO3 crystals due to reactions (7) and (8). The parameter values providing the best match (similar to that shown in Figure 7a,c) according to scheme on Figure 8b are shown in Table 2.
The contributions of the electrochemical reaction (7) and chemical reaction (8) to the growth and dissolution of OTB crystals depend on the specific electrodeposition conditions. Figure 9 illustrates the typical contributions of these processes in our case. Under given conditions, in the cathodic region, the growth of NaxWO3 crystals occurs actually due to the crystal lattice construction by W n O 3 n and Na+ ions; while reaction (7), which assumes that the electrochemical process happens with the participation of W n O 3 n + 1 2 and Na+ ions on the OTB, leads to electrodissolution on the surface layer of the crystals. In the anodic region, on the contrary, reaction (7) prevents the dissolution of the inner crystal region.
The change in size (cube edge length) of the NaxWO3 crystal during the potential scan is shown in Figure 7b,d. It is important to note that both the overpotential at which the formation of stable OTB nuclei begins (about 1.08 V) and the maximum crystal size are in very good agreement with experimental observations. As expected, an increase in the reverse overpotential and a decrease in the scan rate contribute to an increase in the crystal size due to an increase in the time the system remains in the region of higher overpotentials and, accordingly, an increase in the total transferred charge [51,52]. Near the transition to the anodic region, the crystal size is almost constant for some time. The transition from the outer crystal layer’s dissolution to the inner crystal region’s dissolution appears as an inflection in the overpotential range corresponding to the local current maximum between peaks A′ and A″. The values of ζ0max and Δζ/ζmax (see Table 2) show a decrease in the surface layer’s thickness and the transition region’s proportion (see Section 4.3) as the crystal’s growth time increases. Among other results presented in Table 2, we note a good agreement between the experimental and fitting values of the number density of OTB crystals, NOTB. In addition, the found average value of the diffusion coefficient for W n O 3 n (4.43 × 10⁻⁵ cm2s−1) is typical for molten salts.
Figure 10 shows the calculated dependencies of surface concentration on overpotential (Figure 10a) and concentration profiles (Figure 10b) for W n O 3 n . During scanning in the cathodic direction, the surface concentration of W n O 3 n , cs, first increases exponentially as the overpotential increases due to an increase in the forward reaction (11) rate and a decrease in the reverse reaction (11) rate. The appeared W n O 3 n ions together with sodium ions form unstable OTB-like submicrostructures on the electrode surface to which Na+, W n O 3 n and W n O 3 n + 1 2 can attach/detach. Moreover, the rate of W n O 3 n attachment depends on the concentration of these ions, and the rate of W n O 3 n + 1 2 attachment/detachment depends on the potential. Upon reaching the critical W n O 3 n concentration and the electrode potential, stable OTB nuclei are formed whose growth rate exceeds the dissolution rate. Apparently NaW4O12 may be the smallest stable nucleus. The active consumption of W n O 3 n by growing OTB crystals causes a peak in the cs(η) dependence. After the reversal point (green dot in Figure 10a), the W n O 3 n formation rate decreases, and the anodic component of the electrochemical process (7) increases, which leads to a decrease in the OTB growth rate. In the anodic region the deposit dissolves. The stepwise shape of the cs(η) dependence (see Figure 10a) here is associated with different dissolution rates of the outer crystal layer (between the light blue and blue dots), the intermediate crystal zone (between the blue and violet dots), and the inner crystal region (after the violet dot).
Thus, the proposed approaches allow us to study in detail the mechanism and kinetic patterns of OTB formation/growth/dissolution through simulation and fitting of cyclic voltammograms.

6. Conclusions

The formation, growth and dissolution of electrode deposits containing sodium tungsten bronze during the electrolysis of the 0.8Na2WO4–0.2WO3 melt at 1023 K were comprehensively studied.
The experimental results indicate a nontrivial mechanism of the process. To analyze experimental cyclic voltammograms, mathematical models were proposed that consider the growth and dissolution of a two-phase deposit consisting of NaxWO3 and metallic tungsten or two sodium tungsten bronzes of different compositions. The models describe mass transfer within the diffusion layer to the electrode surface and to the nuclei, as well as the most probable chemical and electrochemical reactions occurring in the melt, on the electrode surface and on the surface of new phases. The processes of the growth/dissolution of nuclei due to electrochemical reactions are modeled for the case of mixed control (diffusion + charge transfer) taking into account the ohmic potential drop.
Moreover, the model was proposed for the dissolution of NaxWO3 crystals with different sodium content in the surface layer and in the crystal bulk. The use of this model, supplemented by a smooth change in the pre-exponential factors for the backward reactions near the crossover overpotential for the intermediate crystal region, provides the best agreement between the experimental and simulated cyclic voltammograms. This approach allowed us to exclude from the general scheme reactions that weakly affect the current response and to clarify the mechanism of OTB formation.
According to the established mechanism, the formation of OTB crystals is impossible without the electrochemical reduction of tungstate anions by reaction (11), and the OTB growth regularities are determined by the contributions of both the electrochemical process (7) with the participation of W n O 3 n + 1 2 and Na+, and the chemical reaction (8) between Na+ and W n O 3 n formed during the W n O 3 n + 1 2 electroreduction on the electrode. Under the conditions studied, reaction (8) first promotes the OTB growth (in the cathodic region) and then its dissolution (in the anodic region), while reaction (7) inhibits these processes. The simulation results allowed us to consistently explain all the patterns and characteristic features observed in the experiment.
The proposed approaches and models can be used to analyze the mechanism and kinetics of electrode processes complicated by phase formation, parallel and sequential chemical and electrochemical processes, as well as the dissimilarity of the phase and/or chemical composition of the deposit.

Supplementary Materials

The following supporting information can be downloaded at: https://www.mdpi.com/article/10.3390/ma16227207/s1.

Author Contributions

Conceptualization, A.V.K. and O.V.G.; methodology, A.V.K.; software, A.V.K.; validation, O.V.G. and S.V.V.; formal analysis, A.V.K. and O.V.G.; investigation, A.V.K. and O.L.S.; resources, Y.P.Z.; writing—original draft preparation, O.V.G.; writing—review and editing, O.V.G. and A.V.K.; supervision, Y.P.Z. and S.V.V.; project administration, Y.P.Z. All authors have read and agreed to the published version of the manuscript.

Funding

This research received no external funding.

Institutional Review Board Statement

Not applicable.

Informed Consent Statement

Not applicable.

Data Availability Statement

Data are contained within the article and Supplementary Materials.

Acknowledgments

This work has been (partly) conducted using the facilities of the Shared Access Center “Composition of Compounds” (IHTE, UB RAS).

Conflicts of Interest

The authors declare no conflict of interest.

References

  1. Labbe, P. Tungsten oxides, tungsten bronzes and tungsten bronze-type structures. Key Eng. Mater. 1992, 68, 293–339. [Google Scholar] [CrossRef]
  2. Bartha, L.; Kiss, A.B.; Szalay, T. Chemistry of Tungsten Oxide Bronzes. Int. J. Refract. Met. Hard Mater. 1995, 13, 77–91. [Google Scholar] [CrossRef]
  3. Lawrence, S.; Stevenson, S.; Mavadia, K.; Sermon, P. Solid-State Properties of Some Polycrystalline Alkali-Metal Tungsten Bronzes. Proc. R. Soc. Lond. Ser. A Math. Phys. Sci. 1987, 411, 95–121. [Google Scholar]
  4. Shanks, H.R.; Sidles, P.H.; Danielson, G.C. Electrical Properties of the Tungsten Bronzes. In Nonstoichiometric Compounds; Advances in Chemistry Series; Ward, R., Ed.; ACS: Washington, DC, USA, 1963; Volume 39, pp. 237–245. [Google Scholar]
  5. Ellerbeck, L.D.; Shanks, H.R.; Sidles, P.H.; Danielson, G.C. Electrical Resistivity of Cubic Sodium Tungsten Bronze. J. Chem. Phys. 1961, 35, 298–303. [Google Scholar] [CrossRef]
  6. Lekshmi, I.C.; Hegde, M.S. Synthesis and electrical properties of cubic NaxWO3 thin films across the metal–insulator transition. Mater. Res. Bull. 2005, 40, 1443–1450. [Google Scholar] [CrossRef]
  7. Raj, S.; Matsui, H.; Souma, S.; Sato, T.; Takahashi, T.; Chakraborty, A.; Sarma, D.D.; Mahadevan, P.; Oishi, S.; McCarroll, W.H.; et al. Electronic structure of sodium tungsten bronzes NaxWO3 by high-resolution angle-resolved photoemission spectroscopy. Phys. Rev. B 2007, 75, 155116. [Google Scholar] [CrossRef]
  8. Sano, K.; Nitta, Y.; Ōno, Y. Transition Temperature of Superconductivity in Sodium Tungsten Bronze—Theoretical Study Based on First-principles Calculations. J. Phys. Soc. Jpn. 2020, 89, 113704. [Google Scholar] [CrossRef]
  9. Cogan, S.F.; Plante, T.D.; Parker, M.A.; Rauh, R.D. Free-electron electrochromic modulation in crystalline LixWO3. J. Appl. Phys. 1986, 60, 2735–2739. [Google Scholar] [CrossRef]
  10. Tegg, L.; Haberfehlner, G.; Kothleitner, G.; Kisi, E.; Keast, V.J. Crystal structures, electrical properties, and electron energy-loss spectroscopy of the sodium and potassium tetragonal tungsten bronzes. J. Alloys Compd. 2021, 868, 159200. [Google Scholar] [CrossRef]
  11. El-Sayed, A.M.; Mousa, S.M.A. Some properties of sodium tungsten bronzes as a function of sodium concentration. Ind. J. Chem. Technol. 2005, 12, 304–308. [Google Scholar]
  12. Wechter, M.A.; Shanks, H.R.; Carter, G.; Ebert, G.M.; Guglielmino, R.; Voigt, A.F. Use of metal tungsten bronze electrodes in chemical analysis. Anal. Chem. 1972, 44, 850–853. [Google Scholar] [CrossRef] [PubMed]
  13. Hahn, P.B.; Wechter, M.A.; Johnson, D.C.; Voigt, A.F. Sodium tungsten bronze as a potentiometric indicating electrode for dissolved oxygen in aqueous solution. Anal. Chem. 1973, 45, 1016–1021. [Google Scholar] [CrossRef]
  14. Griffith, C.S.; Luca, V.; Hanna, J.V.; Pike, K.J.; Smith, M.E.; Thorogood, G.S. Microcrystalline Hexagonal Tungsten Bronze. 1. Basis of Ion Exchange Selectivity for Cesium and Strontium. Inorg. Chem. 2009, 48, 5648–5662. [Google Scholar] [CrossRef] [PubMed]
  15. Egorin, A.M.; Dran’kov, A.N.; Didenko, N.V.; Tokar’, E.A.; Sokol’nitskaya, T.A.; Papynov, E.K.; Tananaev, I.G. Synthesis and sorption characteristics of tungsten oxides-based materials for Sr-90 removal from water media. J. Mater. Sci. 2020, 55, 9374–9384. [Google Scholar] [CrossRef]
  16. Zimmer, A.; Gilliot, M.; Tresse, M.; Broch, L.; Tillous, K.E.; Boulanger, C.; Stein, N.; Horwat, D. Coloration mechanism of electrochromic NaxWO3 thin films. Opt. Lett. 2019, 44, 1104–1107. [Google Scholar] [CrossRef] [PubMed]
  17. Tegg, L.; Cuskelly, D.; Keast, V.J. The sodium tungsten bronzes as plasmonic materials: Fabrication, calculation and characterization. Mater. Res. Express 2017, 4, 065703. [Google Scholar] [CrossRef]
  18. Tegg, L.; Cuskelly, D.; Keast, V.J. Plasmon Responses in the Sodium Tungsten Bronzes. Plasmonics 2018, 13, 437–444. [Google Scholar] [CrossRef]
  19. Azimirad, R.; Khademi, A.; Akhavan, J.; Moshfegh, A.Z. Growth of Na0.3WO3 nanorods for the field emission application. J. Phys. D Appl. Phys. 2009, 42, 205405. [Google Scholar] [CrossRef]
  20. Guo, C.; Yin, S.; Sato, T. Effects of Crystallization Atmospheres on the Near-Infrared Absorbtion and Electroconductive Properties of Tungsten Bronze Type MxWO3 (M = Na, K). J. Am. Ceram. Soc. 2012, 95, 1634–1639. [Google Scholar] [CrossRef]
  21. Kotvanova, M.K.; Pavlova, S.S.; Efremova, N.N. Nanosized crystals of oxide bronzes of titanium, molybdenum, tungsten as components of anticorrosive coatings. Izvestiya Vuzov. Khimiya Khimicheskaya Tekhnologiya 2013, 56, 88–91. (In Russian) [Google Scholar]
  22. Jie, S.; Guo, X.; Ouyang, Z. Tumor ablation using novel photothermal NaxWO3 nanoparticles against breast cancer osteolytic bone metastasis. Int. J. Nanomed. 2019, 14, 7353–7362. [Google Scholar] [CrossRef] [PubMed]
  23. Wang, L.; Zhan, J.; Fan, W.; Cui, G.; Sun, H.; Zhuo, L.; Zhao, X.; Tang, B. Microcrystalline sodium tungsten bronze nanowire bundles as efficient visible light-responsive photocatalysts. Chem. Commun. 2010, 46, 8833–8835. [Google Scholar] [CrossRef] [PubMed]
  24. Wu, C.-M.; Naseem, S.; Chou, M.-H.; Wang, J.-H.; Jian, Y.-Q. Recent Advances in Tungsten-Oxide-Based Materials and Their Applications. Front. Mater. 2019, 6, 49. [Google Scholar] [CrossRef]
  25. Yi, L.; Zhao, W.; Huang, Y.; Wu, X.; Wang, J.; Zhang, G. Tungsten bronze Cs0.33WO3 nanorods modified by molybdenum for improved photocatalytic CO2 reduction directly from air. Sci. China Mater. 2020, 63, 2206–2214. [Google Scholar] [CrossRef]
  26. Vakarin, S.V.; Melyaeva, A.A.; Semerikova, O.L.; Kondratuk, V.S.; Pankratov, A.A.; Plaksin, S.V.; Porotnikova, N.M.; Zaykov, Y.P.; Petrov, L.A.; Mikushina, Y.V.; et al. Catalase activity of coarse grained and nanosized oxide tungsten bronzes obtained by electrolysis of molten salts. Russ. Chem. Bull. 2011, 60, 1985–1988. [Google Scholar] [CrossRef]
  27. Semerikova, O.L.; Vakarin, S.V.; Kosov, A.V.; Plaksin, S.V.; Pankratov, A.A.; Grishenkova, O.V.; Zaykov, Y.P.; Shishmakov, A.B.; Mikushina, Y.V.; Petrov, L.A. Electrochemical Synthesis of Nanohybrid Systems Based on Copper and the Oxide Tungsten Bronzes. J. Electrochem. Soc. 2019, 166, D792–D797. [Google Scholar] [CrossRef]
  28. Drobasheva, T.I.; Spitsyn, V.I. Tungsten and molybdenum bronzes with two alkaline elements. In Oxide Bronzes; Spitsyn, V.I., Ed.; Nauka: Moscow, Russia, 1982; pp. 40–75. (In Russian) [Google Scholar]
  29. Kaliev, K.A.; Baraboshkin, A.N. Electrocrystallization of transition metal oxide bronzes from molten salts. In Oxide Bronzes; Spitsyn, V.I., Ed.; Nauka: Moscow, Russia, 1982; pp. 137–175. (In Russian) [Google Scholar]
  30. Banks, E.; Fleischmann, C.W.; Meites, L. On the nature of the species reduced during the electrochemical synthesis of tungsten bronzes. J. Solid State Chem. 1970, 1, 372–375. [Google Scholar] [CrossRef]
  31. Meites, L.; Banks, E.; Fleischmann, C.W. Voltammetric behaviors of platinum electrodes and decomposition potentials of alkali tungstate and polytungstate melts. Anal. Chem. 1972, 44, 1133–1139. [Google Scholar] [CrossRef]
  32. Fredlein, R.A.; Damjanovic, A. Electrochemical deposition and dissolution of tungsten oxide bronzes. J. Solid State Chem. 1972, 4, 94–102. [Google Scholar] [CrossRef]
  33. Randin, J.-P. Electrochemical deposition of sodium tungsten bronzes. J. Electrochem. Soc. 1973, 120, 1325–1330. [Google Scholar] [CrossRef]
  34. Randin, J.-P. Kinetics of the electrochemical deposition and dissolution of sodium tungsten bronzes. Electrochim. Acta 1974, 19, 745–751. [Google Scholar] [CrossRef]
  35. Elwell, D.; DeMattei, R.C.; Zubeck, I.V.; Feigelson, R.S.; Huggins, R.A. DC resistances in electrolytic crystallization from molten salts. J. Cryst. Growth 1976, 33, 232–238. [Google Scholar] [CrossRef]
  36. Okada, K.; Miyake, M.; Iwai, S.; Ohno, H.; Furukawa, K. Structural Analysis of Molten Na2WO4. J. Chem. Soc. Faraday Trans. 2 1978, 74, 1141–1148. [Google Scholar] [CrossRef]
  37. Miyake, M.; Okada, K.; Iwai, S.; Ohno, H.; Furukawa, K. Structural analysis of molten Na2W2O7. J. Chem. Soc. Faraday Trans. 2 1978, 74, 1880–1884. [Google Scholar] [CrossRef]
  38. Baraboshkin, A.N.; Kaliev, K.A.; Aksentiev, A.G. Formation of metastable phases on the cathode in the initial period of electrolysis. Elektrokhimiya 1978, 14, 1836–1839. (In Russian) [Google Scholar]
  39. Afonichkin, V.K.; Leontiev, V.N.; Komarov, V.E. Equilibrium electrode potentials of tungsten in melts of the Na2WO4–WO3 system. Elektrokhimiya 1993, 29, 341–347. (In Russian) [Google Scholar]
  40. Vorozhbit, V.U.; Shurdumov, G.K.; Kaliev, K.A. Obtaining highly dispersed powders of oxide lithium-tungsten bronzes. Tsvetnye Met. 1995, 39–41. (In Russian) [Google Scholar]
  41. Voron’ko, Y.K.; Sobol’, A.A. Influence of Cations on the Vibrational Spectra and Structure of [WO4] Complexes in Molten Tungstates. Inorg. Mater. 2005, 41, 420–428. [Google Scholar] [CrossRef]
  42. Voronko, Y.K.; Sobol, A.A.; Shukshin, V.E. Raman scattering study of molten alkali-metal molybdates and tungstates rich in basic oxides. Inorg. Mater. 2014, 50, 837–843. [Google Scholar] [CrossRef]
  43. Wang, J.; You, J.L.; Wang, Y.Y.; Wang, M.; Jun, W.U. In-situ Raman Spectroscopic Study of the Molten Tungstates in Li2O-WO3 Binary System. Chin. J. Light Scatt. 2016, 28, 149–152. [Google Scholar]
  44. Wang, J.; You, J.; Wang, M.; Lu, L.; Wan, S.; Sobol, A.A. In-situ studies on the micro-structure evolution of A2W2O7 (A = Li, Na, K) during melting by high temperature Raman spectroscopy and density functional theory. Spectrochim. Acta A 2017, 185, 188–196. [Google Scholar] [CrossRef] [PubMed]
  45. Wang, J.; You, J.L.; Sobol, A.A.; Lu, L.M.; Wang, M.; Wu, J.; Lv, X.M.; Wan, S.M. In-situ high temperature Raman spectroscopic study on the structural evolution of Na2W2O7 from the crystalline to molten states. J. Raman Spectrosc. 2017, 48, 298–304. [Google Scholar] [CrossRef]
  46. Kosov, A.V.; Semerikova, O.L.; Vakarin, S.V.; Grishenkova, O.V.; Vorob’ev, A.S.; Khudorozhkova, A.O.; Zaikov, Y.P. Ionic Equilibria in Polytungstate Melts. Processes 2022, 10, 2658. [Google Scholar] [CrossRef]
  47. Baraboshkin, A.N.; Tarasova, K.P.; Nazarov, B.A.; Martemyanova, Z.S. Study of the composition and structure of cathode deposits during the electrolysis of molten Na2WO4-WO3 mixtures. Electrochem. Molten Salt Solid Electrolytes Proc. Inst. Electrochem. AS USSR 1973, 19, 44–48. (In Russian) [Google Scholar]
  48. Fletcher, S.; Halliday, C.S.; Gates, D.; Westcott, M.; Lwin, T.; Nelson, G. The response of some nucleation/growth processes to triangular scans of potential. J. Electroanal. Chem. 1983, 159, 267–285. [Google Scholar] [CrossRef]
  49. Velmurugan, J.; Noël, J.-M.; Nogala, W.; Mirkin, M.V. Nucleation and growth of metal on nanoelectrodes. Chem. Sci. 2012, 3, 3307–3314. [Google Scholar] [CrossRef]
  50. Isaev, V.A.; Grishenkova, O.V.; Zaykov, Y.P. Theory of cyclic voltammetry for electrochemical nucleation and growth. J. Solid State Electrochem. 2018, 22, 2775–2778. [Google Scholar] [CrossRef]
  51. Kosov, A.V.; Grishenkova, O.V.; Semerikova, O.L.; Isaev, V.A.; Zaykov, Y.P. On the theory of cyclic voltammetry for multiple nucleation and growth: Scan rate influence. J. Electroanal. Chem. 2021, 883, 115056. [Google Scholar] [CrossRef]
  52. Grishenkova, O.V.; Kosov, A.V.; Semerikova, O.L.; Isaev, V.A.; Zaikov, Y.P. Theoretical and experimental cyclic voltammetry studies of the initial stages of electrocrystallization. Russ. Metall. (Met.) 2021, 2021, 1016–1022. [Google Scholar] [CrossRef]
  53. Scharifker, B.R.; Hills, G.J. Theoretical and experimental studies of multiple nucleation. Electrochim. Acta 1983, 28, 879–889. [Google Scholar] [CrossRef]
  54. Isaev, V.A.; Grishenkova, O.V.; Zaykov, Y.P. Analysis of the geometrical–probabilistic models of electrocrystallization. Russ. Metall. (Met.) 2016, 2016, 776–784. [Google Scholar] [CrossRef]
  55. Isaev, V.A.; Zaykov, Y.P.; Grishenkova, O.V.; Kosov, A.V.; Semerikova, O.L. Analysis of Potentiostatic Current Transients for Multiple Nucleation with Diffusion and Kinetic Controlled Growth. J. Electrochem. Soc. 2019, 166, D851–D856. [Google Scholar] [CrossRef]
  56. Scharifker, B.R.; Mostany, J. Three-dimensional nucleation with diffusion controlled growth. Part I. Number density of active sites and nucleation rates per site. J. Electroanal. Chem. 1984, 177, 13–23. [Google Scholar] [CrossRef]
  57. Abyaneh, M.Y. Formulation of a general model for nucleation and growth of electrodeposits. Electrochim. Acta 1991, 36, 727–732. [Google Scholar] [CrossRef]
  58. Altimari, P.; Pagnanelli, F. Electrochemical nucleation and three-dimensional growth under mixed kinetic-diffusion control: Analytical approximation of the current transient. Electrochim. Acta 2016, 205, 113–117. [Google Scholar] [CrossRef]
  59. Milchev, A.; Zapryanova, T. Nucleation and growth of copper under combined charge transfer and diffusion limitations: Part I. Electrochim. Acta 2006, 51, 2926–2933. [Google Scholar] [CrossRef]
  60. Milchev, A.; Zapryanova, T. Nucleation and growth of copper under combined charge transfer and diffusion limitations: Part II. Electrochim. Acta 2006, 51, 4916–4921. [Google Scholar] [CrossRef]
  61. Kosov, A.V.; Grishenkova, O.V.; Isaev, V.A.; Zaikov, Y. Simulation of Diffusion-Controlled Growth of Interdependent Nuclei under Potentiostatic Conditions. Materials 2022, 15, 3603. [Google Scholar] [CrossRef] [PubMed]
  62. Isaev, V.A.; Grishenkova, O.V.; Kosov, A.V.; Semerikova, O.L.; Zaikov, Y. Simulation of 3D electrochemical phase formation: Mixed growth control. Materials 2021, 14, 6330. [Google Scholar] [CrossRef]
  63. Kosov, A.V.; Grishenkova, O.V. Modeling and simulation of 3D electrochemical phase formation under mixed kinetic-diffusion growth control. J. Solid State Electrochem. 2023. [Google Scholar] [CrossRef]
  64. D’Ajello, P.C.T.; Munford, M.L.; Pasa, A.A. Transient equations for multiple nucleation on solid electrodes: A stochastic description. J. Chem. Phys. 1999, 111, 4267–4273. [Google Scholar] [CrossRef]
  65. D’Ajello, P.C.T.; Fiori, M.A.; Pasa, A.A.; Kipervaser, Z.G. Reaction-Diffusion Interplay in Electrochemical Deposition Processes. A Theoretical Approach. J. Electrochem. Soc. 2000, 147, 4562–4566. [Google Scholar] [CrossRef]
  66. Luo, G.; Li, D.; Yuan, G.; Li, N. Potentiostatic Current Transient for Multiple Nucleation: A Limited-Diffusion Process Description. J. Electrochem. Soc. 2018, 165, D147–D151. [Google Scholar] [CrossRef]
  67. Volgin, V.M.; Volgina, O.V.; Davydov, A.D. Finite difference method of simulation of non-steady-state ion transfer in electrochemical systems with allowance for migration. Comput. Biol. Chem. 2003, 27, 185–196. [Google Scholar] [CrossRef]
  68. Myland, J.C.; Oldham, K.B. Convolutive modelling in the absence of supporting electrolyte: Coping with migration and changing resistance in predicting voltammetry. J. Electroanal. Chem. 2002, 529, 66–74. [Google Scholar] [CrossRef]
  69. Chadwick, A.F.; Vardar, G.; DeWitt, S.; Sleightholme, A.E.S.; Monroe, C.W.; Siegel, D.J.; Thornton, K. Computational Model of Magnesium Deposition and Dissolution for Property Determination via Cyclic Voltammetry. J. Electrochem. Soc. 2016, 163, A1813–A1821. [Google Scholar] [CrossRef]
  70. Isaev, V.A. Electrochemical Phase Formation; UrO RAN: Ekaterinburg, Russia, 2007. (In Russian) [Google Scholar]
  71. Galus, Z. Fundamentals of Electrochemical Analysis, 2nd ed.; Ellis Horwood: New York, NY, USA, 1994. [Google Scholar]
  72. Bard, A.J.; Faulkner, L.R. Electrochemical Methods: Fundamentals and Applications, 2nd ed.; Wiley: New York, NY, USA, 2001. [Google Scholar]
  73. Brown, B.W.; Banks, E. The Sodium Tungsten Bronzes. J. Am. Chem. Soc. 1954, 76, 963–966. [Google Scholar] [CrossRef]
  74. Walkenbach, J. Excel 2013 Power Programming with VBA; Wiley: New York, NY, USA, 2013. [Google Scholar]
  75. Metso. HSC Chemistry. Available online: www.outotec.com/HSC (accessed on 15 July 2023).
Figure 1. Effect of potential sweep parameters on CVs recorded using a Pt(111) working electrode in the 0.8Na2WO4–0.2WO3 melt at 1023 K. Variation of (a) reverse potential, Eλ, or (b) scan rate, ν.
Materials 16 07207 g001
Figure 2. Time dependencies of the current in the 0.8Na2WO4–0.2WO3 melt on Pt(111) at 1023 K. Range of potentials: (a) −1.00 ≤ E ≤ −0.50 V; and (b) −1.20 ≤ E ≤ −1.00 V.
Materials 16 07207 g002
Figure 3. SEM images of an electrode surface area with the deposit formed during the potentiostatic electrolysis of the 0.8Na2WO4–0.2WO3 melt at 1023 K. Potential and electrolysis time values: (ac) E = −1.05 V and t = 5 s; (d) E = −1.20 V and t = 60 s. The elemental composition is given in Table 1. Elemental maps for samples obtained under similar conditions are shown in Figures S2 and S3.
Materials 16 07207 g003
Figure 4. (a) XRD pattern for OTB crystals formed during the electrolysis of the 0.8Na2WO4–0.2WO3 melt at T = 1023 K and E = −1.05 V for 15 s; (b) XRD pattern of the sample shown in Figure 3d. The original XRD patterns are additionally provided in Figures S4 and S5.
Materials 16 07207 g004
Figure 5. Scheme of the supposed chemical and electrochemical reactions in the normal (a) and formalized (b) form. Reagents present in the melt are highlighted in blue. Two solid products (tungsten and OTB) are highlighted in gray and yellow, respectively. Symbols and reaction numbers from the formalized scheme are used in the equations below.
Materials 16 07207 g005
Figure 6. Comparison of experimental and fitted CVs for deposits of different phase compositions. The deposit consists of (a) OTB and tungsten (see Section 4.1); (b,c) two OTBs (see Section 4.2); (d) OTB with a sodium-depleted surface layer (see Section 4.3). For (a) the dotted line is calculated for the case where peak A′ is related to tungsten dissolution and peak A″ is related to OTB dissolution, while the dashed line corresponds to the opposite case.
Materials 16 07207 g006
Figure 7. (a) The results of fitting a set of CVs at different reverse overpotentials and (b) the corresponding calculated overpotential dependencies of the OTB crystal size; (c) The results of fitting a set of CVs at different scan rates; and (d) the corresponding calculated overpotential dependencies of the OTB crystal size. The dissolution process is simulated according to the model described in Section 4.3. The coefficient of determination, R2, is at least 0.998 for any CV.
Materials 16 07207 g007
Figure 8. (a) Combined and (b) final schemes of OTB formation providing optimal fitting.
Materials 16 07207 g008
Figure 9. Flows of W n O 3 n + 1 2 and W n O 3 n due to reactions (7) and (8) resulting in the OTB’s growth/dissolution. The contributions are calculated for one OTB crystal at ηλ = 1.20 V and ν = 0.10 V·s−1.
Materials 16 07207 g009
Figure 10. (a) Calculated overpotential dependence for the W n O 3 n surface concentration corresponding to the cyclic voltammogram in the inset; (b) calculated concentration profiles for W n O 3 n at several points marked in Figure 10a. The concentration profile color corresponds to the dot color.
Materials 16 07207 g010
Table 1. Elemental analysis at the points marked in Figure 3.
SpectrumConcentration, at.%
ONaWPt
162.0217.8920.09-
248.7116.3234.97-
37.50--92.50
412.98-2.3584.67
559.3417.6121.691.36
68.76-0.9290.32
712.14-1.3086.56
813.84-1.9684.20
951.9720.2527.79-
109.51-90.49-
1142.51-57.49-
1236.24-63.76-
Table 2. Parameter values found by fitting using diagram 8b.
Parametersν = 0.1 V·s–1ηλ = 1.2 VAverage ValueStandard Deviation
ηλ, Vν, V·s–1
1.131.151.200.20.30.4
D W n O 3 n , cm2s−13.99 × 10−54.59 × 10−54.59 × 10−54.50 × 10−54.51 × 10−54.39 × 10−54.43 × 10−52.28 × 10−6
K b 7 c , cm·s–14.59 × 10155.16 × 10155.31 × 10155.14 × 10155.17 × 10155.44 × 10155.13 × 10152.90 × 1014
K b 7 a , cm·s –11.55 × 10204.79 × 10204.28 × 10204.71 × 10205.19 × 10205.77 × 10203.88 × 10201.42 × 1020
K f 7 up , cm·s –11.05 × 10−111.18 × 10−111.21 × 10−111.17 × 10−111.18 × 10−111.24 × 10−111.17 × 10−116.57 × 10⁻¹³
K f 7 in , cm·s –15.56 × 10−73.29 × 10−74.40 × 10−73.58 × 10−73.29 × 10−73.44 × 10−73.93 × 10−79.01 × 10−8
K b 7 in , cm·s –13.35 × 10153.76 × 10153.87 × 10153.75 × 10153.77 × 10153.96 × 10153.74 × 10152.11 × 1014
K b 8 c , cm·s –11.11 × 10208.94 × 10198.30 × 10199.28 × 10191.05 × 10201.23 × 10201.01 × 10201.50 × 1019
K b 8 a , cm·s –11.52 × 10201.15 × 10201.00 × 10201.09 × 10201.26 × 10201.58 × 10201.27 × 10202.34 × 1019
K f 8 up , cm·s –128.0323.9822.1922.9025.7531.2125.683.43
K f 8 in , cm·s –160.3583.6382.19102.6293.3396.9786.5215.01
K b 8 in , cm·s –11.22 × 10201.74 × 10202.03 × 10202.51 × 10202.12 × 10201.99 × 10201.94 × 10204.32 × 1019
k 0 9 , cm−2s−12.34 × 10152.36 × 10152.18 × 10152.35 × 10152.45 × 10152.47 × 10152.36 × 10151.04 × 1014
ζ0max0.6840.8210.9320.8620.7440.660
Δζ/ζmax0.2140.0900.0440.0990.1370.178
NOTB, cm−25.04 × 1033.66 × 1033.47 × 1036.13 × 1038.41 × 1031.58 × 104
Disclaimer/Publisher’s Note: The statements, opinions and data contained in all publications are solely those of the individual author(s) and contributor(s) and not of MDPI and/or the editor(s). MDPI and/or the editor(s) disclaim responsibility for any injury to people or property resulting from any ideas, methods, instructions or products referred to in the content.

