

Modeling of the Lattice Dynamics in Strontium Titanate Films of Various Thicknesses: Raman Scattering Studies

 , , , , ,
Abstract
1. Introduction
2. Materials and Methods
- The lattice parameters increase with the thickness of the STO films and tend to reach the values of the three-dimensional bulk structure (Table A1);
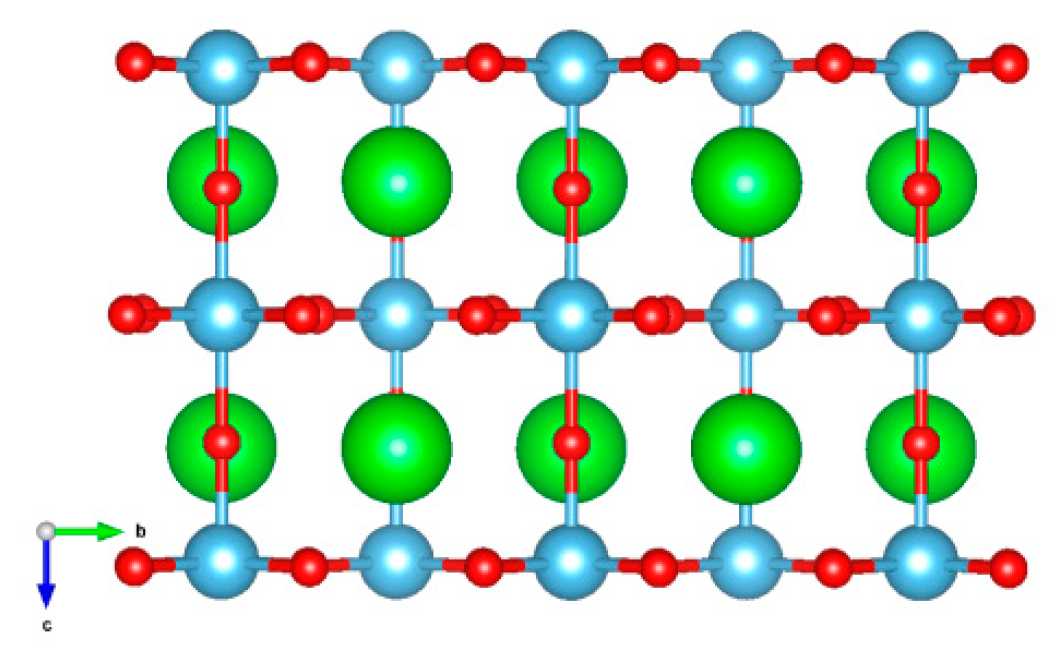
- The surfaces of the film models appear uneven. Because there are no neighbors at the top, the atoms in the surface layers experience more uncompensated attraction from the atoms of the deeper layers, which, compared to the bulk model, leads to a shortening of the interatomic distances in the direction perpendicular to the surface (inward relaxation). As shown in Table A2, because the surface layers contain different atomic species, the chemical bonds between the surface and the second layer from the top are shortened differently, resulting in a surface-rumpling effect;
- The dependence of the structural data on the film thickness calculated for the STO film models is given in Table A3. In agreement with the experimental data of Wang et al. [4], our results for the fully relaxed bonding geometries indicate that the in- and out-of-plane Sr–Sr distances increase and decrease, respectively, moving toward the values of the bulk STO. For film thicknesses between 1.5 and 3.9 nm (i.e., 9- and 11-layer films), no significant change in the out-of-plane lattice parameter near the film center was observed.
3. Main Results and Discussion

4. Conclusions
Author Contributions
Funding
Acknowledgments
Conflicts of Interest
Appendix A

| STO | Lattice Parameters | |||||
|---|---|---|---|---|---|---|
| a (Å) | b (Å) | c (Å) | Alpha (°) | Beta (°) | Gamma (°) | |
| Bulk exp 1 | 5.510 | 5.510 | 7.798 | 90 | 90 | 90 |
| Bulk | 5.455 | 5.455 | 7.755 | 90 | 90 | 90 |
| 5-layer film | 5.393 | 5.393 | - | 90.00 | 90.00 | 90.00 |
| 9-layer film | 5.418 | 5.418 | - | 90.00 | 90.00 | 90.00 |
| 13-layer film | 5.429 | 5.429 | - | 90.00 | 90.00 | 90.00 |
| 17-layer film | 5.434 | 5.422 | - | 90.00 | 90.00 | 90.00 |
| 21-layer film | 5.438 | 5.438 | - | 90.00 | 90.00 | 90.00 |
| STO Film | Thickness (Å) | Atom |
|---|---|---|
| 5-layer | 7.60 | Ti |
| 7.76 | O | |
| 9-layer | 15.36 | Ti |
| 15.52 | O | |
| 13-layer | 23.12 | Ti |
| 23.28 | O | |
| 17-layer | 30.88 | Ti |
| 31.03 | O | |
| 21-layer | 38.63 | Ti |
| 38.79 | O |
| STO | Thick-Ness, Å | Sr–Sr between SrO Layers, Å | Sr–Sr in SrO Layers, Å | Ti–Ti between TiO2 Layers (Out-Of-Plane), Å | Ti–Ti in TiO2 (In-Plane), Å | Ti–O in TiO2 Layers, Å | O–O between TiO2 Layers, Å |
|---|---|---|---|---|---|---|---|
| 5-layer film | 7.60 (Ti–Ti) 7.76 (O–O) | 4.11 | 3.81 | 3.80 | 3.81 | Central layer 1.92, surface layer 1.91 | 3.89 |
| 9-layer film | 15.36 (Ti–Ti) 15.52 (O–O) | Near to center 3.92, near to surface 4.00 | 3.83 | Near to center 3.88, near to surface 3.80 | 3.83 | Central layer and between 1.93, surface layer 1.92 | Near to center 3.9, near to surface 3.89 |
| 13-layer film | 23.12 (Ti–Ti) 23.28 (O–O) | Near to center (2 SrO layers) 3.89, between 3.91, near to surface 3.99 | 3.84 | Near to center 3.89, between 3.87, near to surface 3.80 | 3.84 | 1.93, surface layer 1.92 | 3.91, near to surface 3.86 |
| 17-layer film | 30.88 (Ti–Ti) 31.03 (O–O) | Near to center (4 SrO layers) 3.89, between 3.90, near to surface 3.99 | 3.84 | Near to center 3.89, between 3.88, near to surface 3.87, surface 3.80 | 3.84 | 1.93, surface layer 1.92 | 3.91, surface layer 3.86 |
| 21-layer flm | 38.63 (Ti–Ti) 38.79 (O–O) | Near to center (6 SrO layers) 3.89, between 3.90, near to surface 3.98 | 3.85 | Near to center 3.89, between 3.88, near to surface 3.87, surface 3.79 | 3.85 | 1.93, surface layer 1.92 | 3.90, surface layer 3.86 |
| Bulk | 3.87 | 3.86 | 3.88 | 3.86 | 1.94 | 3.88 |
| Modes | Frequency, cm−1 (Intensity, Arb. Units) | ||||||
|---|---|---|---|---|---|---|---|
| 5 Layers | 9 Layers | 13 Layers | 17 Layers | 21 Layers | Bulk (Calc) | Bulk (Exp) | |
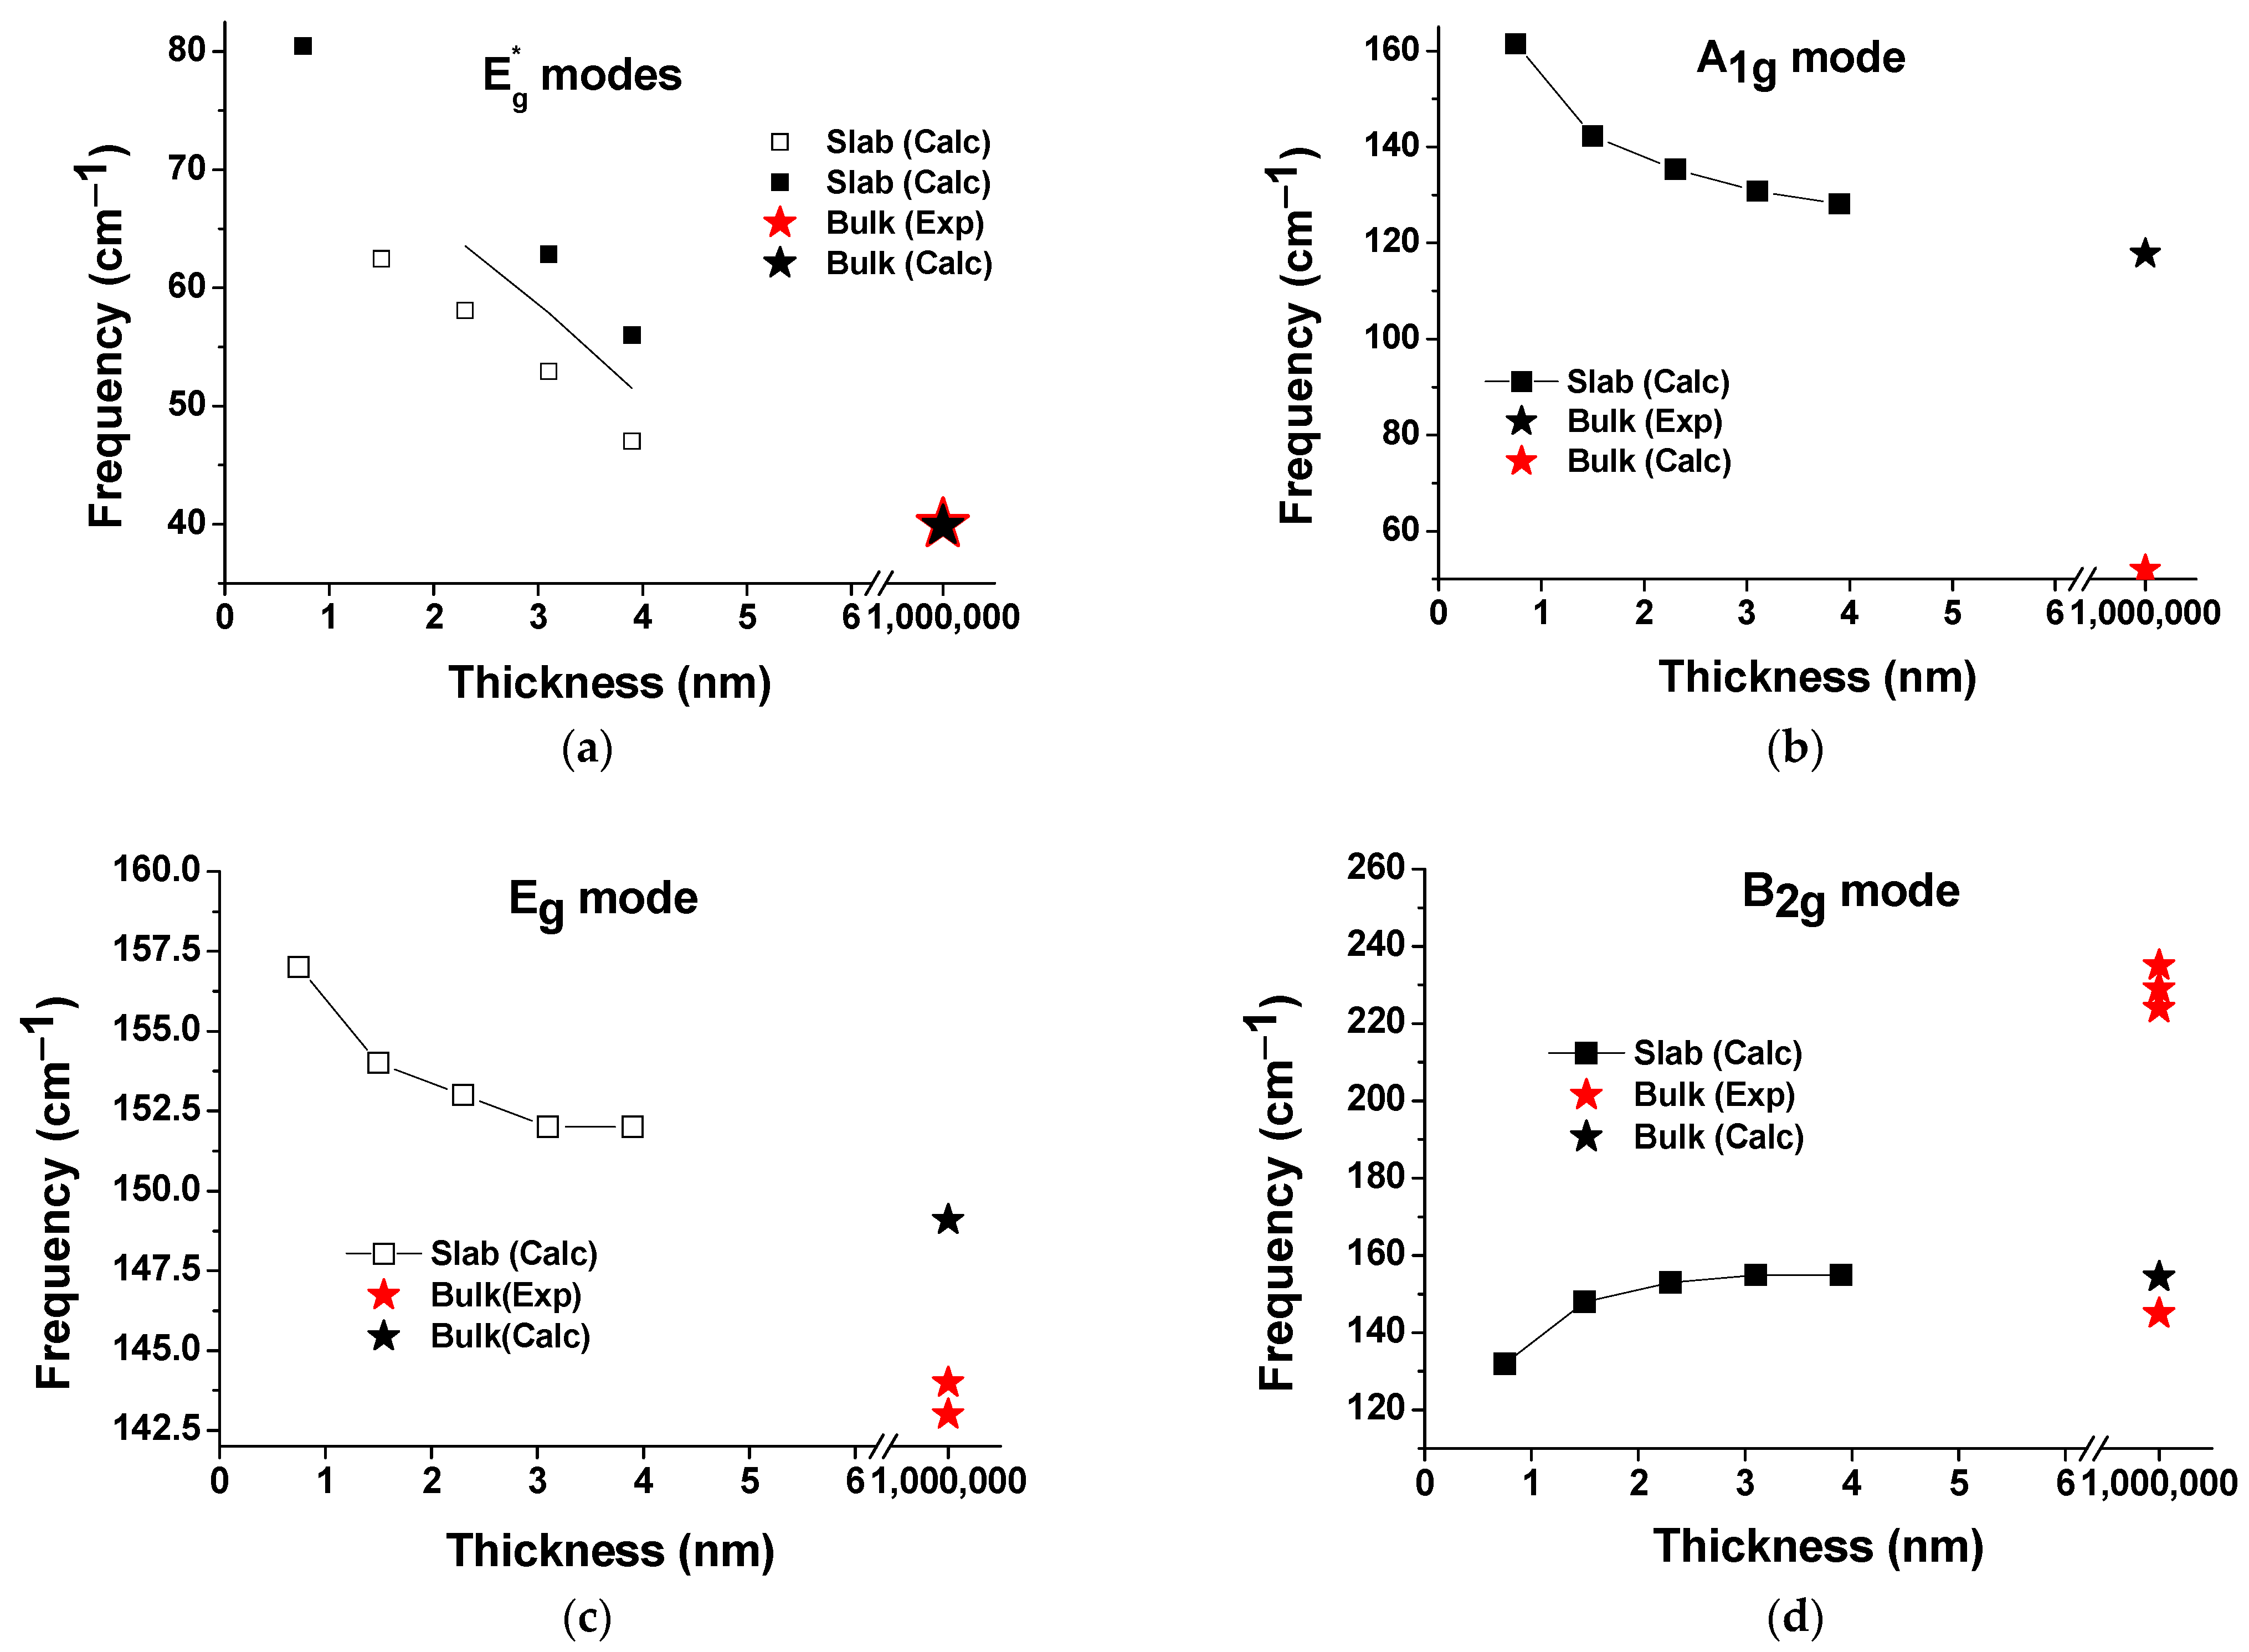
| 80.46 (1) (16.32) | 62.46 (1) (4.36) | 58.08 (1) (0.98) | 52.93 (1),(2) (0.29) 62.83 (1),(3) (26.86) | 47.03 (1),(2) (2.8) 55.99 (1),(3) (11.6) | 39.85 16.63) | 11 [67], 15 [47], 40 [48] | |
| A1g | 161.47 (4.46) | 142.23 (19.69) | 135.35 (33.32) | 130.79 (38.44) | 128.14 (39.49) | 117.74 (323.56) | 44 [68], 48 [47], 52 [48] |
| Eg | 157.29 (1.13) | 153.80 (1.76) | 153.03 (0.58) | 151.64 (0.99) | 152.02 (0.84) | 149.06 (5.53) | 143 [47], 144 [68] |
| B2g | 132.36 (3) (2.88) | 148.17 (3) (40.55) | 153.29 (3) (94.75) | 154.78 (3) (115.06) | 155.18 (3) (118.34) | 154.48 (157.28) | 145 [46], 224 [45], 229 [48], 235 [47] |
| B2g | 450.73 (3) (109.74) | 447.76 (3) (471.86) | 445.81 (3) (880.15) | 444.86 (3) (1000) | 444.22 (3) (1000) | 442.02 (1000) | |
| Eg | 415.56 (3) (0.22) | 432.02 (3) (0.82) | 437.48 (3) (1.49) | 439.85 (3) (1.69) | 441.13 (3) (1.71) | 444.51 (81.5) | 420 [67], 445 [68], 447 [48], 460 [47] |
| B1g | 477.37 (2) (33.77) | 461.42 (2) (23.69) | 452.91 (2) (23.99) | 447.98 (2),(4) (18.83) | 444.82 (2),(4) (14.42) | 517.80 (868.17) | |
| 537.11 (3) (177.18) | 532.37 (3) (515.84) | 528.57 (3) (814.40) | 525.62 (3) (759.07) | 523.57 (3) (617.54) | |||
| 552.17 (3) (1.96) | 538.94 (3) (61.10) | 533.00 (3) (197.07) | 529.80 (3) (318.38) | ||||
References
- Lines, M.E.; Glass, A.M. Principles and Applications of Ferroelectrics and Related Materials; Oxford University Press: Oxford, UK, 2001. [Google Scholar] [CrossRef]
- Strukov, B.A.; Levanyuk, A.P. Ferroelectric Phenomena in Crystals; Springer: Berlin/Heidelberg, Germany, 2011. [Google Scholar]
- Rabe, K.M.; Dawber, M.; Lichtensteiger, C.; Ahn, C.H.; Triscone, J.-M. Modern Physics of Ferroelectrics:Essential Background BT—Physics of Ferroelectrics: A Modern Perspective; Springer: Berlin/Heidelberg, Germany, 2007; pp. 1–30. [Google Scholar] [CrossRef]
- Xu, Y. Ferroelectric Materials and Their Applications. Jpn. J. Appl. Phys. 2014, 53, 09P001. [Google Scholar] [CrossRef]
- Randall, C.A.; Reaney, I. Complex Media of Ferroelectric and Related Materials. Proc. SPIE 2001, 4467, 16–19. [Google Scholar] [CrossRef]
- Phillpot, S.R.; Sinnott, S.B.; Asthagiri, A. Atomic-Level Simulation of Ferroelectricity in Oxides: Current Status and Opportunities. Annu. Rev. Mater. Res. 2007, 37, 239–270. [Google Scholar] [CrossRef]
- Polking, M.J.; Alivisatos, A.P.; Ramesh, R. Synthesis, Physics, and Applications of Ferroelectric Nanomaterials. MRS Commun. 2015, 5, 27–44. [Google Scholar] [CrossRef]
- Scheerer, G.; Boselli, M.; Pulmannova, D.; Rischau, C.W.; Waelchli, A.; Gariglio, S.; Giannini, E.; van der Marel, D.; Triscone, J.-M. Ferroelectricity, Superconductivity, and SrTiO3—Passions of K.A. Müller. Condens. Matter 2020, 5, 60. [Google Scholar] [CrossRef]
- Collignon, C.; Lin, X.; Rischau, C.W.; Fauqué, B.; Behnia, K. Metallicity and Superconductivity in Doped Strontium Titanate. Annu. Rev. Condens. Matter Phys. 2019, 10, 25–44. [Google Scholar] [CrossRef]
- He, X.; Lin, F.; Liu, F.; Shi, W. Tunable Strontium Titanate Terahertz All-Dielectric Metamaterials. J. Phys. D Appl. Phys. 2020, 53, 155105. [Google Scholar] [CrossRef]
- Neophytou, M.; De Bastiani, M.; Gasparini, N.; Aydin, E.; Ugur, E.; Seitkhan, A.; Moruzzi, F.; Choaie, Y.; Ramadan, A.J.; Troughton, J.R.; et al. Enhancing the Charge Extraction and Stability of Perovskite Solar Cells Using Strontium Titanate (SrTiO3) Electron Transport Layer. ACS Appl. Energy Mater. 2019, 2, 8090–8097. [Google Scholar] [CrossRef]
- Stöcker, H.; Hanzig, J.; Zschornak, M.; Mehner, E.; Jachalke, S.; Richter, C.; Hanzig, F.; Meutzner, F.; Leisegang, T.; Meyer, D.C. Strontium Titanate: From Symmetry Changes to Functionality. Cryst. Res. Technol. 2017, 52, 1600222. [Google Scholar] [CrossRef]
- Yang, H.; Yan, F.; Lin, Y.; Wang, T. Novel Strontium Titanate-Based Lead-Free Ceramics for High-Energy Storage Applications. ACS Sustain. Chem. Eng. 2017, 5, 10215–10222. [Google Scholar] [CrossRef]
- Rowley, S.E.; Spalek, L.J.; Smith, R.P.; Dean, M.P.M.; Itoh, M.; Scott, J.F.; Lonzarich, G.G.; Saxena, S.S. Ferroelectric Quantum Criticality. Nat. Phys. 2014, 10, 367–372. [Google Scholar] [CrossRef]
- Phoon, B.L.; Lai, C.W.; Juan, J.C.; Show, P.-L.; Pan, G.-T. Recent Developments of Strontium Titanate for Photocatalytic Water Splitting Application. Int. J. Hydrogen Energy 2019, 44, 14316–14340. [Google Scholar] [CrossRef]
- Tomioka, Y.; Shirakawa, N.; Shibuya, K.; Inoue, I.H. Enhanced Superconductivity Close to a Non-Magnetic Quantum Critical Point in Electron-Doped Strontium Titanate. Nat. Commun. 2019, 10, 738. [Google Scholar] [CrossRef] [PubMed]
- Marshall, M.S.J.; Becerra-Toledo, A.E.; Marks, L.D.; Castell, M.R. Defects on Strontium Titanate BT—Defects at Oxide Surfaces; Jupille, J., Thornton, G., Eds.; Springer International Publishing: Cham, Switzerland, 2015. [Google Scholar] [CrossRef]
- Deak, D.S. Strontium Titanate Surfaces. Mater. Sci. Technol. 2007, 23, 127–136. [Google Scholar] [CrossRef]
- Anaraki, K.S.; Gaponenko, N.V.; Rudenko, M.V.; Kolos, V.V.; Petlitskii, A.N.; Turtsevich, A.S. Thin-Film Capacitor Based on the Strontium Titanate Formed by the Sol Gel Technique. Russ. Microelectron. 2015, 44, 425–429. [Google Scholar] [CrossRef]
- Shende, R.V.; Krueger, D.S.; Rossetti, G.A.; Lombardo, S.J. Strontium Zirconate and Strontium Titanate Ceramics for High-Voltage Applications: Synthesis, Processing, and Dielectric Properties. J. Am. Ceram. Soc. 2001, 84, 1648–1650. [Google Scholar] [CrossRef]
- Kopač, D.; Likozar, B.; Huš, M. How Size Matters: Electronic, Cooperative, and Geometric Effect in Perovskite-Supported Copper Catalysts for CO2 Reduction. ACS Catal. 2020, 10, 4092–4102. [Google Scholar] [CrossRef]
- Mu, L.; Zhao, Y.; Li, A.; Wang, S.; Wang, Z.; Yang, J.; Wang, Y.; Liu, T.; Chen, R.; Zhu, J.; et al. Enhancing Charge Separation on High Symmetry SrTiO3 Exposed with Anisotropic Facets for Photocatalytic Water Splitting. Energy Environ. Sci. 2016, 9, 2463–2469. [Google Scholar] [CrossRef]
- Itahashi, Y.M.; Ideue, T.; Saito, Y.; Shimizu, S.; Ouchi, T.; Nojima, T.; Iwasa, Y. Nonreciprocal Transport in Gate-Induced Polar Superconductor SrTiO3. Sci. Adv. 2020, 6, eaay9120. [Google Scholar] [CrossRef]
- Hu, Y.; Tan, O.K.; Cao, W.; Zhu, W. A Low Temperature Nano-Structured SrTiO3 Thick Film Oxygen Gas Sensor. Ceram. Int. 2004, 30, 1819–1822. [Google Scholar] [CrossRef]
- Gerblinger, J.; Meixner, H. Fast Oxygen Sensors Based on Sputtered Strontium Titanate. Sens. Actuators B Chem. 1991, 4, 99–102. [Google Scholar] [CrossRef]
- Rahman, M.A.; Ahmed, T.; Walia, S.; Sriram, S.; Bhaskaran, M. Oxygen-Deficient Strontium Titanate Based Stretchable Resistive Memories. Appl. Mater. Today 2018, 13, 126–134. [Google Scholar] [CrossRef]
- Kim, C.H.; Ahn, Y.; Son, J.Y. SrTiO3-Based Resistive Switching Memory Device with Graphene Nanoribbon Electrodes. J. Am. Ceram. Soc. 2016, 99, 9–11. [Google Scholar] [CrossRef]
- Yang, Y.; Sun, B.; Zhou, G.; Ke, C.; Zhang, J.; Zhou, Y.; Mao, S.; Qin, J.; Zhao, Y. Improved Resistive Switching Performance and In-Depth Mechanism Analysis in Mn-Doped SrTiO3-Based RRAM. Mater. Today Commun. 2023, 35, 105512. [Google Scholar] [CrossRef]
- Zhang, R.Z.; Gao, Y.W.; Wang, J.S.; Li, L.; Su, W.S. Leaching Properties of Immobilization of HLW into SrTiO3 Ceramics. In Advanced Textile Materials; Advanced Materials Research; Trans Tech Publications Ltd: Wollerau, Switzerland, 2011; Volume 332, pp. 1807–1811. [Google Scholar] [CrossRef]
- Jayabal, P.; Sasirekha, V.; Mayandi, J.; Jeganathan, K.; Ramakrishnan, V. A Facile Hydrothermal Synthesis of SrTiO3 for Dye Sensitized Solar Cell Application. J. Alloy. Compd. 2014, 586, 456–461. [Google Scholar] [CrossRef]
- Okamoto, Y.; Fukui, R.; Fukazawa, M.; Suzuki, Y. SrTiO3/TiO2 Composite Electron Transport Layer for Perovskite Solar Cells. Mater. Lett. 2017, 187, 111–113. [Google Scholar] [CrossRef][Green Version]
- Koch, R. The Intrinsic Stress of Polycrystalline and Epitaxial Thin Metal Films. J. Phys. Condens. Matter 1994, 6, 9519. [Google Scholar] [CrossRef]
- Murakami, M. Deformation in Thin Films by Thermal Strain. J. Vac. Sci. Technol. A 1991, 9, 2469–2476. [Google Scholar] [CrossRef]
- Ma, C.; Chen, C. Pulsed Laser Deposition for Complex Oxide Thin Film and Nanostructure. In Advanced Nano Deposition Methods; John Wiley & Sons Ltd.: Hoboken, NJ, USA, 2016; pp. 1–31. [Google Scholar] [CrossRef]
- Wang, T.; Ganguly, K.; Marshall, P.; Xu, P.; Jalan, B. Critical Thickness and Strain Relaxation in Molecular Beam Epitaxy-Grown SrTiO3 Films. Appl. Phys. Lett. 2013, 103, 212904. [Google Scholar] [CrossRef]
- Lin, Y.C.; Wang, B.L.; Yen, W.T.; Ha, C.T.; Peng, C. Effect of Process Conditions on the Optoelectronic Characteristics of ZnO:Mo Thin Films Prepared by Pulsed Direct Current Magnetron Sputtering. Thin Solid Film. 2010, 518, 4928–4934. [Google Scholar] [CrossRef]
- Kahouli, A. Effect of Film Thickness on Structural, Morphology, Dielectric and Electrical Properties of Parylene C Films. J. Appl. Phys. 2012, 112, 64103. [Google Scholar] [CrossRef]
- Wu, X.; Lai, F.; Lin, L.; Lv, J.; Zhuang, B.; Yan, Q.; Huang, Z. Optical Inhomogeneity of ZnS Films Deposited by Thermal Evaporation. Appl. Surf. Sci. 2008, 254, 6455–6460. [Google Scholar] [CrossRef]
- Sirenko, A.A.; Akimov, I.A.; Fox, J.R.; Clark, A.M.; Li, H.; Si, W.; Xi, X.X. Observation of the First-Order Raman Scattering in SrTiO3 Thin Films. Phys. Rev. Lett. 1999, 82, 4500–4503. [Google Scholar] [CrossRef]
- Du, Y.L.; Chen, G.; Zhang, M.S. Investigation of Structural Phase Transition in Polycrystalline SrTiO3 Thin Films by Raman Spectroscopy. Solid State Commun. 2004, 130, 577–580. [Google Scholar] [CrossRef]
- Merkulov, V.I.; Fox, J.R.; Li, H.-C.; Si, W.; Sirenko, A.A.; Xi, X.X. Metal–Oxide Bilayer Raman Scattering in SrTiO3 Thin Films. Appl. Phys. Lett. 1998, 72, 3291–3293. [Google Scholar] [CrossRef]
- Akimov, I.A.; Sirenko, A.A.; Clark, A.M.; Hao, J.-H.; Xi, X.X. Electric-Field-Induced Soft-Mode Hardening in SrTiO3 Films. Phys. Rev. Lett. 2000, 84, 4625–4628. [Google Scholar] [CrossRef] [PubMed]
- Jang, H.W.; Kumar, A.; Denev, S.; Biegalski, M.D.; Maksymovych, P.; Bark, C.W.; Nelson, C.T.; Folkman, C.M.; Baek, S.H.; Balke, N.; et al. Ferroelectricity in Strain-Free SrTiO3 Thin Films. Phys. Rev. Lett. 2010, 104, 197601. [Google Scholar] [CrossRef] [PubMed]
- Banerjee, S.; Kim, D.-I.; Robinson, R.D.; Herman, I.P.; Mao, Y.; Wong, S.S. Observation of Fano Asymmetry in Raman Spectra of SrTiO3 and CaxSr1−xTiO3 Perovskite Nanocubes. Appl. Phys. Lett. 2006, 89, 223130. [Google Scholar] [CrossRef]
- Rabuffetti, F.A.; Kim, H.; Enterkin, J.A.; Wang, Y.; Lanier, C.H.; Marks, L.D.; Poeppelmeier, K.R.; Stair, P.C. Synthesis-Dependent First-Order Raman Scattering in SrTiO3 Nanocubes at Room Temperature. Chem. Mater. 2008, 20, 5628–5635. [Google Scholar] [CrossRef]
- Gray, D.J.; Merz, T.A.; Hikita, Y.; Hwang, H.Y.; Mabuchi, H. Orientation-Resolved Domain Mapping in Tetragonal SrTiO3 Using Polarized Raman Spectroscopy. Phys. Rev. B 2016, 94, 214107. [Google Scholar] [CrossRef]
- Fleury, P.A.; Scott, J.F.; Worlock, J.M. Soft Phonon Modes and the 110 K Phase Transition in SrTiO3. Phys. Rev. Lett. 1968, 21, 16–19. [Google Scholar] [CrossRef]
- Petzelt, J.; Ostapchuk, T.; Gregora, I.; Rychetsky, I.; Hoffmann-Eifert, S.; Pronin, A.V.; Yuzyuk, Y.; Gorshunov, B.P.; Kamba, S.; Bovtun, V.; et al. Dielectric, Infrared, and Raman Response of Undoped SrTiO3 Ceramics: Evidence of Polar Grain Boundaries. Phys. Rev. B 2001, 64, 184111. [Google Scholar] [CrossRef]
- Taylor, W.; Murray, A.F. Tetragonal SrTiO3 Revisited: The Effect of Impurities on the Raman Spectrum. Solid State Commun. 1979, 31, 937–944. [Google Scholar] [CrossRef]
- Gibhardt, H.; Leist, J.; Eckold, G. Influence of Electric Field and Domain Structure on the Low-Temperature Raman Spectra of SrTiO3 In Fl Uence of Electric Fi Eld and Domain Structure on the Low—Temperature Raman Spectra of SrTiO3. Mater. Res. Express 2015, 2, 015005. [Google Scholar] [CrossRef]
- Blokhin, E.; Evarestov, R.A.; Gryaznov, D.; Kotomin, E.A.; Maier, J. Theoretical Modeling of Antiferrodistortive Phase Transition for SrTiO3 Ultrathin Films. Phys. Rev. B 2013, 88, 241407. [Google Scholar] [CrossRef]
- Youssef, A.H.; Zhang, J.; Ehteshami, A.; Kolhatkar, G.; Dab, C.; Merlen, A.; Ruediger, A. Symmetry-Forbidden-Mode Detection in SrTiO3 Nanoislands with Tip-Enhanced Raman Spectroscopy. J. Phys. Chem. C 2021, 125, 6200–6208. [Google Scholar] [CrossRef]
- Dovesi, R.; Erba, A.; Salustro, S.; Kirtman, B.; Zicovich-wilson, R.O.C.M.; Civalleri, B.; Maschio, L.; Rérat, M.; Casassa, S.; Baima, J. Quantum-Mechanical Condensed Matter Simulations with CRYSTAL. WIREs Comput. Mol. Sci. 2018, 8, e1360. [Google Scholar] [CrossRef]
- Vosko, S.H.; Wilk, L.; Nusair, M. Accurate Spin-Dependent Electron Liquid Correlation Energies for Local Spin Density Calculations: A Critical Analysis. Can. J. Phys. 1980, 58, 1200–1211. [Google Scholar] [CrossRef]
- Piskunov, S.; Heifets, E.; Eglitis, R.I.; Borstel, G. Bulk Properties and Electronic Structure of SrTiO3, BaTiO3, PbTiO3 Perovskites: An Ab Initio HF/DFT Study. Comput. Mater. Sci. 2004, 29, 165–178. [Google Scholar] [CrossRef]
- Available online: https://www.crystal.unito.it/basis_sets.html (accessed on 13 September 2023).
- Maschio, L.; Kirtman, B.; Rérat, M.; Orlando, R.; Dovesi, R. Ab Initio Analytical Raman Intensities for Periodic Systems through a Coupled Perturbed Hartree-Fock/Kohn-Sham Method in an Atomic Orbital Basis. II. Validation and Comparison with Experiments. J. Chem. Phys. 2013, 139, 164102. [Google Scholar] [CrossRef]
- King-Smith, R.D.; Vanderbilt, D. First-Principles Investigation of Ferroelectricity in Perovskite Compounds. Phys. Rev. B 1994, 49, 5828–5844. [Google Scholar] [CrossRef] [PubMed]
- Sai, N.; Vanderbilt, D. First-Principles Study of Ferroelectric and Antiferrodistortive Instabilities in Tetragonal SrTiO3. Phys. Rev. B 2000, 62, 13942–13950. [Google Scholar] [CrossRef]
- Bilc, D.I.; Orlando, R.; Shaltaf, R.; Rignanese, G.-M.; Íñiguez, J.; Ghosez, P. Hybrid Exchange-Correlation Functional for Accurate Prediction of the Electronic and Structural Properties of Ferroelectric Oxides. Phys. Rev. B 2008, 77, 165107. [Google Scholar] [CrossRef]
- Wahl, R.; Vogtenhuber, D.; Kresse, G. SrTiO3 and BaTiO3 Revisited Using the Projector Augmented Wave Method: Performance of Hybrid and Semilocal Functionals. Phys. Rev. B 2008, 78, 104116. [Google Scholar] [CrossRef]
- Lebedev, A.I. Ab Initio Calculations of Phonon Spectra in ATiO3 Perovskite Crystals (A = Ca, Sr, Ba, Ra, Cd, Zn, Mg, Ge, Sn, Pb). Phys. Solid State 2009, 51, 362–372. [Google Scholar] [CrossRef]
- Lebedev, A.I. Metastability Effects in Strained and Stressed SrTiO3 Films. J. Adv. Dielectr. 2016, 06, 1650016. [Google Scholar] [CrossRef]
- Angsten, T.; Martin, L.W.; Asta, M. Orientation-Dependent Properties of Epitaxially Strained Perovskite Oxide Thin Films: Insights from First-Principles Calculations. Phys. Rev. B 2017, 95, 174110. [Google Scholar] [CrossRef]
- Evarestov, R.A.; Blokhin, E.; Gryaznov, D.; Kotomin, E.A.; Maier, J. Phonon Calculations in Cubic and Tetragonal Phases of SrTiO3: A Comparative LCAO and Plane-Wave Study. Phys. Rev. B 2011, 83, 134108. [Google Scholar] [CrossRef]
- Rusevich, L.L.; Kotomin, E.A.; Zvejnieks, G.; Popov, A.I. Ab Initio Calculations of Structural, Electronic and Vibrational Properties of BaTiO3 and SrTiO3 Perovskite Crystals with Oxygen Vacancies. Low Temp. Phys. 2020, 46, 1185. [Google Scholar] [CrossRef]
- Shigenari, T.; Abe, K.; Takemoto, T.; Sanaka, O.; Akaike, T.; Sakai, Y.; Wang, R.; Itoh, M. Raman Spectra of the Ferroelectric Phase of SrTi18O3: Symmetry and Domains below Tc and the Origin of the Phase Transition. Phys. Rev. B 2006, 74, 174121. [Google Scholar] [CrossRef]
- Tenne, D.A.; Gonenli, I.E.; Soukiassian, A.; Schlom, D.G.; Nakhmanson, S.M.; Rabe, K.M.; Xi, X.X. Raman Study of Oxygen Reduced and Re-Oxidized Strontium Titanate. Phys. Rev. B 2007, 76, 024303. [Google Scholar] [CrossRef]
- Tkach, A.; Correia, T.M.; Almeida, A.; Agostinho Moreira, J.; Chaves, M.R.; Okhay, O.; Vilarinho, P.M.; Gregora, I.; Petzelt, J. Role of Trivalent Sr Substituents and Sr Vacancies in Tetragonal and Polar States of SrTiO3. Acta Mater. 2011, 59, 5388–5397. [Google Scholar] [CrossRef]
- Petzelt, J.; Ostapchuk, T.; Gregora, I.; Kuzel, P.; Liu, J.; Shen, Z. Infrared and Raman Studies of the Dead Grain-Boundary Layers in SrTiO3 Fine-Grain Ceramics. J. Phys. Condens. Matter 2007, 19, 196222. [Google Scholar] [CrossRef]
- Krasnenko, V.; Rusevich, L.L.; Platonenko, A.; Mastrikov, Y.A.; Sokolov, M.; Kotomin, E.A. Water Splitting on Multifaceted SrTiO3 Nanocrystals: Calculations of Raman Vibrational Spectrum. Materials 2022, 15, 4233. [Google Scholar] [CrossRef] [PubMed]
- Tisinger, L.H.; Liu, R.; Kulik, J.; Zhang, X.; Ramdani, J.; Demkov, A.A. Ultraviolet-Raman Studies of SrTiO3 Ultrathin Films on Si. J. Vac. Sci. Technol. B 2003, 21, 53–56. [Google Scholar] [CrossRef]


| STO | Raman-Active Modes | IR-Active Modes | Silent Modes |
|---|---|---|---|
| Bulk | 1A1g + 1B1g + 2B2g + 3Eg | 3A2u + 5Eu | 2A2g + A1u + B1u |
| 5-layer film | 6A1g + 2B1g + 4B2g + 10Eg | 6A2u + 12Eu | 4A2g + 4A1u + 4B1u + B2u |
| 9-layer film | 11A1g + 3B1g + 7B2g + 19Eg | 11A2u + 21Eu | 7A2g + 7A1u + 7B1u + 2B2u |
| 13-layer film | 16A1g + 4B1g + 10B2g + 28Eg | 17A2u + 31Eu | 10A2g + 10A1u + 10B1u + 3B2u |
| 17-layer film | 21A1g + 5B1g + 13B2g + 37Eg | 22A2u + 40Eu | 13A2g + 13A1u + 13B1u + 4B2u |
| 21-layer film | 26A1g + 6B1g + 16B2g + 46Eg | 27A2u + 49Eu | 16A2g + 16A1u + 16B1u + 5B2u |
| Modes | Frequency (cm−1) | ||||||
|---|---|---|---|---|---|---|---|
| 5 Layers | 9 Layers | 13 Layers | 17 Layers | 21 Layers | Bulk (Calc) | Bulk (Exp) | |
| 80.46 (1) | 62.46 (1) | 58.08 (1) | 52.93 (1),(2) 62.83 (1),(3) | 47.03 (1),(2) 55.99 (1),(3) | 39.85 | 11 [67], 15 [47], 40 [48] | |
| A1g | 161.47 | 142.23 | 135.35 | 130.79 | 128.14 | 117.74 | 44 [68], 48 [47], 52 [48] |
| Eg | 157.29 | 153.80 | 153.03 | 151.61 | 152.02 | 149.06 | 143 [47], 144 [68] |
| B2g | 132.36 (3) | 148.17 (3) | 153.29 (3) | 154.78 (3) | 155.18 (3) | 154.48 | 145 [46], 224 [45], 229 [48], 235 [47] |
| B2g | 450.73 (3) | 447.76 (3) | 445.81 (3) | 444.86 (3) | 444.22 (3) | 442.02 | |
| Eg | 415.56 (3) | 432.02 (3) | 437.48 (3) | 439.85 (3) | 441.13 (3) | 444.51 | 420 [67], 445 [68], 447 [48], 460 [47] |
| B1g | 477.37 (2) | 461.42 (2) | 452.9 (2) | 447.98 (2),(4) | 444.82 (2),(4) | 517.80 | |
| 537.11 (3) | 532.37 (3) | 528.57 (3) | 525.62 (3) | 523.57 (3) | |||
| 552.17 (3) | 538.94 (3) | 533.00 (3) | 529.80 (3) | ||||
Disclaimer/Publisher’s Note: The statements, opinions and data contained in all publications are solely those of the individual author(s) and contributor(s) and not of MDPI and/or the editor(s). MDPI and/or the editor(s) disclaim responsibility for any injury to people or property resulting from any ideas, methods, instructions or products referred to in the content. |
© 2023 by the authors. Licensee MDPI, Basel, Switzerland. This article is an open access article distributed under the terms and conditions of the Creative Commons Attribution (CC BY) license (https://creativecommons.org/licenses/by/4.0/).
Share and Cite
Krasnenko, V.; Platonenko, A.; Liivand, A.; Rusevich, L.L.; Mastrikov, Y.A.; Zvejnieks, G.; Sokolov, M.; Kotomin, E.A. Modeling of the Lattice Dynamics in Strontium Titanate Films of Various Thicknesses: Raman Scattering Studies. Materials 2023, 16, 6207. https://doi.org/10.3390/ma16186207
Krasnenko V, Platonenko A, Liivand A, Rusevich LL, Mastrikov YA, Zvejnieks G, Sokolov M, Kotomin EA. Modeling of the Lattice Dynamics in Strontium Titanate Films of Various Thicknesses: Raman Scattering Studies. Materials. 2023; 16(18):6207. https://doi.org/10.3390/ma16186207
Chicago/Turabian StyleKrasnenko, Veera, Alexander Platonenko, Aleksandr Liivand, Leonid L. Rusevich, Yuri A. Mastrikov, Guntars Zvejnieks, Maksim Sokolov, and Eugene A. Kotomin. 2023. "Modeling of the Lattice Dynamics in Strontium Titanate Films of Various Thicknesses: Raman Scattering Studies" Materials 16, no. 18: 6207. https://doi.org/10.3390/ma16186207
APA StyleKrasnenko, V., Platonenko, A., Liivand, A., Rusevich, L. L., Mastrikov, Y. A., Zvejnieks, G., Sokolov, M., & Kotomin, E. A. (2023). Modeling of the Lattice Dynamics in Strontium Titanate Films of Various Thicknesses: Raman Scattering Studies. Materials, 16(18), 6207. https://doi.org/10.3390/ma16186207