Article

Solidification and Liquation Cracking in Welds of High Entropy CoCrFeNiCux Alloys

1
Department of Materials Science and Engineering, University of Wisconsin, Madison, WI 53706, USA
2
Department of Mechanical Engineering, Minghsin University of Science and Technology, Hsinchu 30401, Taiwan
*
Author to whom correspondence should be addressed.
Materials 2023, 16(16), 5621; https://doi.org/10.3390/ma16165621
Submission received: 6 July 2023 / Revised: 6 August 2023 / Accepted: 10 August 2023 / Published: 14 August 2023
(This article belongs to the Special Issue Advances in Welding of Alloy and Composites)

Abstract

:
High entropy CoCrFeNiCux alloys with a Cu molar ratio of x ≈ 0, 0.5, 1, 1.5 and 2 were arc welded. Solidification cracking occurred in the fusion zones of alloys with x ≈ 0.5, 1 and 1.5. Cu-rich material was observed around cracks, increasing in quantity with increasing Cu content. Liquation cracking occurred in the partially melted zone next to the fusion zone, and it propagated into the fusion zone as solidification cracking. A recently proposed index for the susceptibility to solidification cracking was tried, i.e., |dT/d(fS)1/2| near (fS)1/2 = 1, where T is temperature and fS the solid fraction. The index was higher in alloys with x ≈ 0.5, 1.0 and 1.5, consistent with the solidification cracking observed.

1. Introduction

Yeh et al. [1] and Cantor [2] independently reported high entropy alloys (HEAs) in 2004. HEAs usually contain several elements in essentially equimolar composition. They can be face-centered cubic (fcc), body-centered cubic (bcc) or hexagonal closest packed (hcp) in structure and have good strength, ductility and corrosion resistance. The equimolar CoCrFeNi alloy has been widely used as the base alloy for adding additional alloying elements, e.g., Mn, Al, Cu, Ti, Mn or Mo, to design new HEAs [3]. HEA CoCrFeNiCu, which contains five elements essentially equimolar in composition, has been studied frequently [4,5,6,7,8,9,10,11,12,13]. CoCrFeNiCu0.5 has also been studied, which contains essentially Co, Cr, Fe and Ni each at 22.2 at% and Cu at 11.1 at% [14].
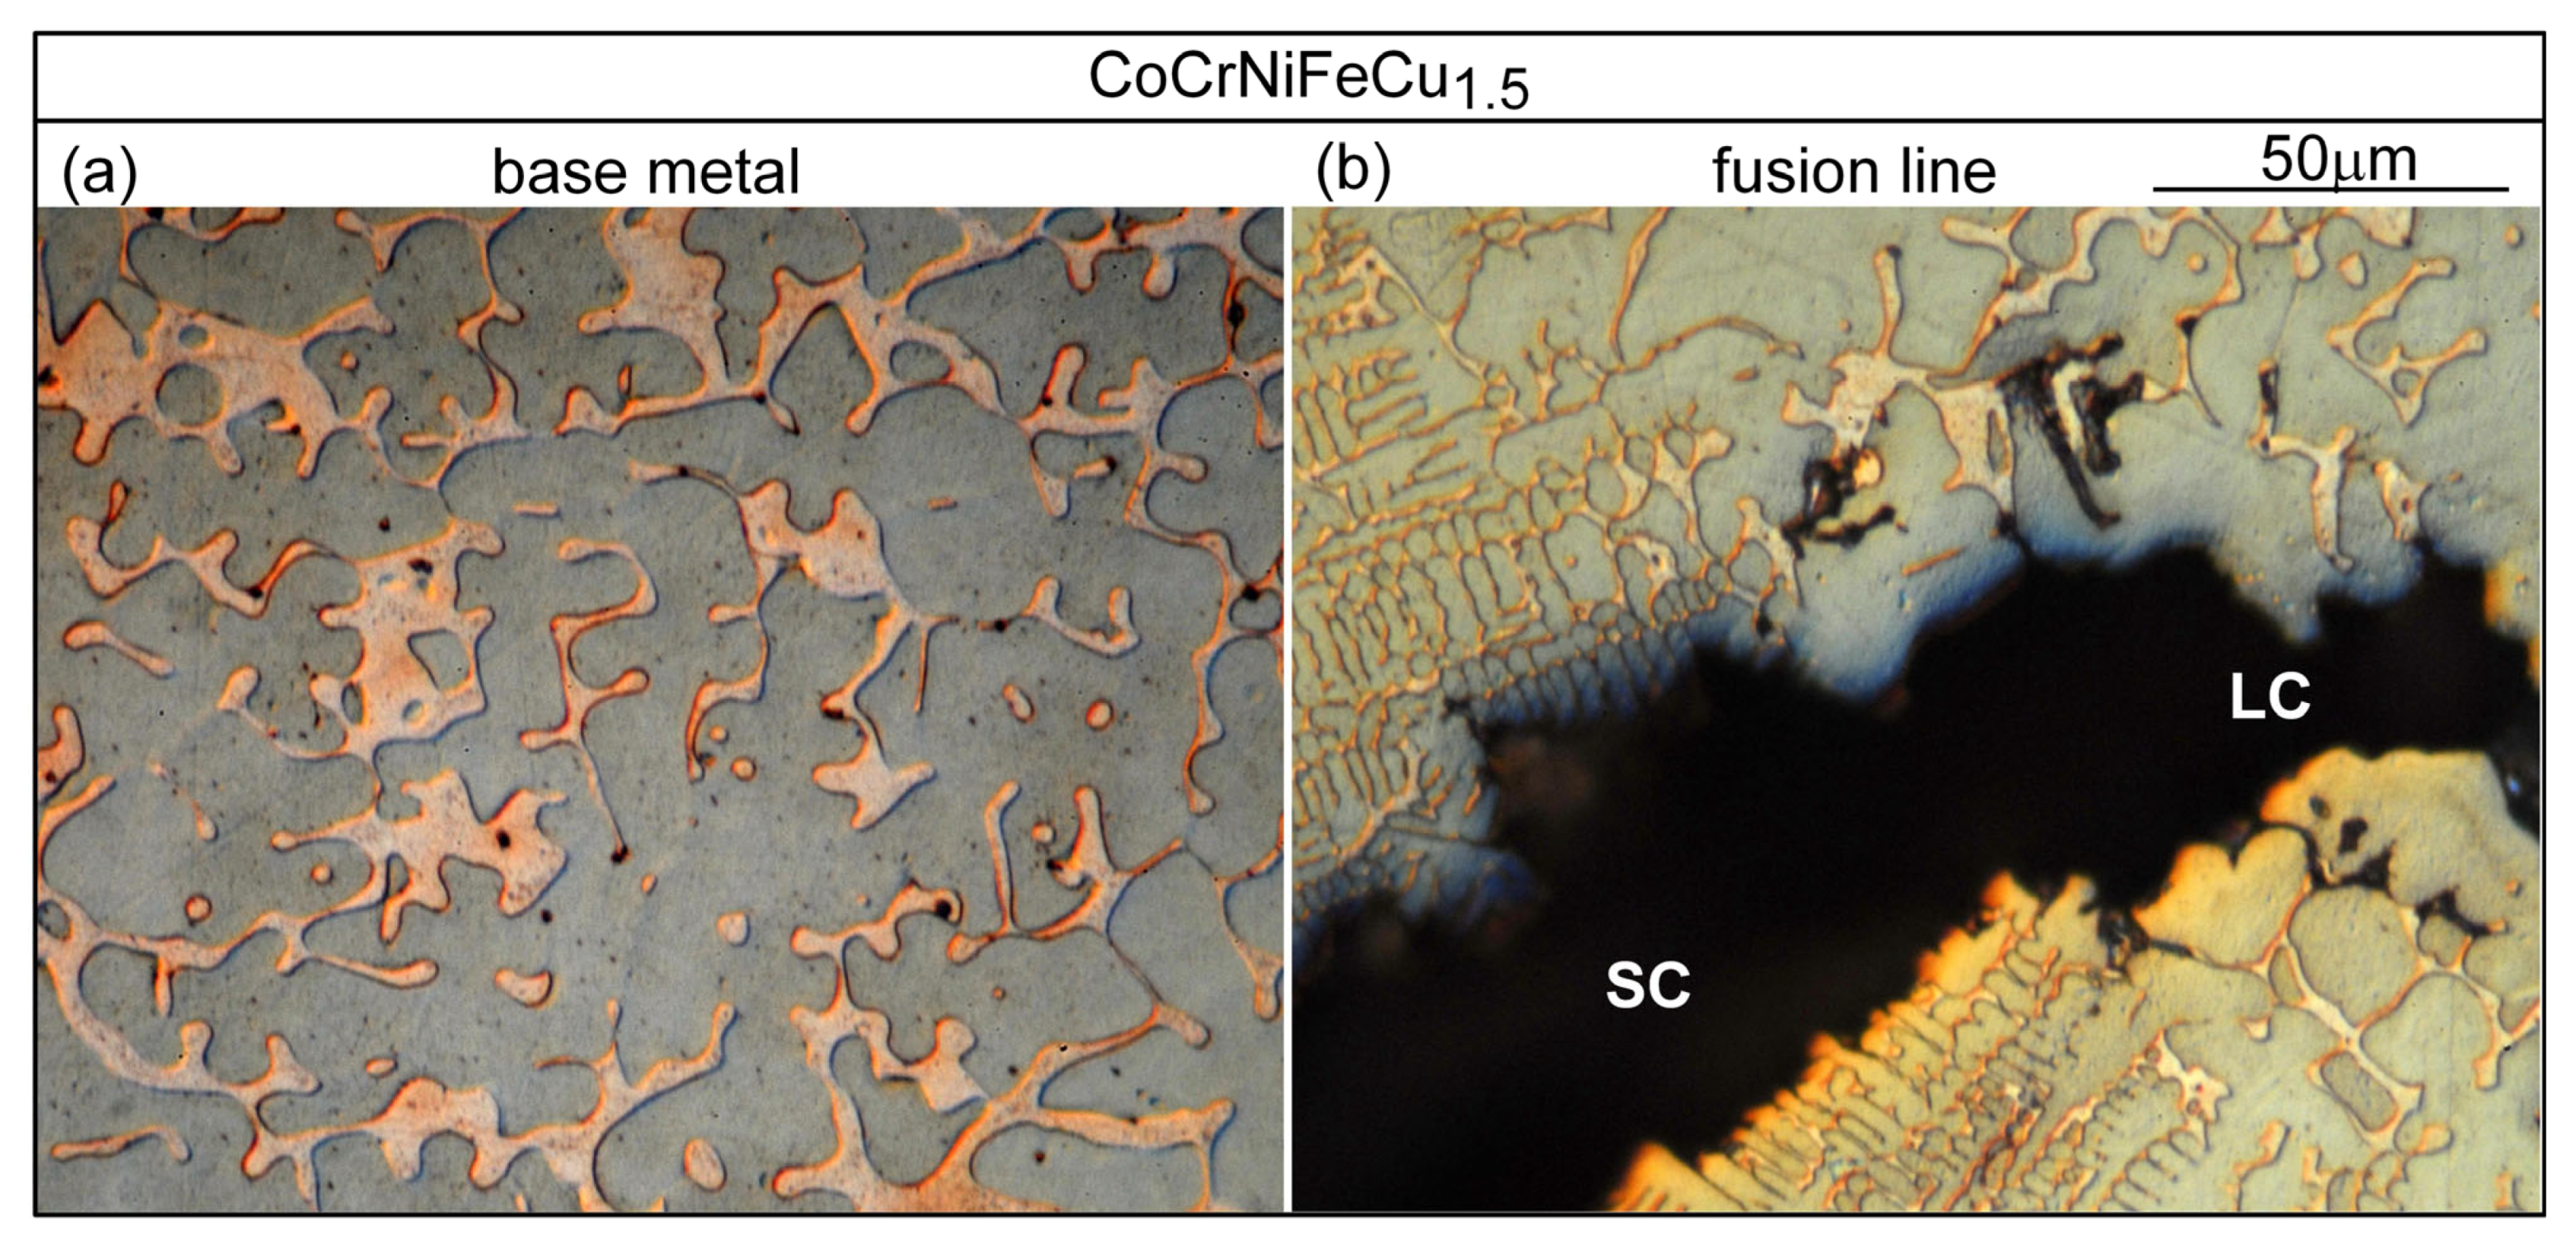
The solidification microstructure of HEA CoCrFeNiCu has been studied by melting and solidification in a crucible [5,11]. One exception is the directional solidification of CoCrFeNiCu [8]. The alloy was cast and machined into a rod of 3.9 mm diameter and inserted into an alumina tube (4 mm ID and 6 mm OD). The tube was withdrawn at predetermined speeds from a 1600 °C Bridgman furnace. The effect of the withdrawal speed on the directional solidification microstructure was shown. No quenching during directional solidification was conducted to reveal the solidification microstructure evolution.
The study on the solidification microstructure of HEA CoCrFeNiCu in welding has focused on fiber laser welding [12,13]. CoCrFeNiCu is likely to have a much wider freezing temperature range than CoCrFeNi and hence a much higher susceptibility to hot cracking. However, hot cracking was avoided in fiber laser welding of CoCrFeNiCu [12,13] perhaps due to the small heat input per unit length of the fiber laser weld.
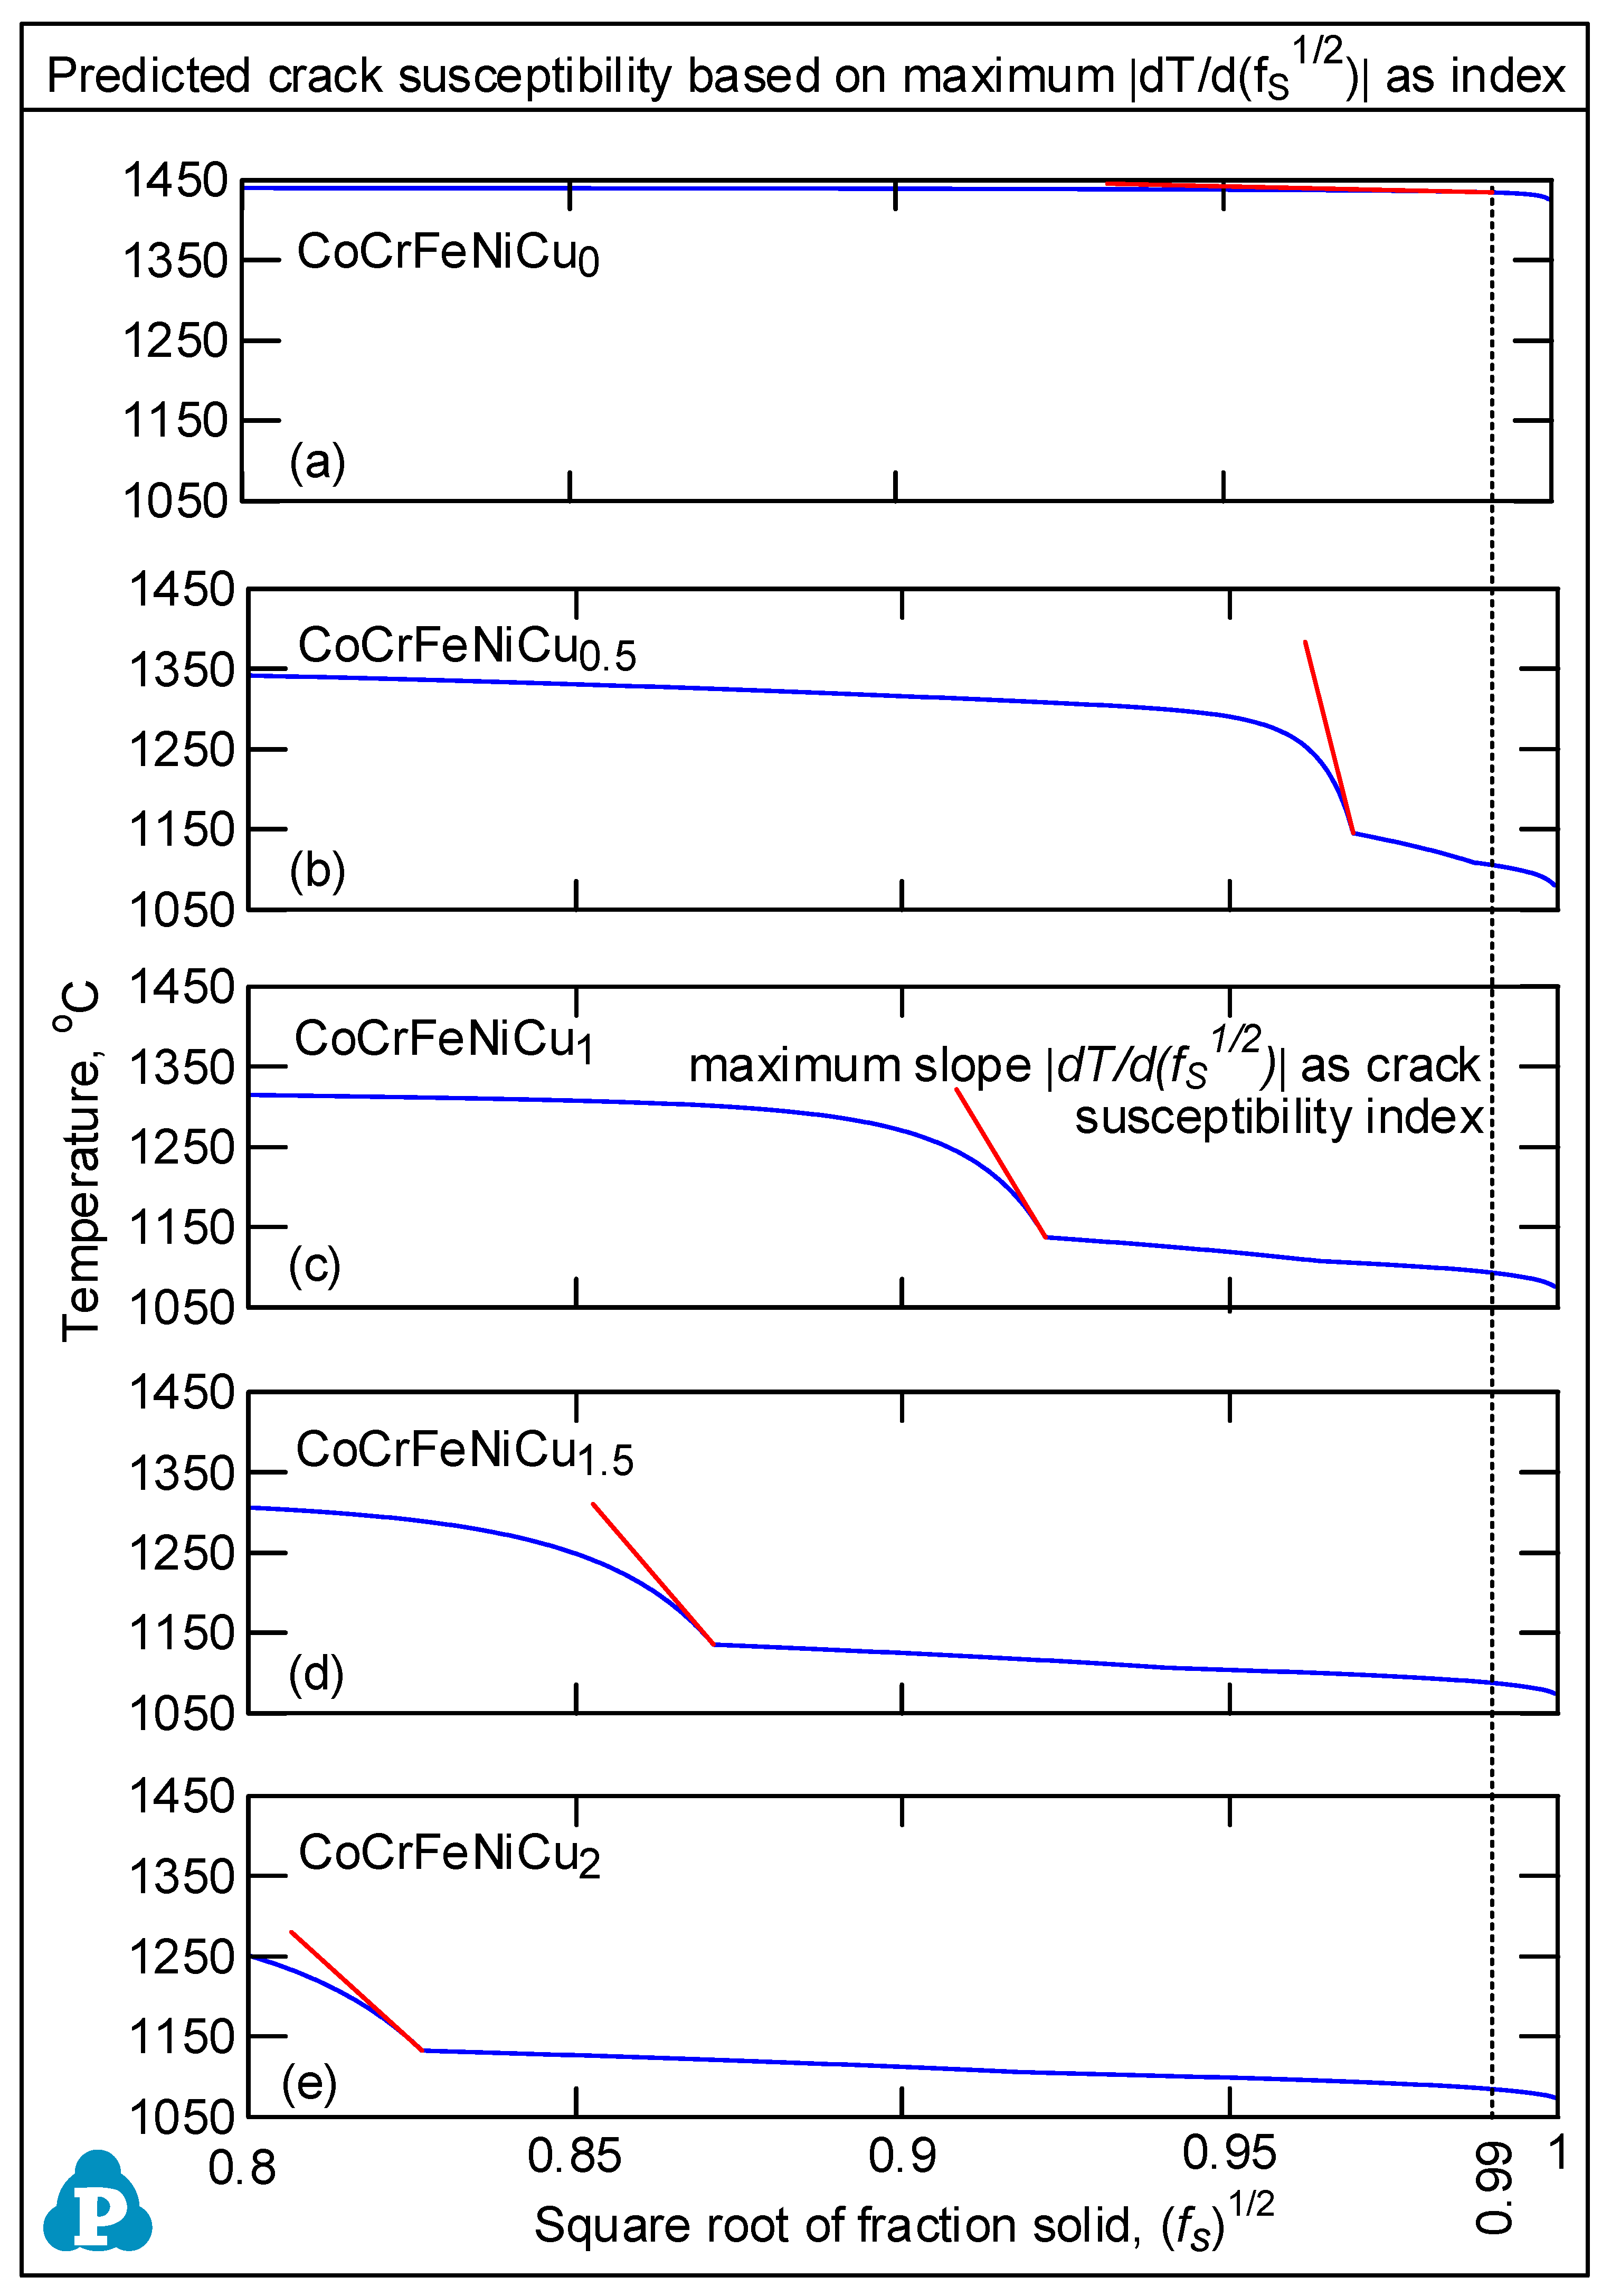
Kou [15] proposed a simple index for the susceptibility to solidification cracking, that is, |dT/d(fS)1/2| near the grain roots, i.e., near (fS)1/2 = 1, where T is temperature and fS the solid fraction. As illustrated in Figure 1, he showed the grain radius rd is proportional to (fS)1/2. Thus, for a given temperature drop |dT|, a higher |dT/d(fS)1/2| indicates a smaller d(fS)1/2 and |drd| and hence a slower lateral growth for grains to bond to each other to resist solidification cracking under tension. The slower lateral growth also allows the narrow channel near the roots to grow longer before bonding, thus slowing down the liquid feeding through the channel that is needed to resist solidification cracking. A convenient option for the index is the maximum |dT/d(fS)1/2| up to (fS)1/2 = 0.99, i.e., fS = 0.98 [16]. Based on the alloy composition, the T-fS curve and hence T-(fS)1/2 curve can be plotted using, for example, commercial thermodynamics software Pandat2019 [16] and databases PanHEA2019 [17] of CompuTherm, LLC, Madison, WI. dT/d(fS)1/2 is the slope of the T-(fS)1/2 curve, and |dT/d(fS)1/2|is the steepness. The validity of the index has been verified against the experimental data of Al alloys [18,19,20] and steels [21,22,23].
The purpose of the present study was to explore the arc weldability of CoCrFeNiCux alloys by examining their susceptibility to hot cracking during welding, including solidification cracking in the fusion zone and liquation cracking in the partially melted zone. The index |dT/d(fS)1/2| for the susceptibility to solidification cracking will be compared with the solidification cracking observed in arc welding.

2. Materials and Methods

The preparation of the HEAs CoCrFeNiCux is described as follows. Raw elemental metals above 99.9 at%, about 200 g total, were arc-melted in a water-cooled Cu mold inside a vacuum chamber filled with ultrahigh purity Ar gas. Each ingot was remelted in the Cu mold at least five times to improve the macroscopic chemical homogeneity. The ingot was then induction remelted in a vacuum chamber and cast into another water-cooled Cu mold. Each of the resultant ingots was about 25.4 mm (1 inch) wide, 12.7 mm (0.5 inch) thick and 62.2 mm (2.45 inch) long. Their compositions are shown in Table 1. As shown, these alloys are close to but not exactly equimolar in Co, Cr, Fe and Ni. Likewise, the Cu molar ratio x is close to but not exactly 0.5, 1.0, 1.5 or 2.0. For convenience of discussion however, x = 0, 0.5, 1.0, 1.5 and 2.0 will be used to indicate these alloys.
The ingots were cut by electric discharge machining into small coupons 25.4 mm (1 inch) wide, 1.5 mm (0.06 inch) thick and 62.2 mm (2.45 inch) long. Conventional tests for the susceptibility to solidification cracking, such as the widely used Varestraint test [24] and the recently developed Transverse-Tension weldability test [25], were not used because the coupons were very limited in length and width. Instead, bead-on-plate welding was conducted by gas-tungsten arc welding (GTAW) without a filler metal. GTAW was conducted along the centerline of the coupon along its length direction. The welding current was 50–55 A, the voltage 9.5 V, and the travel speed 1.48 mm/s (3.5 ipm). The polarity was direct current electrode negative. Welding grade Ar was used as the shielding gas, directed at both the top and bottom surfaces of the workpiece at the flow rate of 16.5 L/minute or 35 CFH (cubic feet per hour).
The top surfaces of the resultant welds were examined visually for cracks that occurred during welding. The welds were then cut, polished, and etched electrochemically with a solution consisting of 60 g of oxalic acid in 600 mL of water for microstructure examination by optical microscopy.

3. Results and Discussion

3.1. Solidification Cracking

Figure 2 shows an example of an ingot after being cut by electric discharge machining. The as-cut surface is smooth. However, it reveals the internal porosity inside the ingot.
Figure 3 shows the resultant welds, including the fusion zones, craters (the weld pools that solidified at the end of welding) and surrounding areas. Solidification cracking is known to occur in the fusion zone and/or the weld crater during solidification [26]. Alloy CoCrFeNiCu0 shows no cracks anywhere. Alloy CoCrFeNiCu2 shows solidification cracks only in the crater. Alloys CoCrFeNiCu0.5, CoCrFeNiCu1 and CoCrFeNiCu1.5 are similar in the sense that they all show solidification cracks in both the fusion zone and the crater and in the sense that centerline cracking propagates throughout the fusion zone. Thus, based on the extent of fusion-zone cracking, alloys CoCrFeNiCu0.5, CoCrFeNiCu1 and CoCrFeNiCu1.5 are most susceptible. It is likely that alloy CoCrFeNiCu1.5 could have shown less cracking in the fusion zone than that shown in Figure 3d if cracking were not initiated by the porosity in the base metal near the starting point of the weld. Also, CoCrFeNiCu0.5 could have shown much more cracking if it had the same weld length as CoCrFeNiCu1.5. Furthermore, in CoCrFeNiCu0.5 it is clear that centerline cracking propagates further into the crater.
The extent of cracking in the crater can also be used to evaluate the susceptibility to solidification cracking [27,28]. As compared to the fusion zone, when the arc is turned off suddenly at the end of welding, the weld pool solidifies and shrinks much more rapidly, allowing less time for liquid backfilling from the pool (through intergranular channels) to heal cracks [15]. Thus, the crater can be more sensitive to solidification cracking than the fusion zone. As can be seen in Figure 3, alloys CoCrFeNiCu0.5 and CoCrFeNiCu1 show the most severe crater cracking in view of their widely open crater cracks. The total length of crater cracks is greater in CoCrFeNiCu0.5 than CoCrFeNiCu1. Thus, based on cracking both in the fusion zone and the crater, the susceptibility to solidification cracking can be ranked in the decreasing order of CoCrFeNiCu0.5 > CoCrFeNiCu1 > CoCrFeNiCu1.5 > CoCrFeNiCu2 > CoCrFeNiCu0. It can be said that alloys CoCrFeNiCu0.5, CoCrFeNiCu1 and CoCrFeNiCu1.5 are most susceptible to solidification cracking, followed by CoCrFeNiCu2, with CoCrFeNiCu0 being the least susceptible.

3.2. Solidification Cracking Susceptibility Index

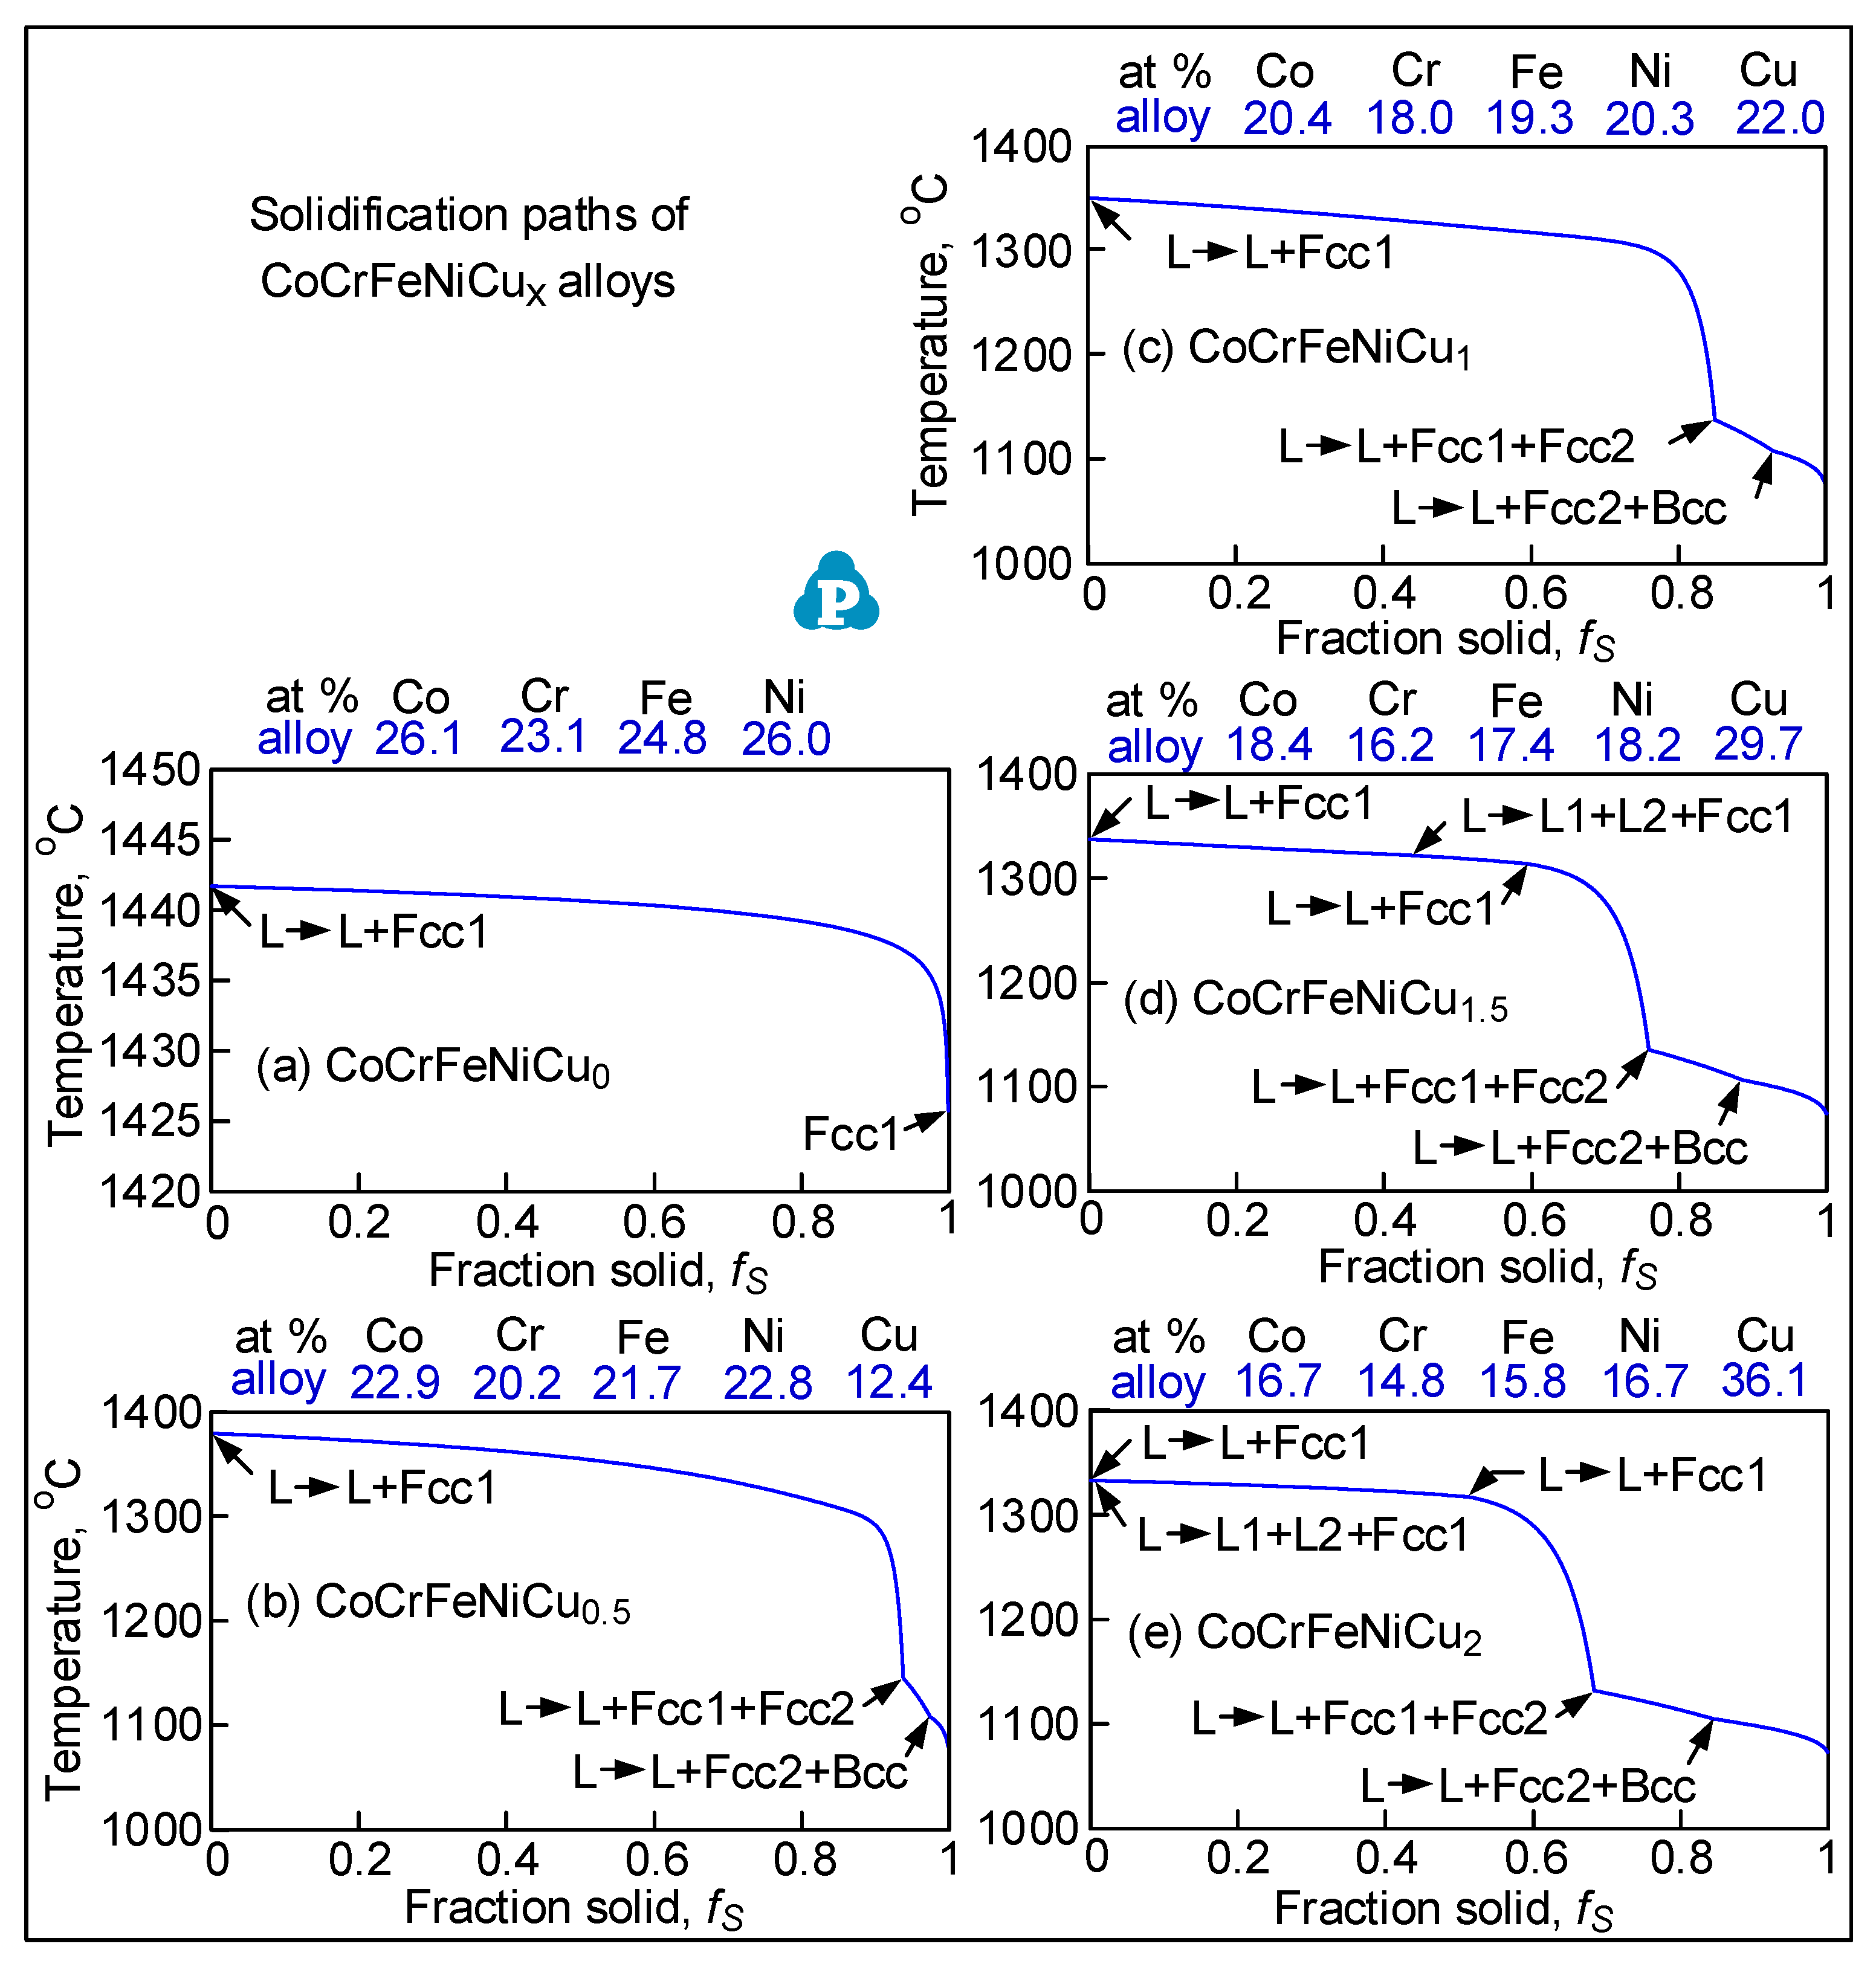
Figure 4 shows the solidification paths of CoCrFeNiCux, that is, the curves of temperature T vs. solid fraction fS during solidification. For alloy CoCrFeNiCu0, the freezing temperature range is extremely narrow, only about 16 °C. The primary solidification phase is the fcc phase Fcc1. With Cu as an additional alloying element, however, the freezing temperature range becomes much wider, that is, 298 °C for CoCrFeNiCu0.5, 275 °C for CoCrFeNiCu1, 264 °C for CoCrFeNiCu1.5, and 260 °C for CoCrFeNiCu2. The primary solidification phase is still Fcc1 and is Cu-lean. However, as solidification proceeds further, a Cu-rich fcc phase Fcc2 and a Cr-rich bcc phase Bcc also forms [14]. The higher the Cu content of the alloy, the earlier Fcc2 and Bcc start to form from the liquid.
Figure 5 shows the T-(fS)1/2 curves of the alloys. Since the maximum |dT/d(fS)1/2| up to (fS)1/2 = 0.99 is taken as the index for the susceptibility to solidification cracking [18], the curves are shown from (fS)1/2 = 0.80 to (fS)1/2 = 1. As shown by the tangents to the curves up to (fS)1/2 = 0.99, the maximum steepness of the tangent and hence the index decreases in the order of CoCrFeNiCu0.5 > CoCrFeNiCu1 > CoCrFeNiCu1.5 > CoCrFeNiCu2 > CoCrFeNiCu0. This is consistent with the ranking of the susceptibility to solidification cracking based on the extent of solidification cracking both in the fusion zone and the crater as shown previously. Figure 1 and Figure 5 can help explain the difference between the alloys and their susceptibility to solidification cracking shown in Figure 3.

3.3. Liquation Cracking

Figure 3 also shows liquation cracking can occur in the partially melted zone (PMZ), which is outside but immediately next to the fusion zone, including the fusion boundary (Figure 3b). Liquation cracking tends to initiate in the PMZ at the starting point of welding and near the crater. It often propagates into the fusion zone as solidification cracking. Like solidification cracking, the susceptibility to liquation cracking can be ranked in the decreasing order of CoCrFeNiCu0.5 > CoCrFeNiCu1 > CoCrFeNiCu1.5 > CoCrFeNiCu2 > CoCrFeNiCu0.

4. Micrographs of Welds

4.1. Solidification Cracking

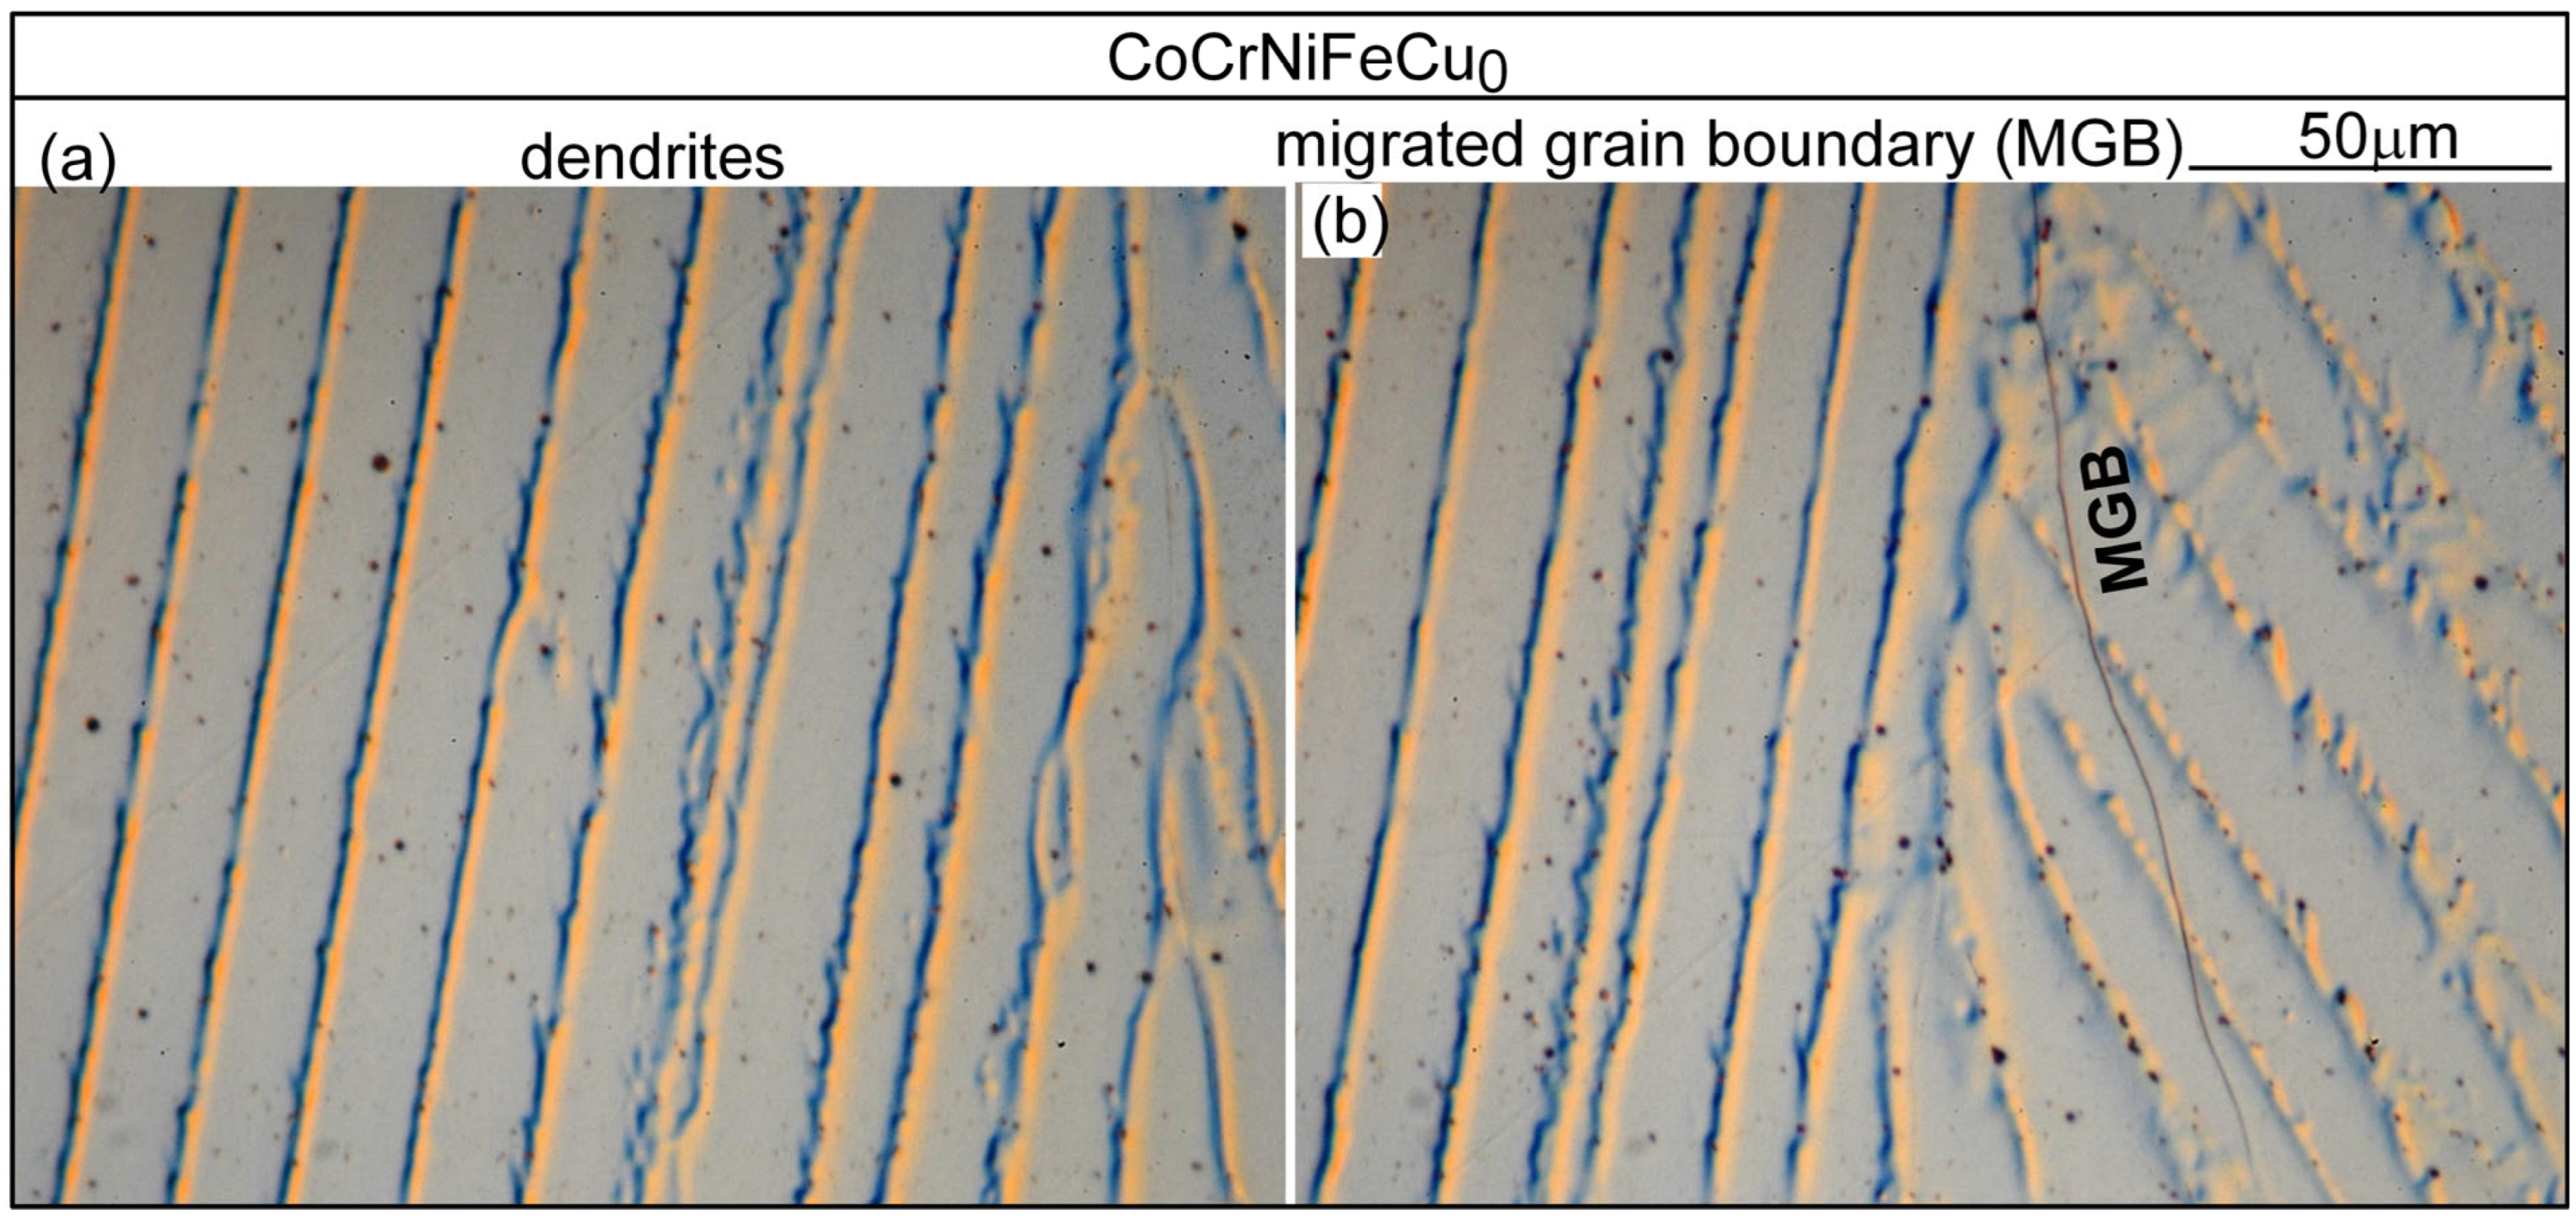
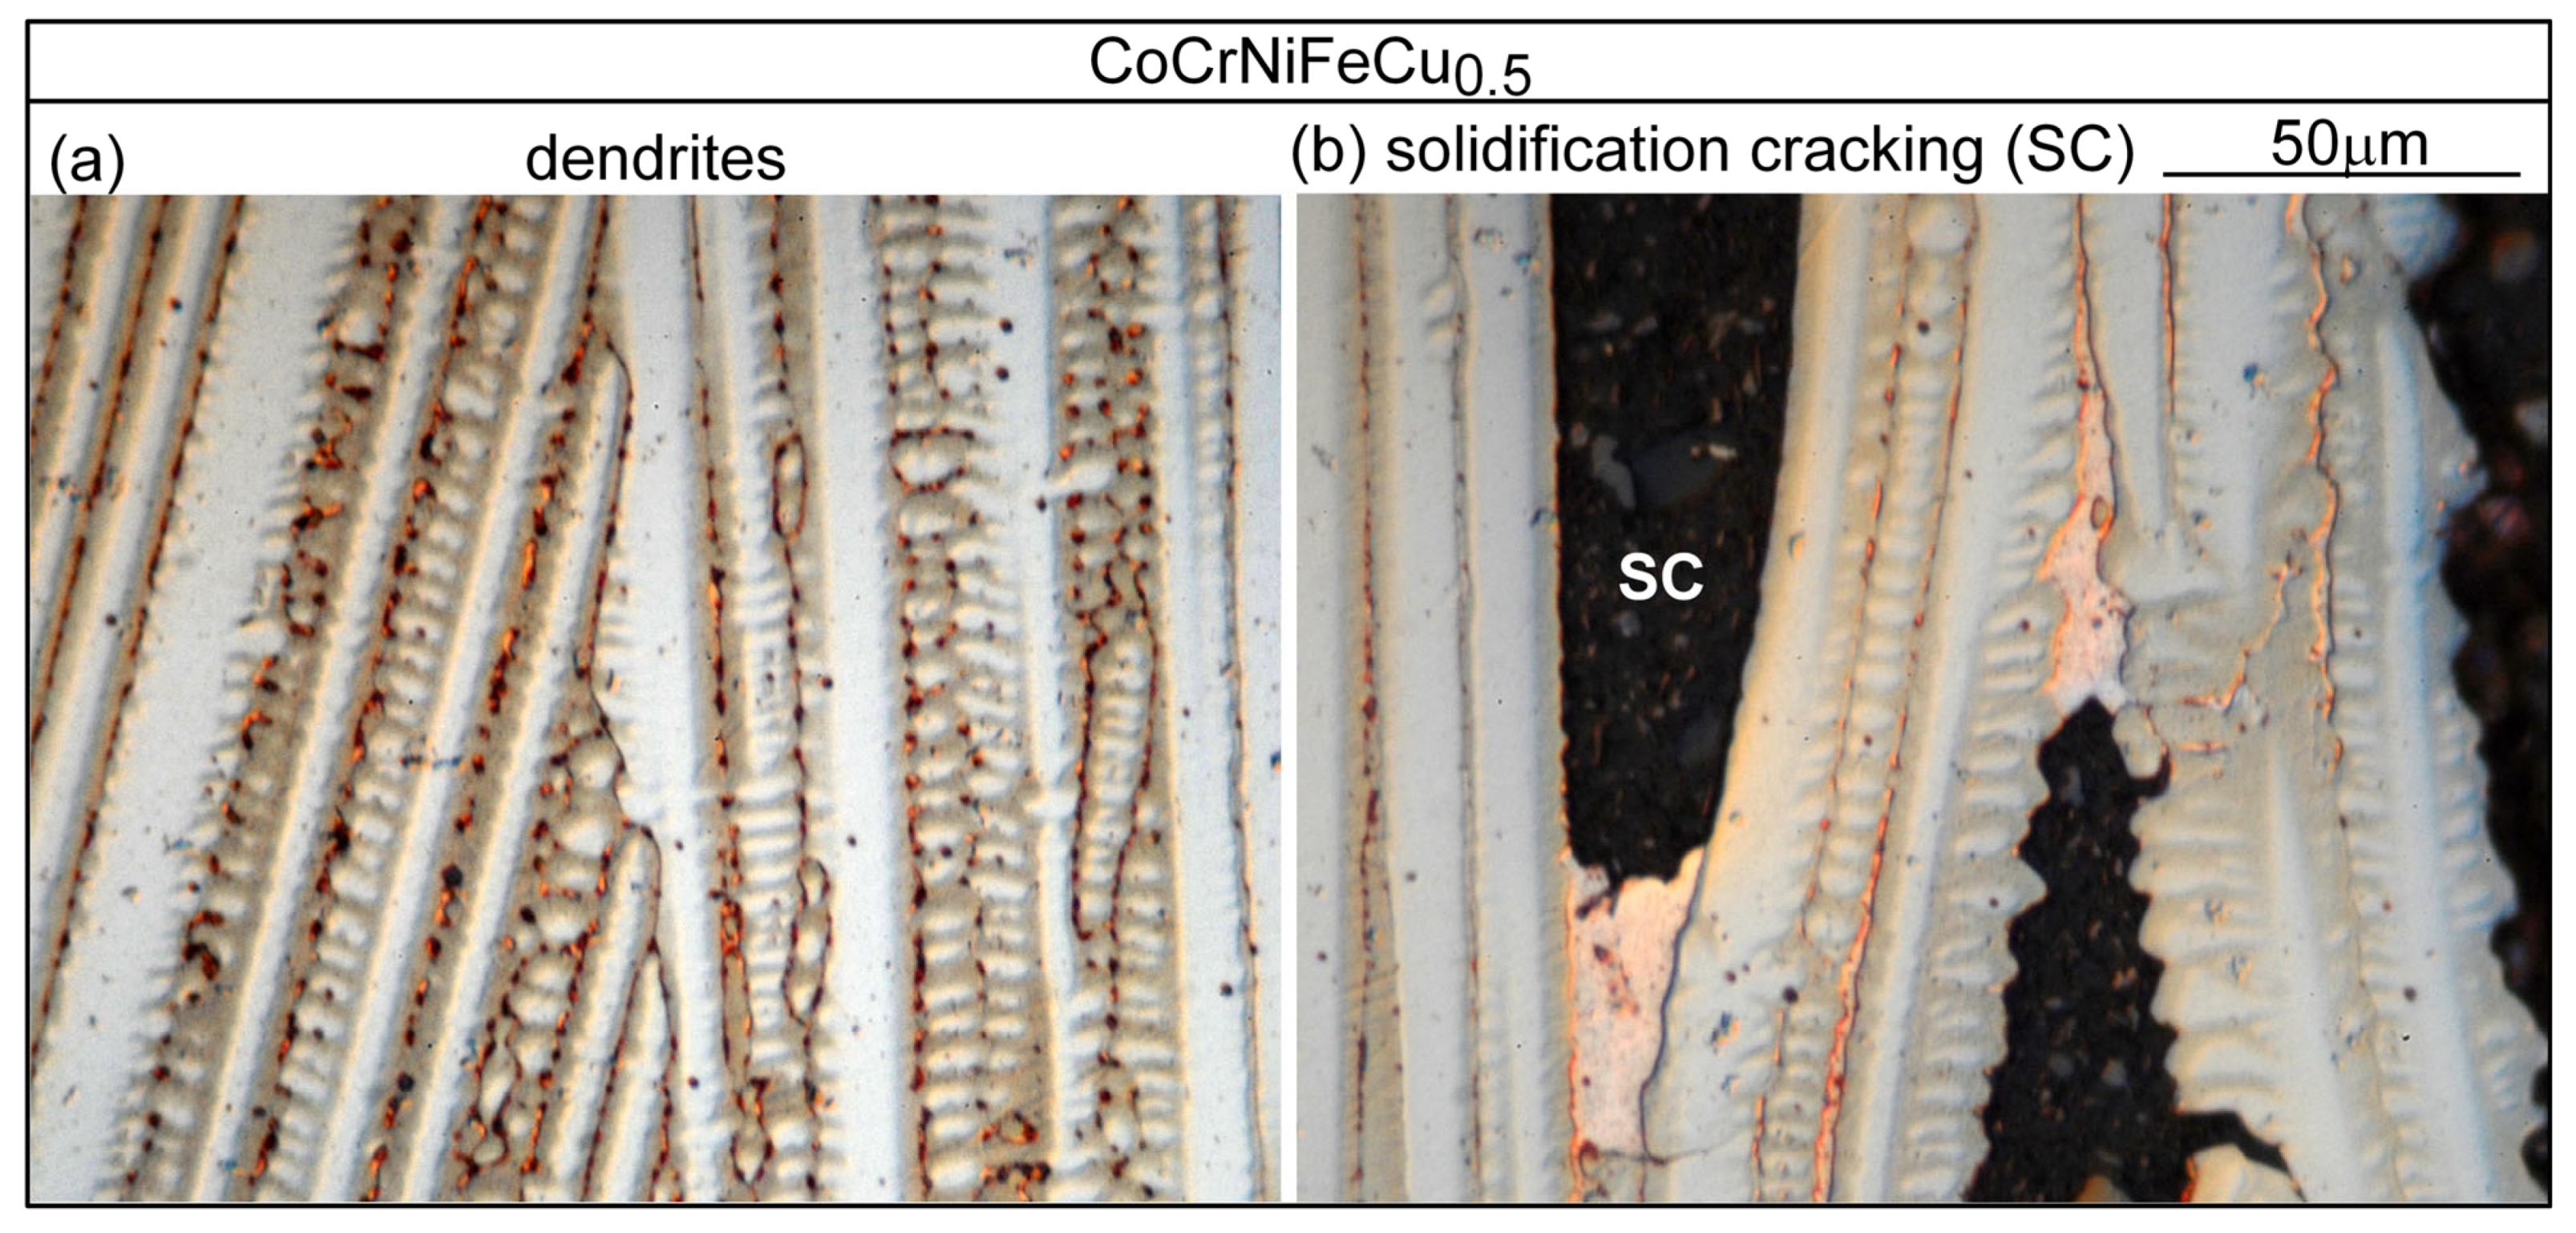
Figure 6 shows the microstructure in the fusion zone of alloy CoCrFeNiCu0. The dendrites are the Fcc1 phase. The secondary dendrite arms are short and hardly recognizable. There are no secondary phases [13], consistent with the solidification path shown in Figure 4a. The dark dots are pits due to corrosion by the etching solution. As shown in Figure 6b, the solidification grain boundary has moved away from its position at the end of solidification to become a migrated grain boundary (MGB). Due to the high solidification temperature and the absence of a secondary phase at the grain boundary to pin it down, solid-state diffusion has caused grain boundary migration [24]. Figure 7 shows the microstructure in the fusion zone of alloy CoCrFeNiCu0.5. Figure 7a shows the microstructure in an area without solidification cracking. The dendrites are the Cu-lean Fcc1 phase. The secondary dendrite arms are short but visible. The Cu-rich secondary phase Fcc2 can be seen in the interdendritic areas. Figure 7b shows the microstructure in an area with solidification cracking. As shown, cracking is intergranular, i.e., along boundaries between dendritic columnar grains. Cu-rich intergranular liquid was present at the moment of cracking.
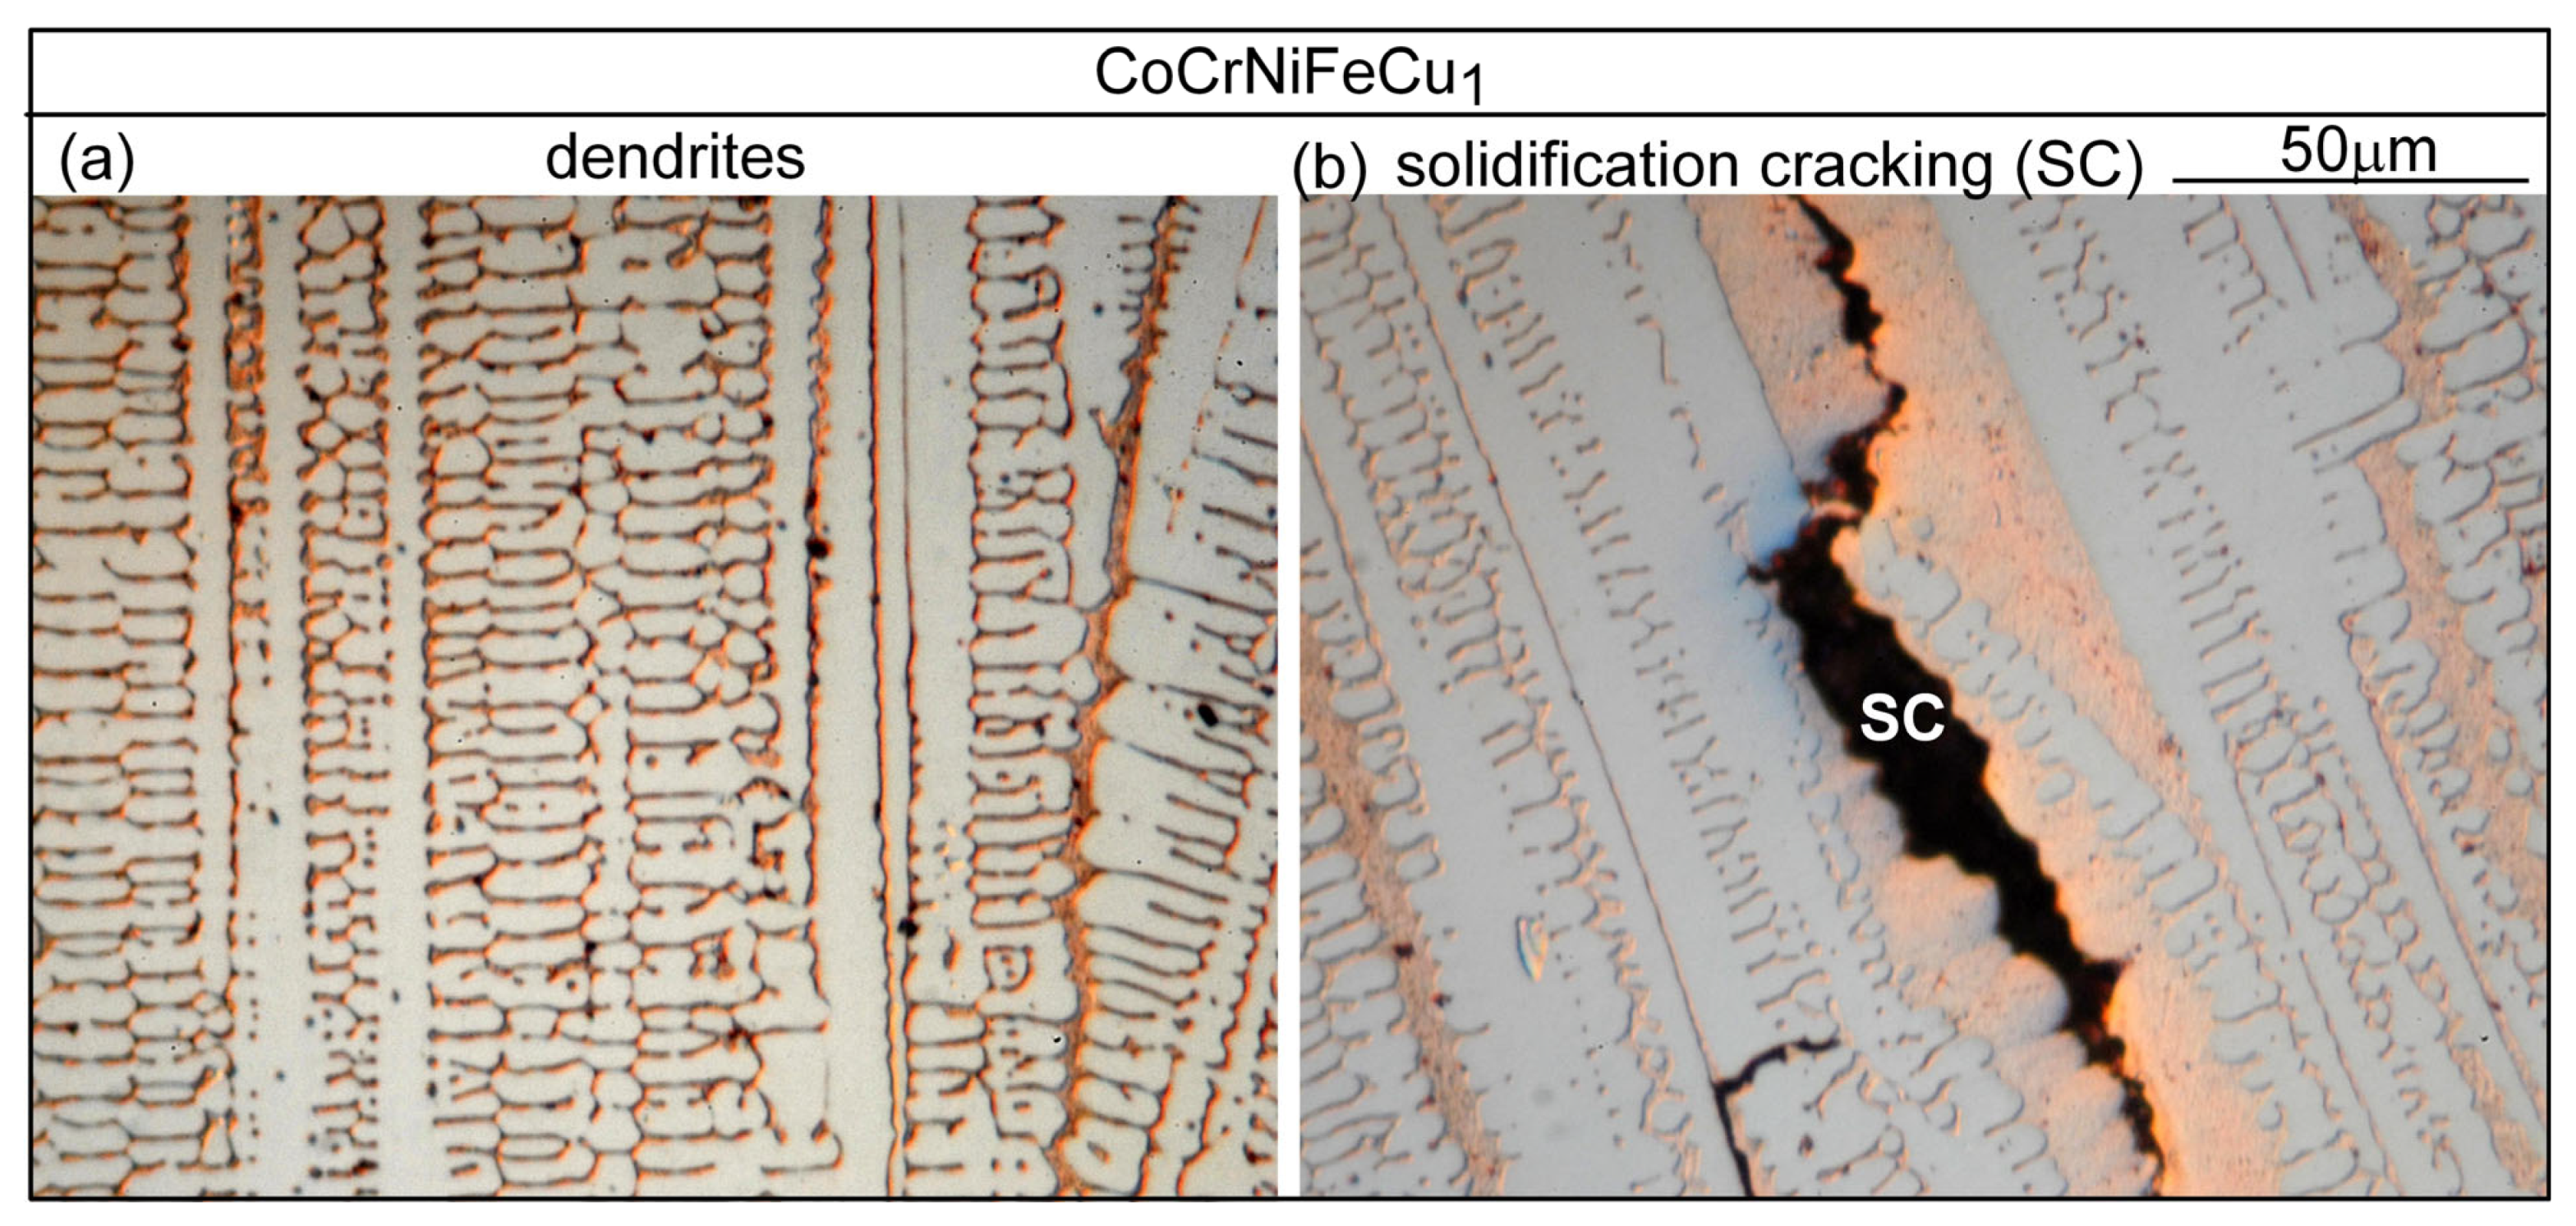
Figure 8 shows the microstructure in the fusion zone of alloy CoCrFeNiCu1. As compared to Figure 7 for alloy CoCrFeNiCu0.5, the primary dendrite arms are thinner and the secondary dendrite arms are longer. These more well-developed dendrites suggest increasing constitutional supercooling caused by the higher Cu content in alloy CoCrFeNiCu1. Again, cracking is intergranular, and the interdendritic liquid is Cu-rich. The amount of the intergranular liquid is greater in this alloy than that in alloy CoCrFeNiCu0.5, consistent with the solidification paths shown in Figure 4b,c. More abundant intergranular liquid and finer dendrites (than those in Figure 7b) are likely to help accommodate transverse tensile strain before cracking occurs.
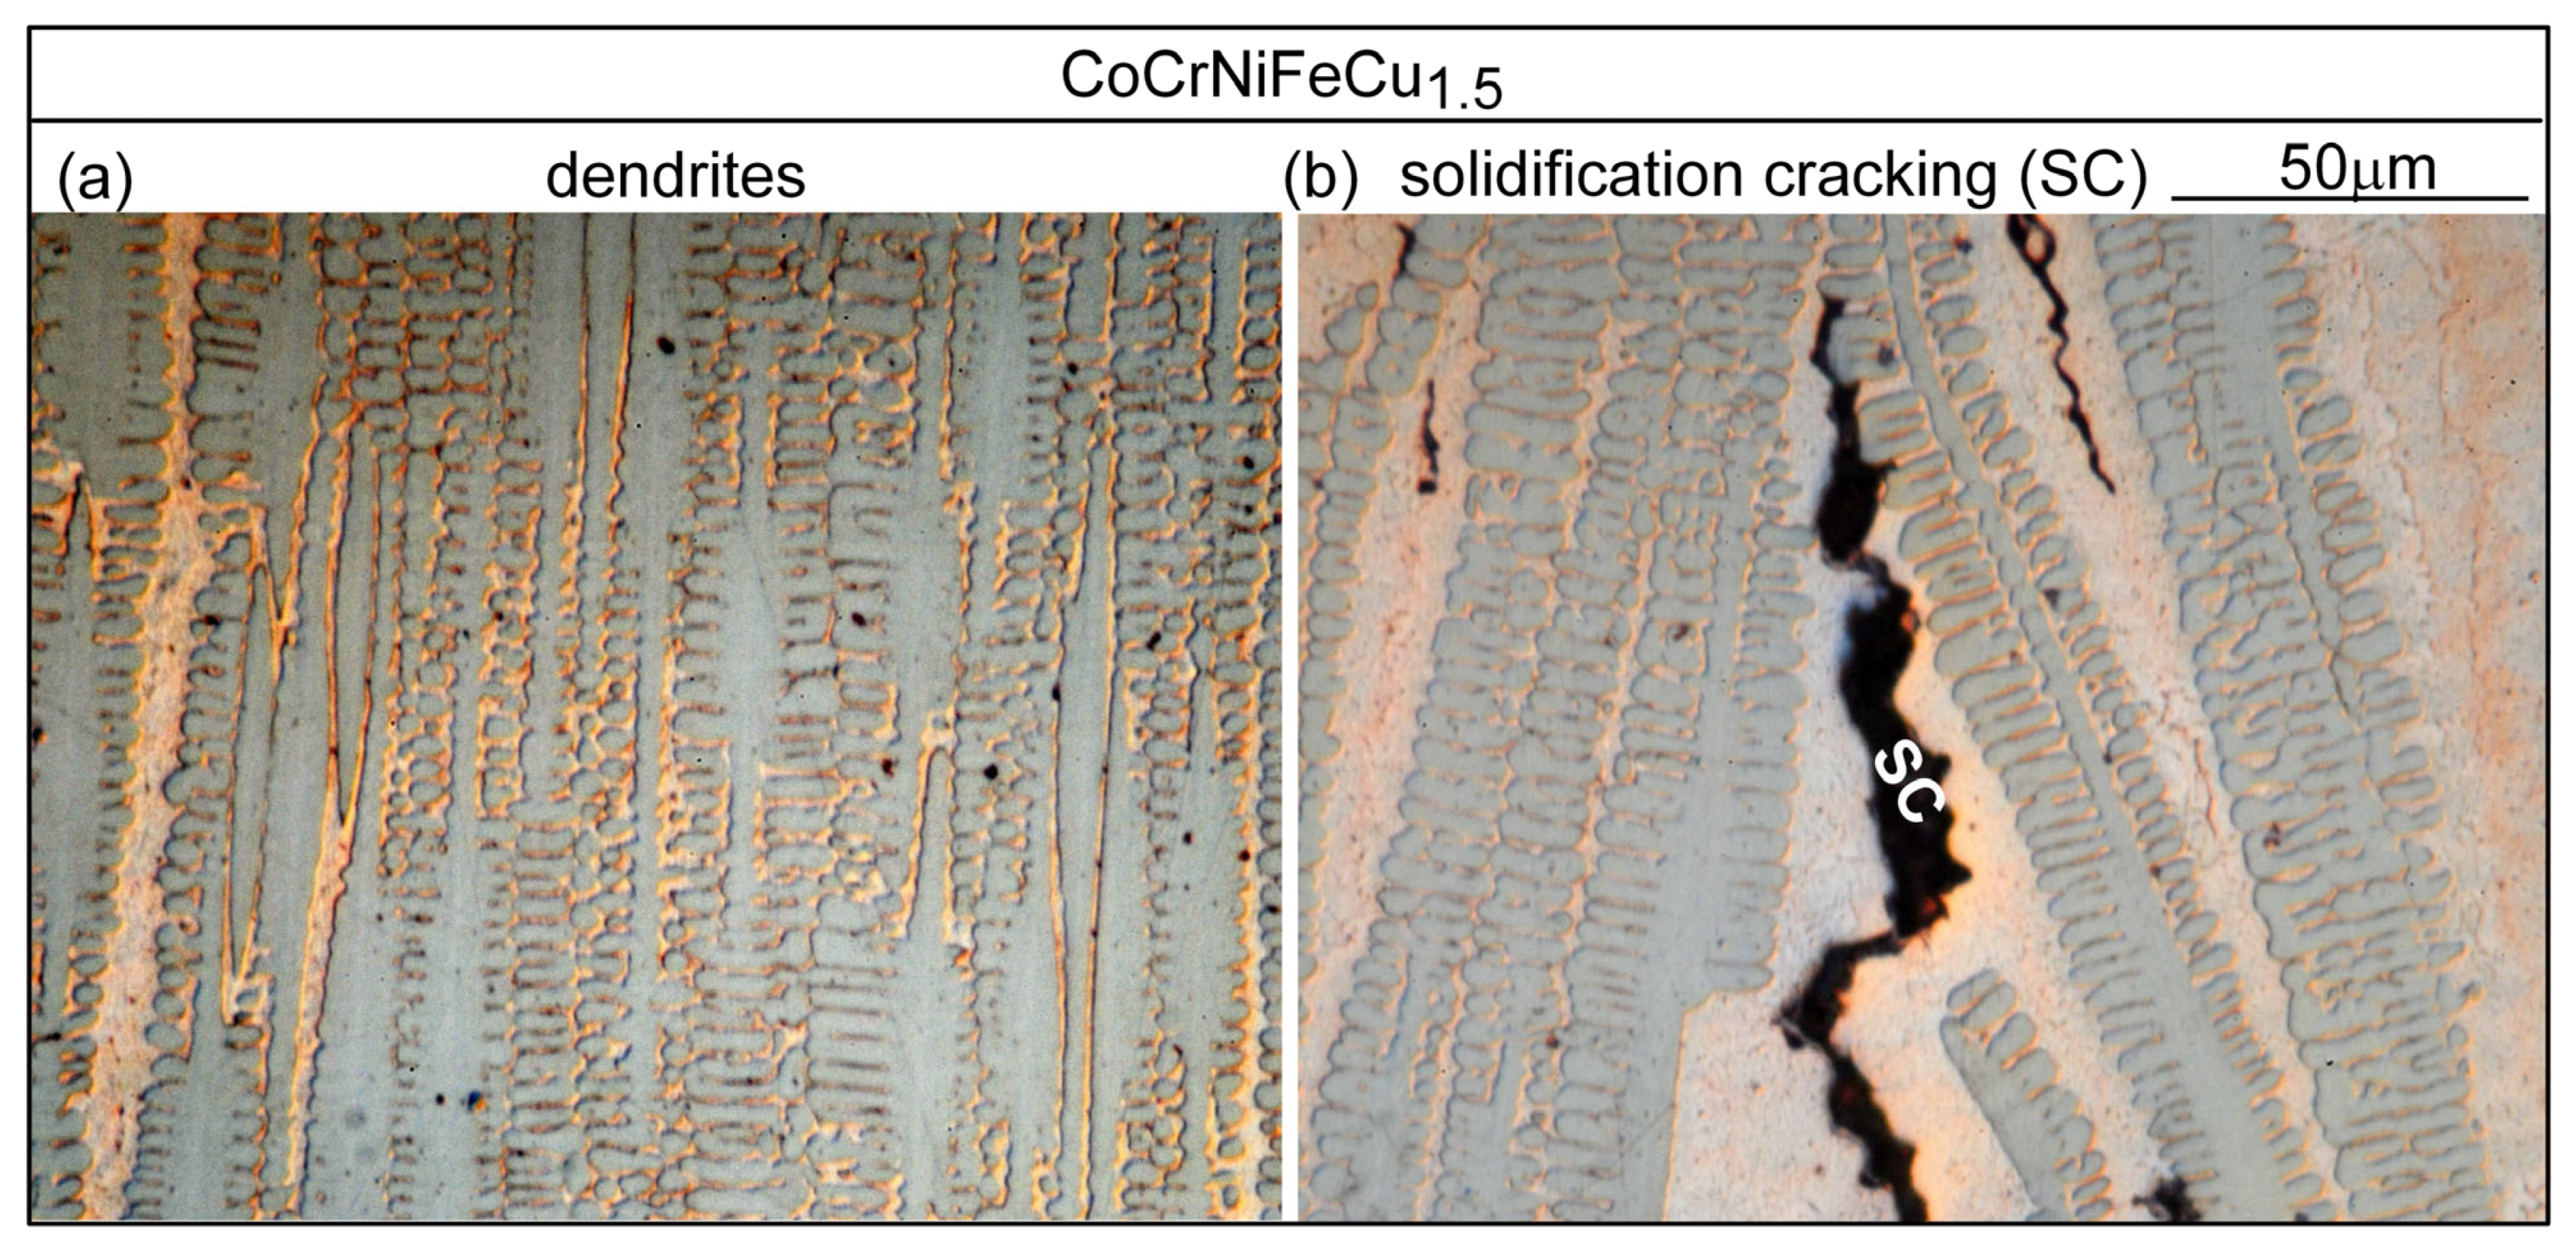
Figure 9 shows the microstructure in the fusion zone of alloy CoCrFeNiCu1.5. As compared to Figure 8 for alloy CoCrFeNiCu1, the dendrites are finer, and the intergranular liquid is wider. Cracking is intergranular and the amount of the Cu-rich intergranular liquid near cracks is greater.
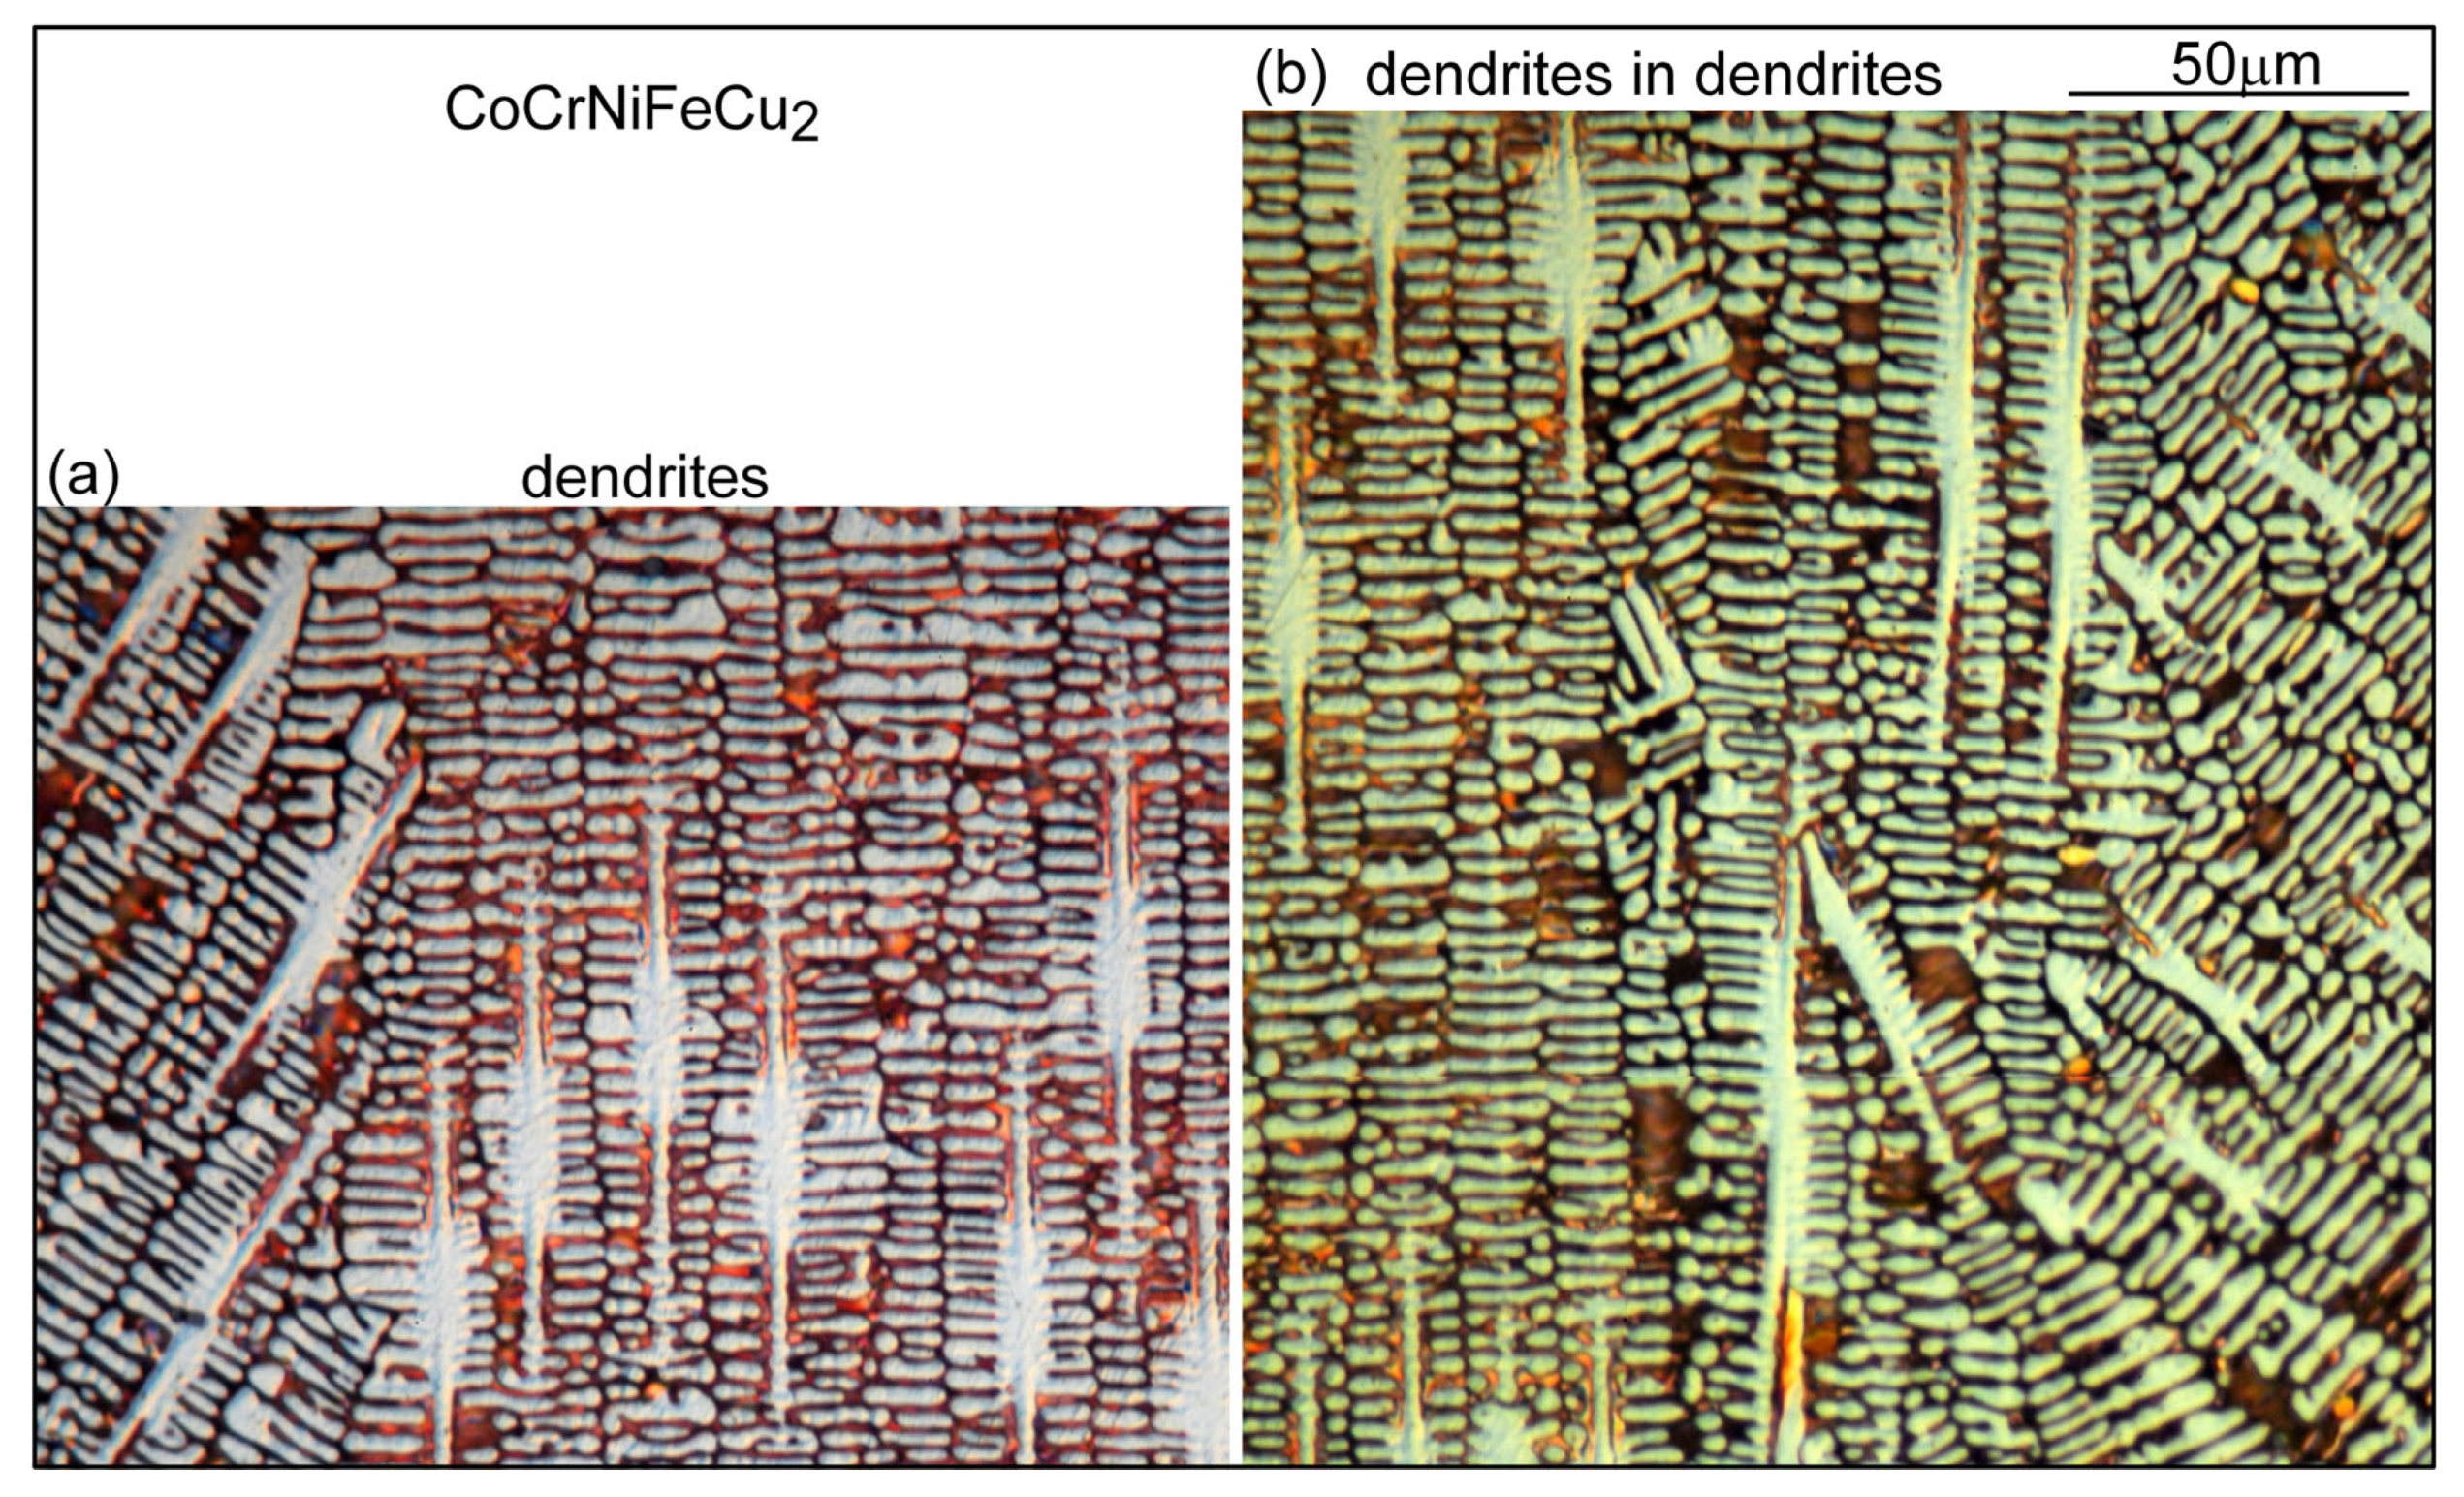
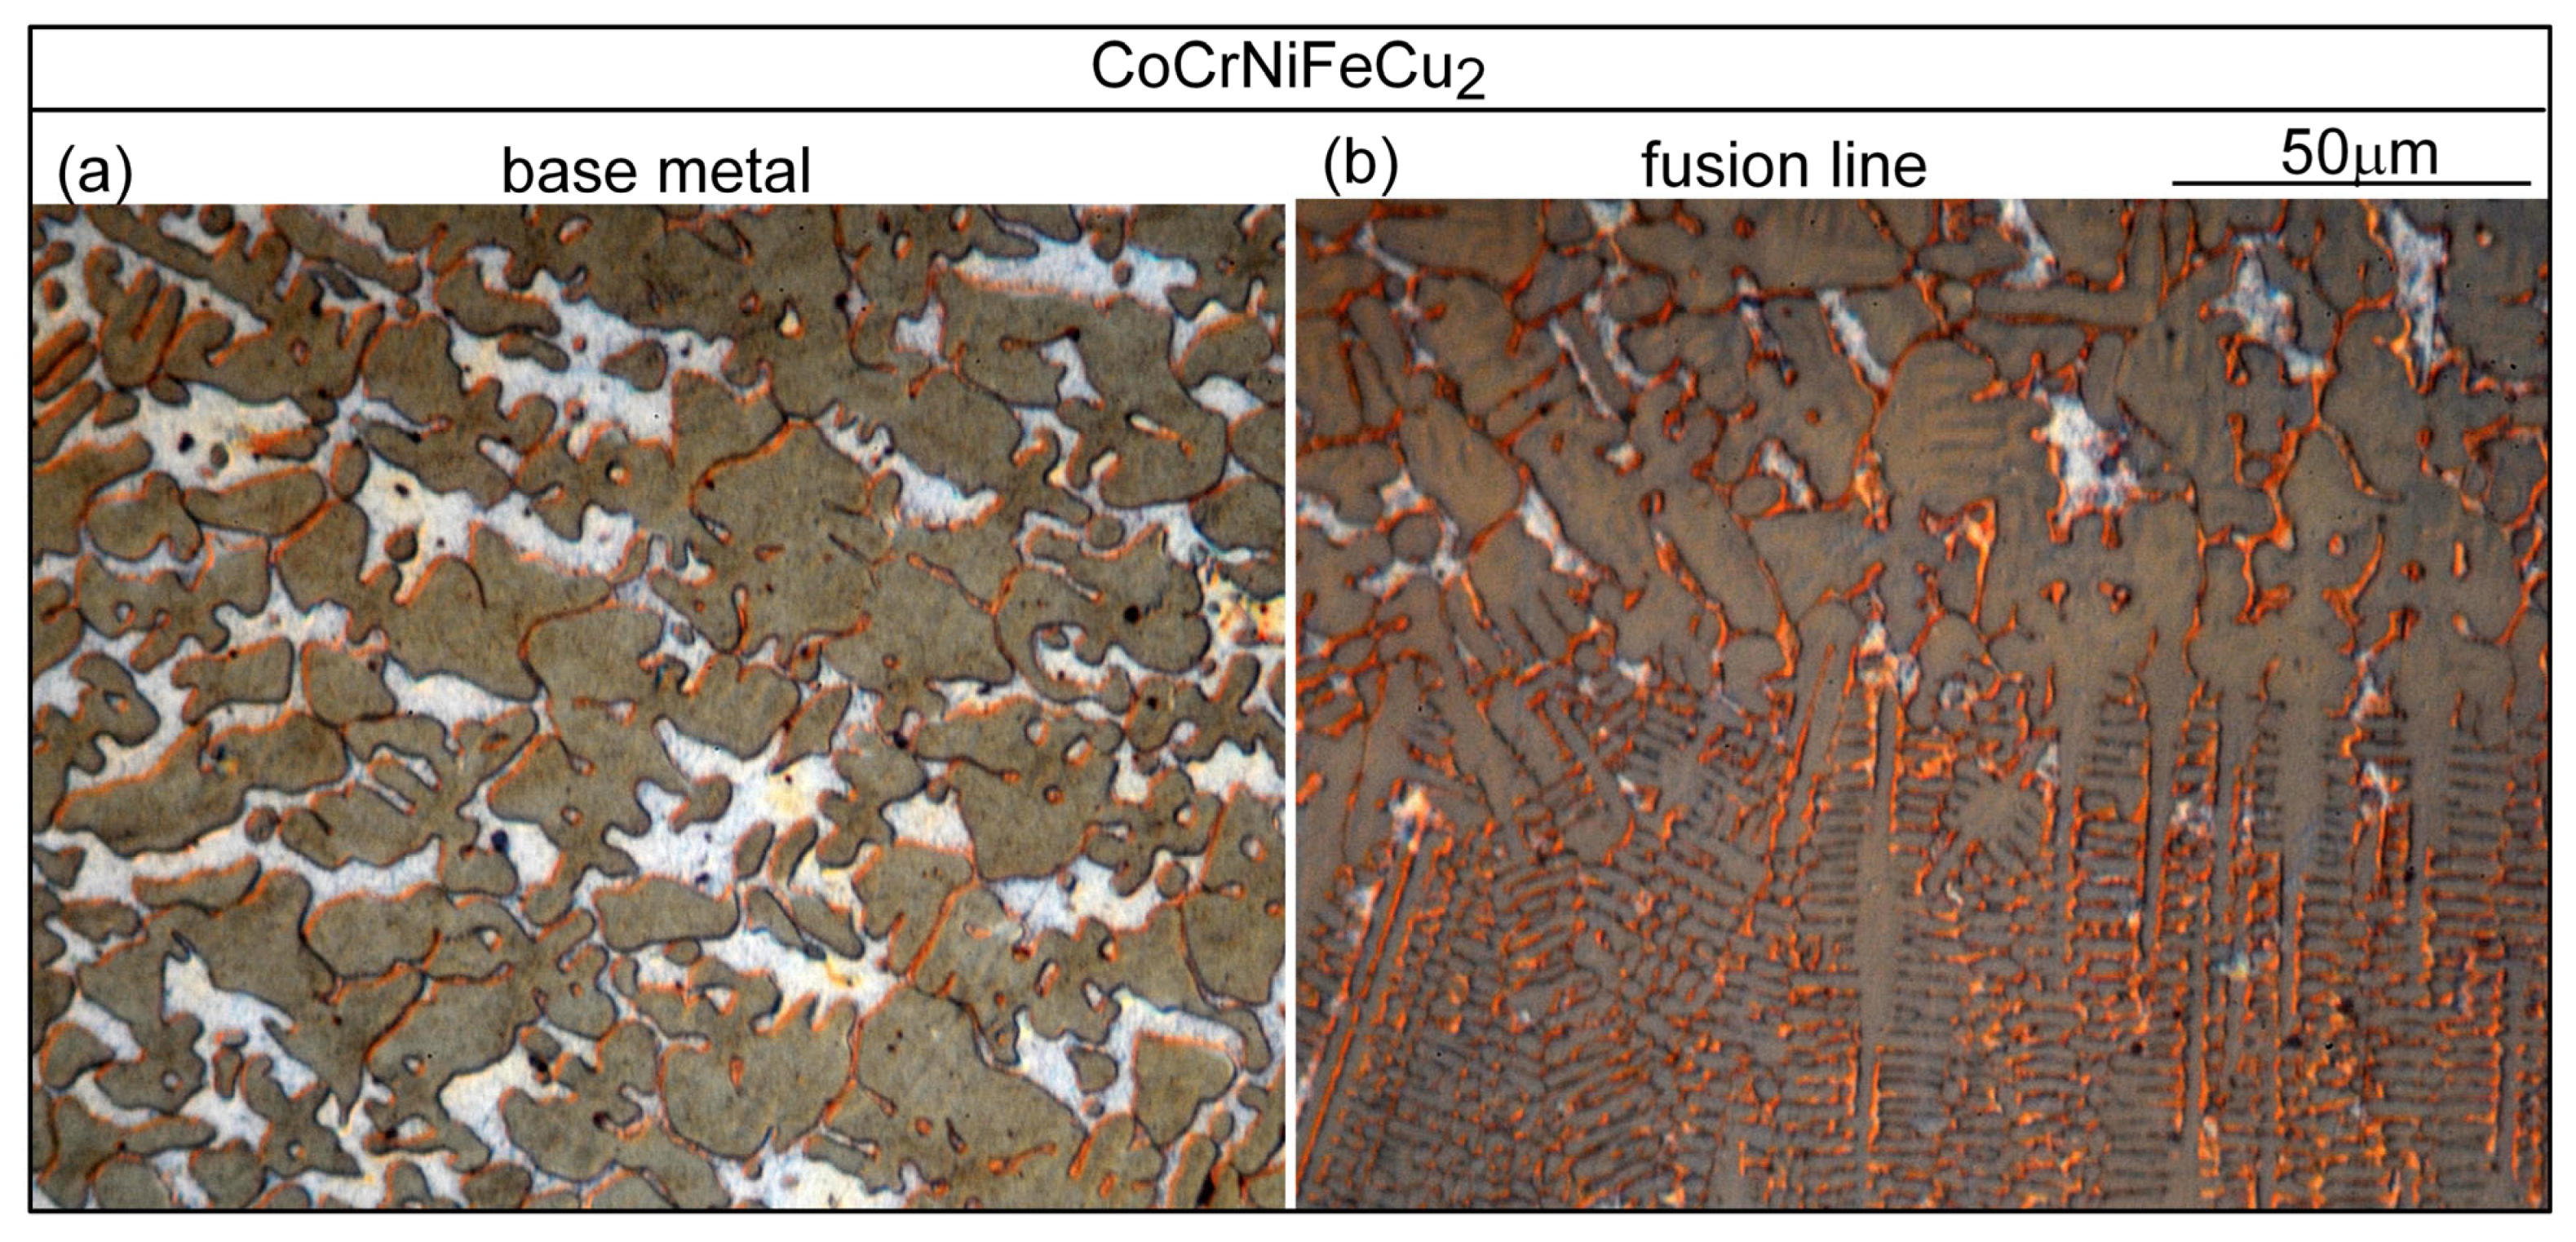
The microstructure in the fusion zone of alloy CoCrFeNiCu2 is shown in Figure 10. Unlike alloy CoCrFeNiCu1.5, shown in Figure 9, the dendrites are finer and there is no cracking. It is interesting to note that some dendrites in one grain penetrate into the neighboring grain, as can be seen in Figure 10a and more clearly in Figure 10b.
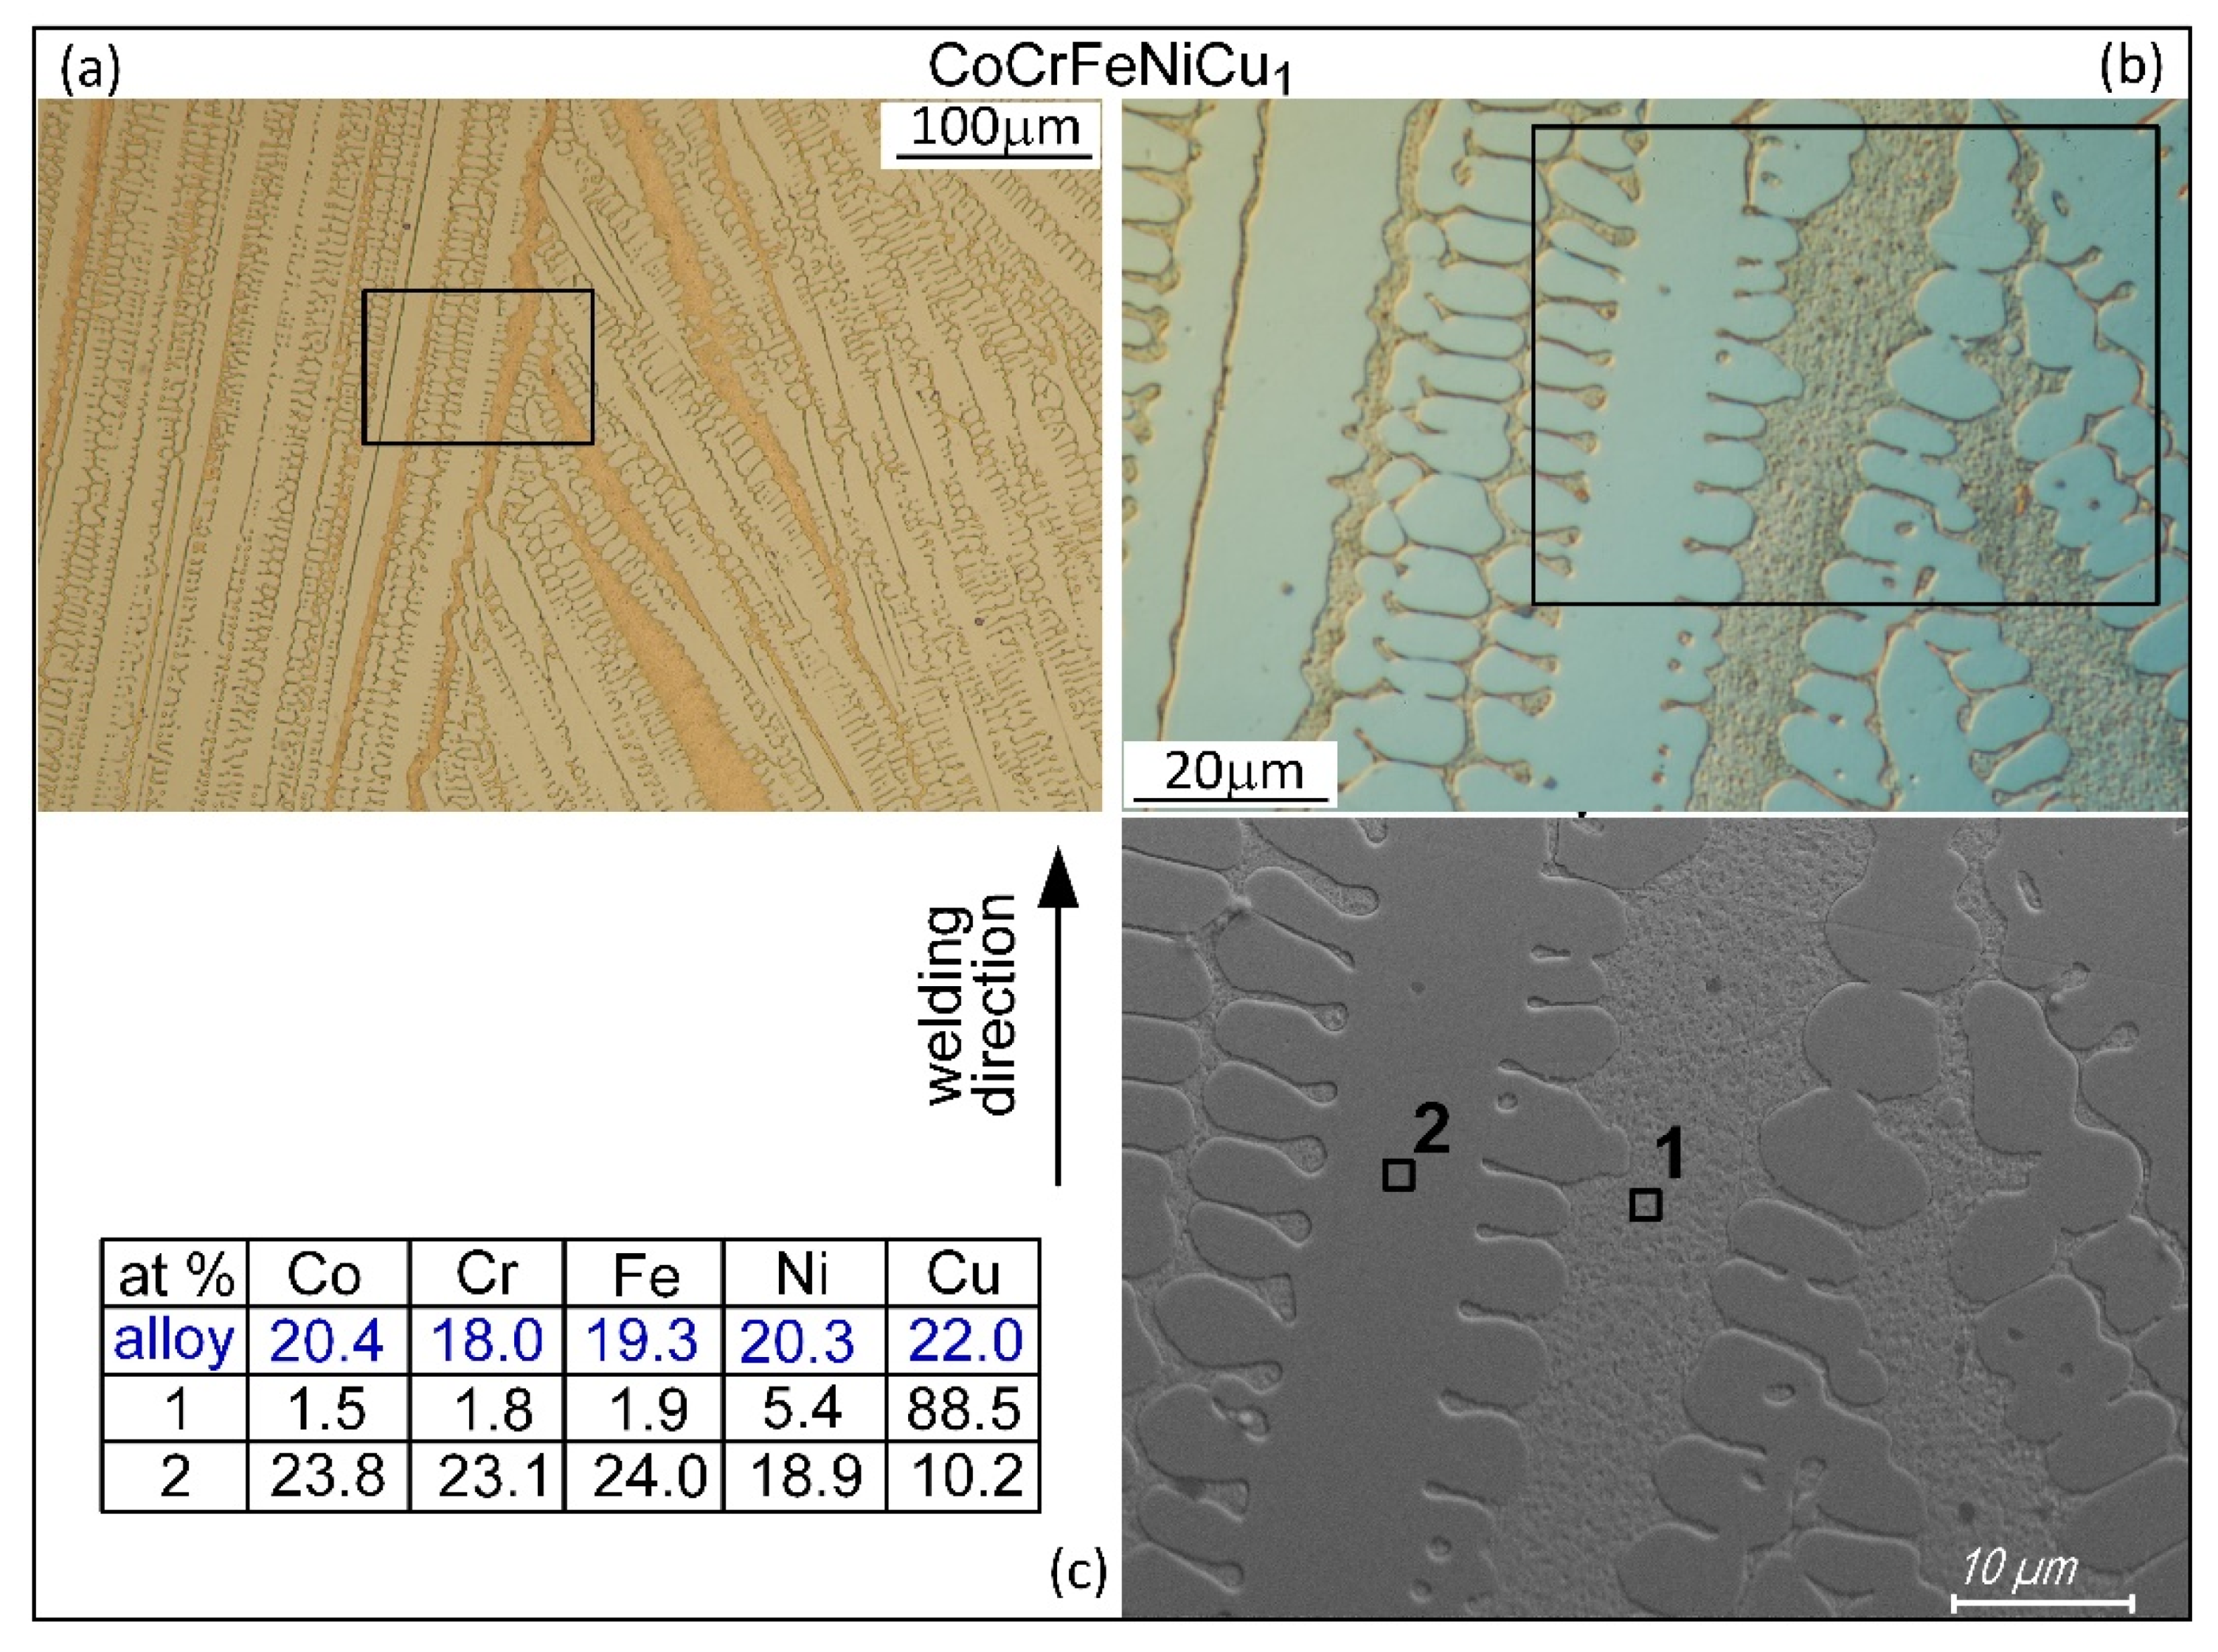
Figure 11 shows the microstructure in the fusion zone of alloy CoCrFeNiCu1. The image taken by Scanning Electron Microscopy (SEM) shows the interdendritic liquid is Cu-rich (88.5 at% at Point 1) with much more Cu than the Cu-lean Fcc1 dendrites (10.2 at% at Point 2).

4.2. Liquation Cracking

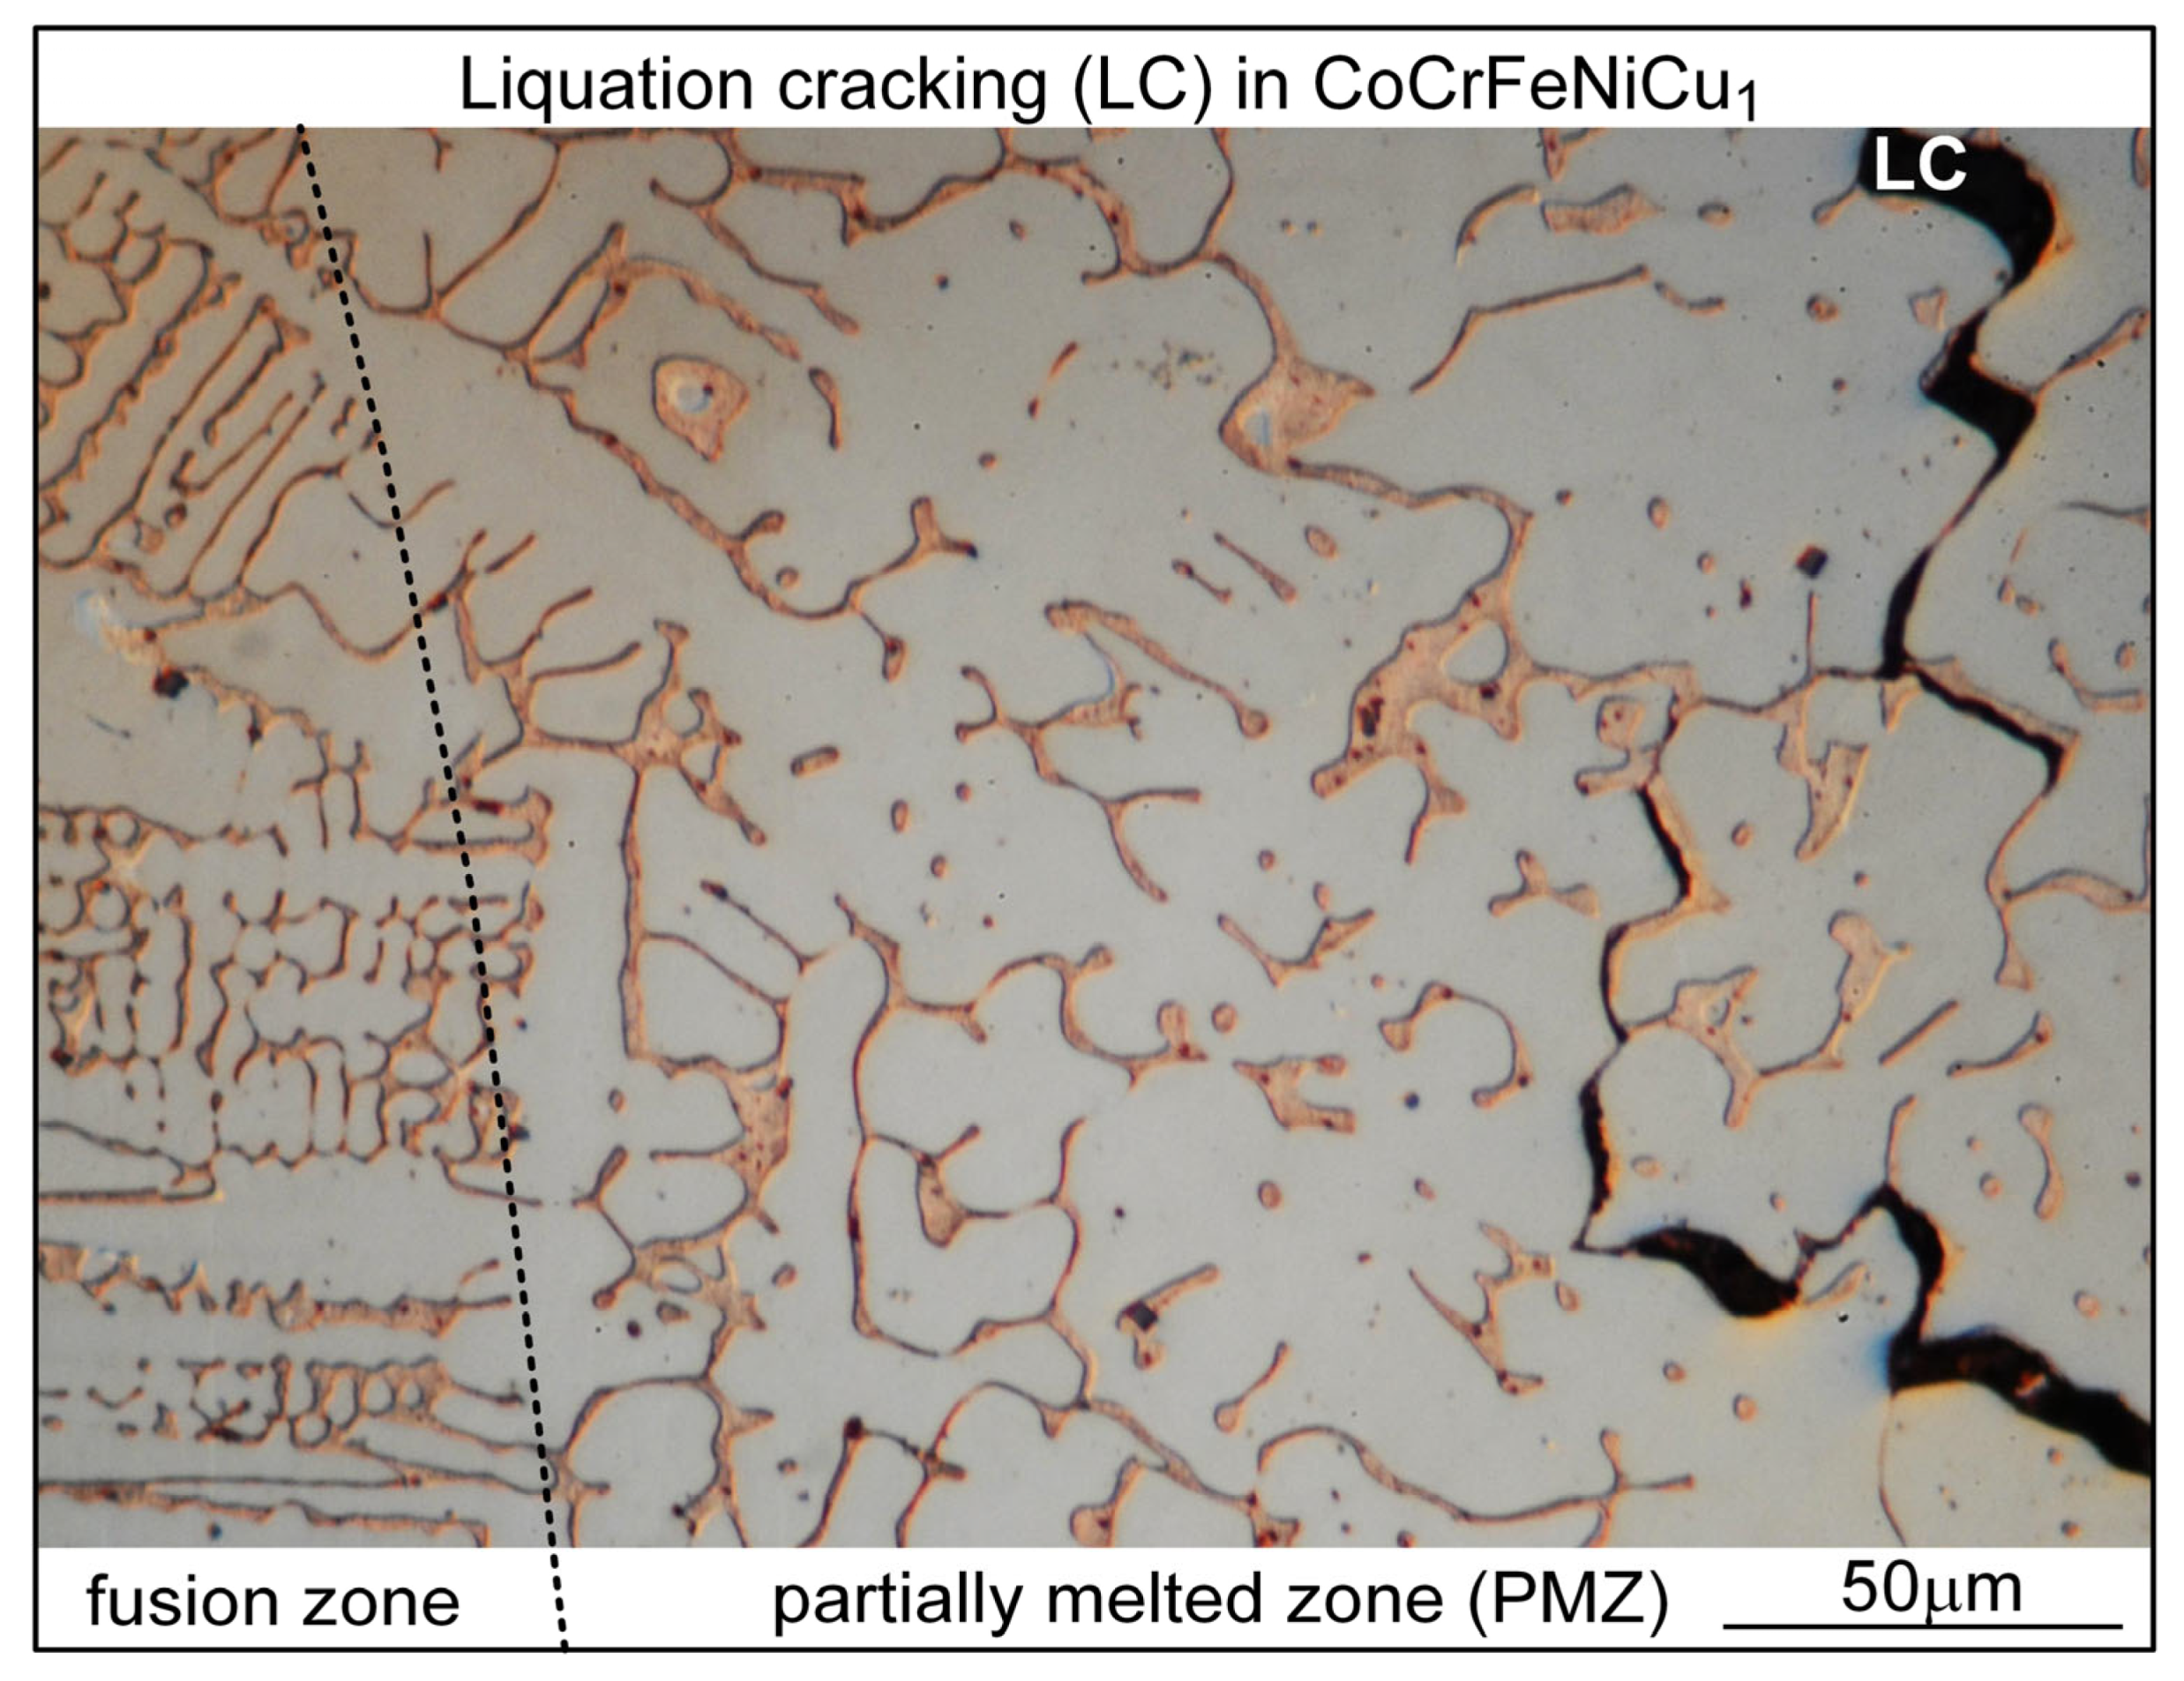
An alloy is partially melted when heated up into its melting temperature range, which is the same as the freezing temperature range if the alloy is in the as-cast condition before heating, e.g., the alloys in the present study. During welding of an as-cast alloy, the region immediately outside the fusion boundary that is heated into the freezing temperature range is called the partially melted zone (PMZ) because liquid formation (call liquation) can occur along grain boundaries (and within grains) [26]. Under the tension induced during welding, e.g., by the solidifying and hence contracting mushy zone near the PMZ, cracking can occur along liquated grain boundaries, that is, liquation cracking. Figure 12 shows liquation cracking in the PMZ of alloy CoCrFeNiCu1. As shown, liquation cracking is intergranular cracking in the PMZ near the fusion boundary (i.e., the weld edge).
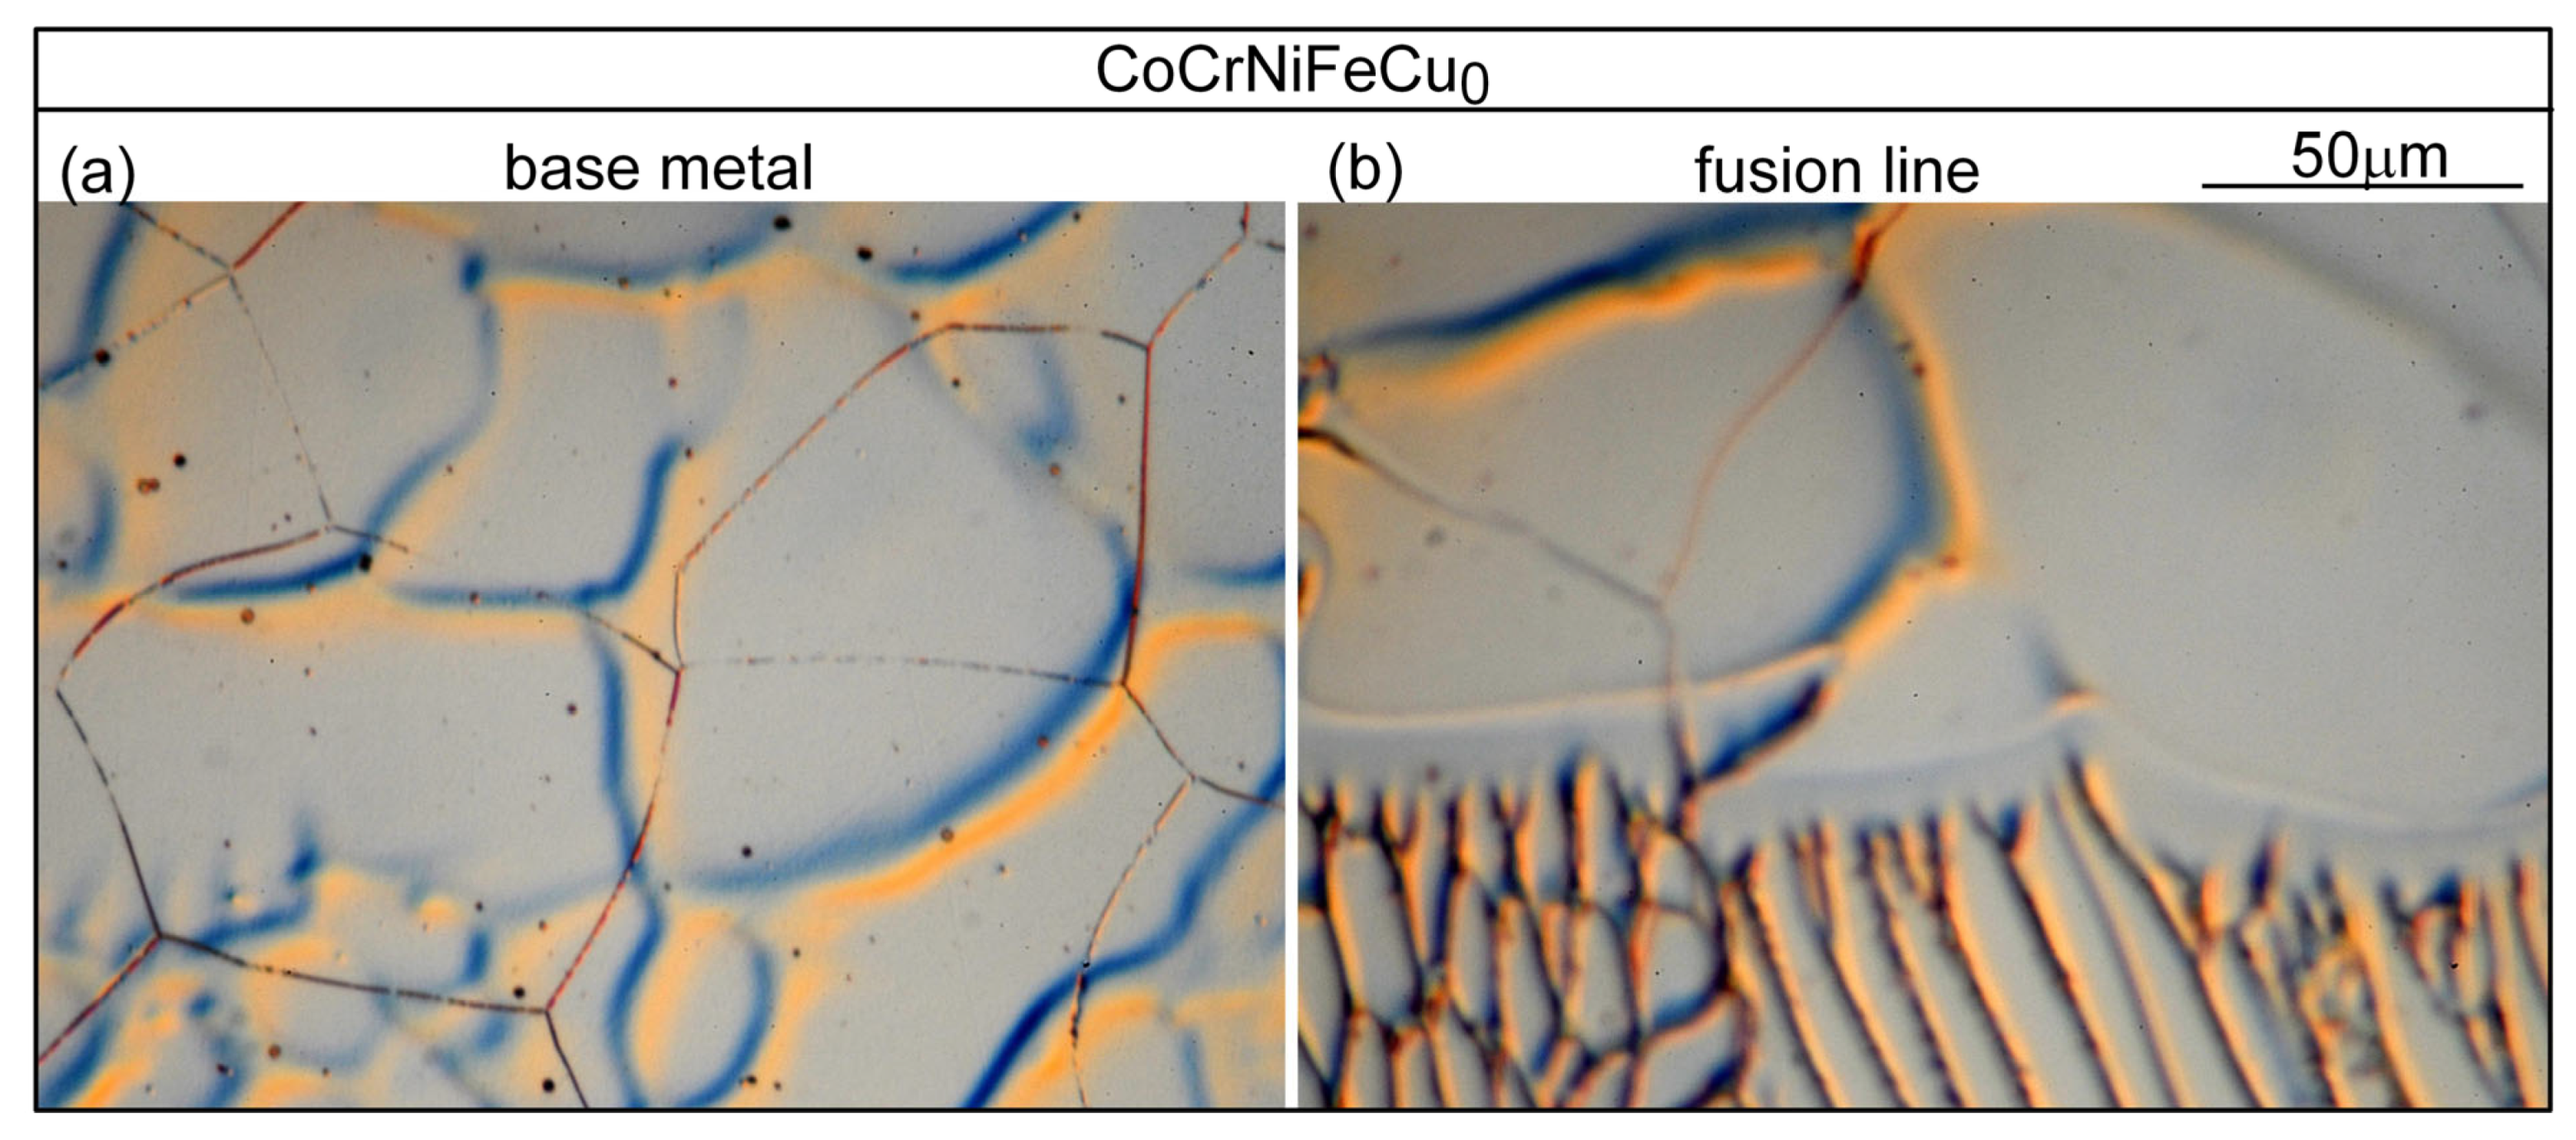
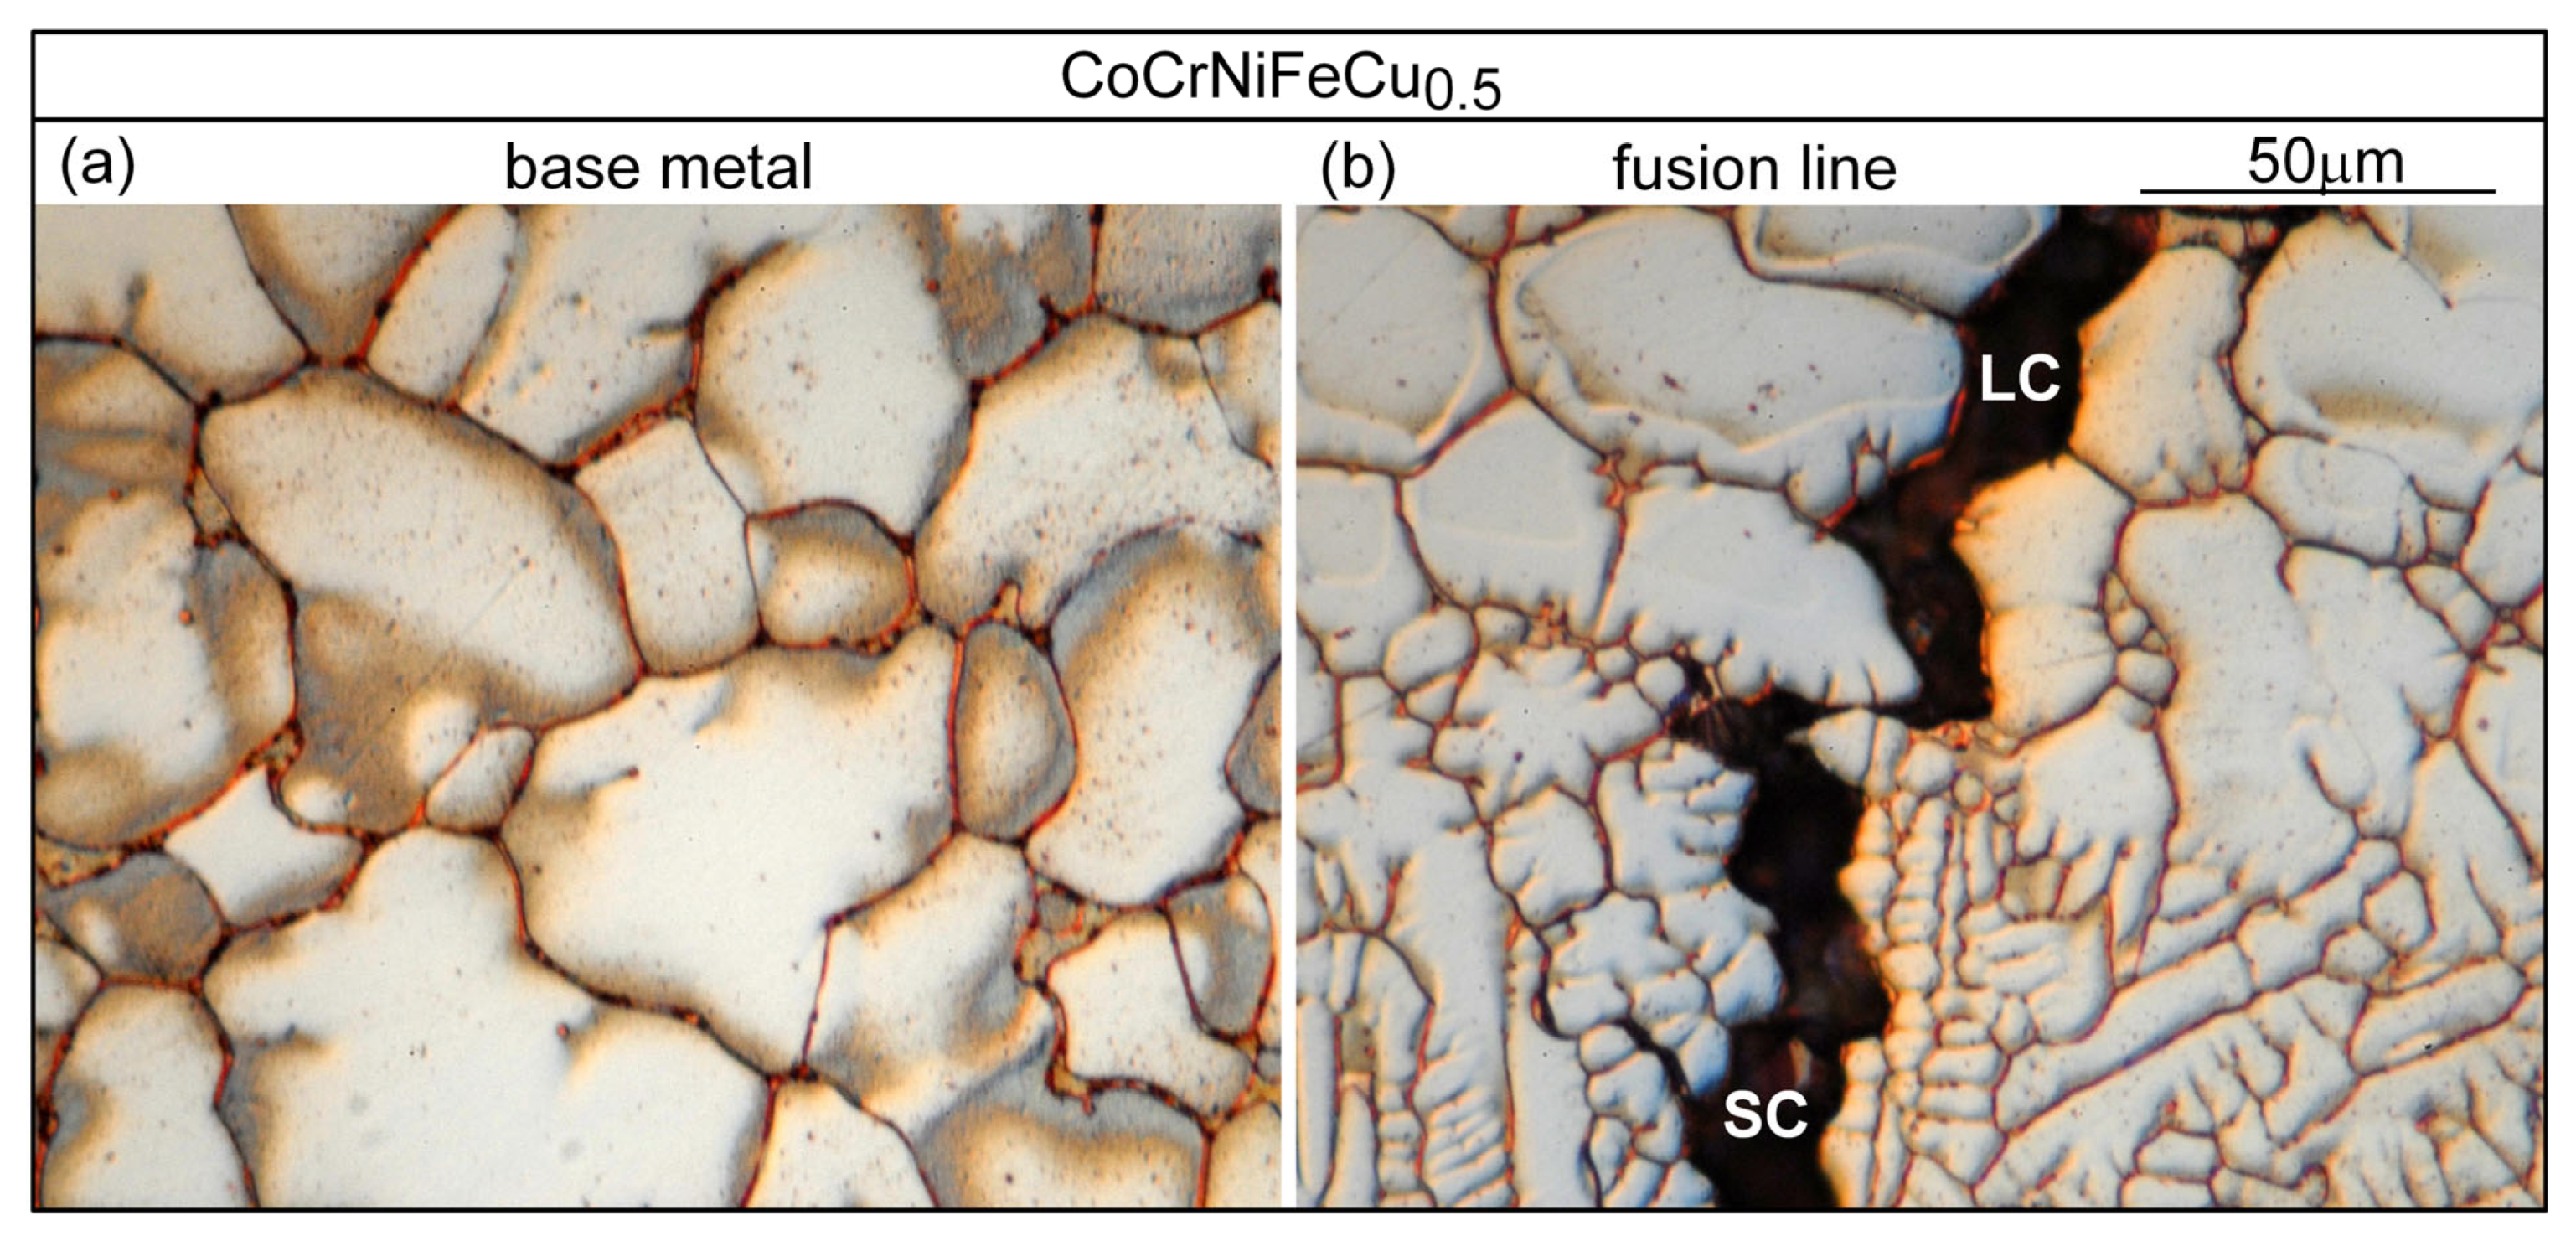
Figure 13a shows the microstructure in alloy CoCrFeNiCu0 outside the PMZ, i.e., in the base metal. The thin dark lines are the migrated grain boundaries. The microstructure near the fusion boundary is shown in Figure 13b. The fusion boundary is essentially horizontal. As can be seen, the liquid in the weld pool solidifies first in the planar mode but soon changes to the cellular mode [26]. No liquation cracking is visible, consistent with the absence of cracking in the PMZ near the fusion boundary in Figure 3a. Figure 14a shows the microstructure in alloy CoCrFeNiCu0.5 outside the PMZ. Figure 14b shows a liquation crack in the PMZ that propagates into the fusion zone as solidification cracking. In Figure 3b, liquation cracks are visible near the fusion boundary and they propagate into the fusion zone as solidification cracks.
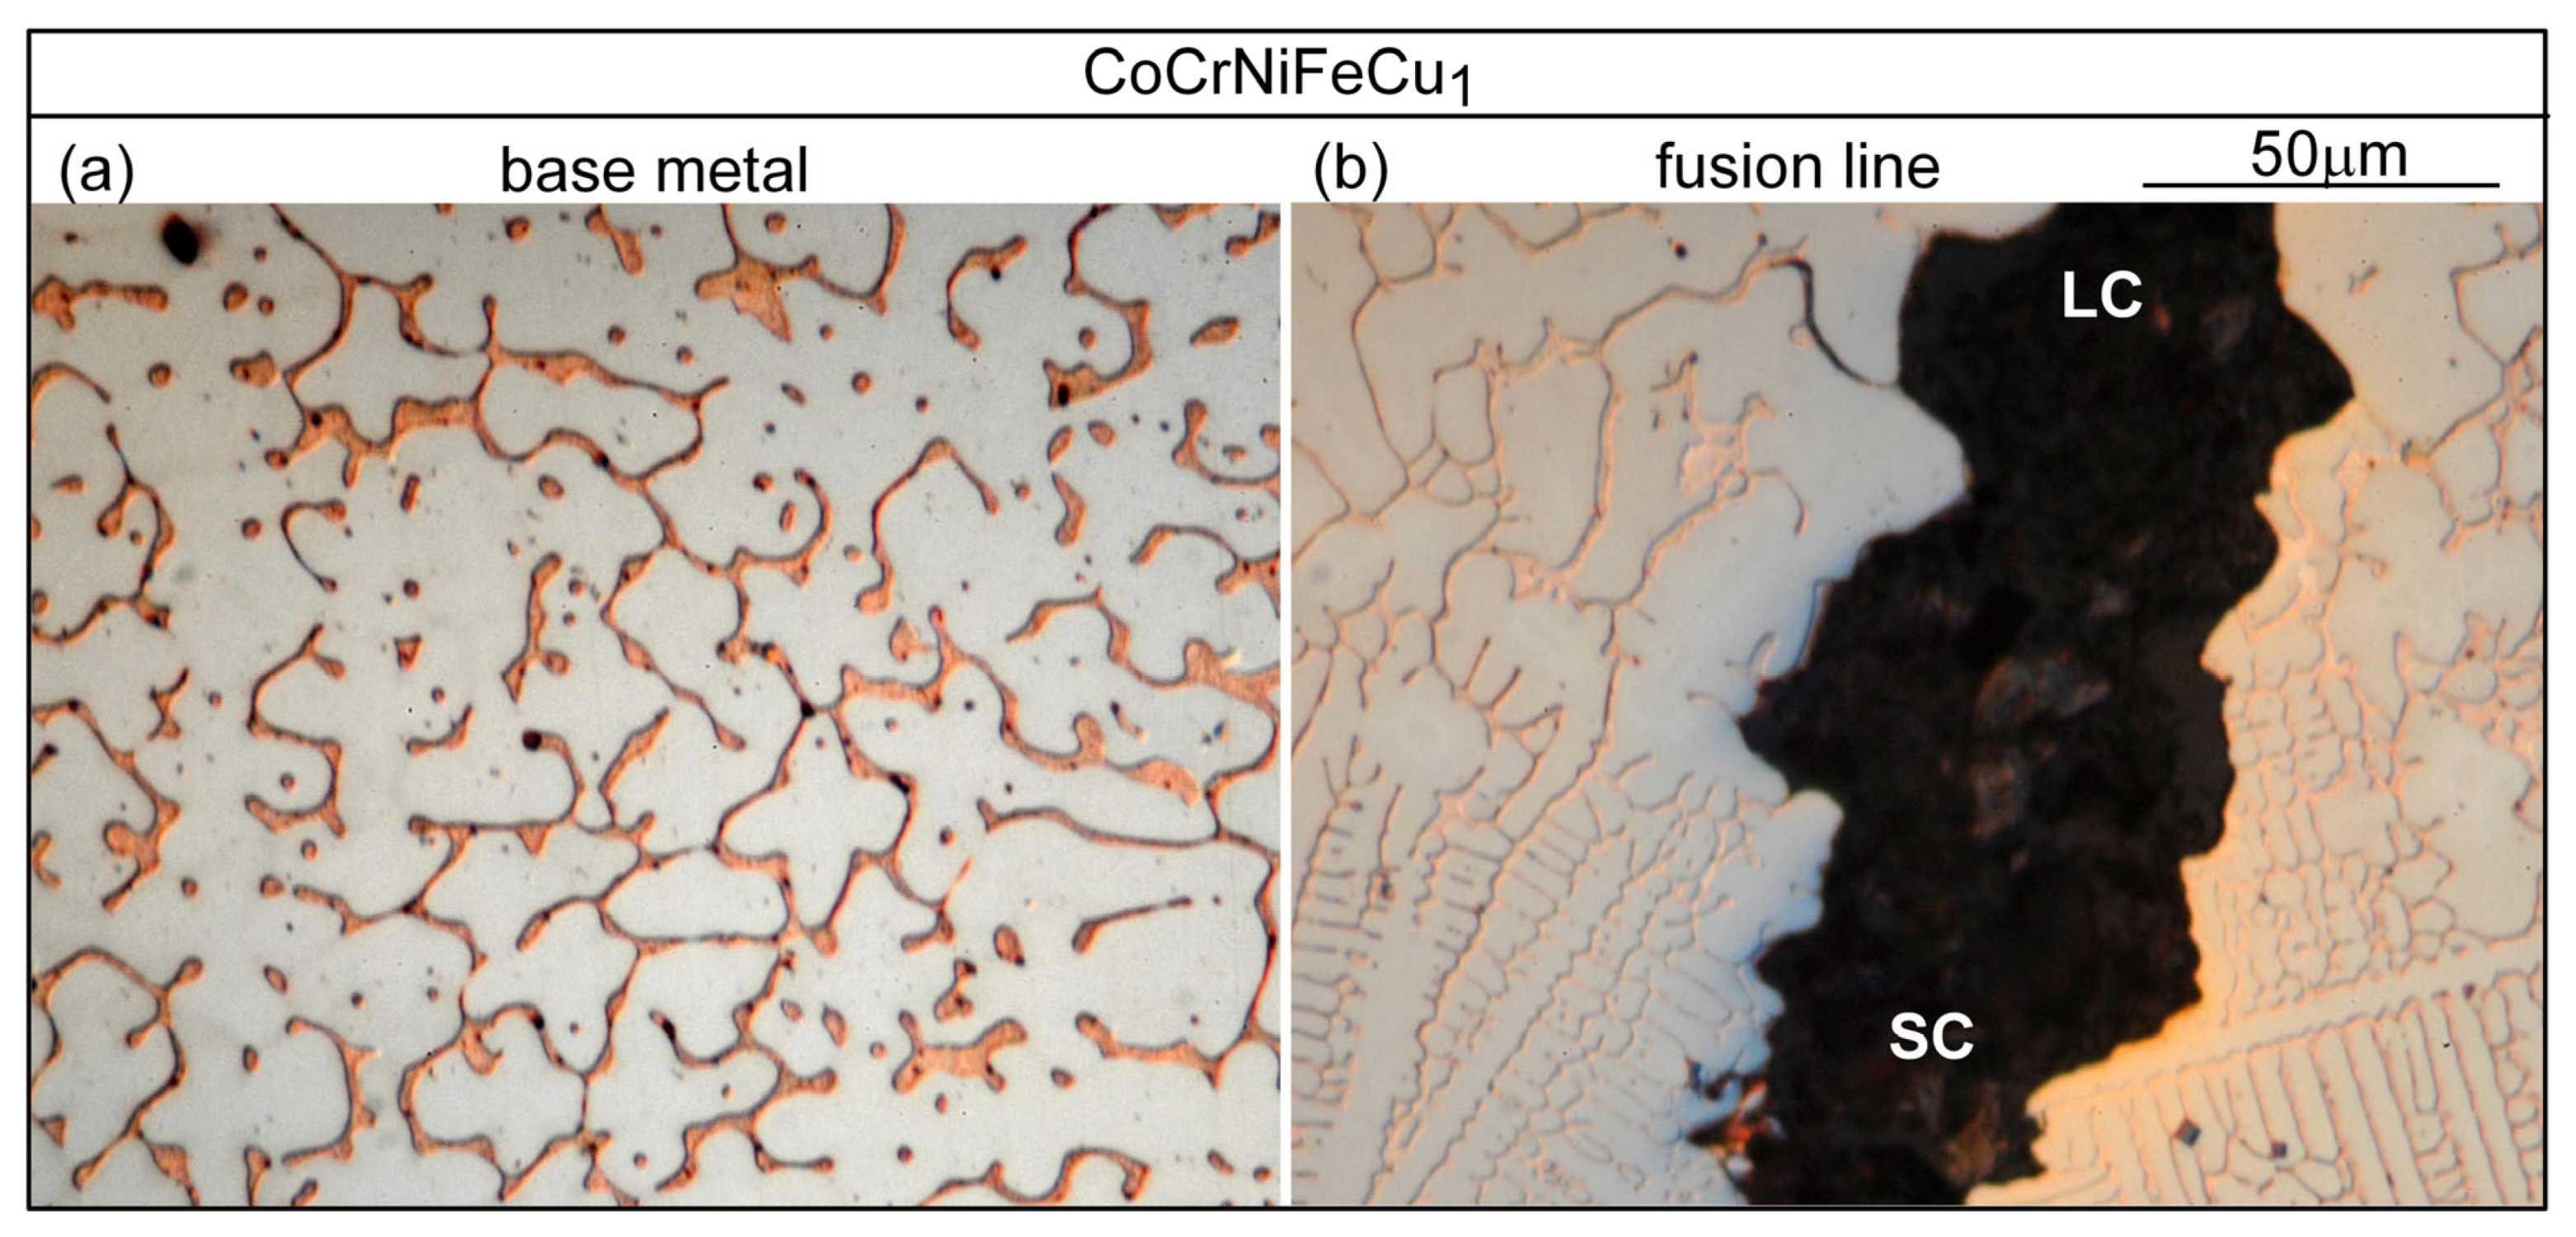
Similar results can be seen in Figure 15 for alloy CoCrFeNiCu1 and in Figure 16 for alloy CoCrFeNiCu1.5.
Figure 17a shows the microstructure in alloy CoCrFeNiCu2 outside the PMZ. Figure 17b shows no liquation cracking in the PMZ. This is consistent with the absence of liquation cracking near the fusion zone in Figure 3e, where liquation cracks are visible in the PMZ only near the crater.

5. Conclusions

(1)
Based on cracks observed in both the fusion zone and the crater, the ranking of the susceptibility to solidification cracking in arc welding appears to be CoCrFeNiCu0.5 > CoCrFeNiCu1 > CoCrFeNiCu1.5 > CoCrFeNiCu2 > CoCrFeNiCu0. It can be said, at least, that alloys CoCrFeNiCu0.5, CoCrFeNiCu1 and CoCrFeNiCu1.5 are most susceptible to solidification cracking, followed by CoCrFeNiCu2, with CoCrFeNiCu0 being the least susceptible. The same ranking can be shown based on the maximum |dT/d(fS)1/2| up to (fS)1/2 = 0.99 as the index for the susceptibility to solidification cracking.
(2)
Solidification cracks in the fusion zone often show Cu-rich intergranular liquid near cracks; the higher the Cu content of the alloy, the greater the amount of the liquid.
(3)
Liquation cracking can occur in the PMZ near the fusion boundary and propagate into the fusion zone as solidification cracking. Similar to solidification cracking, the ranking of the susceptibility to liquation cracking appears to be CoCrFeNiCu0.5 > CoCrFeNiCu1 > CoCrFeNiCu1.5 > CoCrFeNiCu2 > CoCrFeNiCu0.

Author Contributions

Writing—original draft, P.Y.; Writing—review & editing, S.K. and C.-M.L. All authors have read and agreed to the published version of the manuscript.

Funding

This work was supported by the National Science Foundation of the United States under Grant No. DMR 1904503 for Sindo Kou.

Institutional Review Board Statement

Not Applicable.

Informed Consent Statement

Not Applicable.

Data Availability Statement

Not Applicable.

Conflicts of Interest

The authors declare no conflict of interest.

References

  1. Yeh, J.W.; Chen, S.K.; Lin, S.J.; Gan, J.Y.; Chin, T.S.; Shun, T.T.; Tsau, C.H.; Chang, S.Y. Nanostructured high-entropy alloys with multiple principal elements: Novel alloy design concepts and outcomes. Adv. Eng. Mater. 2004, 6, 299–303. [Google Scholar] [CrossRef]
  2. Cantor, B.; Chang, I.T.H.; Knight, P.; Vincent, A.J.B. Microstructural development in equiatomic multicomponent alloys. Mater. Sci. Eng. A 2004, 375, 213–218. [Google Scholar] [CrossRef]
  3. Zhang, B.; Zhang, Y.; Guo, S.M. A thermodynamic study of corrosion behaviors for CoCrFeNi-based high-entropy alloys. J. Mater. Sci. 2018, 53, 14729–14738. [Google Scholar] [CrossRef]
  4. Park, N.; Watanabe, I.; Terada, D.; Yokoyama, Y.; Liaw, P.K.; Tsuji, N. Recrystallization behavior of CoCrCuFeNi high-entropy alloy. Metall. Mater. Trans. A 2015, 46, 1481–1487. [Google Scholar] [CrossRef] [Green Version]
  5. Wu, B.; Xie, Z.; Huang, J.; Lin, J.; Yang, Y.; Jiang, L.; Huang, J.; Ye, G.; Zhao, C.; Yang, S.; et al. Microstructures and thermodynamic properties of high-entropy alloys CoCrCuFeNi. Intermetallics 2018, 93, 40–46. [Google Scholar] [CrossRef]
  6. Zhang, L.J.; Fan, J.T.; Liu, D.J.; Zhang, M.D.; Yu, P.F.; Jing, Q.; Ma, M.Z.; Liaw, P.K.; Li, G.; Liu, R.P. The microstructural evolution and hardness of the equiatomic CoCrCuFeNi high-entropy alloy in the semi-solid state. J. Alloys Compd. 2018, 745, 75–83. [Google Scholar] [CrossRef]
  7. Rogal, Ł. Semi-solid processing of the CoCrCuFeNi high entropy alloy. Mater. Des. 2017, 119, 406–416. [Google Scholar] [CrossRef]
  8. Cui, H.B.; Zheng, L.F.; Wang, J.Y. Microstructure evolution and corrosion behavior of directionally solidified FeCoNiCrCu high entropy alloy. In Applied Mechanics and Materials; Trans Tech Publications Ltd.: Wollerau, Switzerland, 2011; Volume 66, pp. 146–149. [Google Scholar]
  9. Wang, G.; Yang, Y.; He, R.; Tan, C.; Huttula, M.; Cao, W. A novel high entropy CoFeCrNiCu alloy filler to braze SiC ceramics. J. Eur. Ceram. Soc. 2020, 40, 3391–3398. [Google Scholar] [CrossRef]
  10. Wu, Z.; David, S.A.; Leonard, D.N.; Feng, Z.; Bei, H. Microstructures and mechanical properties of a welded CoCrFeMnNi high-entropy alloy. Sci. Technol. Weld. Join. 2018, 23, 585–595. [Google Scholar] [CrossRef]
  11. Wang, W.L.; Hu, L.; Luo, S.B.; Meng, L.J.; Geng, D.L.; Wei, B. Liquid phase separation and rapid dendritic growth of high-entropy CoCrCuFeNi alloy. Intermetallics 2016, 77, 41–45. [Google Scholar] [CrossRef]
  12. Fan, Y.; Li, P.; Chen, K.; Fu, L.; Shan, A.; Chen, Z. Effect of fiber laser welding on solute segregation and proprieties of CoCrCuFeNi high entropy alloy. J. Laser Appl. 2020, 32, 022005. [Google Scholar] [CrossRef]
  13. Li, J.; Zhao, H.; Zhou, N.; Zhang, Y.; Qin, Q.; Wang, D.; Jiao, J.; Tang, G.; Li, Y. Study on Microstructure of Fiber Laser Welding of CoCrCuFeNi High Entropy Alloy. Materials 2022, 15, 8777. [Google Scholar] [CrossRef] [PubMed]
  14. Lin, C.M.; Tsai, H.L. Equilibrium phase of high-entropy FeCoNiCrCu0.5 alloy at elevated temperature. J. Alloys Compd. 2010, 489, 30–35. [Google Scholar] [CrossRef]
  15. Kou, S. A criterion for cracking during solidification. Acta Mater. 2015, 88, 366–374. [Google Scholar] [CrossRef]
  16. Pandat2019, Phase Diagram Calculation Software Package for Multicomponent Systems; CompuTherm LLC: Madison, WI, USA, 2019.
  17. PanHEA2019, Thermodynamic Database for High Entropy Alloys; CompuTherm LLC: Madison, WI, USA, 2019.
  18. Dowd, J.D. Weld cracking of aluminum alloys. Weld. J. 1952, 31, 448s–456s. [Google Scholar]
  19. Dudas, J.H.; Collins, F.R. Preventing weld cracks in high-strength aluminum alloys. Weld. J. 1966, 45, 241s–249s. [Google Scholar]
  20. Kou, S. A Simple Index for Predicting the Susceptibility to Solidification Cracking. Weld. J. 2015, 94, 374s–388s. [Google Scholar]
  21. Shankar, V.; Devletian, J.H. Solidification cracking in low alloy steel welds. Sci. Technol. Weld. Join. 2005, 10, 236–243. [Google Scholar] [CrossRef]
  22. Fukuhisa, M.; Nakagawa, H.; Nakata, K.; Kohmoto, H.; Honda, Y. Quantitative Evaluation of Solidification Brittleness of Weld Metal During Solidification by Means of In Situ Observation and Measurement. Pt. 1. Development of the MISO Technique. Trans. JWRI 1983, 12, 65–72. [Google Scholar]
  23. Xia, C.; Kou, S. Calculating the susceptibility of carbon steels to solidification cracking during welding. Metall. Mater. Trans. B 2021, 52, 460–469. [Google Scholar] [CrossRef]
  24. Savage, W.F.; Lundin, C.D. The varestraint test. Weld. J. 1965, 44, 433s–442s. [Google Scholar]
  25. Soysal, T.; Kou, S. A simple test for assessing solidification cracking susceptibility and checking validity of susceptibility prediction. Acta Mater. 2018, 143, 181–197. [Google Scholar] [CrossRef]
  26. Kou, S. Welding Metallurgy, 3rd ed.; John Wiley and Sons: Hoboken, NJ, USA, 2021. [Google Scholar]
  27. Matsuda, F.; Nakata, K.; Arai, K.; Tsukamoto, K. Comparison of weld crack susceptibility of recent aluminum alloys. Trans. JWRI 1981, 10, 71–79. [Google Scholar]
  28. Matsuda, F.; Nakata, K.; Arai, K.; Tsukamoto, K. Assessment of solidification cracking test for aluminium alloy welds. Trans. JWRI 1982, 11, 67–77. [Google Scholar]
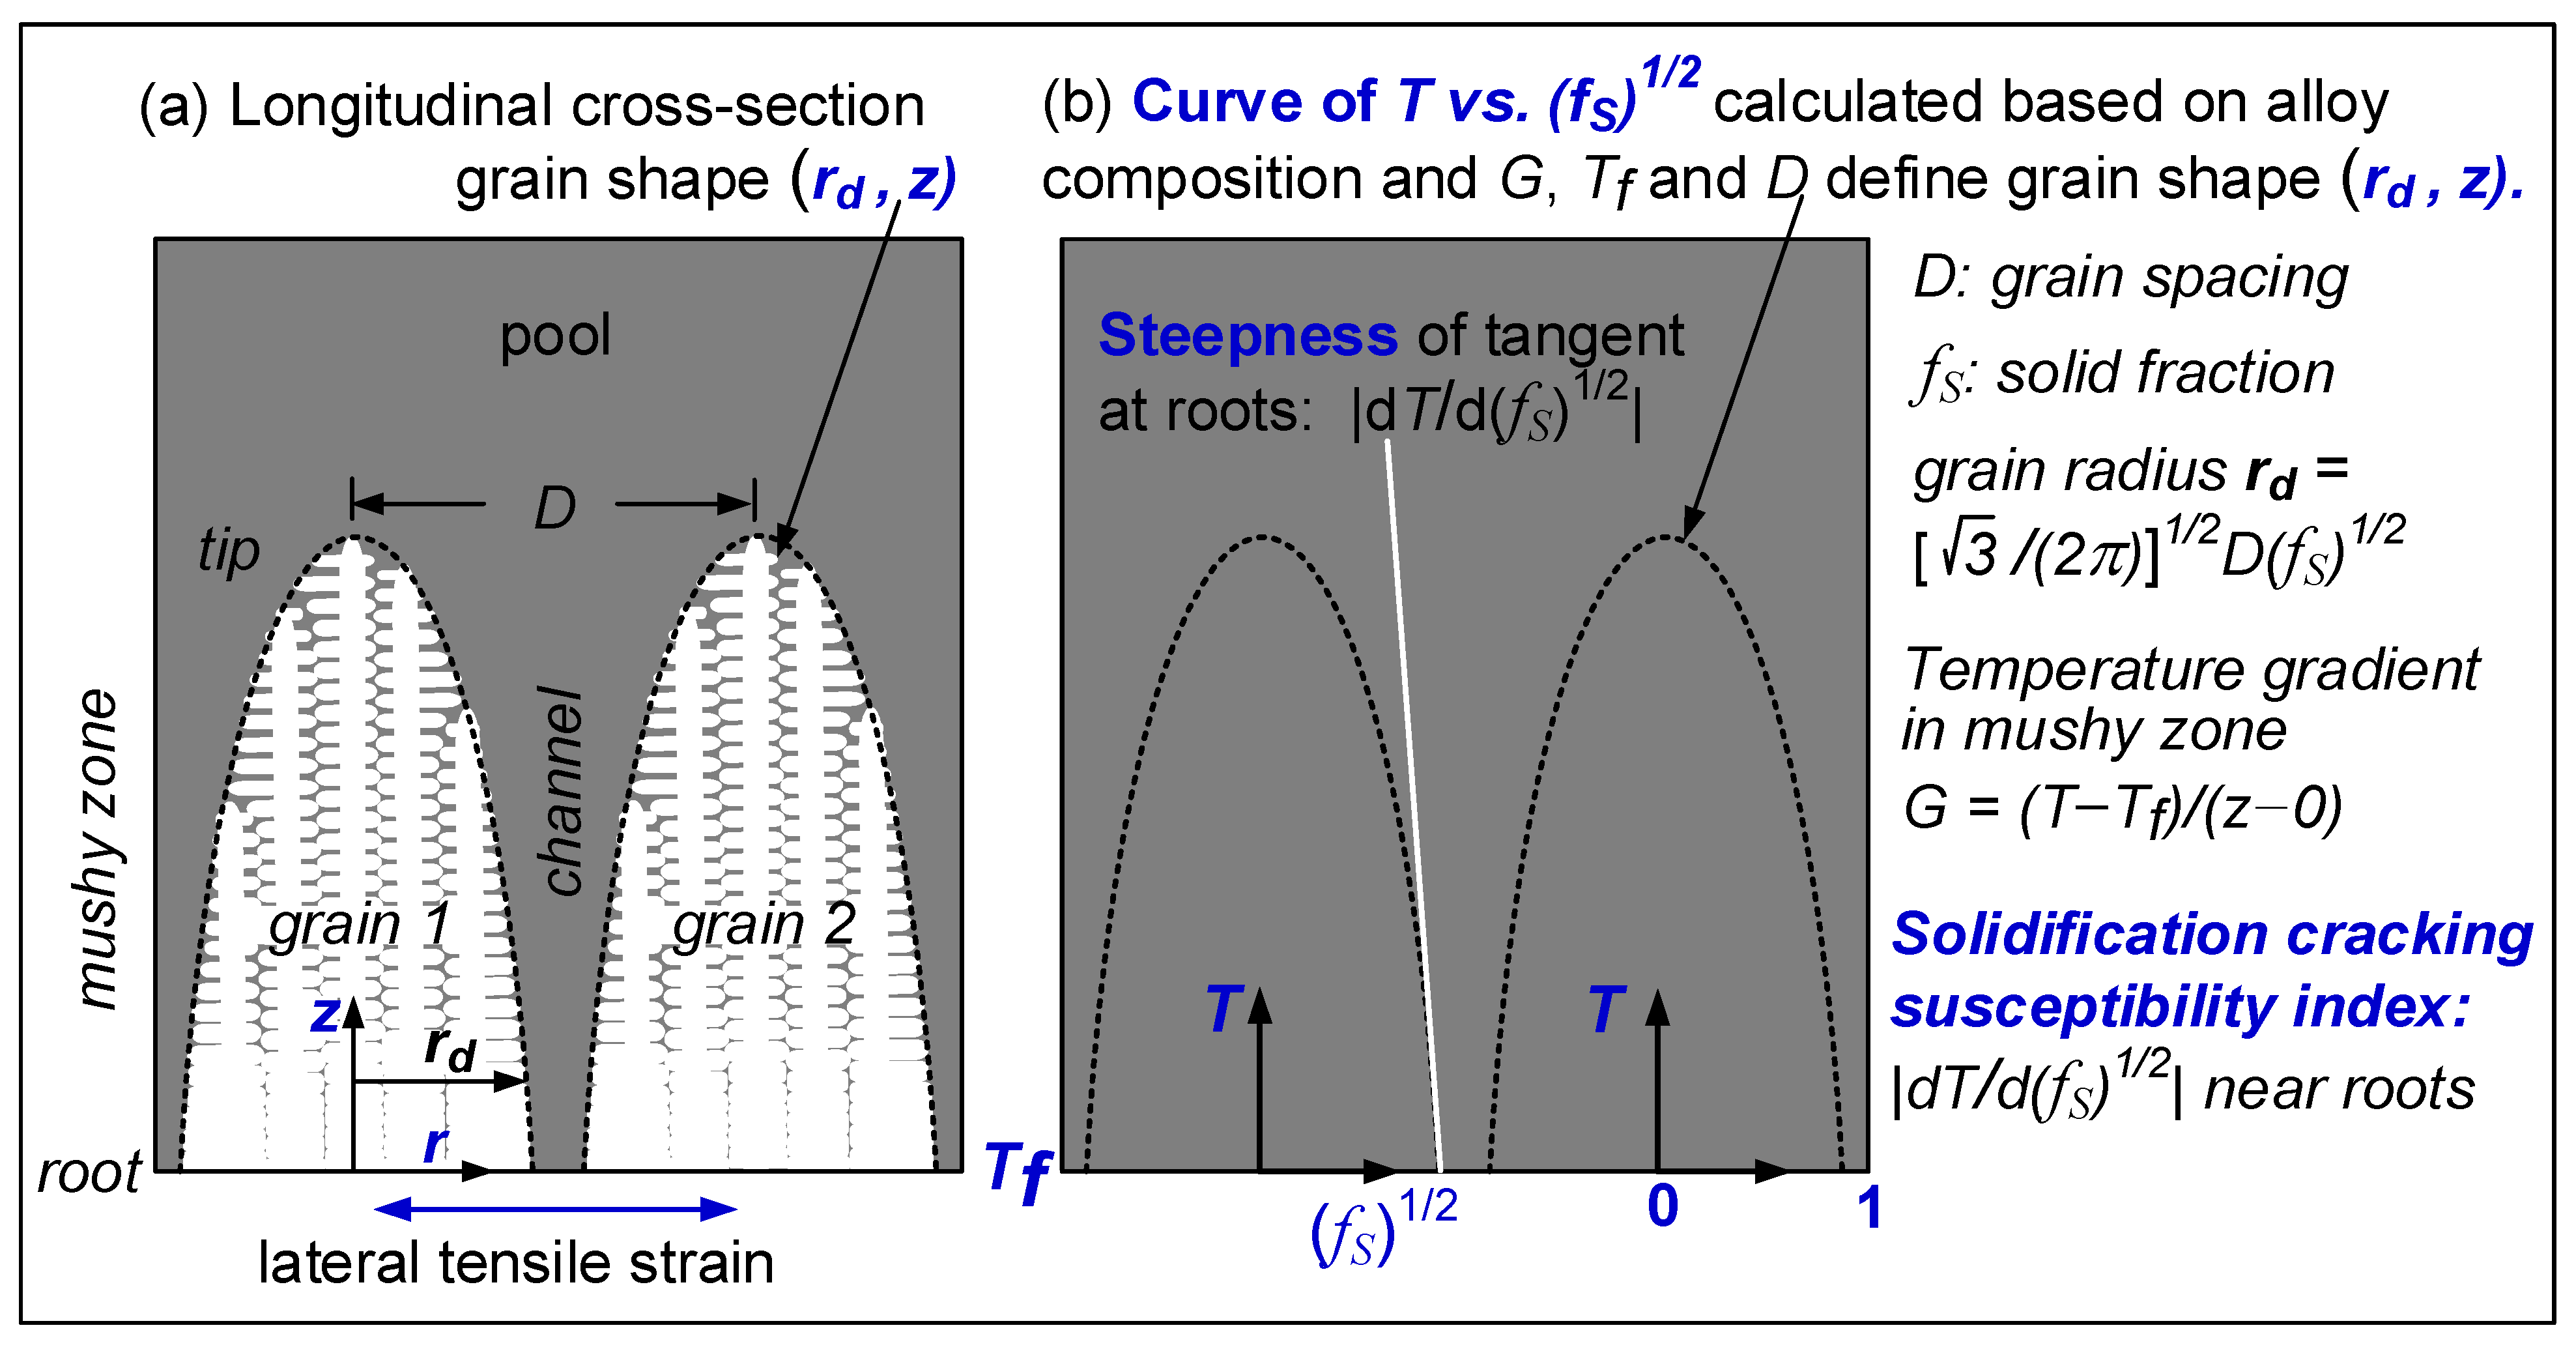
Figure 1. Columnar dendritic grains: (a) longitudinal cross-section; (b) index for solidification cracking susceptibility proposed by Kou [15].
Materials 16 05621 g001
Figure 2. CoCrFeNiCu0.5 ingot showing internal porosity exposed after cutting.
Materials 16 05621 g002
Figure 3. Macrographs showing cracking in welds: (a) no cracking anywhere in CoCrFeNiCu0; (b) through (d) cracking in fusion zone (weld metal), crater (end of weld) and partially melted zone (near fusion zone) of CoCrFeNiCu0.5, CoCrFeNiCu1 and CoCrFeNiCu1.5; (e) no cracking in fusion zone of CoCrFeNiCu2.
Materials 16 05621 g003
Figure 4. Curves of temperature T vs. solid fraction fS of all alloys during solidification, calculated using commercial thermodynamic software package Pandat2019 [16] (P) and database PanHEA2019 [17] of CompuTherm, LLC, Madison, WI, USA.
Materials 16 05621 g004
Figure 5. Curves of temperature T vs. square root of solid fraction (fS)1/2 of all alloys in the range of 0.8 < (fS)1/2 < 1.
Materials 16 05621 g005
Figure 6. CoCrFeNiCu0 fusion zone: (a) dendrites; (b) migrated grain boundary (MGB).
Materials 16 05621 g006
Figure 7. CoCrFeNiCu0.5 fusion zone: (a) dendrites; (b) solidification cracking (SC).
Materials 16 05621 g007
Figure 8. CoCrFeNiCu1 fusion zone: (a) dendrites; (b) solidification cracking.
Materials 16 05621 g008
Figure 9. CoCrFeNiCu1.5 fusion zone: (a) dendrites; (b) solidification cracking.
Materials 16 05621 g009
Figure 10. CoCrFeNiCu2 fusion zone: (a) dendrites; (b) dendrites in the right grain penetrating into the left grain.
Materials 16 05621 g010
Figure 11. Microstructure in fusion zone of alloy CoCrFeNiCu1: (a) optical micrograph; (b) optical micrograph enlarged; (c) SEM image showing Cu-rich interdendritic liquid at Point 1.
Materials 16 05621 g011
Figure 12. Liquation cracking in alloy CoCrFeNiCu1. Dotted line: fusion boundary.
Materials 16 05621 g012
Figure 13. CoCrFeNiCu0: (a) base metal; (b) near fusion boundary. Grain boundary migration is visible.
Materials 16 05621 g013
Figure 14. CoCrFeNiCu0.5: (a) base metal (globular grains, showing slight grain boundary migration); (b) near fusion boundary.
Materials 16 05621 g014
Figure 15. CoCrFeNiCu1: (a) base metal (dendritic); (b) near fusion boundary.
Materials 16 05621 g015
Figure 16. CoCrFeNiCu1.5: (a) base metal (dendritic); (b) near fusion boundary.
Materials 16 05621 g016
Figure 17. CoCrFeNiCu2: (a) base metal (dendritic); (b) near fusion boundary.
Materials 16 05621 g017
Table 1. Compositions of CoCrFeNiCux alloys in atomic%.
AlloyCoCrFeNiCu
CoCrFeNiCu026.1423.0624.7726.030
CoCrFeNiCu0.522.9120.2121.7122.8212.35
CoCrFeNiCu120.3917.9919.3220.3121.99
CoCrFeNiCu1.518.3716.2117.4118.2329.71
CoCrFeNiCu216.7214.7515.8416.6536.05
Disclaimer/Publisher’s Note: The statements, opinions and data contained in all publications are solely those of the individual author(s) and contributor(s) and not of MDPI and/or the editor(s). MDPI and/or the editor(s) disclaim responsibility for any injury to people or property resulting from any ideas, methods, instructions or products referred to in the content.