

Laser Shock Peening Improves the Corrosion Resistance of an E690 High-Strength Steel Cladding Layer

Abstract
:1. Introduction
2. Materials and Methods
2.1. Materials
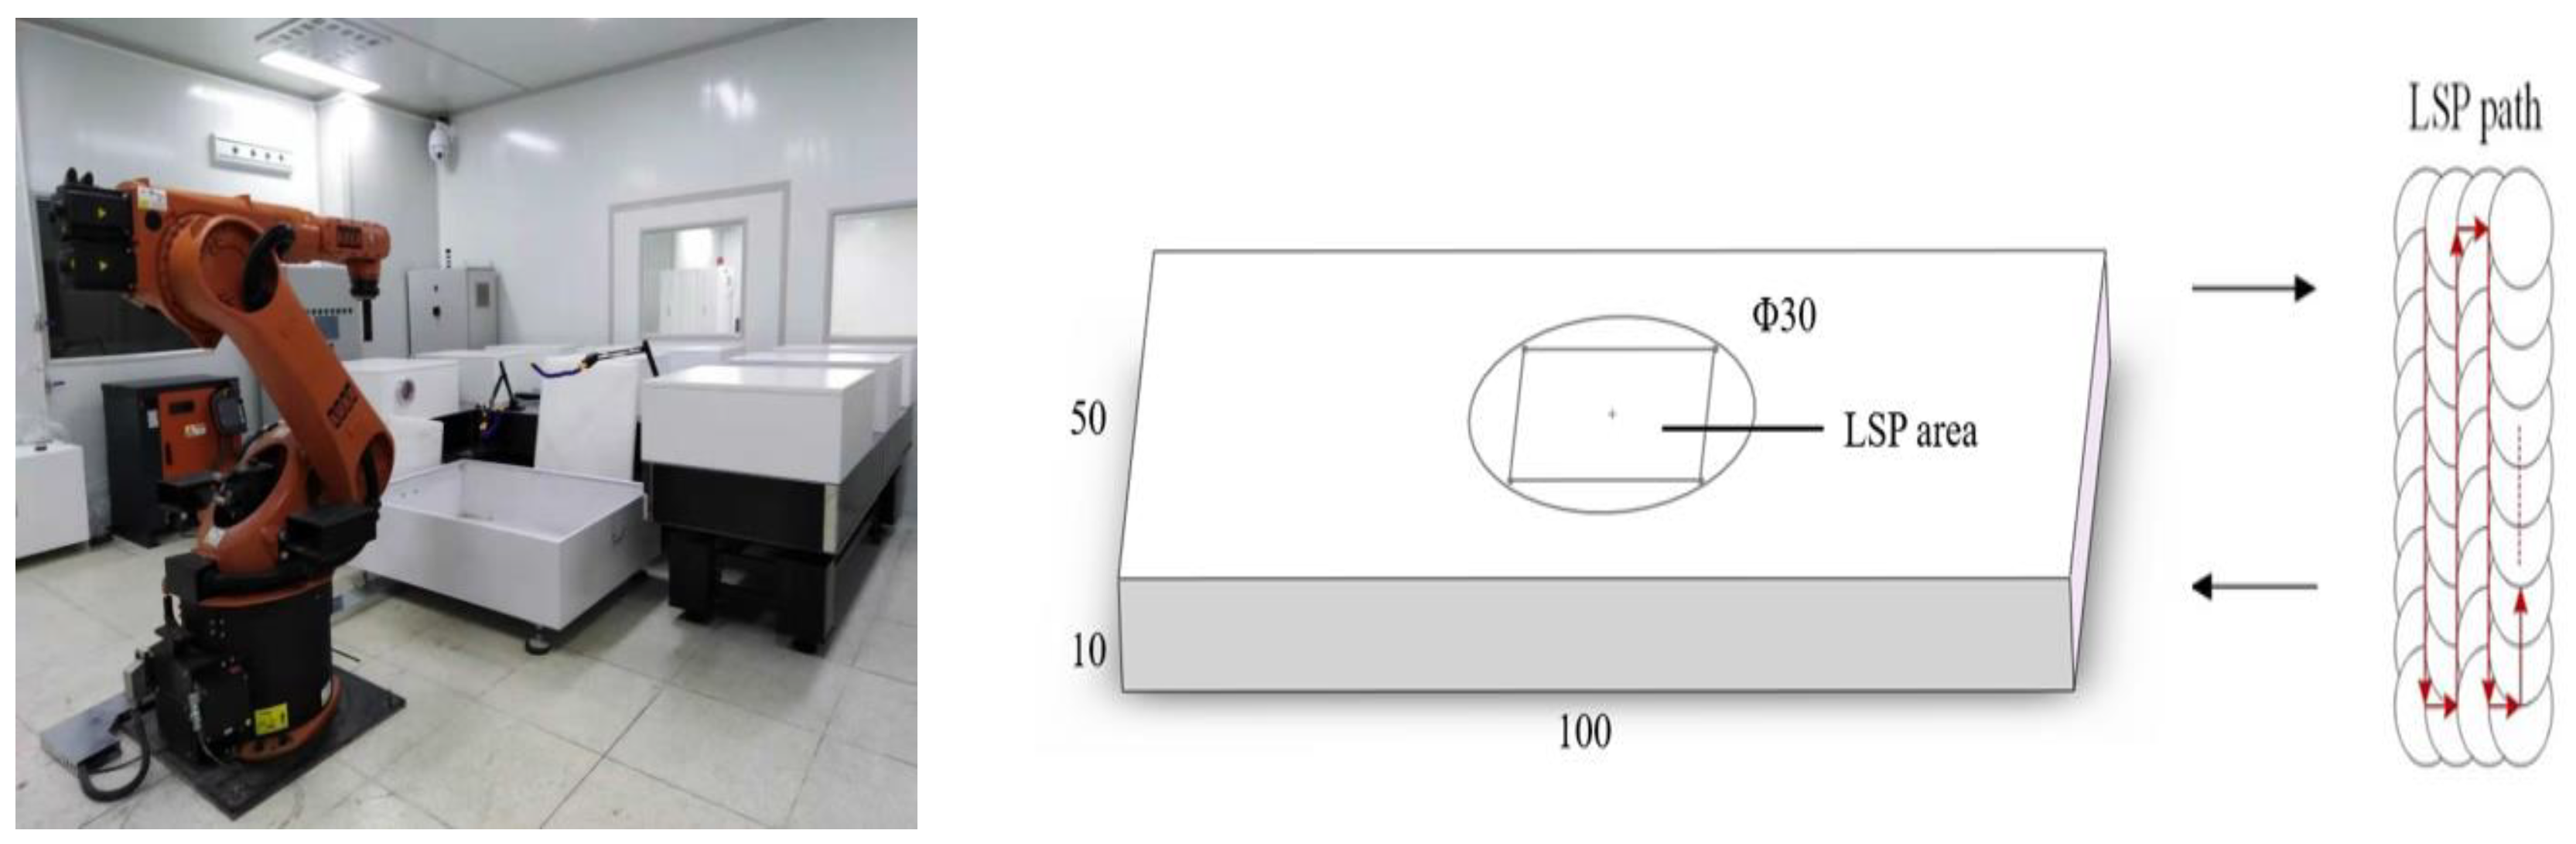
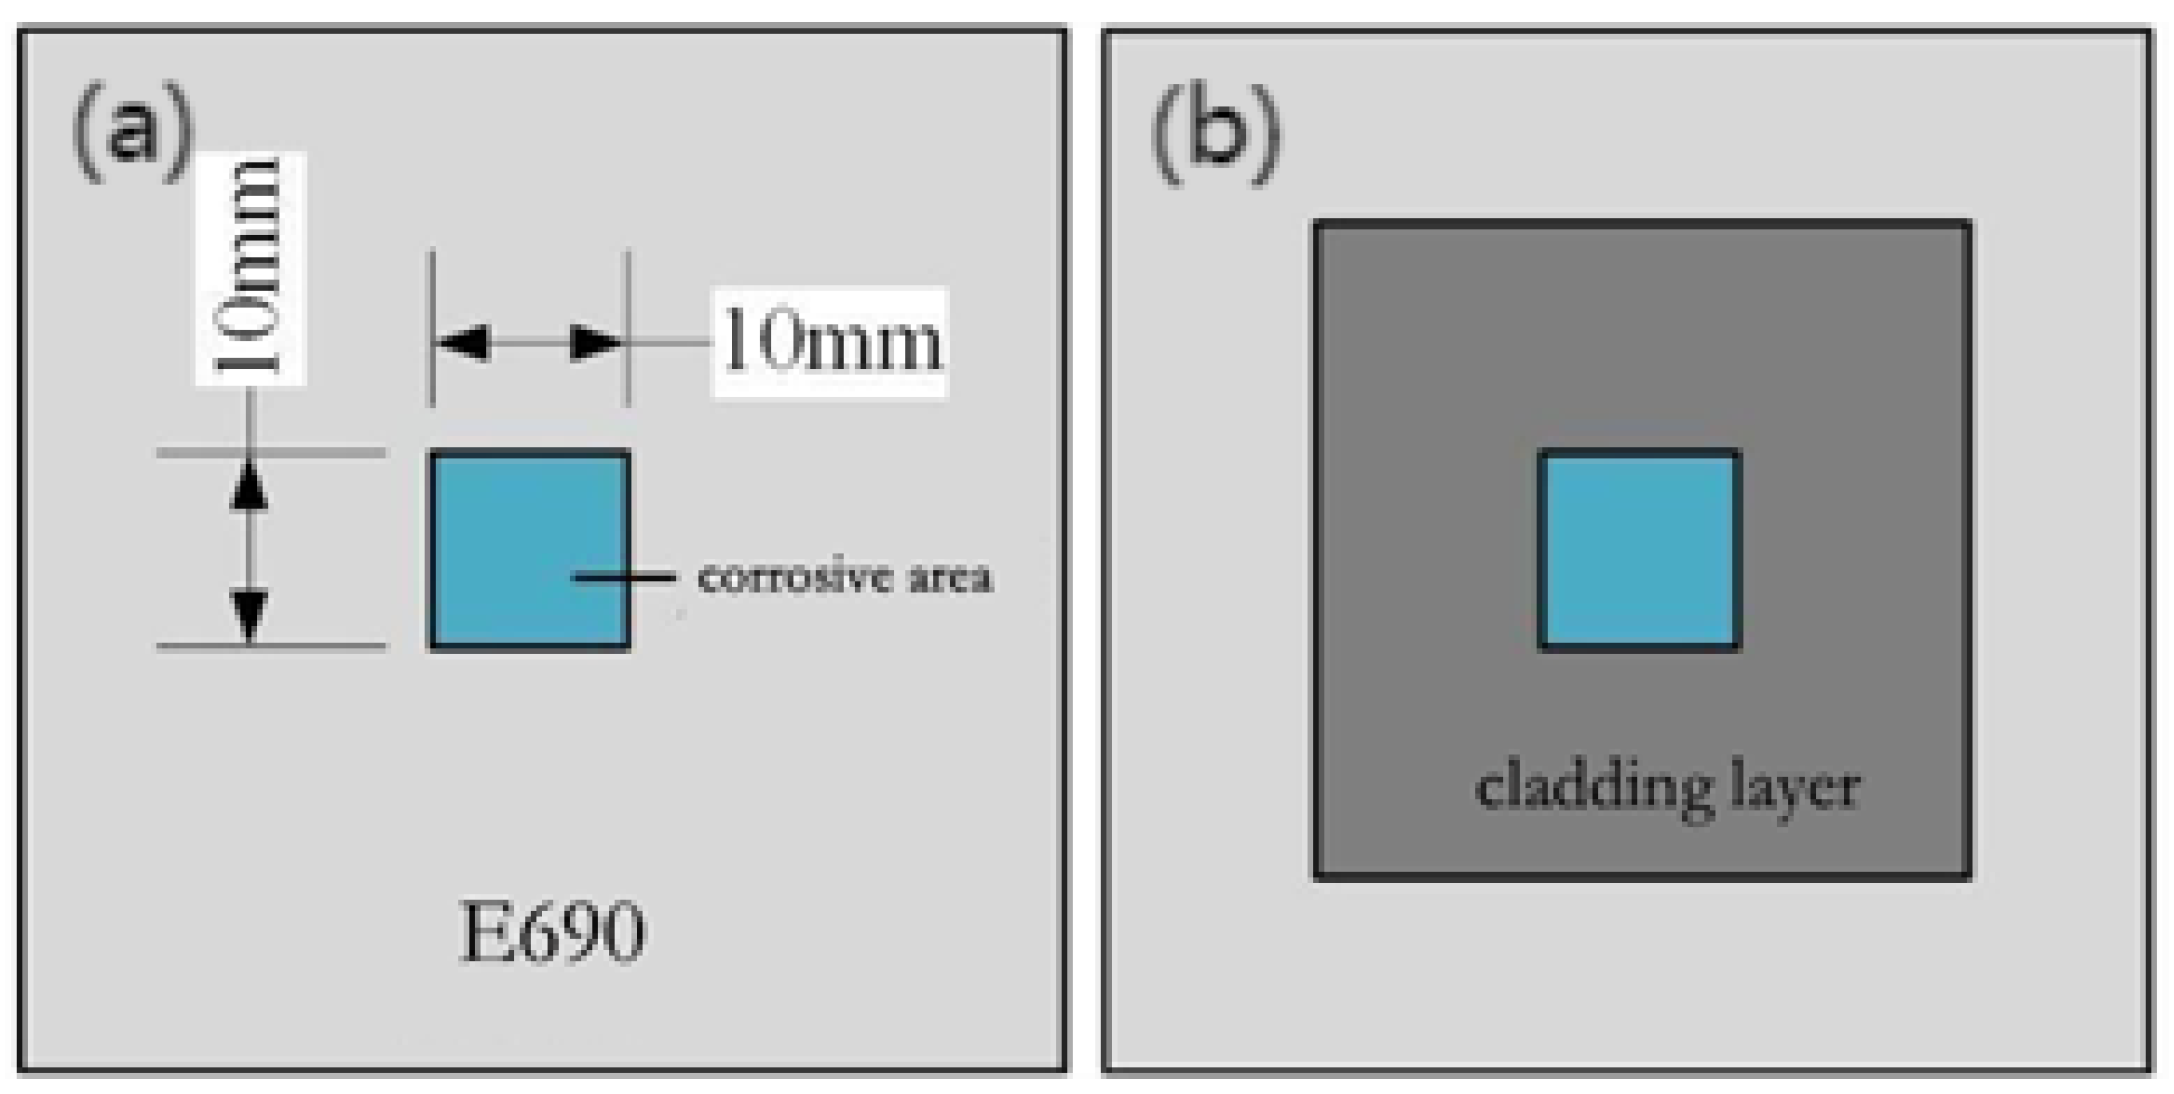
2.2. Test Methods
2.3. Testing and Analysis
3. Test Results
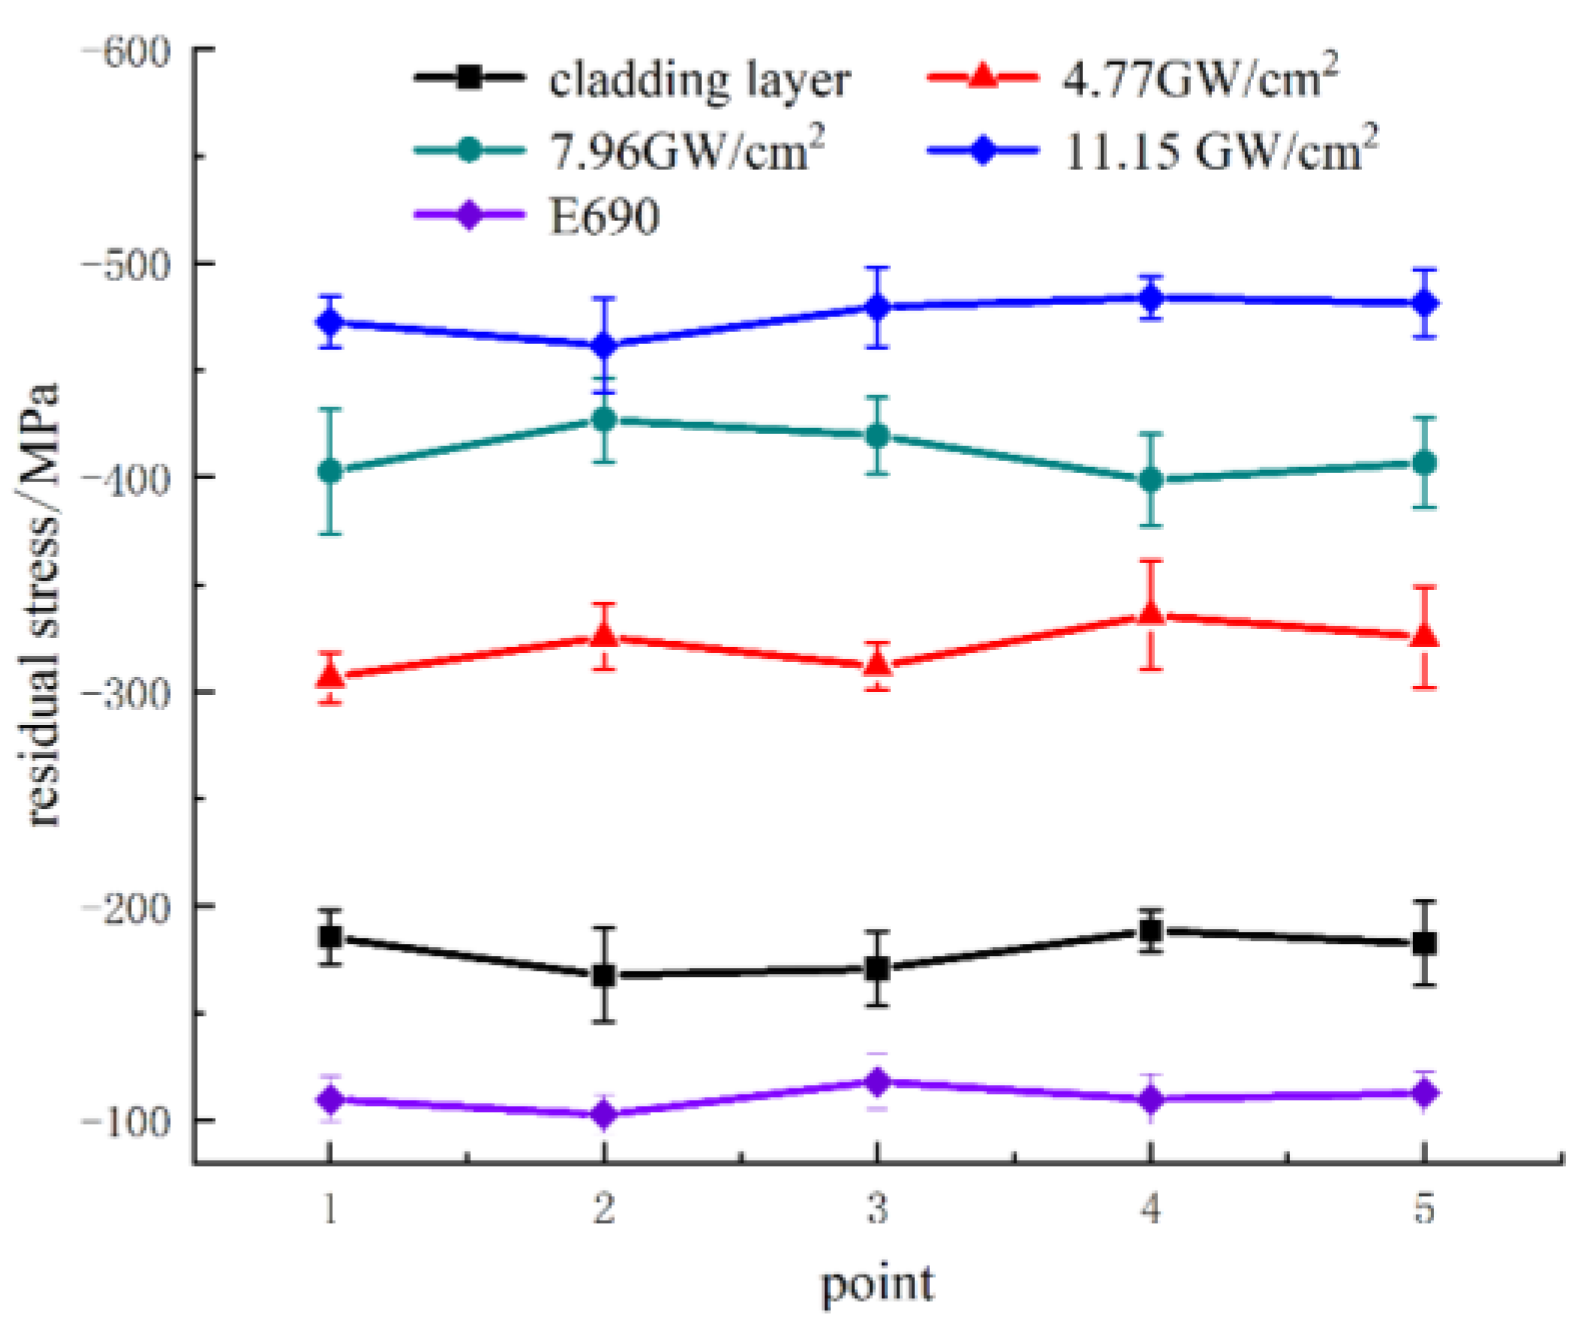
3.1. Residual Stress
3.2. Microhardness
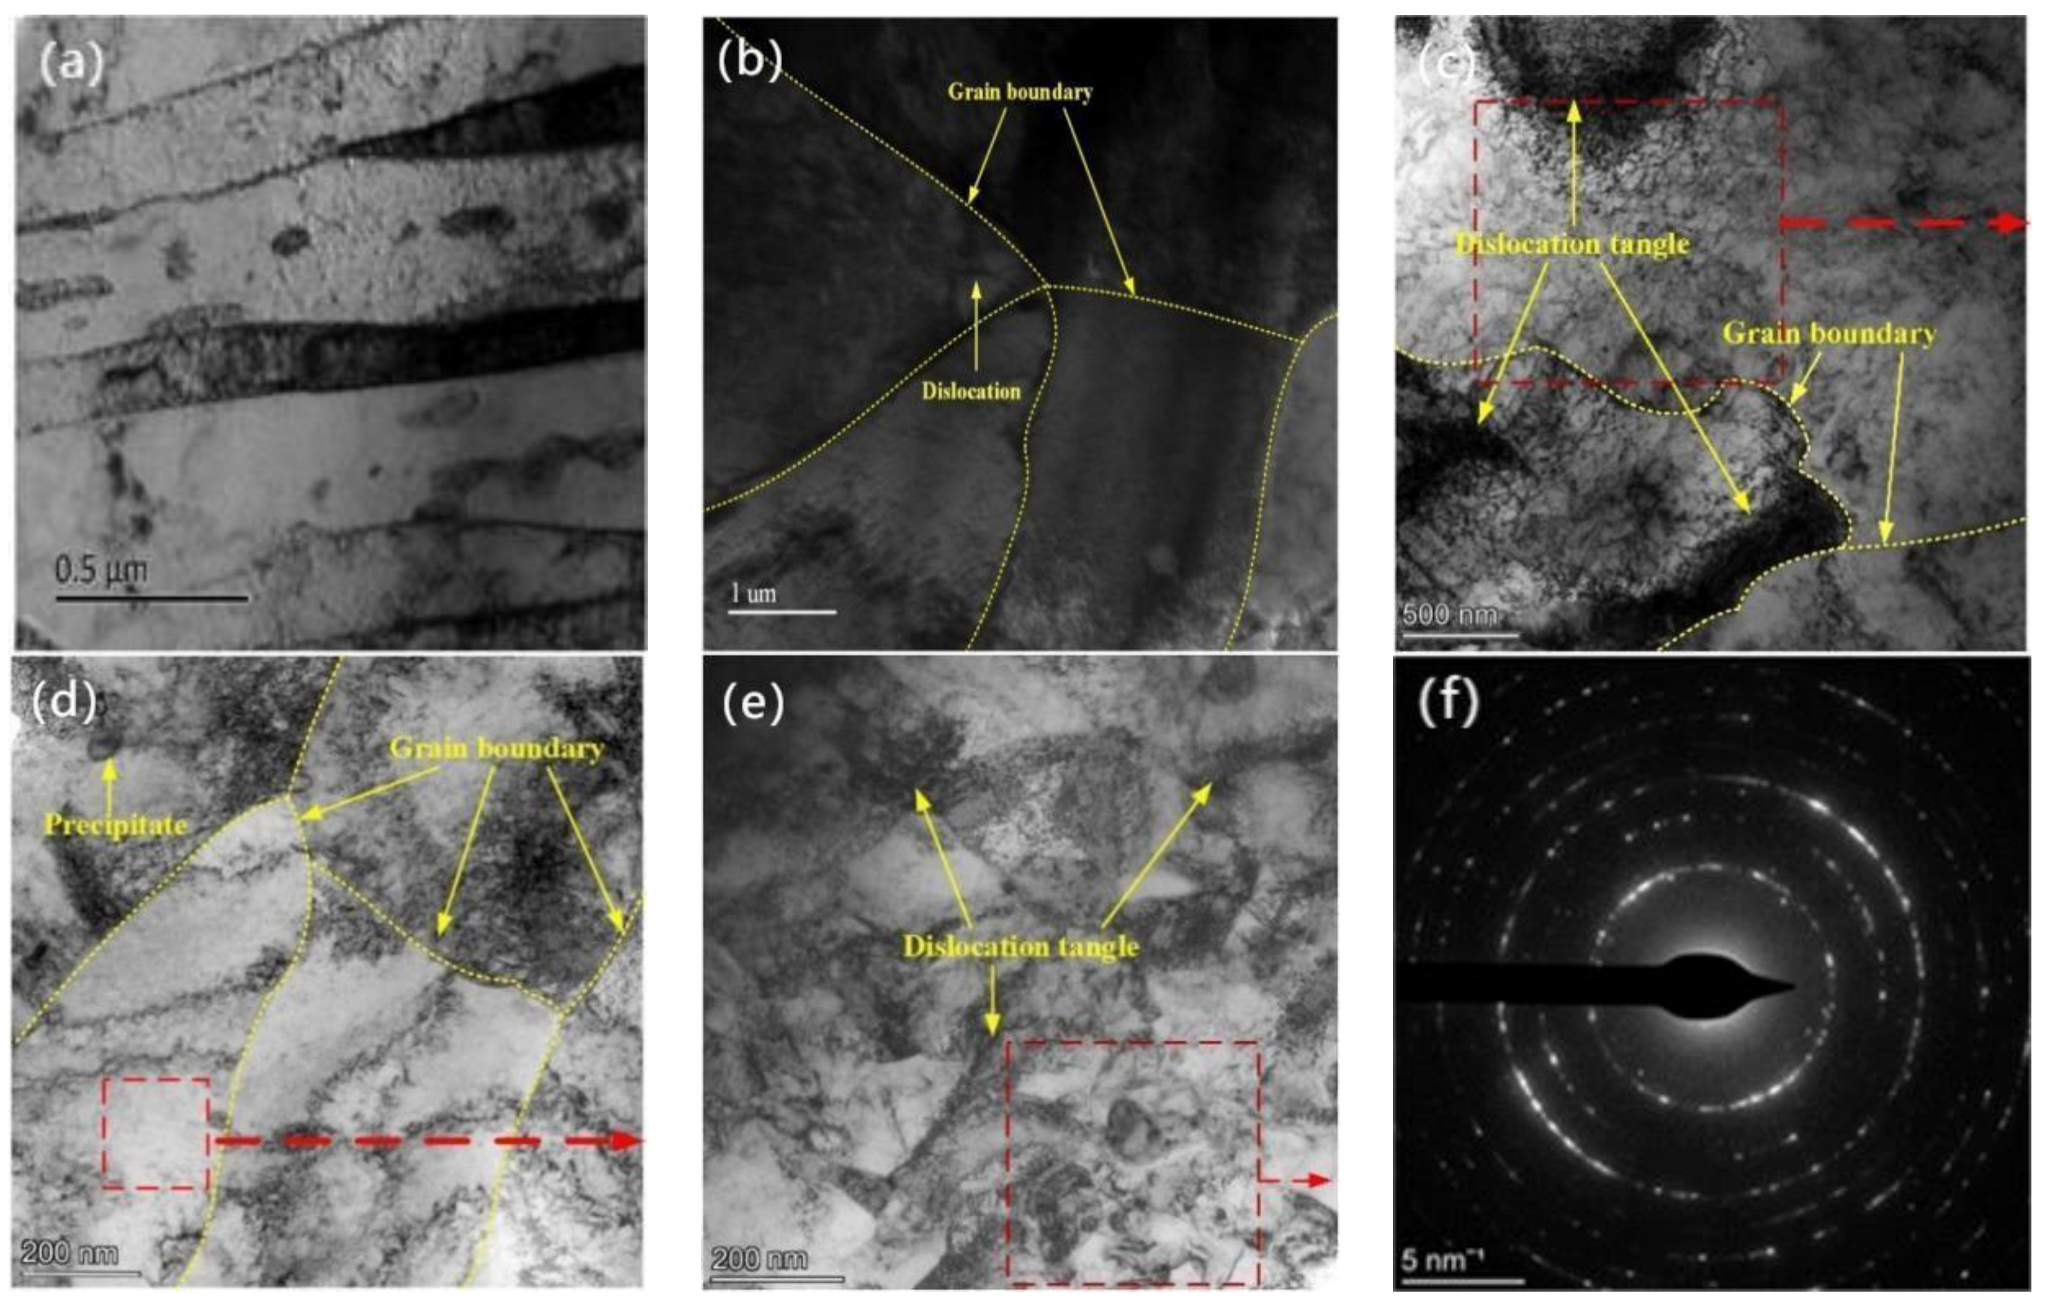
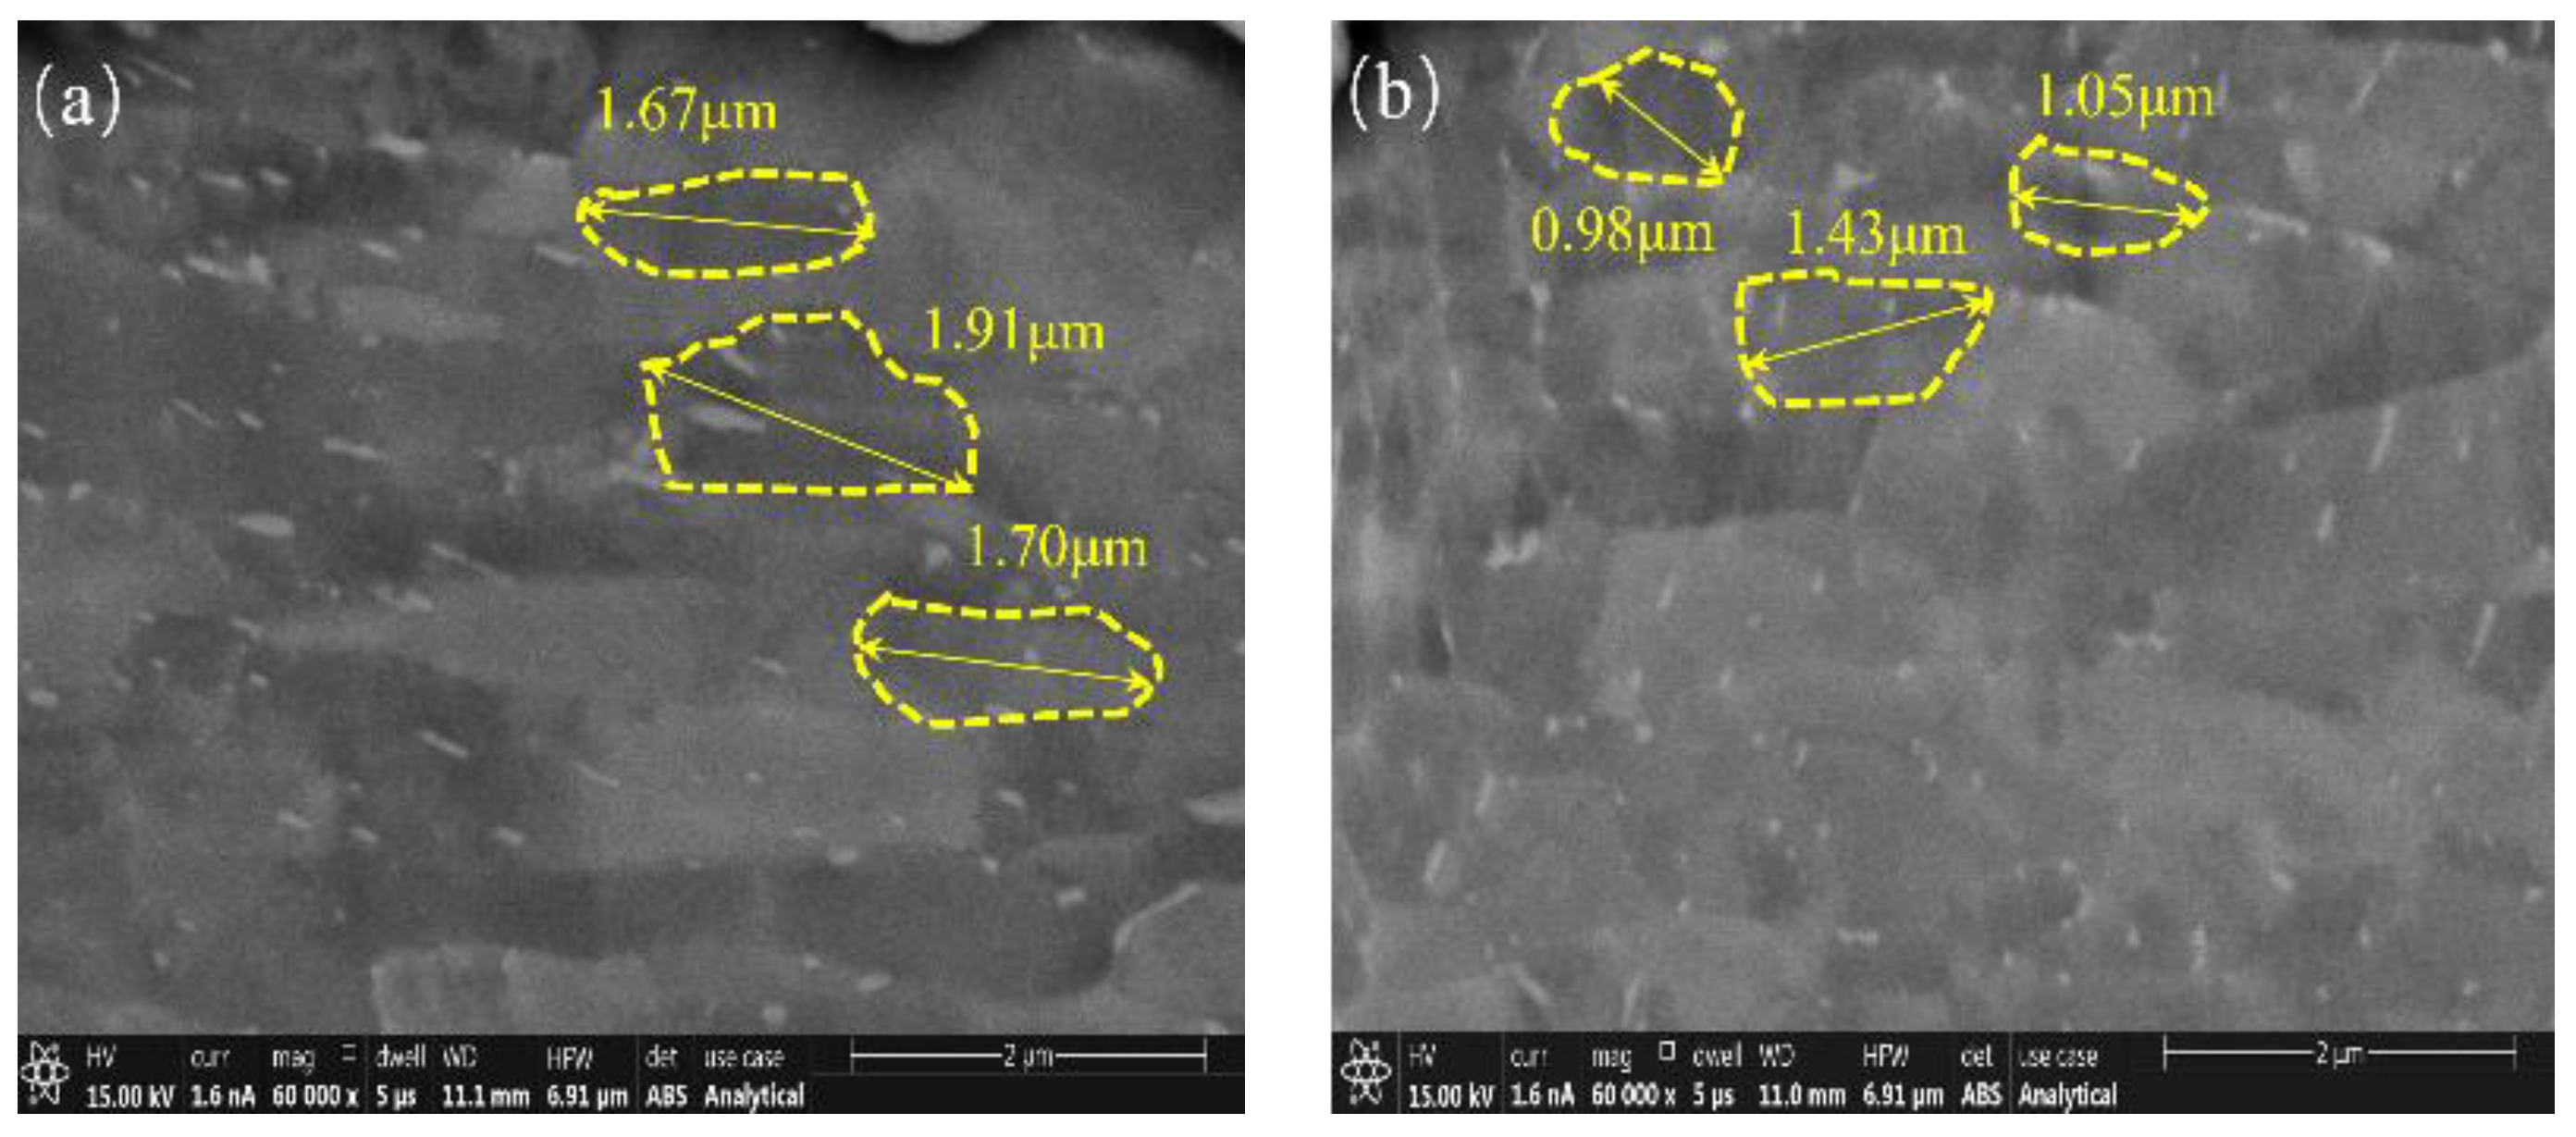
3.3. Surface Microstructure
3.4. Cross-Section Microstructure
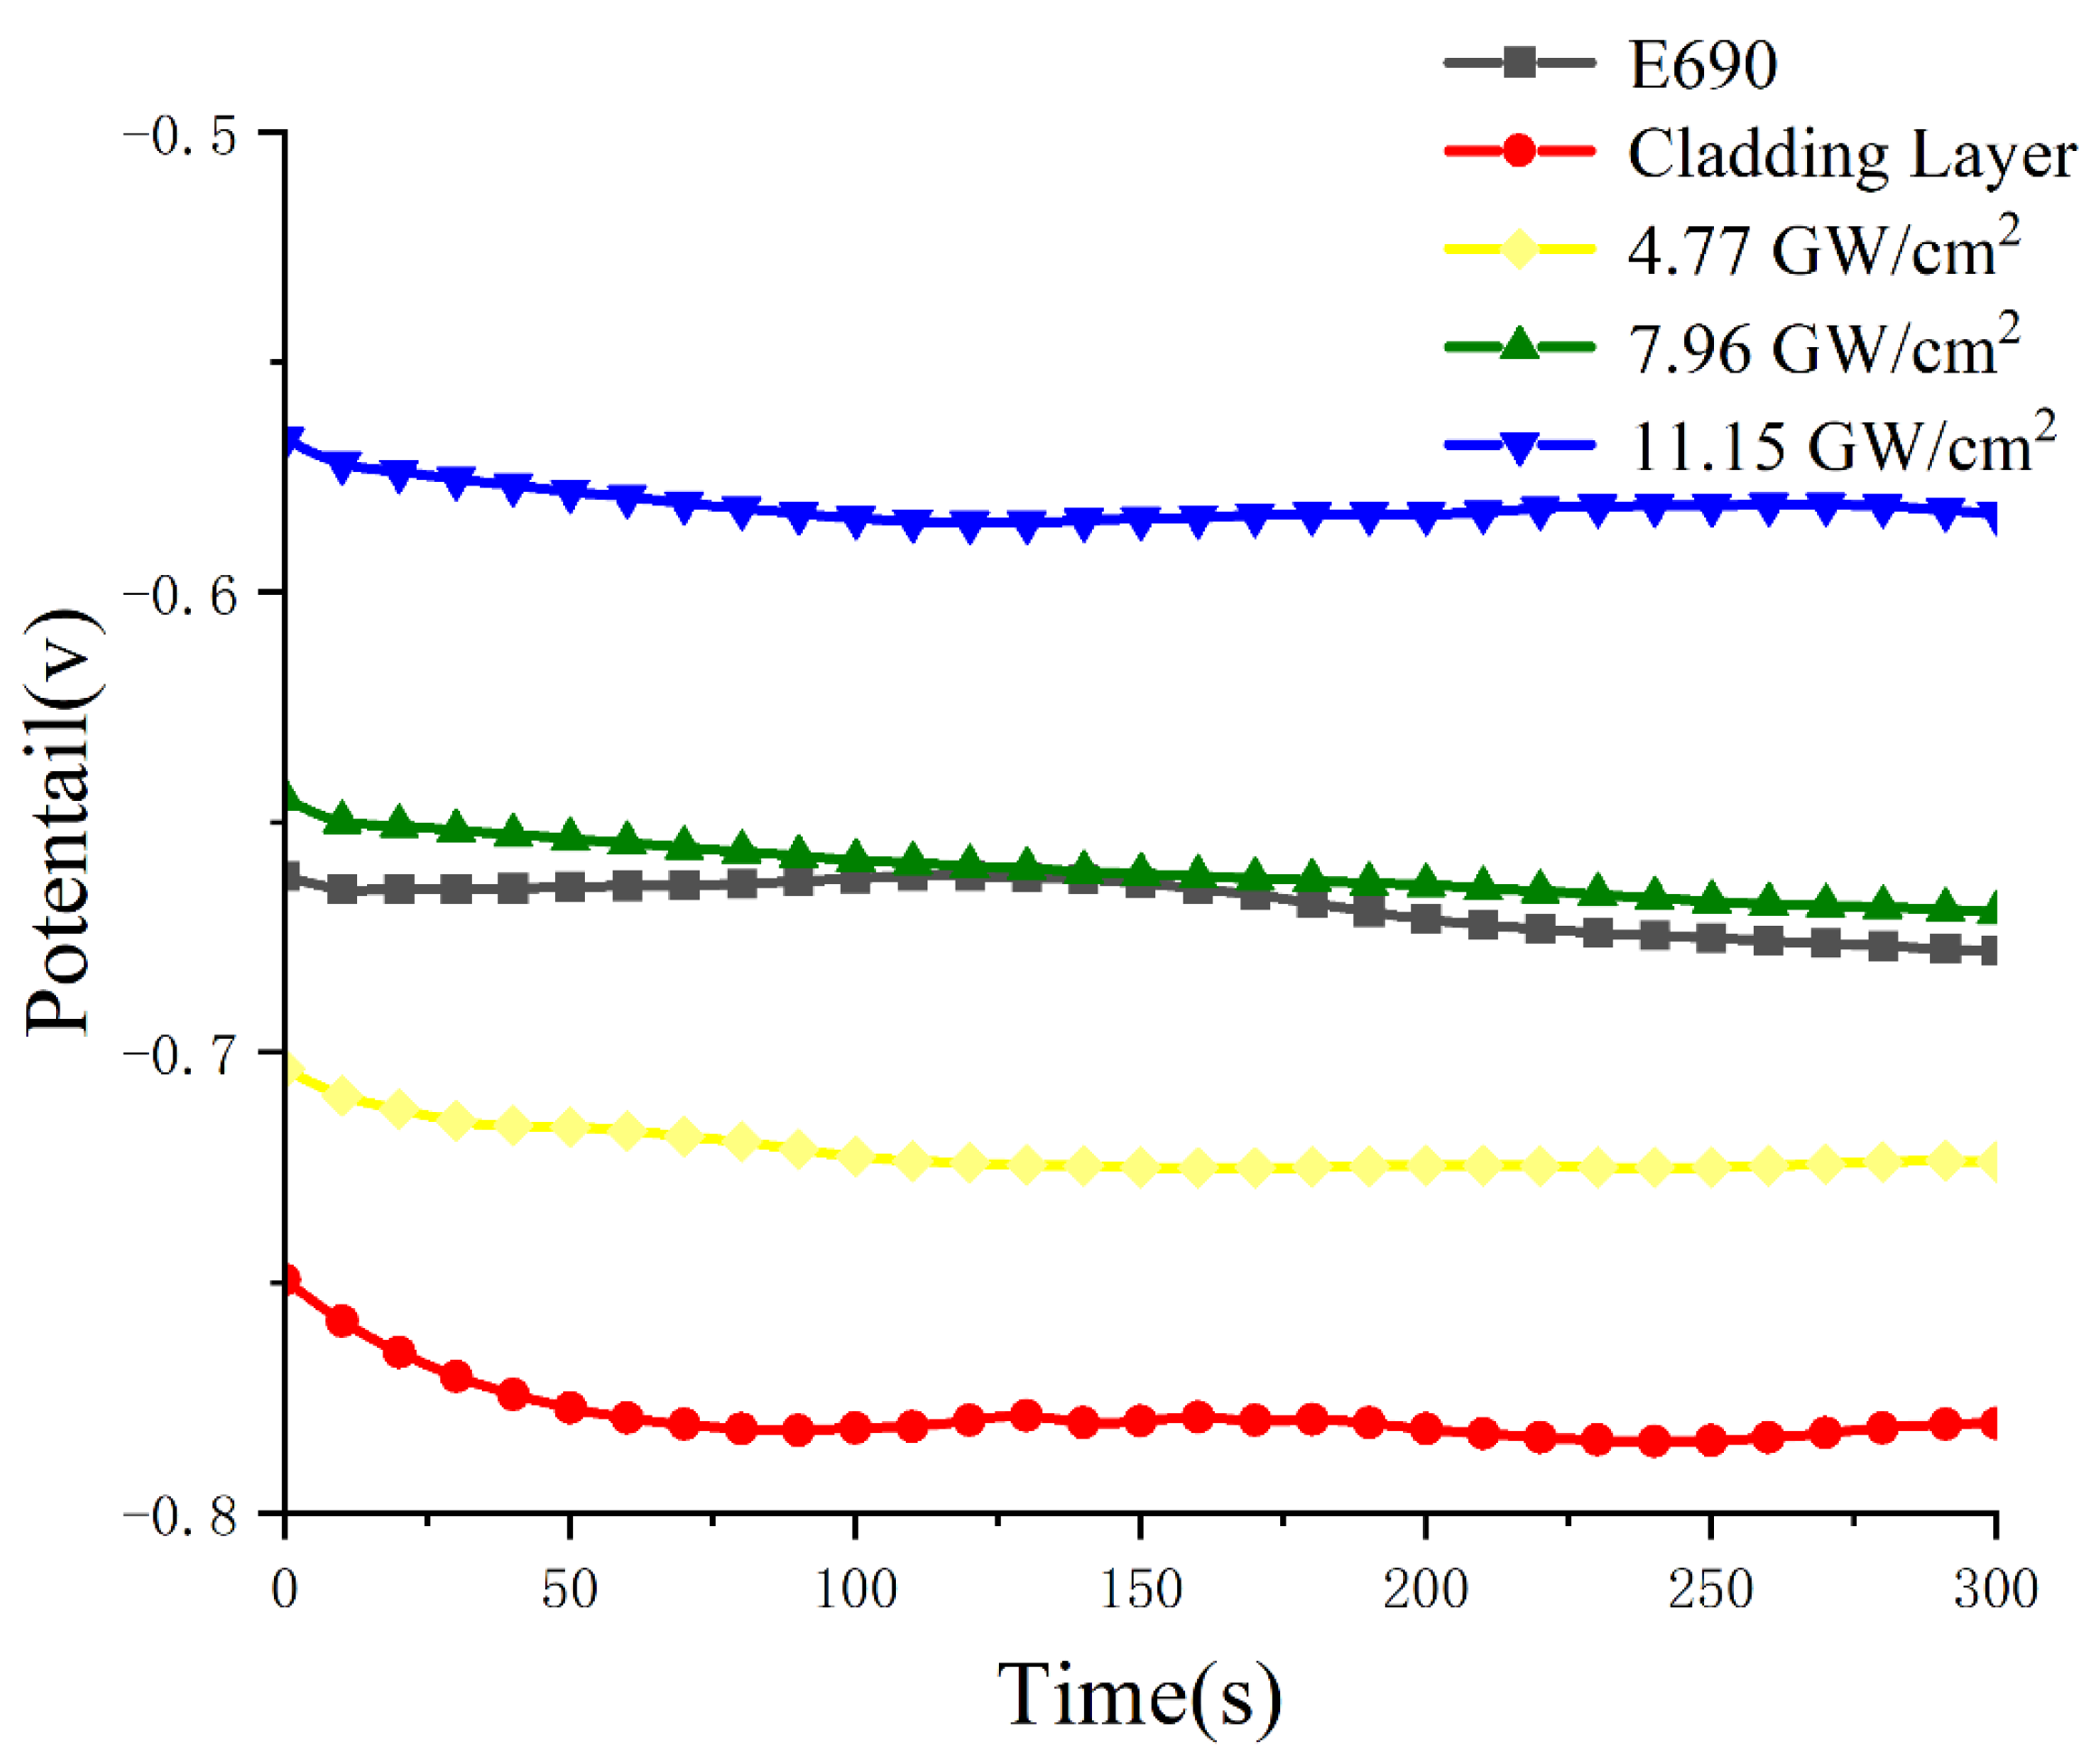
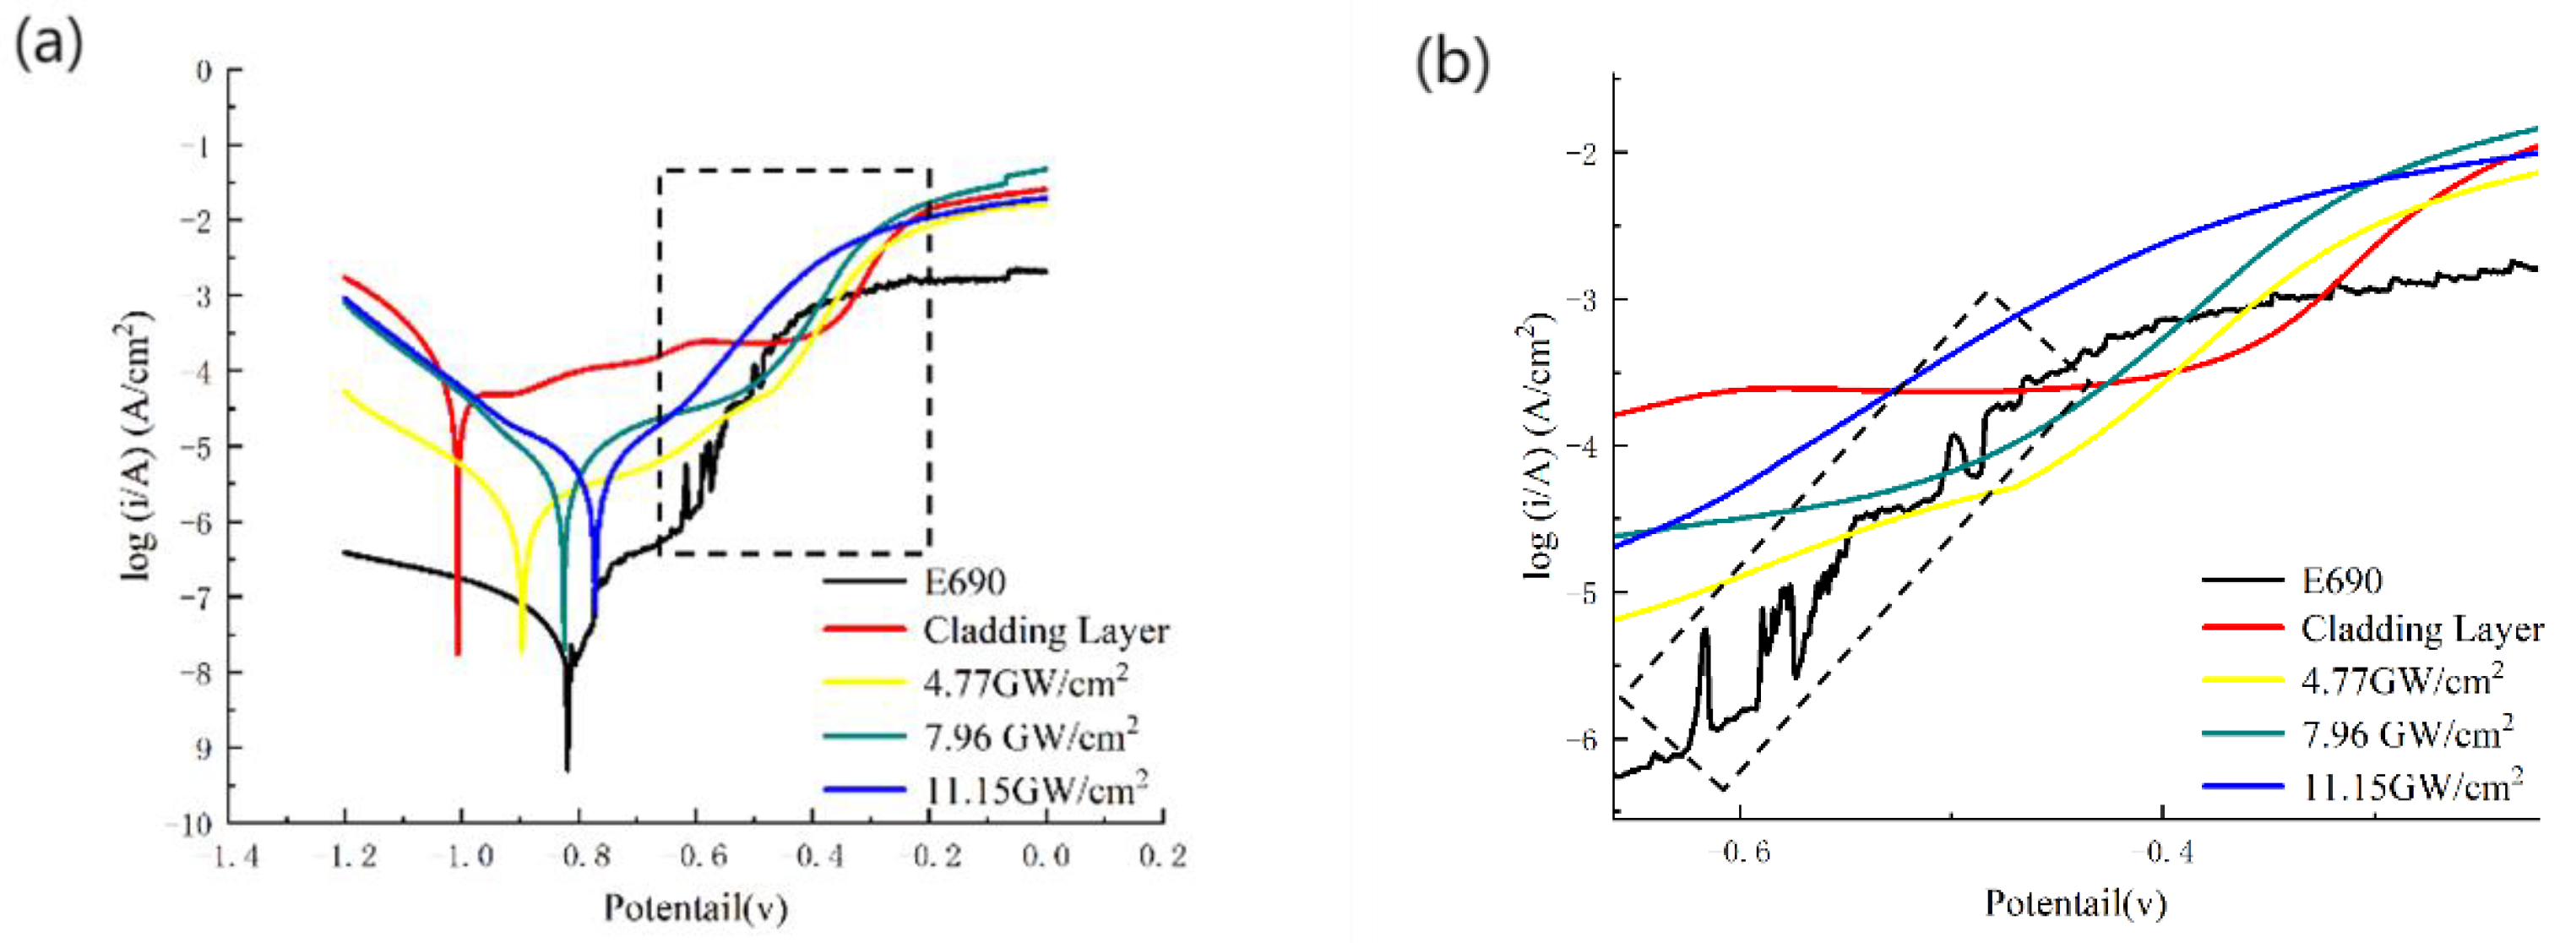
3.5. Electrochemical Corrosion Performance
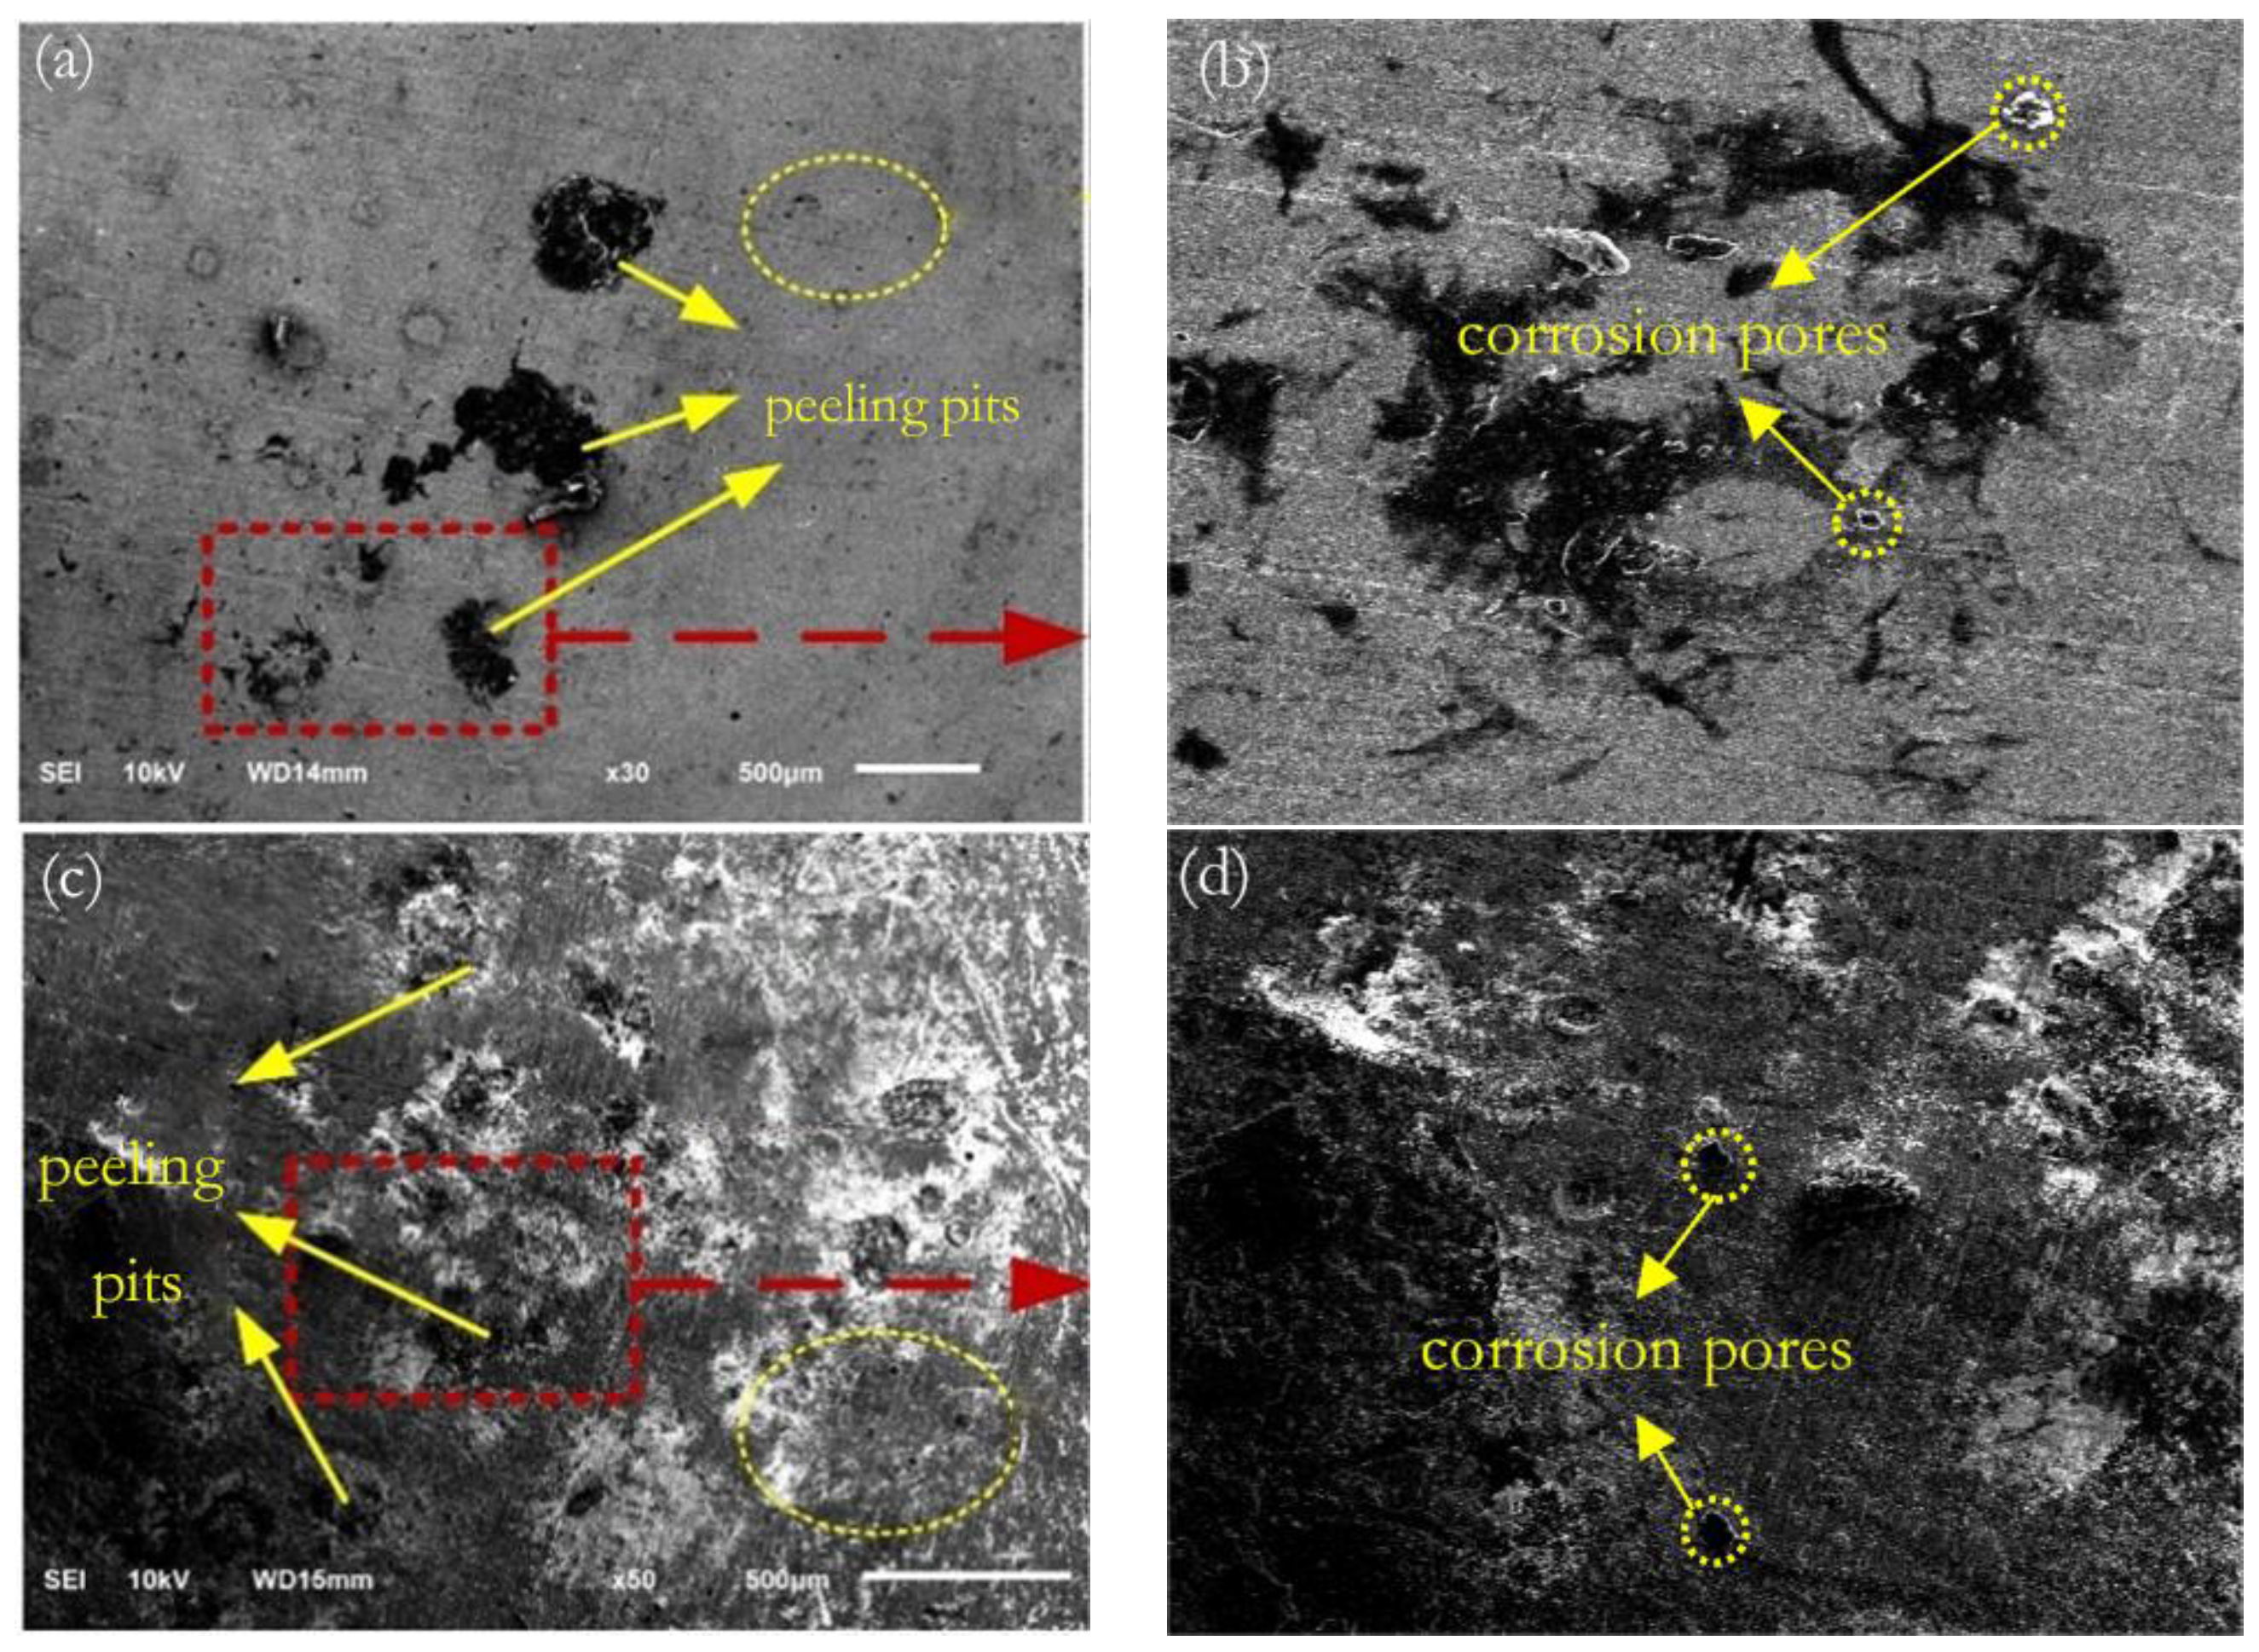
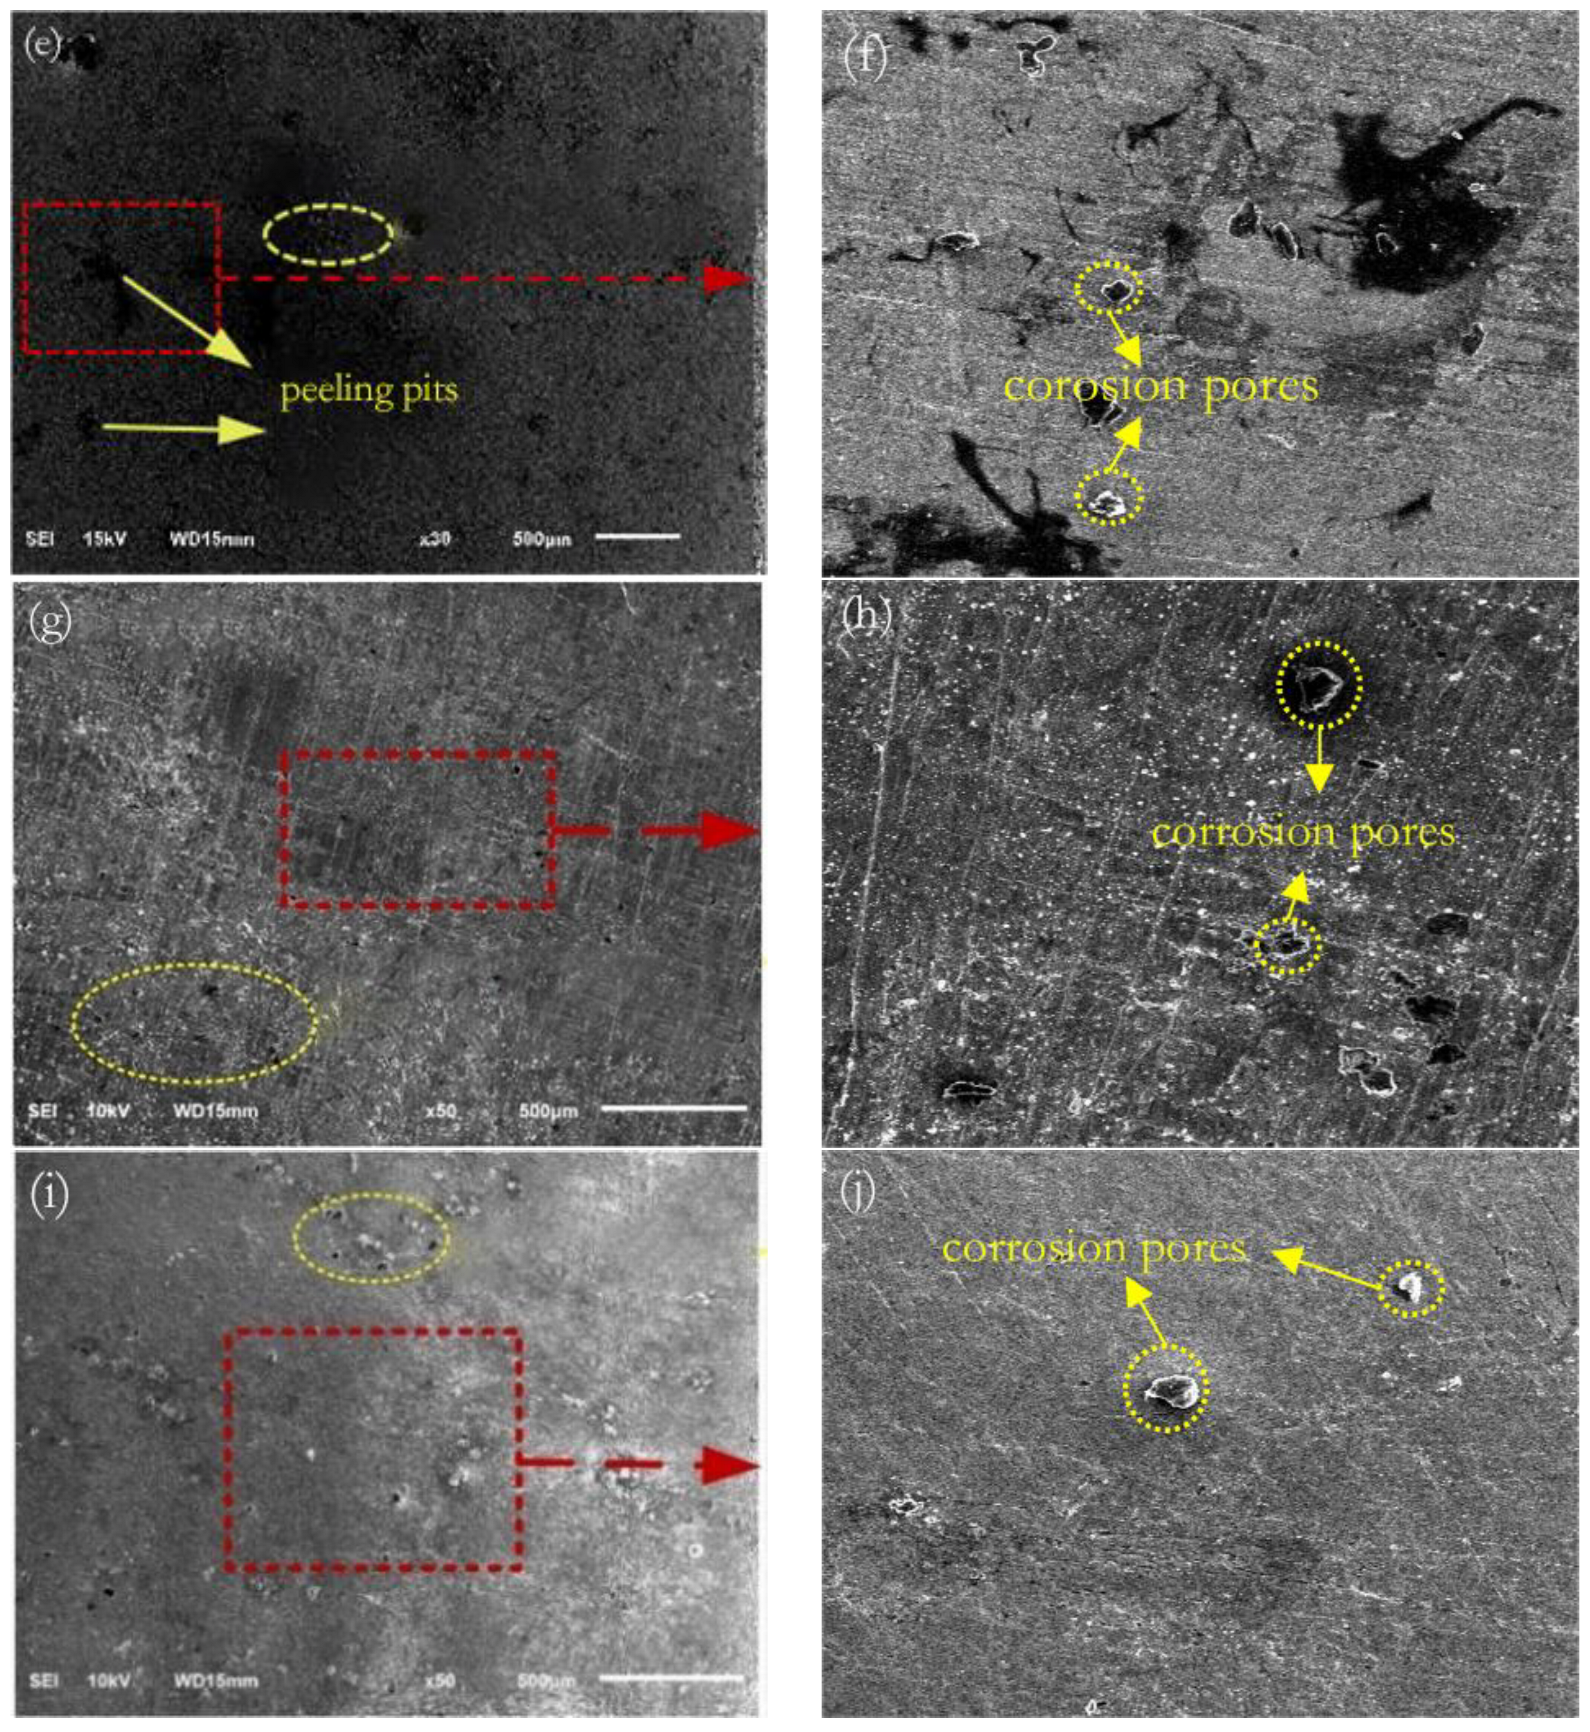
3.6. Surface Corrosion Morphology
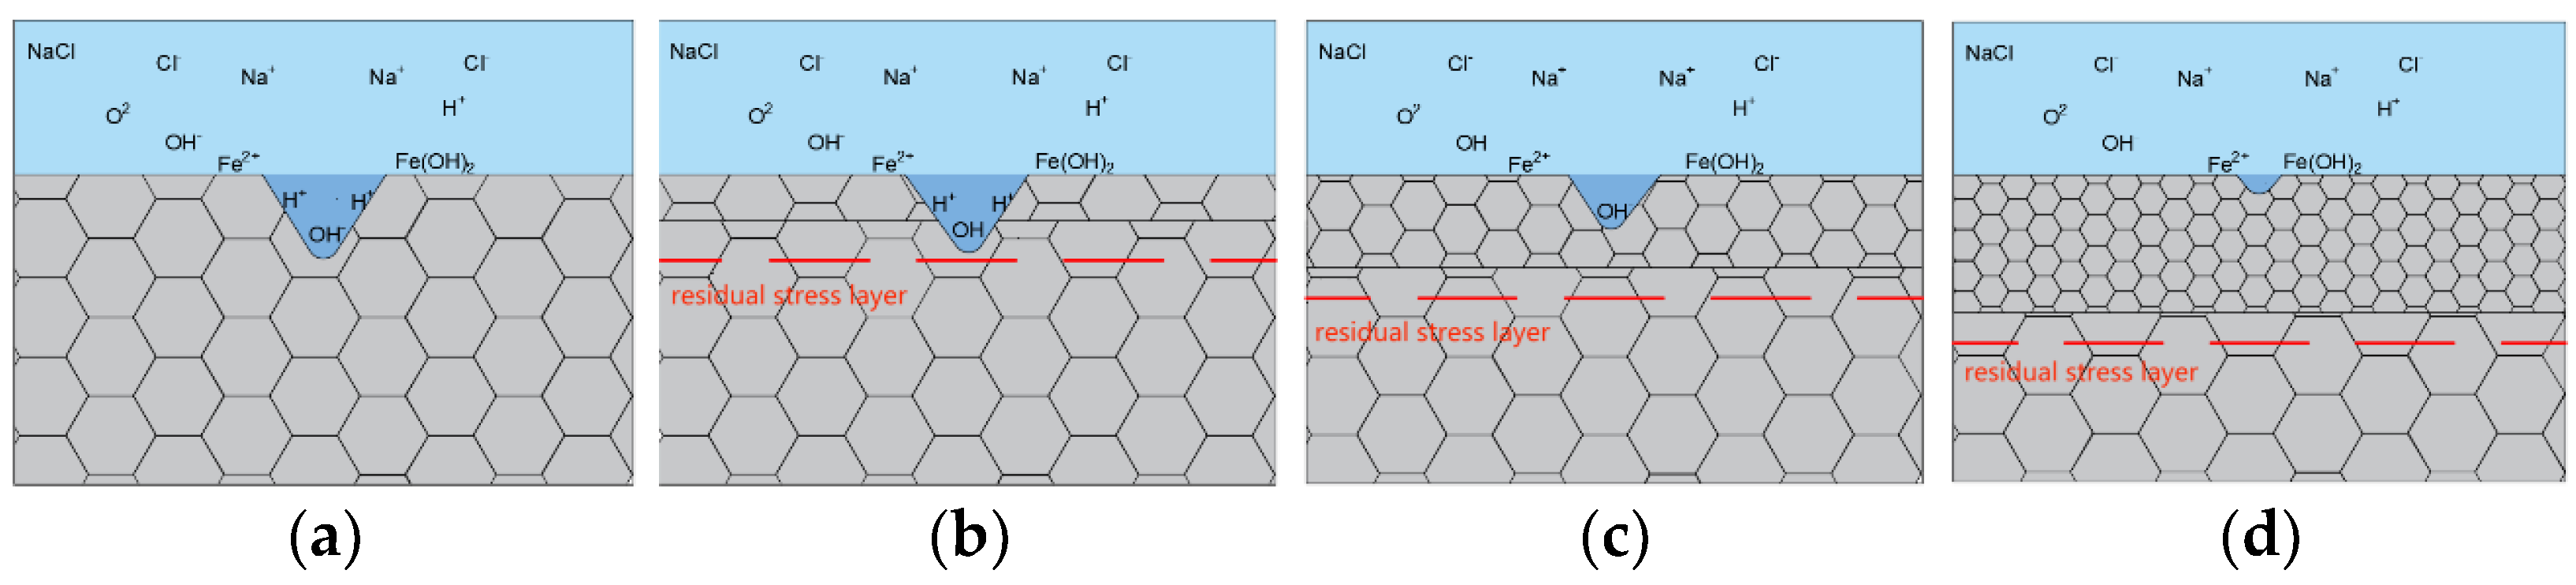
4. Analysis and Discussion
5. Summary and Outlook
- Laser shock peening was performed on the cladding layer using power densities of 4.77 GW/cm2, 7.96 GW/cm2, and 11.15 GW/cm2. As the laser power density increases, the surface grains of the E690 high-strength steel cladding layer continue to refine until nanocrystals are formed, and the surface residual compressive stress also increases. The surface residual stress increases from −178.8 ± 16 to −475.8 ± 15 MPa.
- After laser shock peening, the fluctuation range of the open-circuit potential time curve of the cladding layer gradually decreases and tends to stabilize. The corrosion potential increases from −1.004 to −0.771 V, and the corrosion current density decreases from 114.5 to 5.41 μA/cm2. As the laser power density increases, the residual compressive stress on the surface renders the passivation film layer stable and dense, as well as less susceptible to Cl− erosion, and the surface grain of the material is refined, inhibiting the initiation and propagation of microcracks, which delays surface corrosion. This is manifested by a positive shift in the corrosion potential, a decrease in the corrosion current density, an increase in the radius of the impedance spectrum curve, and a gradual elimination of surface peeling pits, as well as corrosion micropores. The corrosion resistance of the cladding layer sample substantially improves.
- The present authors established a corrosion resistance model for laser shock peening of an E690 high-strength steel cladding layer, and elaborated on the relationship between laser shock peening technical parameters and the corrosion resistance. Regarding production of the passivation film, the microscale appearance, tissue composition, and laser shock peening parameters of a E690 high-strength steel melting layer passivation requires additional research. In the future, other process parameters such as spot diameter and impact frequency can be changed to observe the changes in the passivation film structure and cladding corrosion resistance after laser shock peening.
Author Contributions
Funding
Institutional Review Board Statement
Informed Consent Statement
Data Availability Statement
Conflicts of Interest
References
- Wang, H.; Liu, X.; Ni, G.X.; Jiang, J. Research on Corrosion Fatigue Crack Growth of Marine Engineering Equipment Material E690 High-Strength Steel. Sci. Adv. Mater. 2019, 116, 862–865. [Google Scholar] [CrossRef]
- Wu, H.; Wu, G.; Xiang, L.; Tao, J.; Zheng, Z.; Sun, J.; Li, W.; Huang, C.; Lan, X. Impact of Corrosion on the Degradation of the Mechanical Properties of 2195 and 2297 Al Alloys in the Marine Environment. Metals 2022, 128, 1371. [Google Scholar] [CrossRef]
- Chaves, I.A.; Melchers, R.E.; Sterjovski, Z.; Rosen, J. Long-term marine immersion corrosion of welded ABS grade steels. Corros. Eng. Sci. Technol. 2021, 573, 195–203. [Google Scholar]
- Li, Y.F.; Ning, C.Y. Latest research progress of marine microbiological corrosion and bio-fouling, and new approaches of marine anti-corrosion and anti-fouling. Bioact. Mater. 2019, 4, 189–195. [Google Scholar] [CrossRef]
- Wei, S.; Su, H. Mechanistic Aspects of Factors Affecting Pitting Corrosion of Metallic Materials for Marine Application: A Review Paper. Int. J. Electrochem. Sci. 2019, 144, 3949–3967. [Google Scholar]
- Tsuyama, M.; Kodama, Y.; Miyamoto, Y.; Kitawaki, I.; Tsukamoto, M.; Nakano, H. Effects of Laser Peening Parameters on Plastic Deformation in Stainless Steel. J. Laser Micro Nanoeng. 2016, 112, 227–231. [Google Scholar] [CrossRef] [Green Version]
- Cao, Y.; Wang, Z.; Shi, W.; Hua, G.; Qiu, M. Formation Mechanism and Weights Analysis of Residual Stress Holes in E690 High-Strength Steel by Laser Shock Peening. Coatings 2022, 122, 285. [Google Scholar] [CrossRef]
- Ning, C.; Zhang, G.; Yang, Y.; Zhang, W. Effect of laser shock peening on electrochemical corrosion resistance of IN718 superalloy. Appl. Opt. 2018, 5710, 2467–2473. [Google Scholar] [CrossRef]
- Luo, K.Y.; Wang, C.Y.; Cui, C.Y.; Lu, J.Z.; Lu, Y.F. Effects of coverage layer on the electrochemical corrosion behaviour of Mg-Al-Mn alloy subjected to massive laser shock peening treatment. J. Alloys Compd. 2019, 782, 1058–1075. [Google Scholar] [CrossRef]
- Wang, C.; Luo, K.; Cai, J.; Lu, J. Obvious improvement in electrochemical and long-term immersion corrosion resistance of AISI 420 martensitic stainless steel using laser shock peening. Corros. Sci. 2022, 209, 110688. [Google Scholar] [CrossRef]
- Cao, Y.; Zhu, P.; Shi, W.; Hua, G.; Wang, H.; Qiu, M. Correlation between X-ray diffraction pattern and microstructure of surface of E690 high-strength steel induced by laser-shock processing. Vacuum 2021, 195, 110595. [Google Scholar] [CrossRef]
- Li, Y.; Fan, J.; Wen, J.; Nie, X.; Zhou, L. Study on the Effects of Multiple Laser Shock Peening Treatments on the Electrochemical Corrosion Performance of Welded 316L Stainless Steel Joints. Metals 2022, 127, 1215. [Google Scholar] [CrossRef]
- Tang, Z.; Dong, X.; Geng, Y.; Wang, K.; Duan, W.; Gao, M.; Mei, X. The effect of warm laser shock peening on the thermal stability of compressive residual stress and the hot corrosion resistance of Ni-based single-crystal superalloy. Opt. Laser Technol. 2022, 146, 107556. [Google Scholar] [CrossRef]
- Zhang, H.; Cai, Z.; Chi, J.; Han, G.; Sun, R.; Che, Z.; Zhang, H.; Guo, W. Microstructural evolution, mechanical behaviors and strengthening mechanism of 300 M steel subjected to multi-pass laser shock peening. Opt. Laser Technol. 2022, 148, 107726. [Google Scholar] [CrossRef]
- Lu, Y.; Zhao, J.; Qiao, H.; Hu, T.; Sun, B.; Wu, J. A study on the surface morphology evolution of the GH4619 using warm laser shock peening. Aip Adv. 2019, 98, 085030. [Google Scholar] [CrossRef] [Green Version]
- Ahn, J.H.; Jeong, Y.S.; Kim, I.T.; Jeon, S.H.; Park, C.H. A Method for Estimating Time-Dependent Corrosion Depth of Carbon and Weathering Steel Using an Atmospheric Corrosion Monitor Sensor. Sensors 2019, 196, 1416. [Google Scholar] [CrossRef] [Green Version]
- Zhang, H.; Yan, L.; Zhu, Y.; Ai, F.; Li, H.; Li, Y.; Jiang, Z. The Effect of Immersion Corrosion Time on Electrochemical Corrosion Behavior and the Corrosion Mechanism of EH47 Ship Steel in Seawater. Metals 2021, 118, 1317. [Google Scholar] [CrossRef]
- Cao, A.; Yin, B.; Li, W.; Wang, G. Study on Stress Corrosion Properties of 1Cr17Ni2 Stainless Steel. Adv. Mater. Sci. Eng. 2022, 2022, 2435238. [Google Scholar] [CrossRef]
- Laura, B.D.; Emanuela, H.E.; Mihaela, C.A.; Mariana, B.; Constantin, T.; Nicoleta, B.; Viorica, G. Investigation of Corrosion of A and E36 Naval Steels Using Potentiodynamic Polarization and Modified Prohesion Test. Int. J. Electrochem. Sci. 2021, 1611, 21111. [Google Scholar] [CrossRef]
- Yang, X.K.; Zhang, L.W.; Zhang, S.Y.; Liu, M.; Zhou, K.; Mu, X.L. Properties degradation and atmospheric corrosion mechanism of 6061 aluminum alloy in industrial and marine atmosphere environments. Mater. Corros. 2017, 685, 529–535. [Google Scholar] [CrossRef]
- Świetlicki, A.; Szala, M.; Walczak, M. Effects of Shot Peening and Cavitation Peening on Properties of Surface Layer of Metallic Materials—A Short Review. Materials 2022, 15, 2476. [Google Scholar] [CrossRef] [PubMed]
- Walczak, M.; Szala, M.; Okuniewski, W. Assessment of Corrosion Resistance and Hardness of Shot Peened X5CrNi18-10 Steel. Materials 2022, 15, 9000. [Google Scholar] [CrossRef]
- Xiang, L.; Tao, J.; Xia, X.; Zhao, Z.; Chen, Q.; Su, Y.; Chai, S.; Zheng, Z.; Sun, J. Impact of Marine Atmospheric Corrosion on the Microstructure and Tensile Properties of 7075 High-Strength Aluminum Alloy. Materials 2023, 16, 2396. [Google Scholar] [CrossRef] [PubMed]
- Chukwuike, V.I.; Echem, O.G.; Prabhakaran, S.; AnandKumar, S.; Barik, R.C. Laser shock peening (LSP): Electrochemical and hydrodynamic investigation of corrosion protection pre-treatment for a copper surface in 3.5% NaCl medium. Corros. Sci. 2021, 179, 109156. [Google Scholar]
- Arya, S.B.; Bhattacharjee, A.; Roy, M. Electrochemical corrosion behavior of Ti-10V-2Fe-3Al in different corrosive media. Mater. Corros. 2018, 689, 1025–1038. [Google Scholar] [CrossRef]


| Element | C | Si | Mn | P | S | Cr | Ni | Mo | V | Fe |
|---|---|---|---|---|---|---|---|---|---|---|
| matrix | 0.15 | 0.50 | 1.52 | 0.03 | 0.01 | 1.50 | 3.60 | 0.70 | 0.06 | Bal. |
| powder | 0.15 | 0.29 | 1.35 | 0.03 | 0.01 | 0.16 | 0.24 | 0.15 | 0.06 | Bal. |
| Sample Number | Sample 1 | Sample 2 | Sample 3 | Sample 4 | Sample 5 |
|---|---|---|---|---|---|
| Corrosive area | E690 | cladding layer | cladding layer | cladding layer | cladding layer |
| Laser shock peening power density | untreated | untreated | 4.77 GW/cm2 | 7.96 GW/cm2 | 11.15 GW/cm2 |
| Samples | Microhardness/HV | Average Microhardness/HV | ||||
|---|---|---|---|---|---|---|
| Sample1 | 286.7 | 292.6 | 281.9 | 284.1 | 294.6 | 288.0 |
| Sample2 | 270.9 | 279.6 | 275.4 | 266.7 | 271.5 | 272.8 |
| Sample3 | 297.8 | 288.9 | 296.5 | 294.7 | 293.6 | 294.3 |
| Sample4 | 300.6 | 298.7 | 305.4 | 309.6 | 301.6 | 303.2 |
| Sample5 | 308.9 | 312.6 | 311.6 | 312.4 | 309.8 | 311.1 |
| Sample | Ecorr/V | Jcorr/(μA∙cm2) | Epass/V | Ipass/(μA∙cm2) |
|---|---|---|---|---|
| E690 | −0.810 | 0.089 | −0.62 ± 0.15 | 0.84 ± 0.12 |
| Cladding layer | −1.004 | 114.5 | −0.83 ± 0.10 | 248.6 ± 82.2 |
| 4.77 GW/cm2 | −0.897 | 8.14 | −0.76 ± 0.12 | 24.82 ± 6.20 |
| 7.96 GW/cm2 | −0.825 | 6.61 | −0.71 ± 0.15 | 18.95 ± 3.36 |
| 11.15 GW/cm2 | −0.771 | 5.41 | −0.60 ± 0.16 | 15.58 ± 2.69 |
Disclaimer/Publisher’s Note: The statements, opinions and data contained in all publications are solely those of the individual author(s) and contributor(s) and not of MDPI and/or the editor(s). MDPI and/or the editor(s) disclaim responsibility for any injury to people or property resulting from any ideas, methods, instructions or products referred to in the content. |
© 2023 by the authors. Licensee MDPI, Basel, Switzerland. This article is an open access article distributed under the terms and conditions of the Creative Commons Attribution (CC BY) license (https://creativecommons.org/licenses/by/4.0/).
Share and Cite
Qin, J.; Cao, Y.; Shi, W.; Wang, Z.; Qiu, M. Laser Shock Peening Improves the Corrosion Resistance of an E690 High-Strength Steel Cladding Layer. Materials 2023, 16, 5566. https://doi.org/10.3390/ma16165566
Qin J, Cao Y, Shi W, Wang Z, Qiu M. Laser Shock Peening Improves the Corrosion Resistance of an E690 High-Strength Steel Cladding Layer. Materials. 2023; 16(16):5566. https://doi.org/10.3390/ma16165566
Chicago/Turabian StyleQin, Jiaxin, Yupeng Cao, Weidong Shi, Zhengang Wang, and Ming Qiu. 2023. "Laser Shock Peening Improves the Corrosion Resistance of an E690 High-Strength Steel Cladding Layer" Materials 16, no. 16: 5566. https://doi.org/10.3390/ma16165566
APA StyleQin, J., Cao, Y., Shi, W., Wang, Z., & Qiu, M. (2023). Laser Shock Peening Improves the Corrosion Resistance of an E690 High-Strength Steel Cladding Layer. Materials, 16(16), 5566. https://doi.org/10.3390/ma16165566