
FEM Simulation of AlSi10Mg Artifact for Additive Manufacturing Process Calibration with Industrial-Computed Tomography Validation

 ,
,  , , , ,
  and
and
Abstract
1. Introduction
2. Materials and Methods
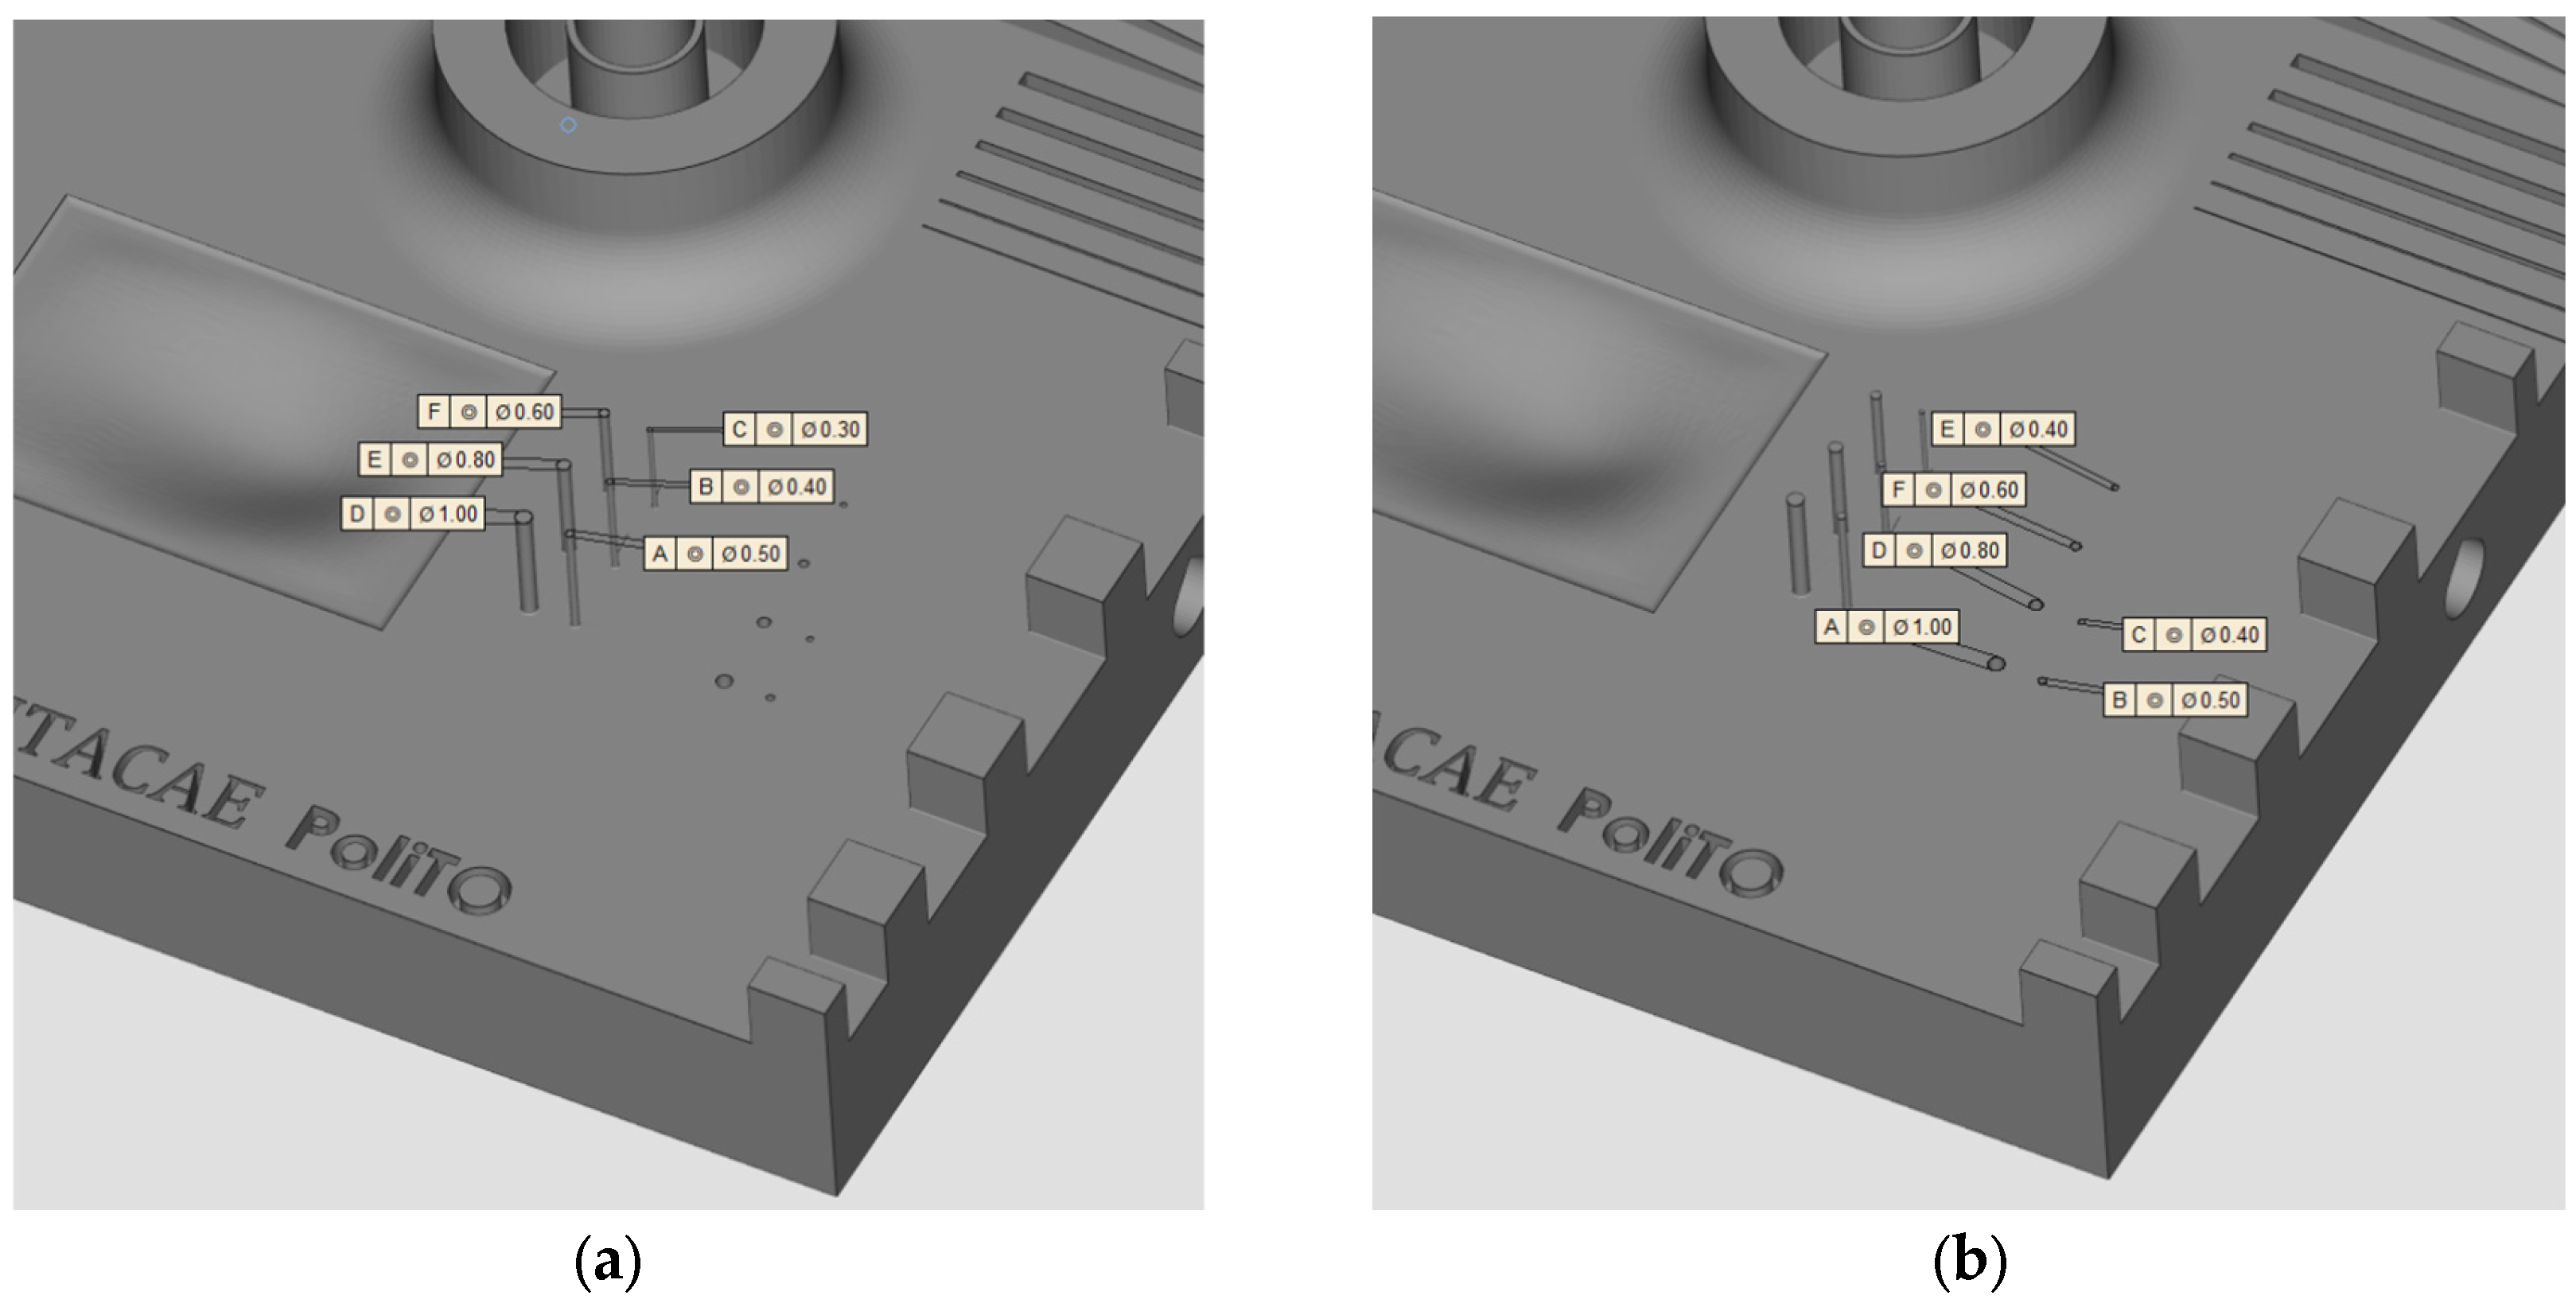
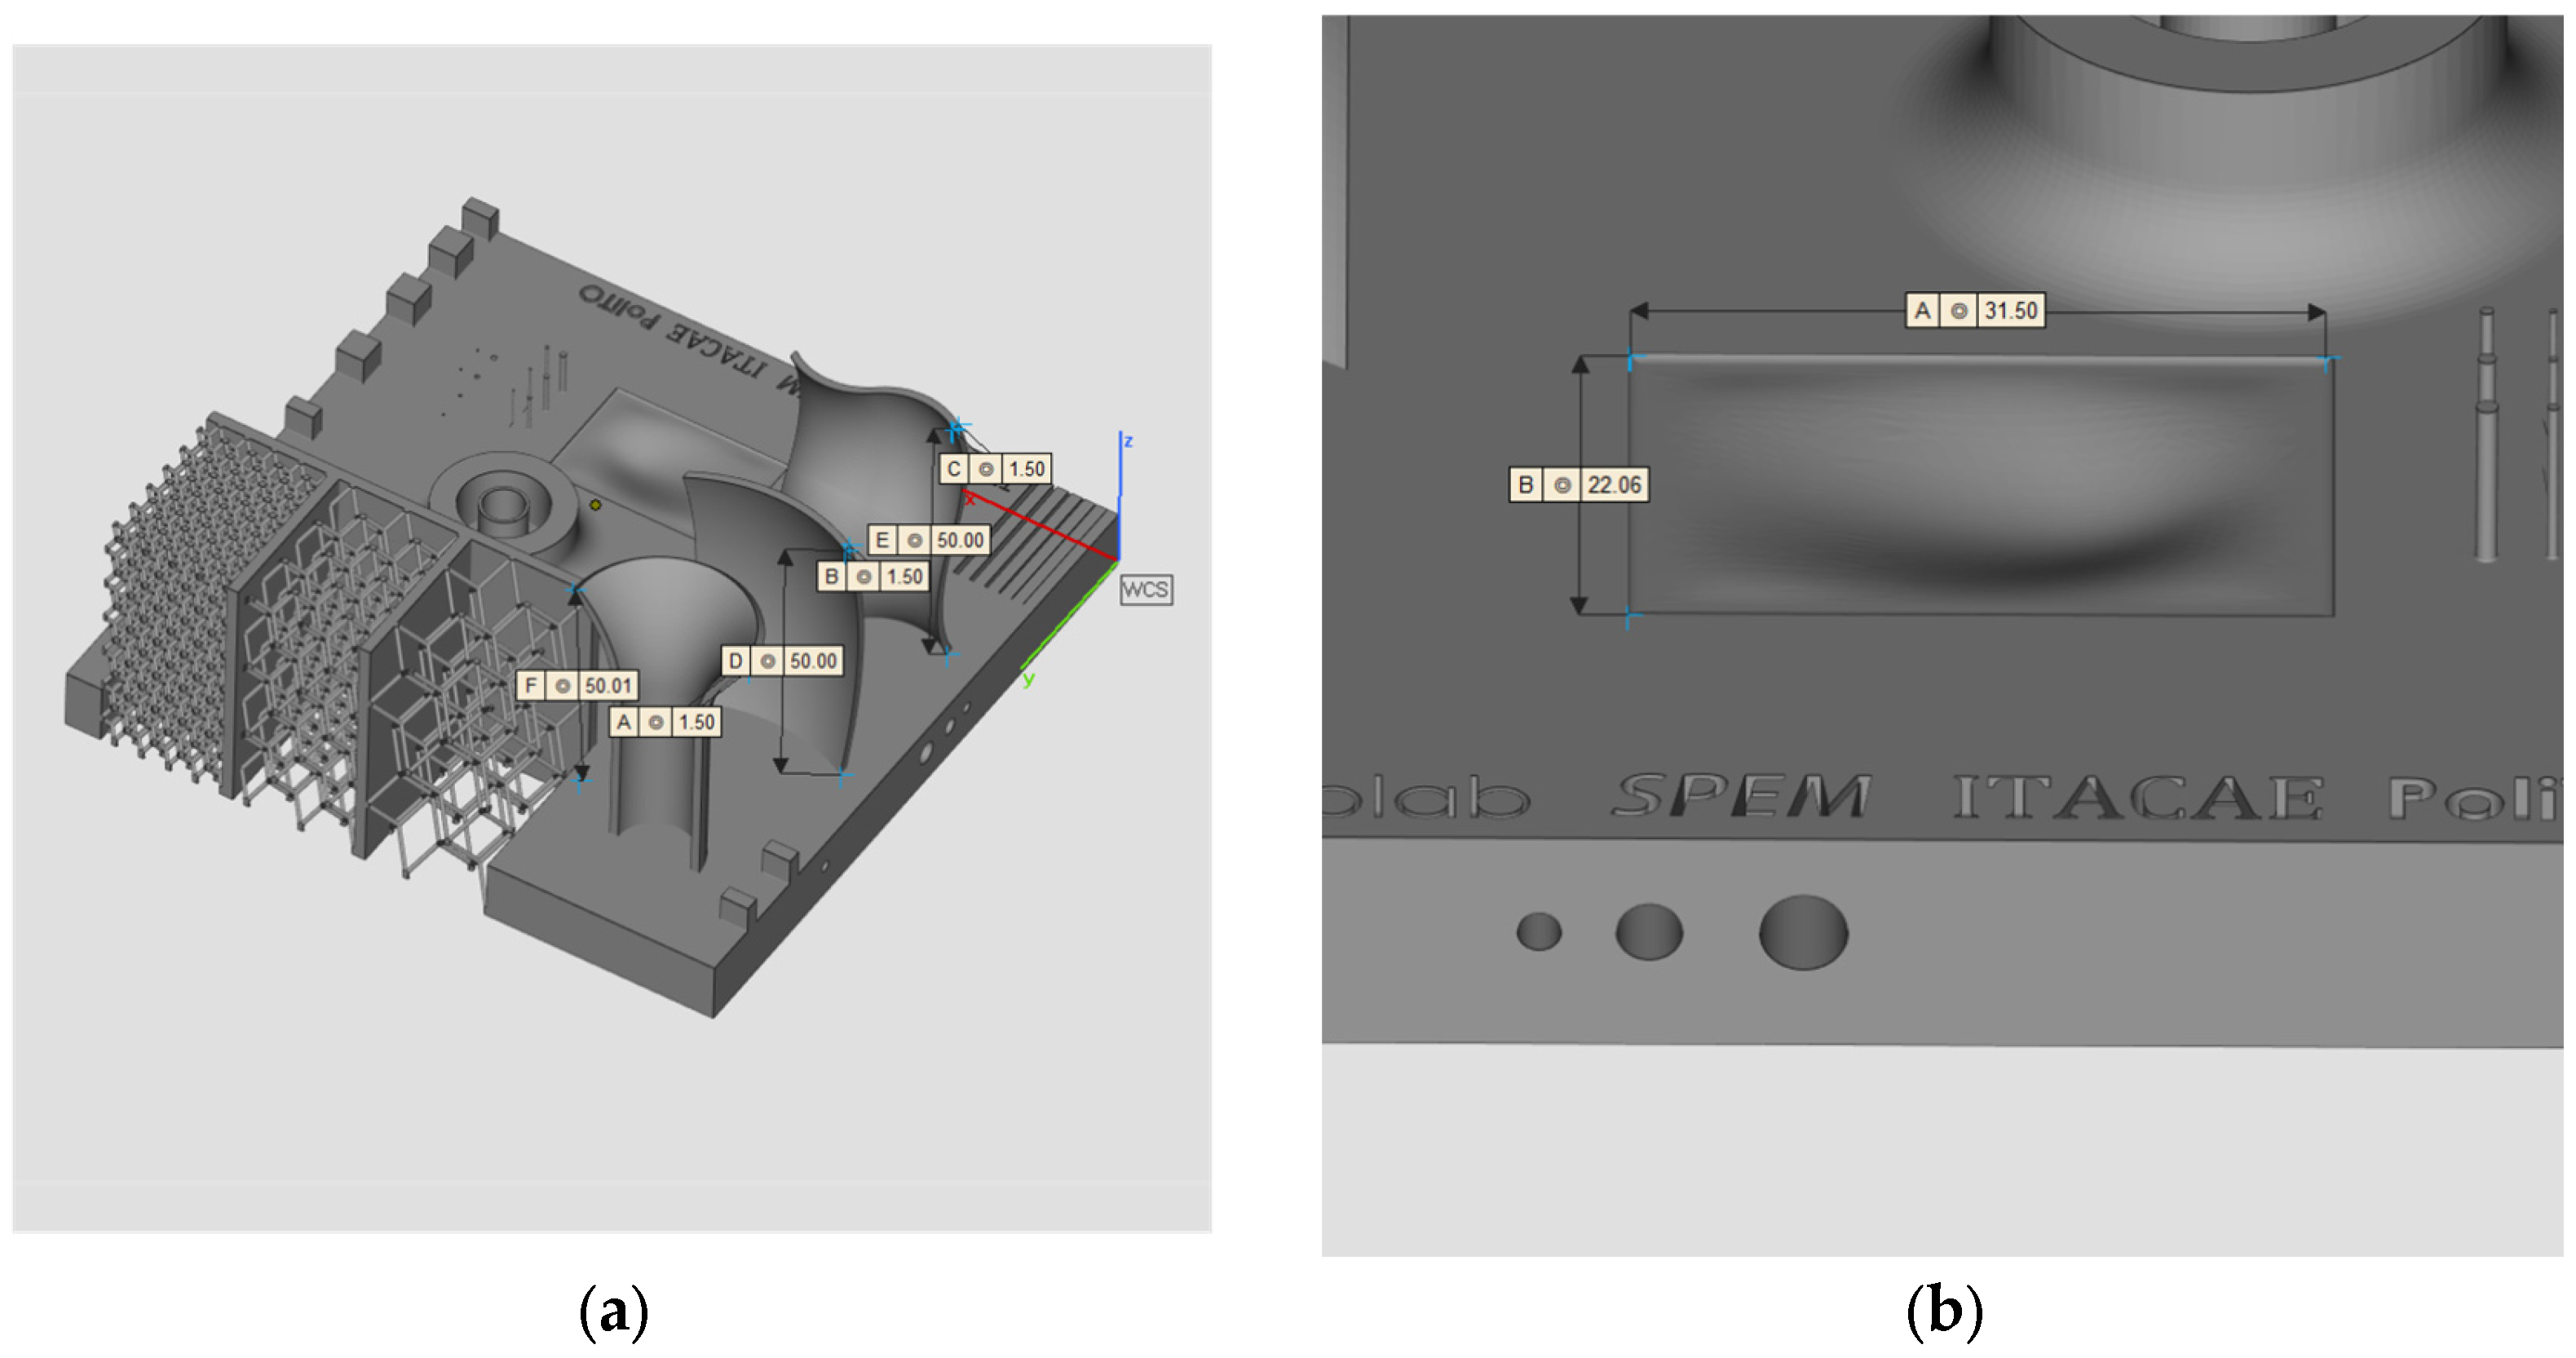
2.1. Geometry and Production
2.2. Thermal and Mechanical Analysis
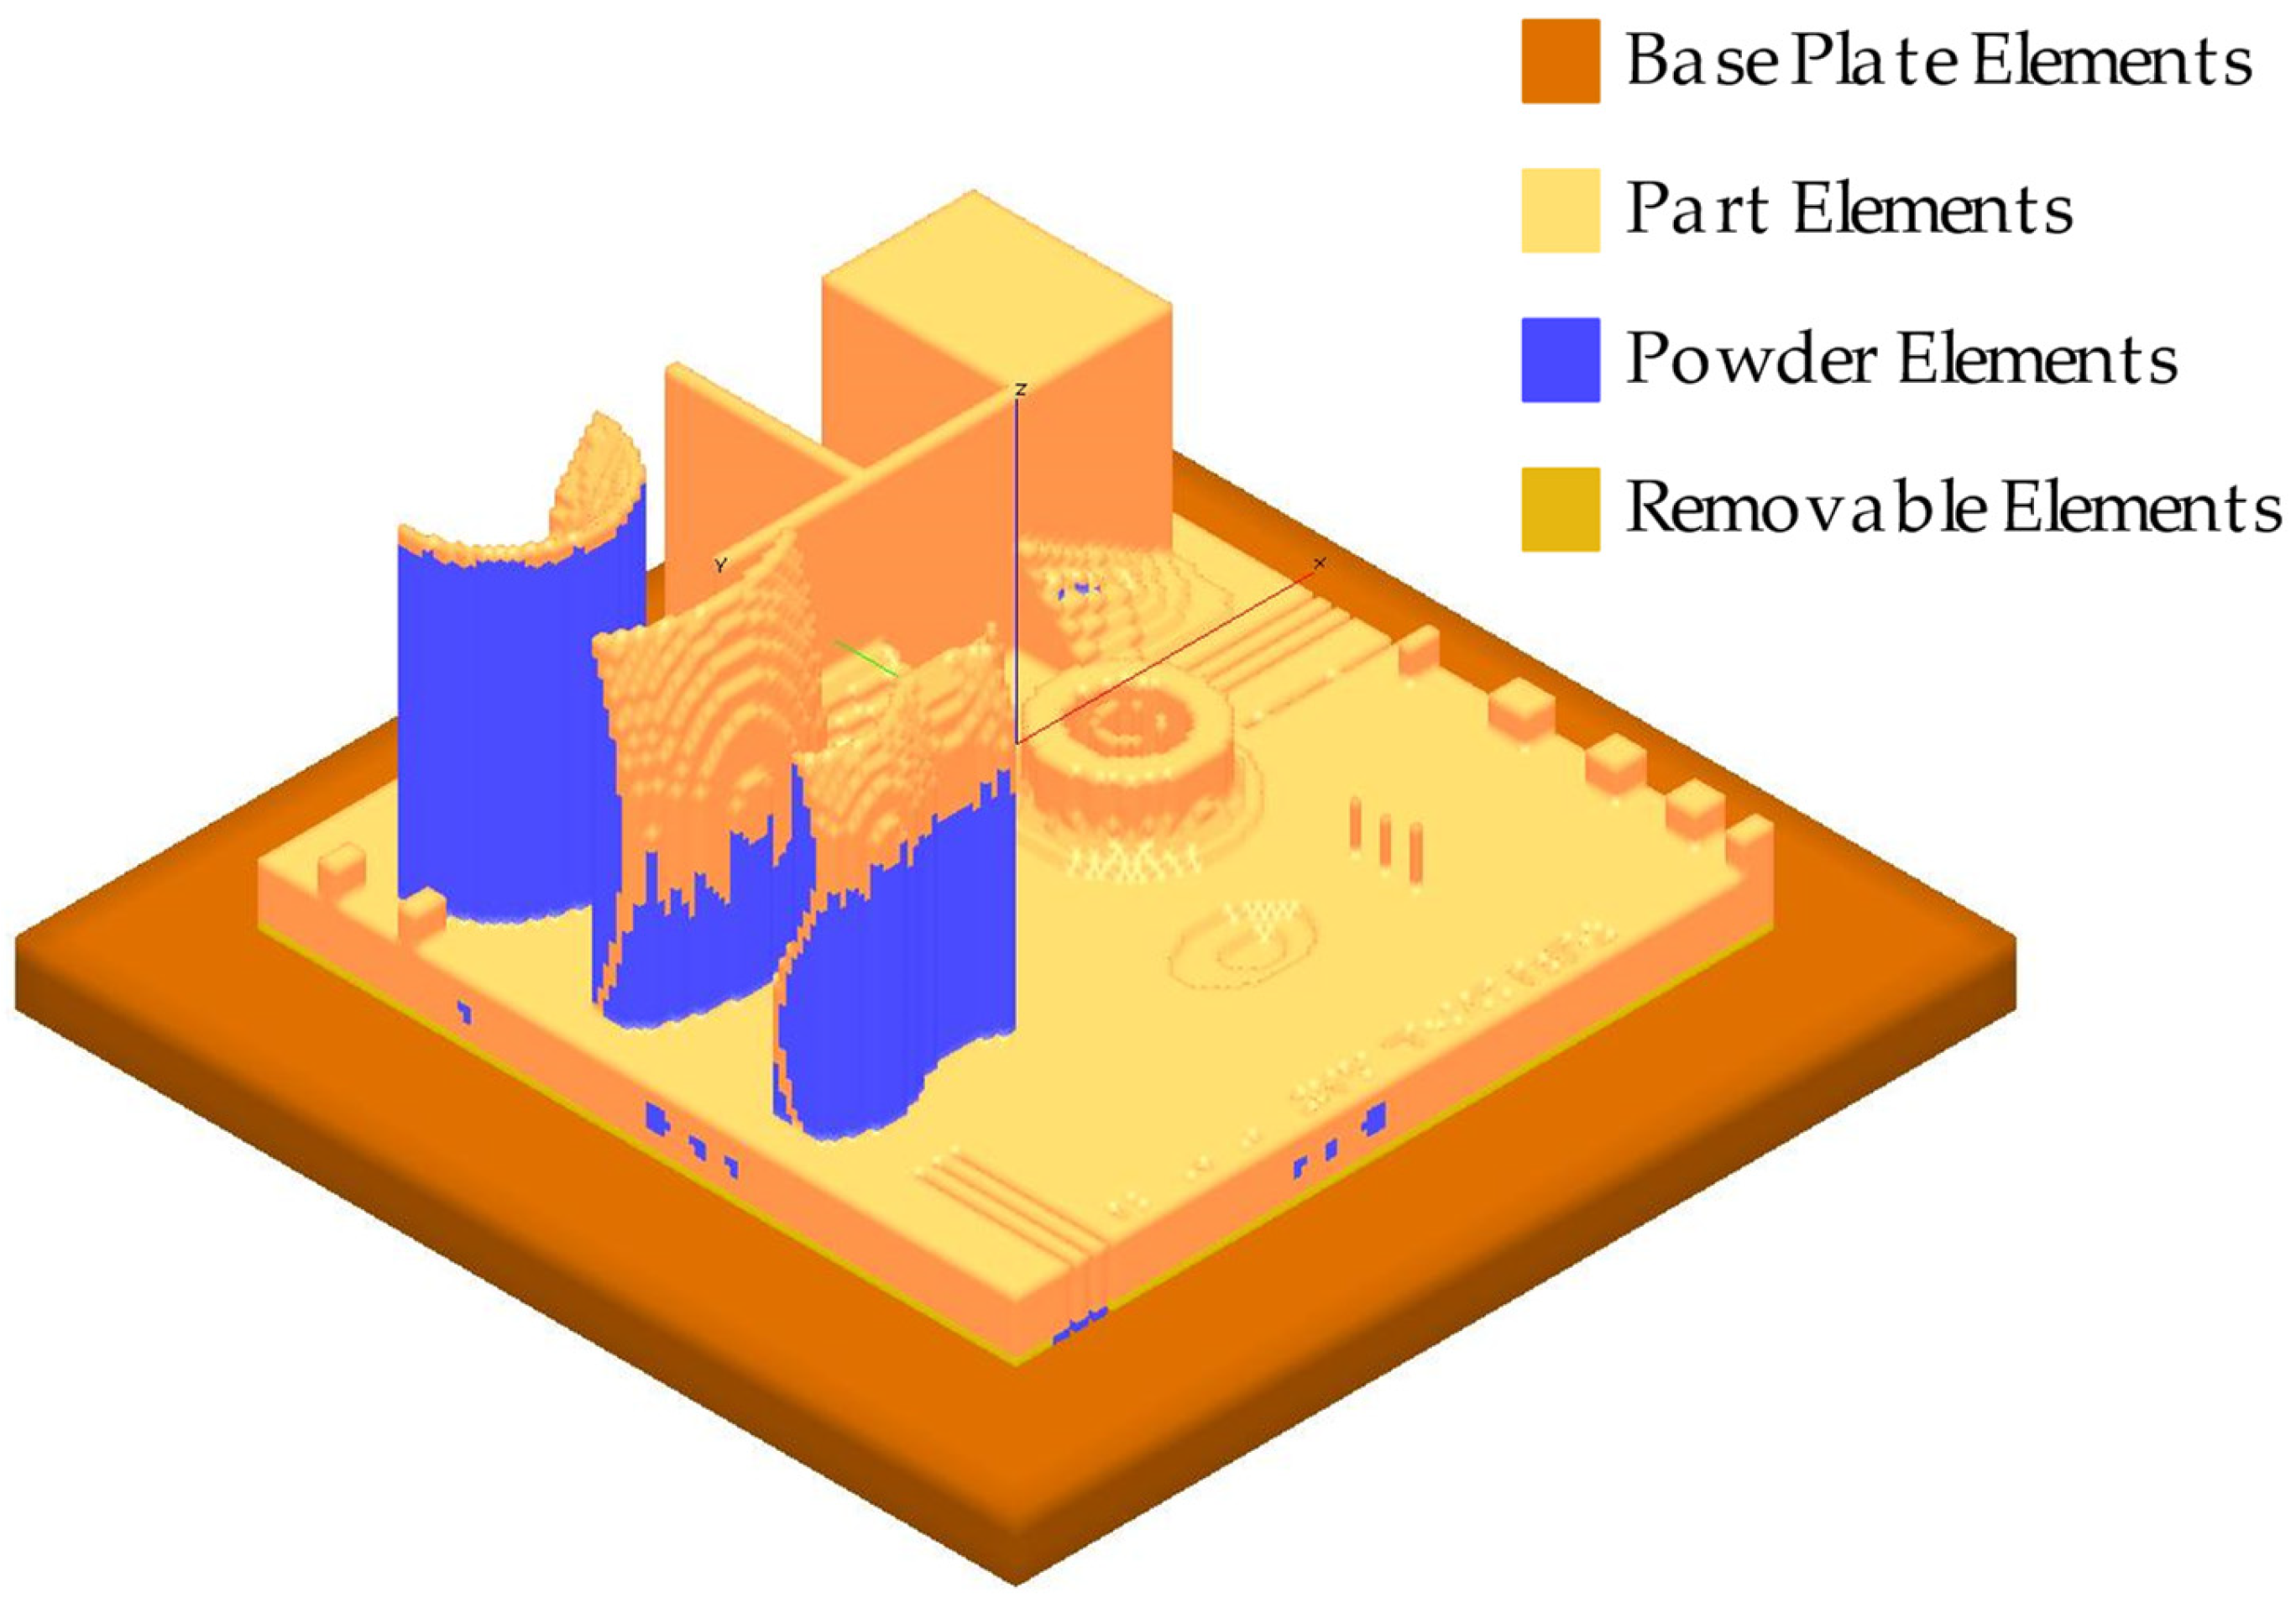
2.3. Numerical Implementation
2.4. Industrial Computed Tomography
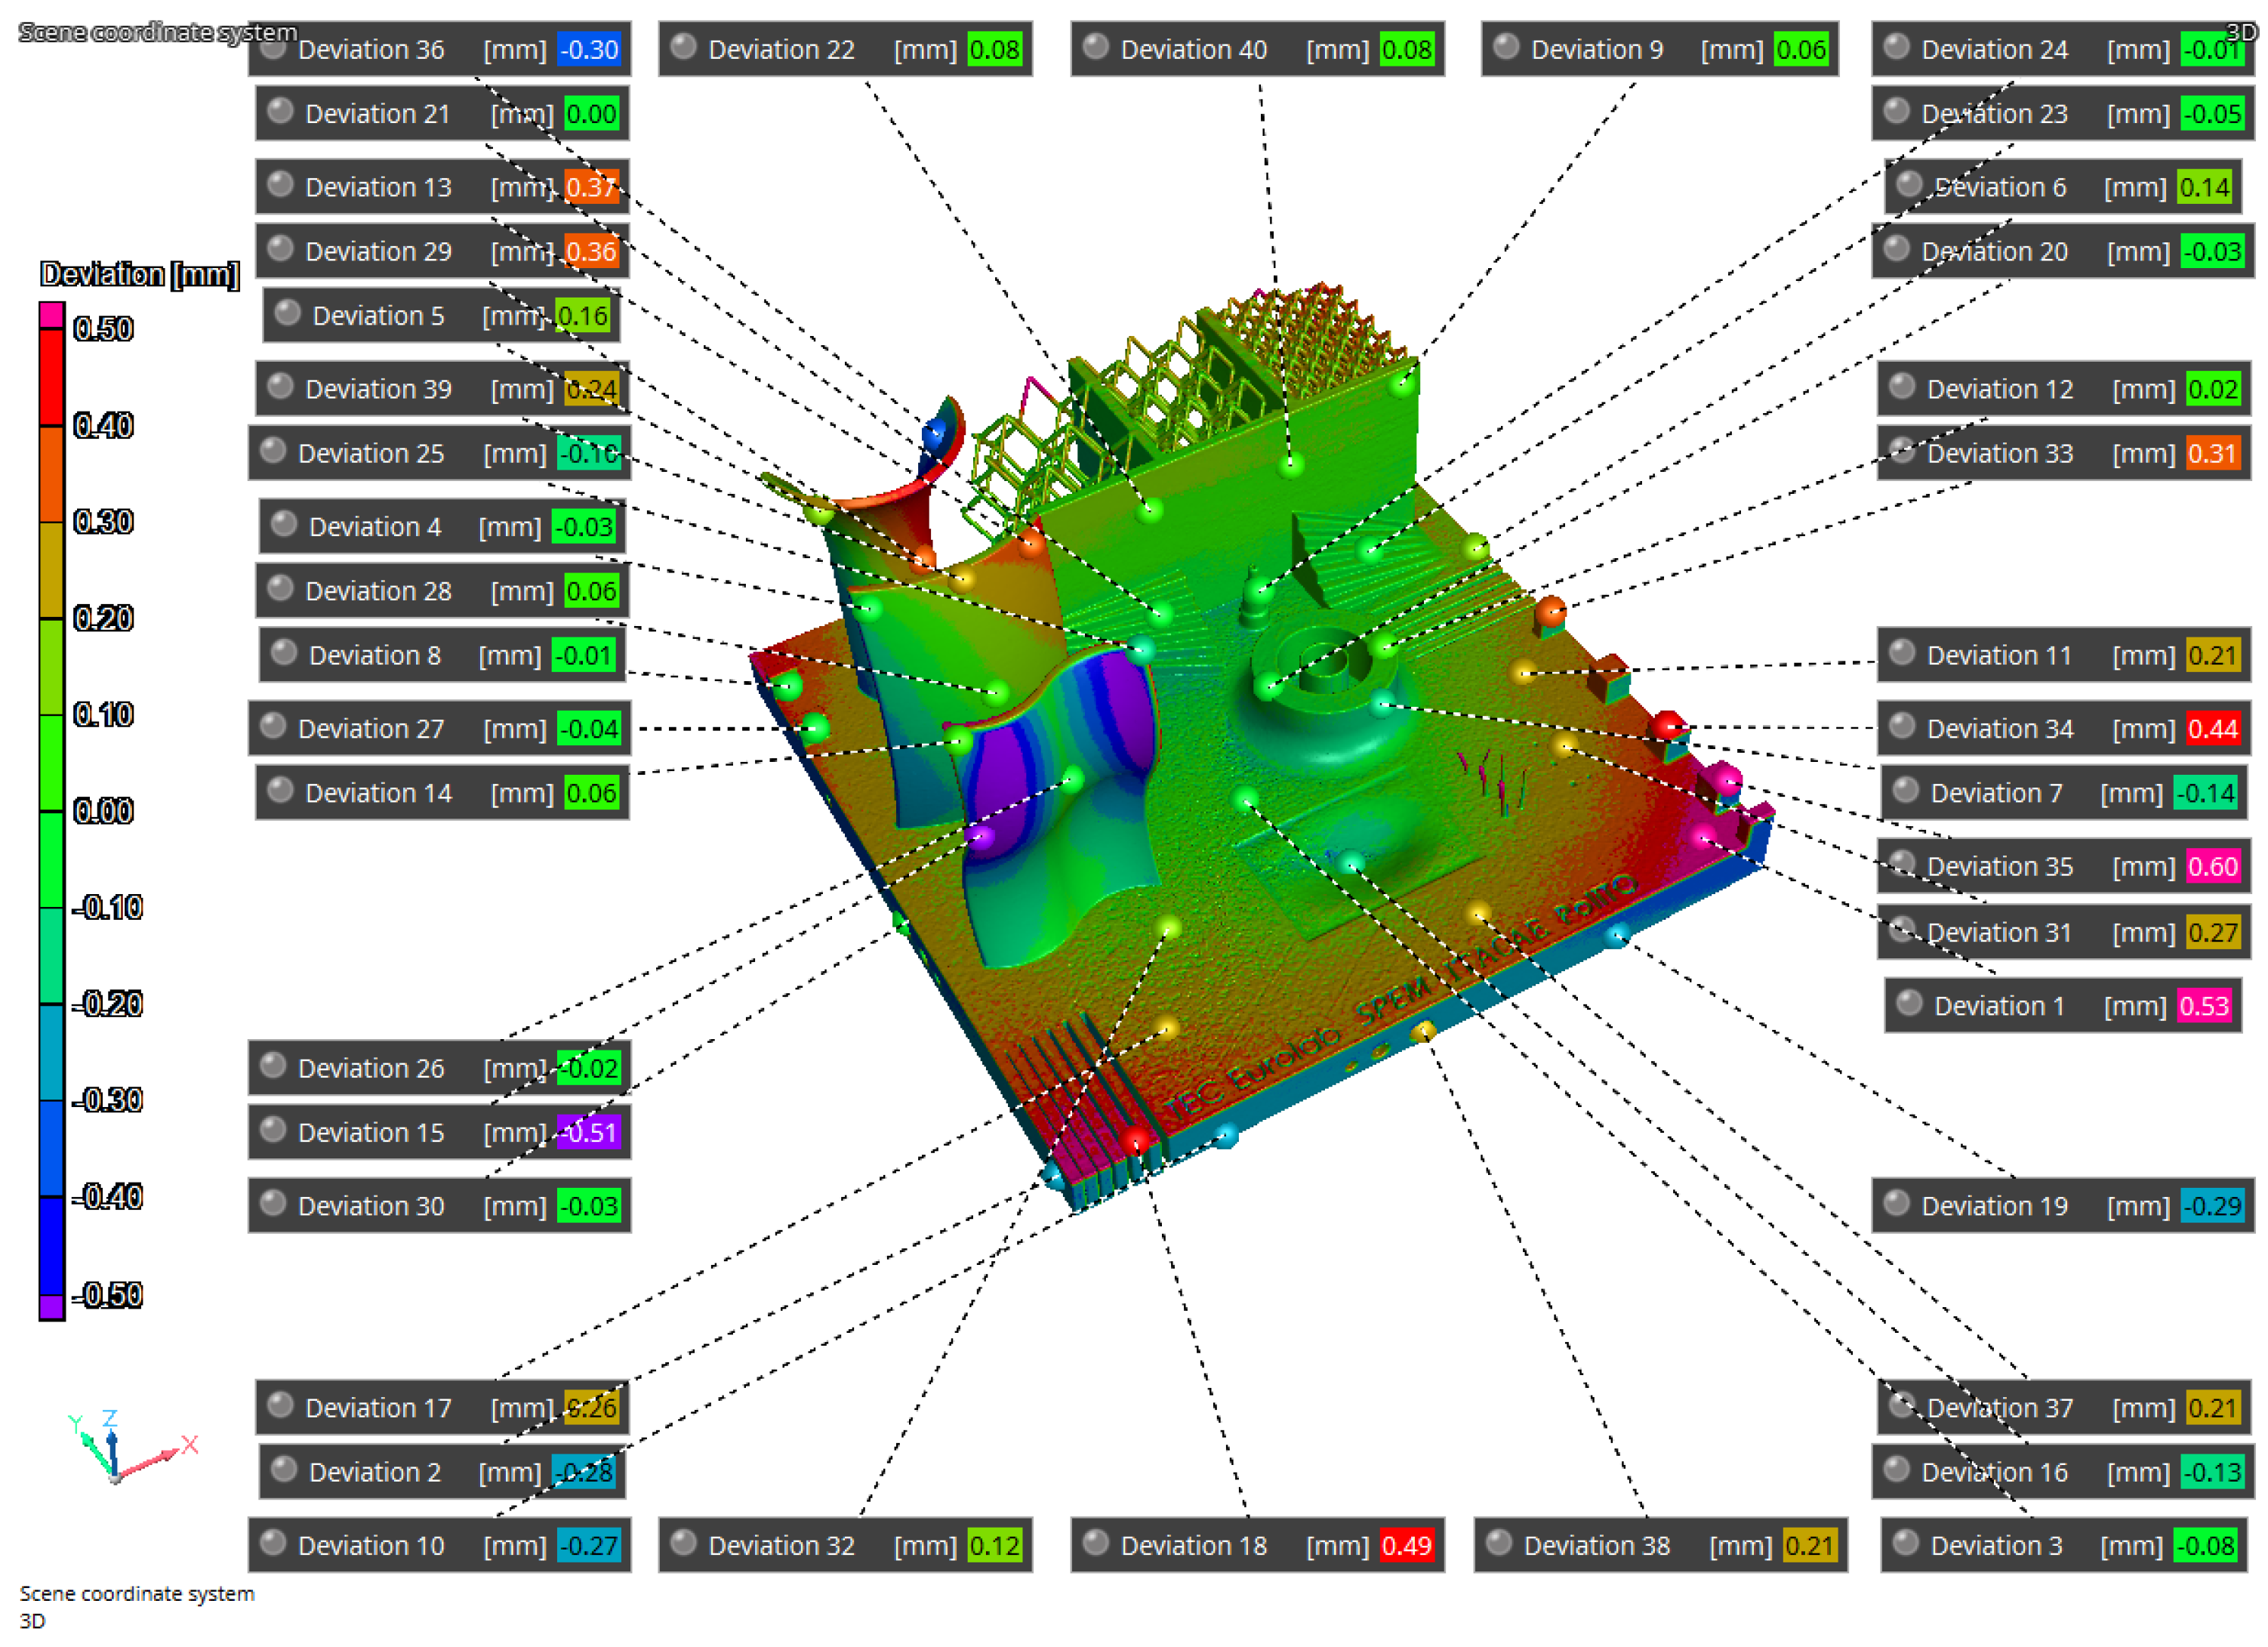
3. Results and Discussion
4. Conclusions
Author Contributions
Funding
Institutional Review Board Statement
Informed Consent Statement
Data Availability Statement
Acknowledgments
Conflicts of Interest
References
- Nagesha, B.K.; Dhinakaran, V.; Shree, M.V.; Kumar, K.M.; Chalawadi, D.; Sathish, T.J. Review on characterization and impacts of the lattice structure in additive manufacturing. Mater. Today Proc. 2020, 21, 916–919. [Google Scholar] [CrossRef]
- Radaj, D. Heat Effects of Welding: Temperature Field, Residual Stress, Distortion; Springer: Berlin, Germany, 1992. [Google Scholar]
- Servetti, G.; Zhang, X. Predicting fatigue crack growth rate in a welded butt joint: The role of effective R ratio in accounting for residual stress effect. Eng. Fract. Mech. 2009, 76, 1589–1602. [Google Scholar] [CrossRef]
- Frazier, W.E. Metal Additive Manufacturing: A Review. J. Mater. Eng. Perform. 2014, 23, 1917–1928. [Google Scholar] [CrossRef]
- Duriagina, Z.A.; Lemishka, I.A.; Trostianchyn, A.M.; Kulyk, V.V.; Shvachko, S.G.; Tepla, T.L.; Pleshakov, E.I.; Kovbasyuk, T.M. The Effect of Morphology and Particle-Size Distribution of VT20 Titanium Alloy Powders on the Mechanical Properties of Deposited Coatings. Powder Metall. Met. Ceram. 2019, 57, 697–702. [Google Scholar] [CrossRef]
- Demir, A.G.; Previtali, B. Investigation of remelting and preheating in SLM of 18Ni300 maraging steel as corrective and preventive measures for porosity reduction. Int. J. Adv. Manuf. Technol. 2017, 93, 2697–2709. [Google Scholar] [CrossRef]
- Shah, P.; Racasan, R.; Bills, P. Comparison of different additive manufacturing methods using computed tomography. Case Stud. Nondestruct. Test. Eval. 2016, 6, 69–78. [Google Scholar] [CrossRef]
- Bikas, H.; Stavropoulos, P.; Chryssolouris, G. Additive manufacturing methods and modelling approaches: A critical review. Int. J. Adv. Manuf. Technol. 2016, 83, 389–405. [Google Scholar] [CrossRef]
- Jiang, H.-J.; Dai, H.-L. Effect of laser processing on three dimensional thermodynamic analysis for HSLA rectangular steel plates. Int. J. Heat Mass Transf. 2015, 82, 98–108. [Google Scholar] [CrossRef]
- Gaikwad, A.; Williams, R.J.; de Winton, H.; Bevans, B.D.; Smoqi, Z.; Rao, P.; Hooper, P.A. Multi phenomena melt pool sensor data fusion for enhanced process monitoring of laser powder bed fusion additive manufacturing. Mater. Des. 2022, 221, 110919. [Google Scholar] [CrossRef]
- Oliveira, J.P.; LaLonde, A.D.; Ma, J. Processing parameters in laser powder bed fusion metal additive manufacturing. Mater. Des. 2020, 193, 108762. [Google Scholar] [CrossRef]
- Mohr, G.; Altenburg, S.J.; Hilgenberg, K. Effects of inter layer time and build height on resulting properties of 316L stainless steel processed by laser powder bed fusion. Addit. Manuf. 2020, 32, 101080. [Google Scholar] [CrossRef]
- Wang, X.; Keya, T.; Chou, K. Build Height Effect on the Inconel 718 Parts Fabricated by Selective Laser Melting. Procedia Manuf. 2016, 5, 1006–1017. [Google Scholar] [CrossRef]
- Pantawane, M.V.; Ho, Y.-H.; Joshi, S.S.; Dahotre, N.B. Computational Assessment of Thermokinetics and Associated Microstructural Evolution in Laser Powder Bed Fusion Manufacturing of Ti6Al4V Alloy. Sci. Rep. 2020, 10, 7579. [Google Scholar] [CrossRef] [PubMed]
- Roberts, I.A.; Wang, C.J.; Esterlein, R.; Stanford, M.; Mynors, D.J. A three-dimensional finite element analysis of the temperature field during laser melting of metal powders in additive layer manufacturing. Int. J. Mach. Tools Manuf. 2009, 49, 916–923. [Google Scholar] [CrossRef]
- Cooper, K.; Steele, P.; Cheng, B.; Chou, K. Contact-Free Support Structures for Part Overhangs in Powder-Bed Metal Additive Manufacturing. Inventions 2017, 3, 2. [Google Scholar] [CrossRef]
- Li, C.; Gouge, M.F.; Denlinger, E.R.; Irwin, J.E.; Michaleris, P. Estimation of part-to-powder heat losses as surface convection in laser powder bed fusion. Addit. Manuf. 2019, 26, 258–269. [Google Scholar]
- Bruna-Rosso, C.; Demir, A.G.; Previtali, B. Selective laser melting finite element modeling: Validation with high-speed imaging and lack of fusion defects prediction. Mater. Des. 2018, 156, 143–153. [Google Scholar] [CrossRef]
- Huang, Y.; Yang, L.J.; Du, X.Z.; Yang, Y.P. Finite element analysis of thermal behavior of metal powder during selective laser melting. Int. J. Therm. Sci. 2016, 104, 146–157. [Google Scholar] [CrossRef]
- Luo, Z.; Zhao, Y. Efficient thermal finite element modeling of selective laser melting of Inconel 718. Comput. Mech. 2020, 65, 763–787. [Google Scholar] [CrossRef]
- Geng, R.; Du, J.; Wei, Z.; Xu, S.; Ma, N. Modelling and experimental observation of the deposition geometry and microstructure evolution of aluminum alloy fabricated by wire-arc additive manufacturing. J. Manuf. Process. 2021, 64, 369–378. [Google Scholar] [CrossRef]
- Cattenone, A.; Morganti, S.; Alaimo, G.; Auricchio, F. Finite Element Analysis of Additive Manufacturing Based on Fused Deposition Modeling: Distortions Prediction and Comparison with Experimental Data. J. Manuf. Sci. Eng. 2019, 141, 011010. [Google Scholar] [CrossRef]
- Stender, M.E.; Beghini, L.L.; Veilleux, M.G.; Subia, S.R.; Sugar, J.D. Thermal Mechanical Finite Element Simulation of Additive Manufacturing: Process Modeling of the Lens Process. In Pressure Vessels and Piping Conference; American Society of Mechanical Engineers: Waikoloa, HI, USA, 2017; Volume 6A, p. V06AT06A022. [Google Scholar]
- Montevecchi, F.; Venturini, G.; Scippa, A.; Campatelli, G. Finite Element Modelling of Wire-arc-additive-manufacturing Process. Procedia CIRP 2016, 55, 109–114. [Google Scholar] [CrossRef]
- Song, X.; Feih, S.; Zhai, W.; Sun, C.-N.; Li, F.; Maiti, R.; Wei, J.; Yang, Y.; Oancea, V.; Brandt, L.R.; et al. Advances in additive manufacturing process simulation: Residual stresses and distortion predictions in complex metallic components. Mater. Des. 2020, 193, 108779. [Google Scholar] [CrossRef]
- Van Belle, L.; Vansteenkiste, G.; Boyer, J.C. Comparisons of Numerical Modelling of the Selective Laser Melting. In Key Engineering Materials; Trans Tech Publications Ltd.: Bäch, Switzerland, 2012; Volume 504, pp. 1067–1072. [Google Scholar]
- Price, S.; Cheng, B.; Lydon, J.; Cooper, K.; Chou, K. On Process Temperature in Powder-Bed Electron Beam Additive Manufacturing: Process Parameter Effects. J. Manuf. Sci. Eng. 2014, 136, 061019. [Google Scholar] [CrossRef]
- Hodge, N.E.; Ferencz, R.M.; Vignes, R.M. Experimental comparison of residual stresses for a thermomechanical model for the simulation of selective laser melting. Addit. Manuf. 2016, 12, 159–168. [Google Scholar] [CrossRef]
- Wu, A.S.; Brown, D.W.; Kumar, M.; Gallegos, G.F.; King, W.E. An Experimental Investigation into Additive Manufacturing-Induced Residual Stresses in 316L Stainless Steel. Metall. Mater. Trans. A 2014, 45, 6260–6270. [Google Scholar] [CrossRef]
- Zaeh, M.F.; Branner, G. Investigations on residual stresses and deformations in selective laser melting. Prod. Eng. 2010, 4, 35–45. [Google Scholar] [CrossRef]
- Papadakis, L.; Loizou, A.; Risse, J.; Schrage, J. Numerical Computation of Component Shape Distortion Manufactured by Selective Laser Melting. Procedia CIRP 2014, 18, 90–95. [Google Scholar] [CrossRef]
- Michaleris, P.; Zhang, L.; Bhide, S.R.; Marugabandhu, P. Evaluation of 2D, 3D and applied plastic strain methods for predicting buckling welding distortion and residual stress. Sci. Technol. Weld. Join. 2006, 11, 707–716. [Google Scholar] [CrossRef]
- Huang, H.; Wang, J.; Li, L.; Ma, N. Prediction of laser welding induced deformation in thin sheets by efficient numerical modeling. J. Mater. Process. Technol. 2016, 227, 117–128. [Google Scholar] [CrossRef]
- Bugatti, M.; Semeraro, Q. Limitations of the inherent strain method in simulating powder bed fusion processes. Addit. Manuf. 2018, 23, 329–346. [Google Scholar] [CrossRef]
- Li, C.; Fu, C.H.; Guo, Y.B.; Fang, F.Z. A multiscale modeling approach for fast prediction of part distortion in selective laser melting. J. Mater. Process. Technol. 2016, 229, 703–712. [Google Scholar] [CrossRef]
- Li, C.; Liu, J.F.; Fang, X.Y.; Guo, Y.B. Efficient predictive model of part distortion and residual stress in selective laser melting. Addit. Manuf. 2017, 17, 157–168. [Google Scholar] [CrossRef]
- Gouge, M.; Denlinger, E.; Irwin, J.; Li, C.; Michaleris, P. Experimental validation of thermo-mechanical part-scale modeling for laser powder bed fusion processes. Addit. Manuf. 2019, 29, 100771. [Google Scholar] [CrossRef]
- ISO/ASTM 52902:2019; Additive Manufacturing—Test Artifacts—Geometric Capability Assessment of Additive Manufacturing Systems. International Organization for Standardization: Geneva, Switzerland, 2019.
- Keller, N.; Neugebauer, F.; Xu, H.; Ploshikhin, V. Thermo-mechanical Simulation of Additive Layer Manufacturing of Titanium Aerospace structures. In Proceedings of the LightMAT Conference, Bremen, Germany, 3–5 September 2013. [Google Scholar]
- Neugebauer, F.; Keller, N.; Xu, H.; Kober, C.; Ploshikhin, V. Simulation of selective laser melting using process specific layer based meshing. In Proc. Fraunhofer Direct Digital Manufacturing Conf. (DDMC 2014); Axel Demmer: Aachen, Germany, 2014. [Google Scholar]
- Chen, L.; Li, H.; Liu, S.; Shen, S.; Zhang, T.; Huang, Y.; Zhang, G.; Zhang, Y.; He, B.; Yang, C. Simulation of surface deformation control during selective laser melting of AlSi10Mg powder using an external magnetic field. AIP Adv. 2019, 9, 045012. [Google Scholar] [CrossRef]
- Zhang, X.; Kang, J.; Rong, Y.; Wu, P.; Feng, T. Effect of Scanning Routes on the Stress and Deformation of Overhang Structures Fabricated by SLM. Materials 2018, 12, 47. [Google Scholar] [CrossRef]
- Esposito, F.; Gatto, A.; Bassoli, E.; Denti, L. A Study on the Use of XCT and FEA to Predict the Elastic Behavior of Additively Manufactured Parts of Cylindrical Geometry. J. Nondestruct. Eval. 2018, 37, 72. [Google Scholar] [CrossRef]


| Property | Value |
|---|---|
| Laser Power | 370 W |
| Platform Temperature | 120 °C |
| Scan Speed | 1300 mm/s |
| Scan Strategy | Stripe of 10 mm |
| N° of contour | 2 |
| Spot (Laser) | 0.11 mm |
| Gas type |
| Process Phase | Simulation Phase |
|---|---|
| Part orientation and placement | AMTOP® V.2.0 can suggest the best orientation strategy. Process parameters need to be assigned and a mesh sensitivity study performed. |
| Layer 1: fusion of the powder for the first layer bundle | The model calculates the temperature of the first bundle of layers. The model requires the temperature field as the initial condition for the FEM solver and the geometry of the first layer bundle |
| Recoating: deposition of the powder for the next layer | Recoating time and cooldown time are considered in this phase |
| Layer 1+n: fusion of the powder for the first layer | At each layer, the calculation provides stress, displacement, and temperature field that depends on the results of the previous layer which are the initial condition of the current one. |
| Cutting from the plate and the supports | The cutting removes elements (supports + plate) that do not belong to the printed part. In this phase, AMTOP® V.2.0 calculates the final distortion. |
| Code | Dimension to Check [mm] | Inspection Results [mm] | %Difference |
|---|---|---|---|
| 1 | \ | \ | \ |
| 2 | 120.00 | 119.59 | 0.34 |
| 3 | 120.00 | 119.66 | 0.28 |
| 4 | 9.80 | 9.70 | 1.02 |
| 5 | 10.00 | 9.86 | 1.4 |
| 6 | Ø6.00 | ND-NA | / |
| 7 | Ø5.00 | Ø5.01 | 0.2 |
| 8 | Ø4.00 | Ø3.95 | 1.25 |
| 9 | Ø3.00 | Ø2.98 | 0.67 |
| 10 | 1.50 | 1.55 | 3.33 |
| 11 | Ø23.50 | 23.68 | 0.77 |
| 12 | 1.50 | 1.54 | 2.67 |
| 13 | Ø7.00 | 6.84 | 2.29 |
| 14 | Ø0.60 | Ø0.68 | 13.3 |
| 15 | Ø0.80 | Ø0.79 | 1.25 |
| 16 | Ø1.00 | Ø0.95 | 5 |
| 17 | Ø0.50 | Ø0.58 | 16 |
| 18 | Ø1.00 | Ø0.88 | 12 |
| 19 | 5.00 | 5.01 | 0.2 |
| 20 | Ø8.00 | Ø7.98 | 0.25 |
| 21 | 1.00 | 0.99 | 1 |
| 22 | 0.80 | 0.77 | 3.75 |
| 23 | 0.60 | 0.58 | 3.33 |
| 24 | 12.50 | 12.99 | 3.92 |
| 25 | 10.00 | 9.89 | 1.1 |
| 26 | 4.90 | 4.86 | 0.82 |
| 27 | 55.00 | 54.93 | 0.127 |
| 28 | 5.00 | 4.99 | 0.2 |
| 29 | 1.00 | 0.93 | 7 |
| 30 | 0.80 | 0.77 | 3.75 |
| 31 | 0.60 | 0.56 | 6.67 |
| 32 | 5.00 | 5.12 | 2.4 |
| 33 | Ø2.00 | 1.78 × 1.60 (elliptic) | 20 |
| 34 | Ø3.00 | 2.84 × 2.58 (elliptic) | 14 |
| 35 | Ø4.00 | 3.80 × 3.31 (elliptic) | 5 |
| 36 | 35.00 | 35.08 | 0.23 |
| 37 | 10.00 | 10.09 | 0.9 |
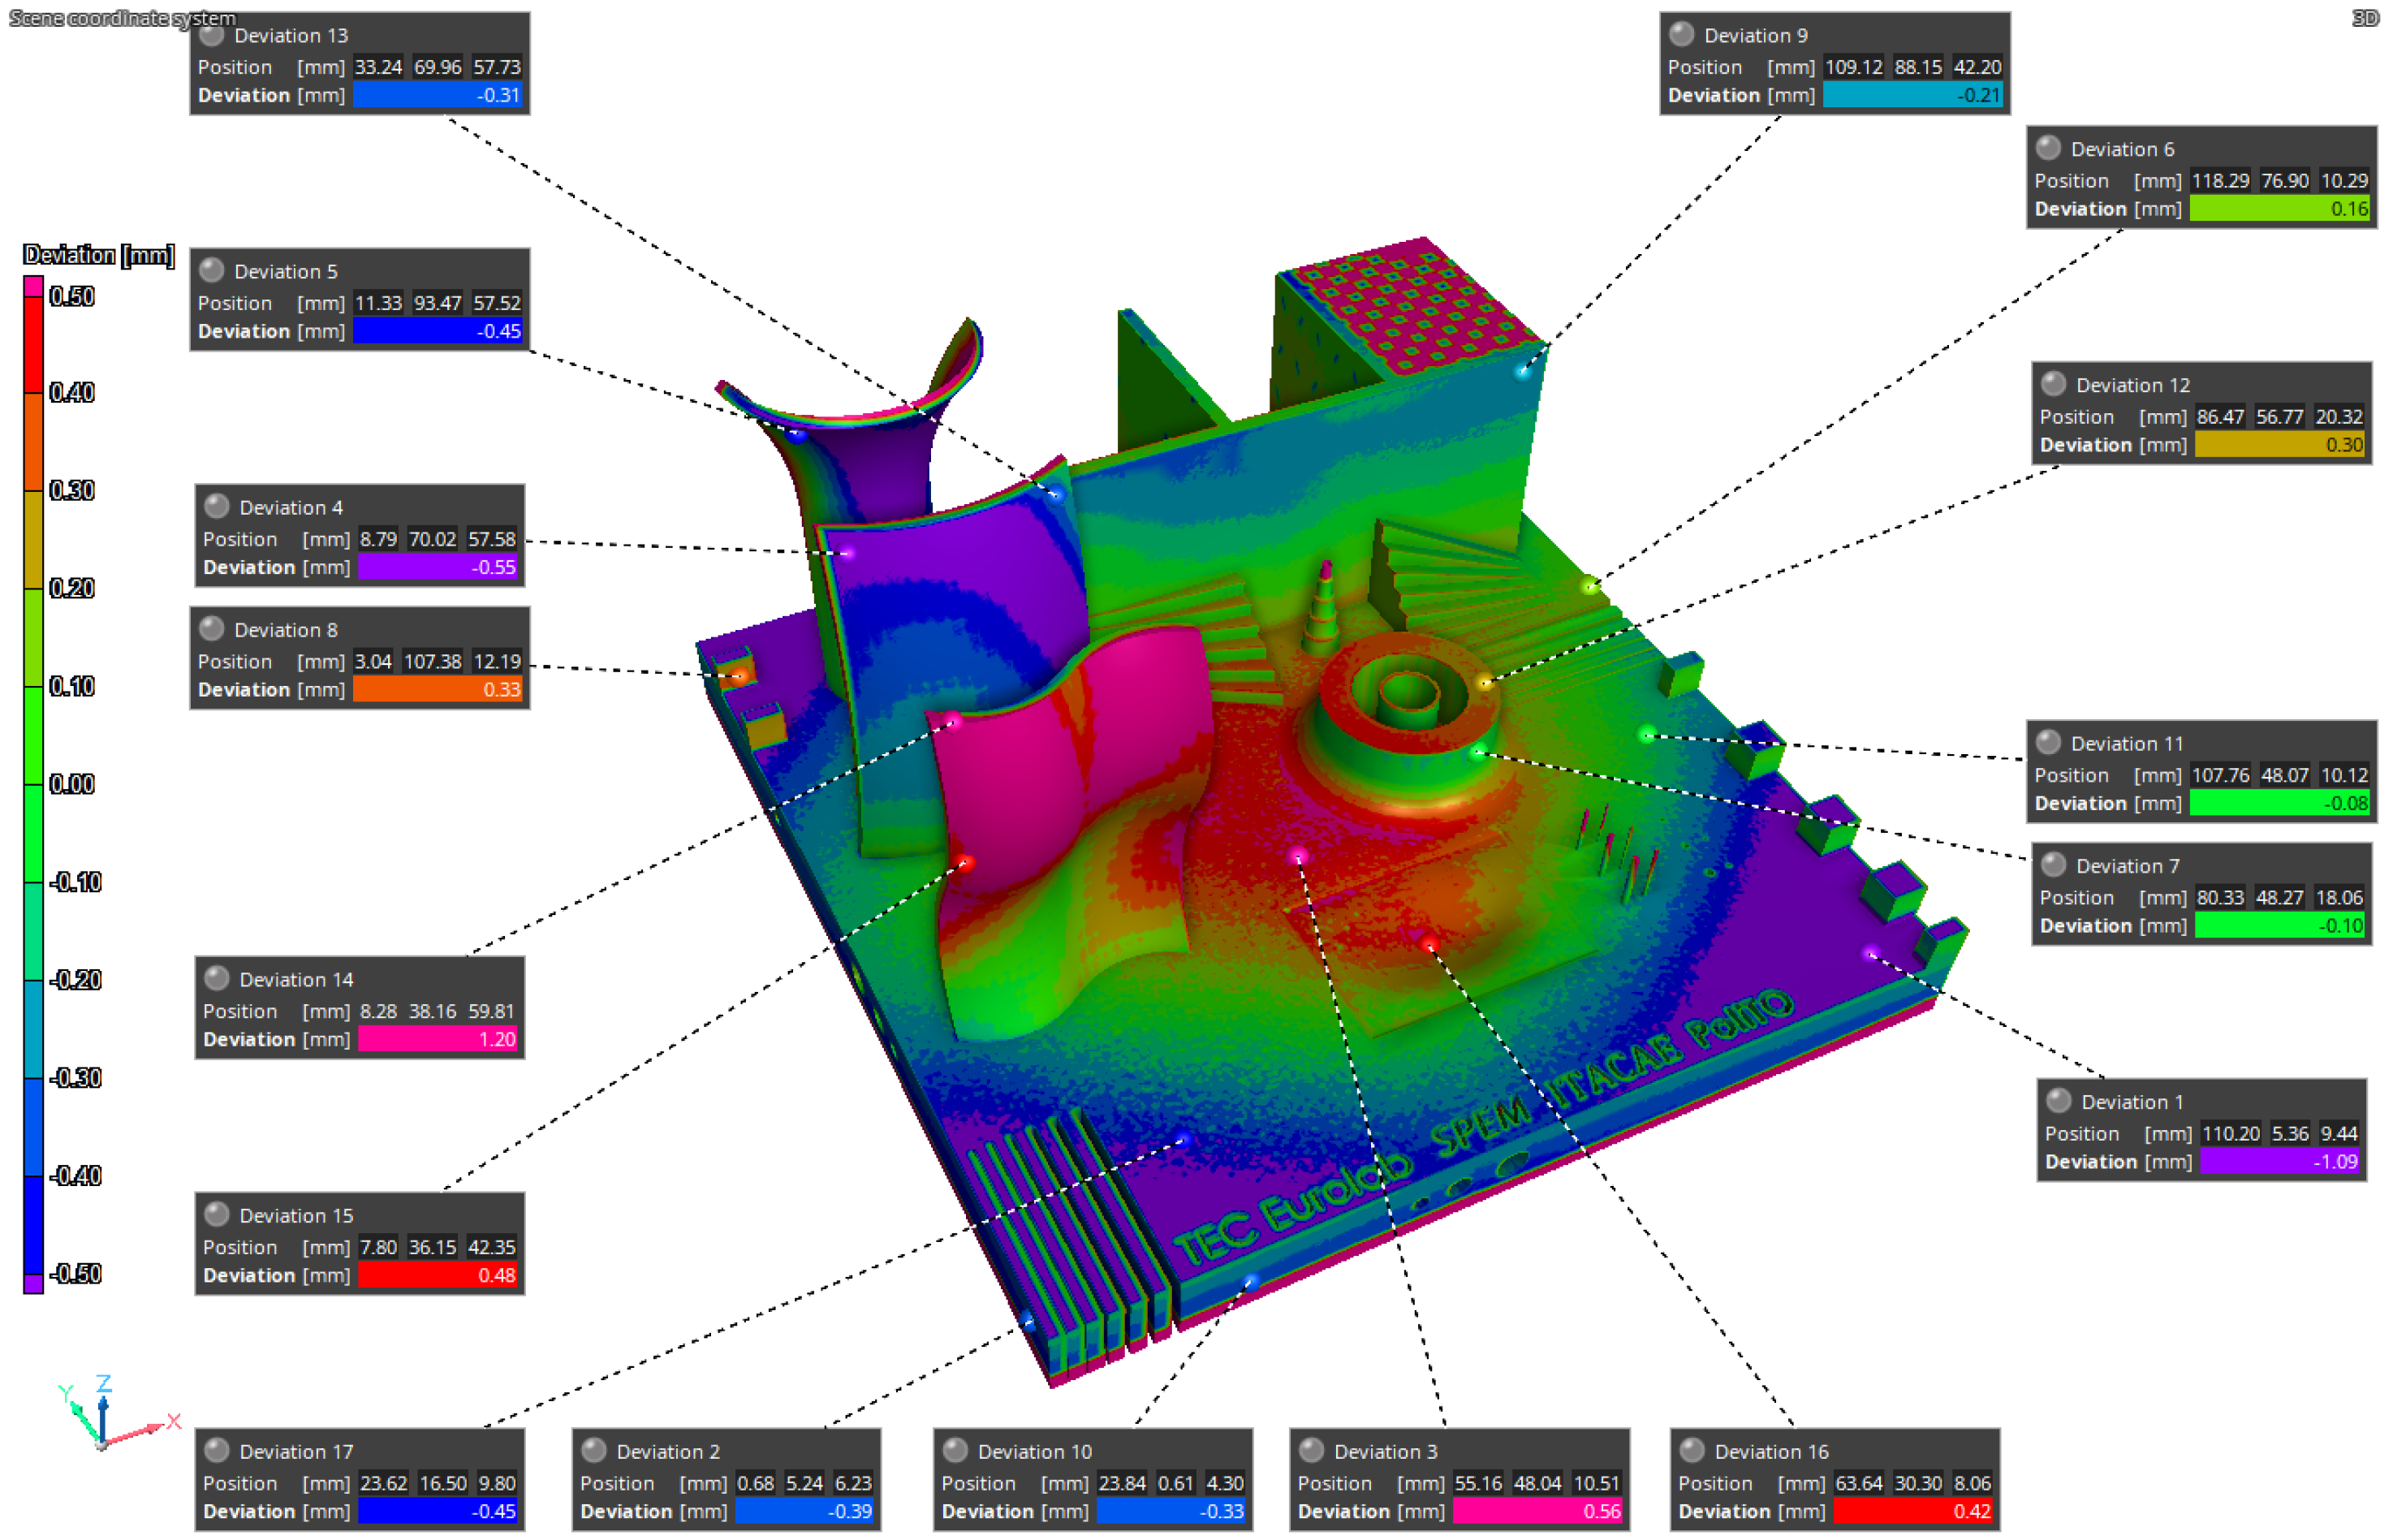
| Point | iCT-SIM1 [mm] |
|---|---|
| 1 | −1.09 |
| 2 | −0.39 |
| 3 | 0.56 |
| 4 | −0.55 |
| 5 | −0.45 |
| 6 | 0.16 |
| 7 | −0.10 |
| 8 | 0.33 |
| 9 | −0.21 |
| 10 | −0.33 |
| 11 | −0.08 |
| 12 | 0.30 |
| 13 | −0.31 |
| 14 | 1.20 |
| 15 | 0.48 |
| 16 | 0.42 |
| 17 | −0.45 |
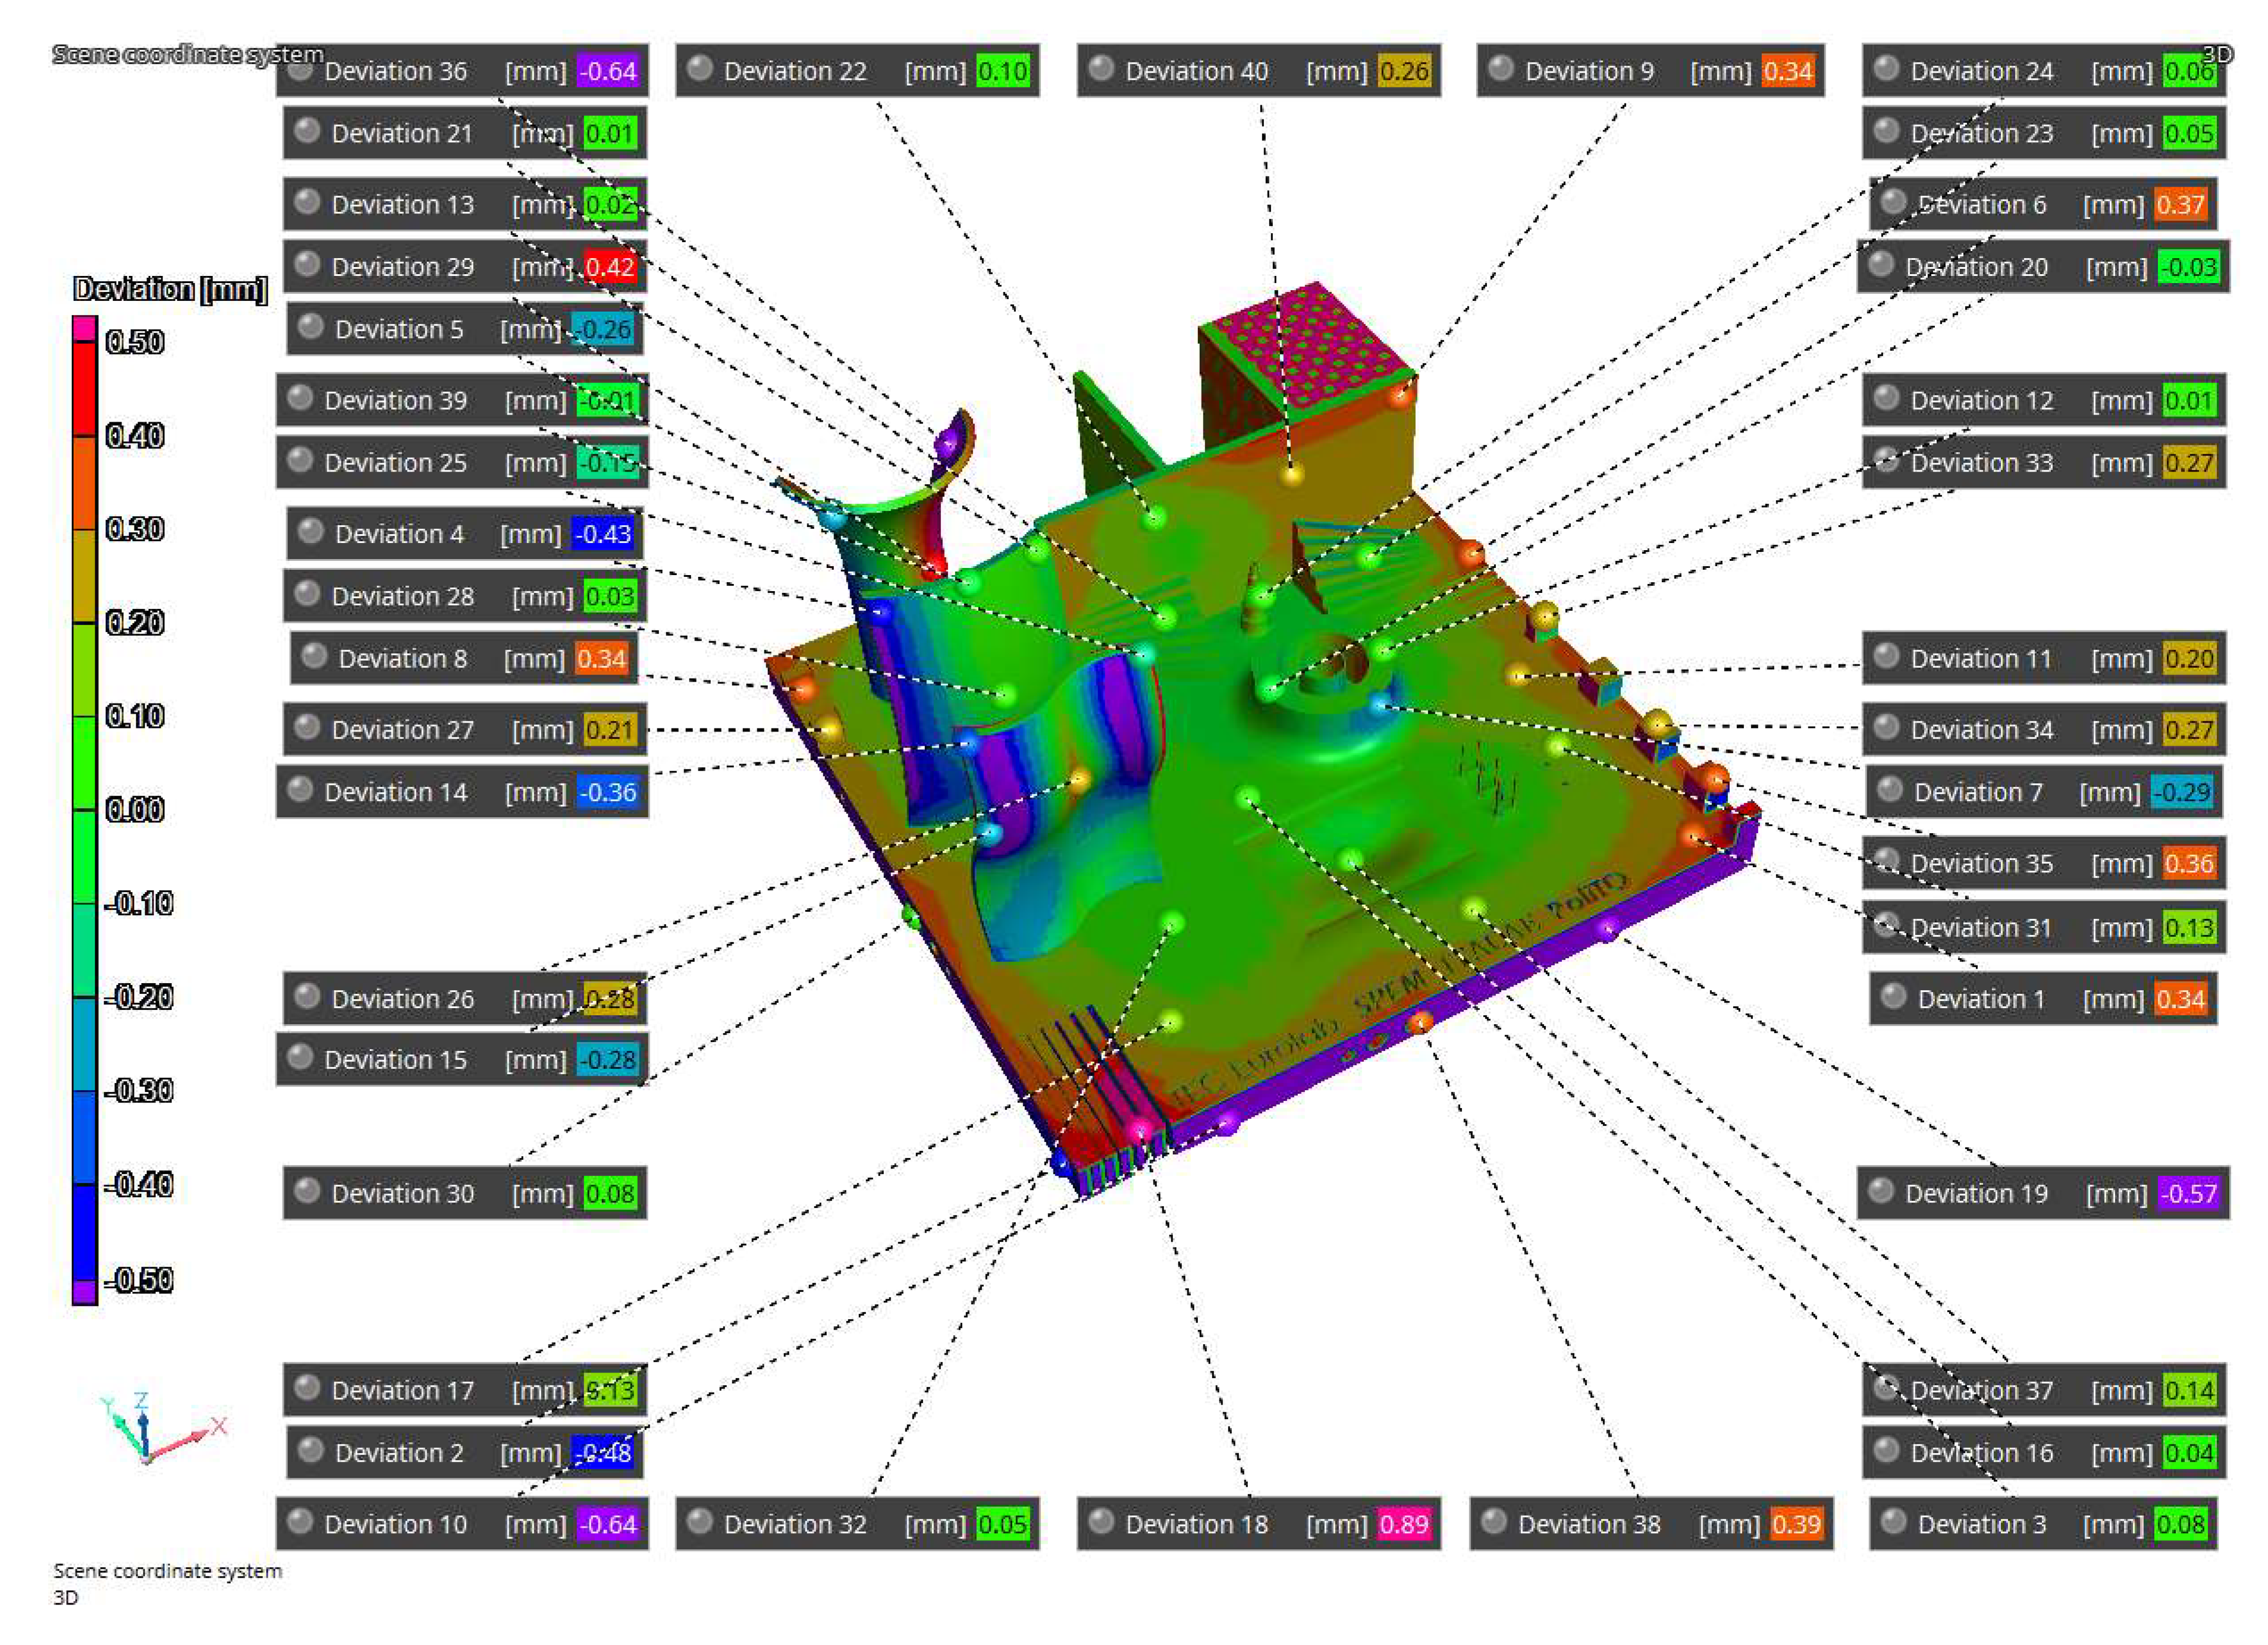
| Point | NG-iCT [mm] | NG-SIM2 [mm] | iCT-SIM2 [mm] |
|---|---|---|---|
| 1 | 0.53 | 0.34 | −0.20 |
| 2 | −0.28 | −0.48 | −0.20 |
| 3 | −0.08 | 0.08 | 0.11 |
| 4 | −0.03 | −0.43 | −0.40 |
| 5 | 0.16 | −0.26 | −0.41 |
| 6 | 0.14 | 0.37 | 0.23 |
| 7 | −0.14 | −0.29 | −0.15 |
| 8 | −0.01 | 0.34 | 0.34 |
| 9 | 0.06 | 0.34 | 0.27 |
| 10 | −0.27 | −0.64 | −0.37 |
| 11 | 0.21 | 0.20 | 0.00 |
| 12 | 0.02 | 0.01 | 0.00 |
| 13 | 0.37 | 0.02 | −0.35 |
| 14 | 0.06 | −0.35 | 0.42 |
| 15 | 0.51 | −0.28 | −0.23 |
| 16 | −0.13 | 0.04 | 0.17 |
| 17 | 0.26 | 0.13 | −0.12 |
| 18 | 0.49 | 0.89 | 0.40 |
| 19 | −0.29 | −0.57 | −0.28 |
| 20 | −0.03 | −0.03 | 0.00 |
| 21 | 0.00 | 0.01 | 0.01 |
| 22 | 0.08 | 0.10 | 0.02 |
| 23 | −0.05 | 0.05 | 0.10 |
| 24 | −0.01 | 0.06 | 0.07 |
| 25 | −0.10 | −0.15 | −0.25 |
| 26 | −0.02 | 0.28 | 0.30 |
| 27 | −0.04 | 0.21 | 0.24 |
| 28 | 0.06 | 0.03 | −0.03 |
| 29 | 0.36 | 0.42 | 0.06 |
| 30 | −0.03 | 0.08 | 0.11 |
| 31 | 0.27 | 0.13 | −0.14 |
| 32 | 0.12 | 0.05 | −0.07 |
| 33 | 0.31 | 0.27 | −0.04 |
| 34 | 0.44 | 0.27 | −0.17 |
| 35 | 0.60 | 0.36 | −0.24 |
| 36 | −0.30 | −0.64 | −0.44 |
| 37 | 0.21 | 0.14 | −0.07 |
| 38 | 0.21 | 0.39 | 0.18 |
| 39 | 0.24 | −0.01 | −0.25 |
| 40 | 0.08 | 0.26 | 0.18 |
Disclaimer/Publisher’s Note: The statements, opinions and data contained in all publications are solely those of the individual author(s) and contributor(s) and not of MDPI and/or the editor(s). MDPI and/or the editor(s) disclaim responsibility for any injury to people or property resulting from any ideas, methods, instructions or products referred to in the content. |
© 2023 by the authors. Licensee MDPI, Basel, Switzerland. This article is an open access article distributed under the terms and conditions of the Creative Commons Attribution (CC BY) license (https://creativecommons.org/licenses/by/4.0/).
Share and Cite
Patuelli, C.; Cestino, E.; Frulla, G.; Valente, F.; Servetti, G.; Esposito, F.; Barbero, L. FEM Simulation of AlSi10Mg Artifact for Additive Manufacturing Process Calibration with Industrial-Computed Tomography Validation. Materials 2023, 16, 4754. https://doi.org/10.3390/ma16134754
Patuelli C, Cestino E, Frulla G, Valente F, Servetti G, Esposito F, Barbero L. FEM Simulation of AlSi10Mg Artifact for Additive Manufacturing Process Calibration with Industrial-Computed Tomography Validation. Materials. 2023; 16(13):4754. https://doi.org/10.3390/ma16134754
Chicago/Turabian StylePatuelli, Cesare, Enrico Cestino, Giacomo Frulla, Federico Valente, Guido Servetti, Fabio Esposito, and Luca Barbero. 2023. "FEM Simulation of AlSi10Mg Artifact for Additive Manufacturing Process Calibration with Industrial-Computed Tomography Validation" Materials 16, no. 13: 4754. https://doi.org/10.3390/ma16134754
APA StylePatuelli, C., Cestino, E., Frulla, G., Valente, F., Servetti, G., Esposito, F., & Barbero, L. (2023). FEM Simulation of AlSi10Mg Artifact for Additive Manufacturing Process Calibration with Industrial-Computed Tomography Validation. Materials, 16(13), 4754. https://doi.org/10.3390/ma16134754