
Establishing the Durability and Reliability of a Dental Bur Based on the Wear


Abstract
1. Introduction
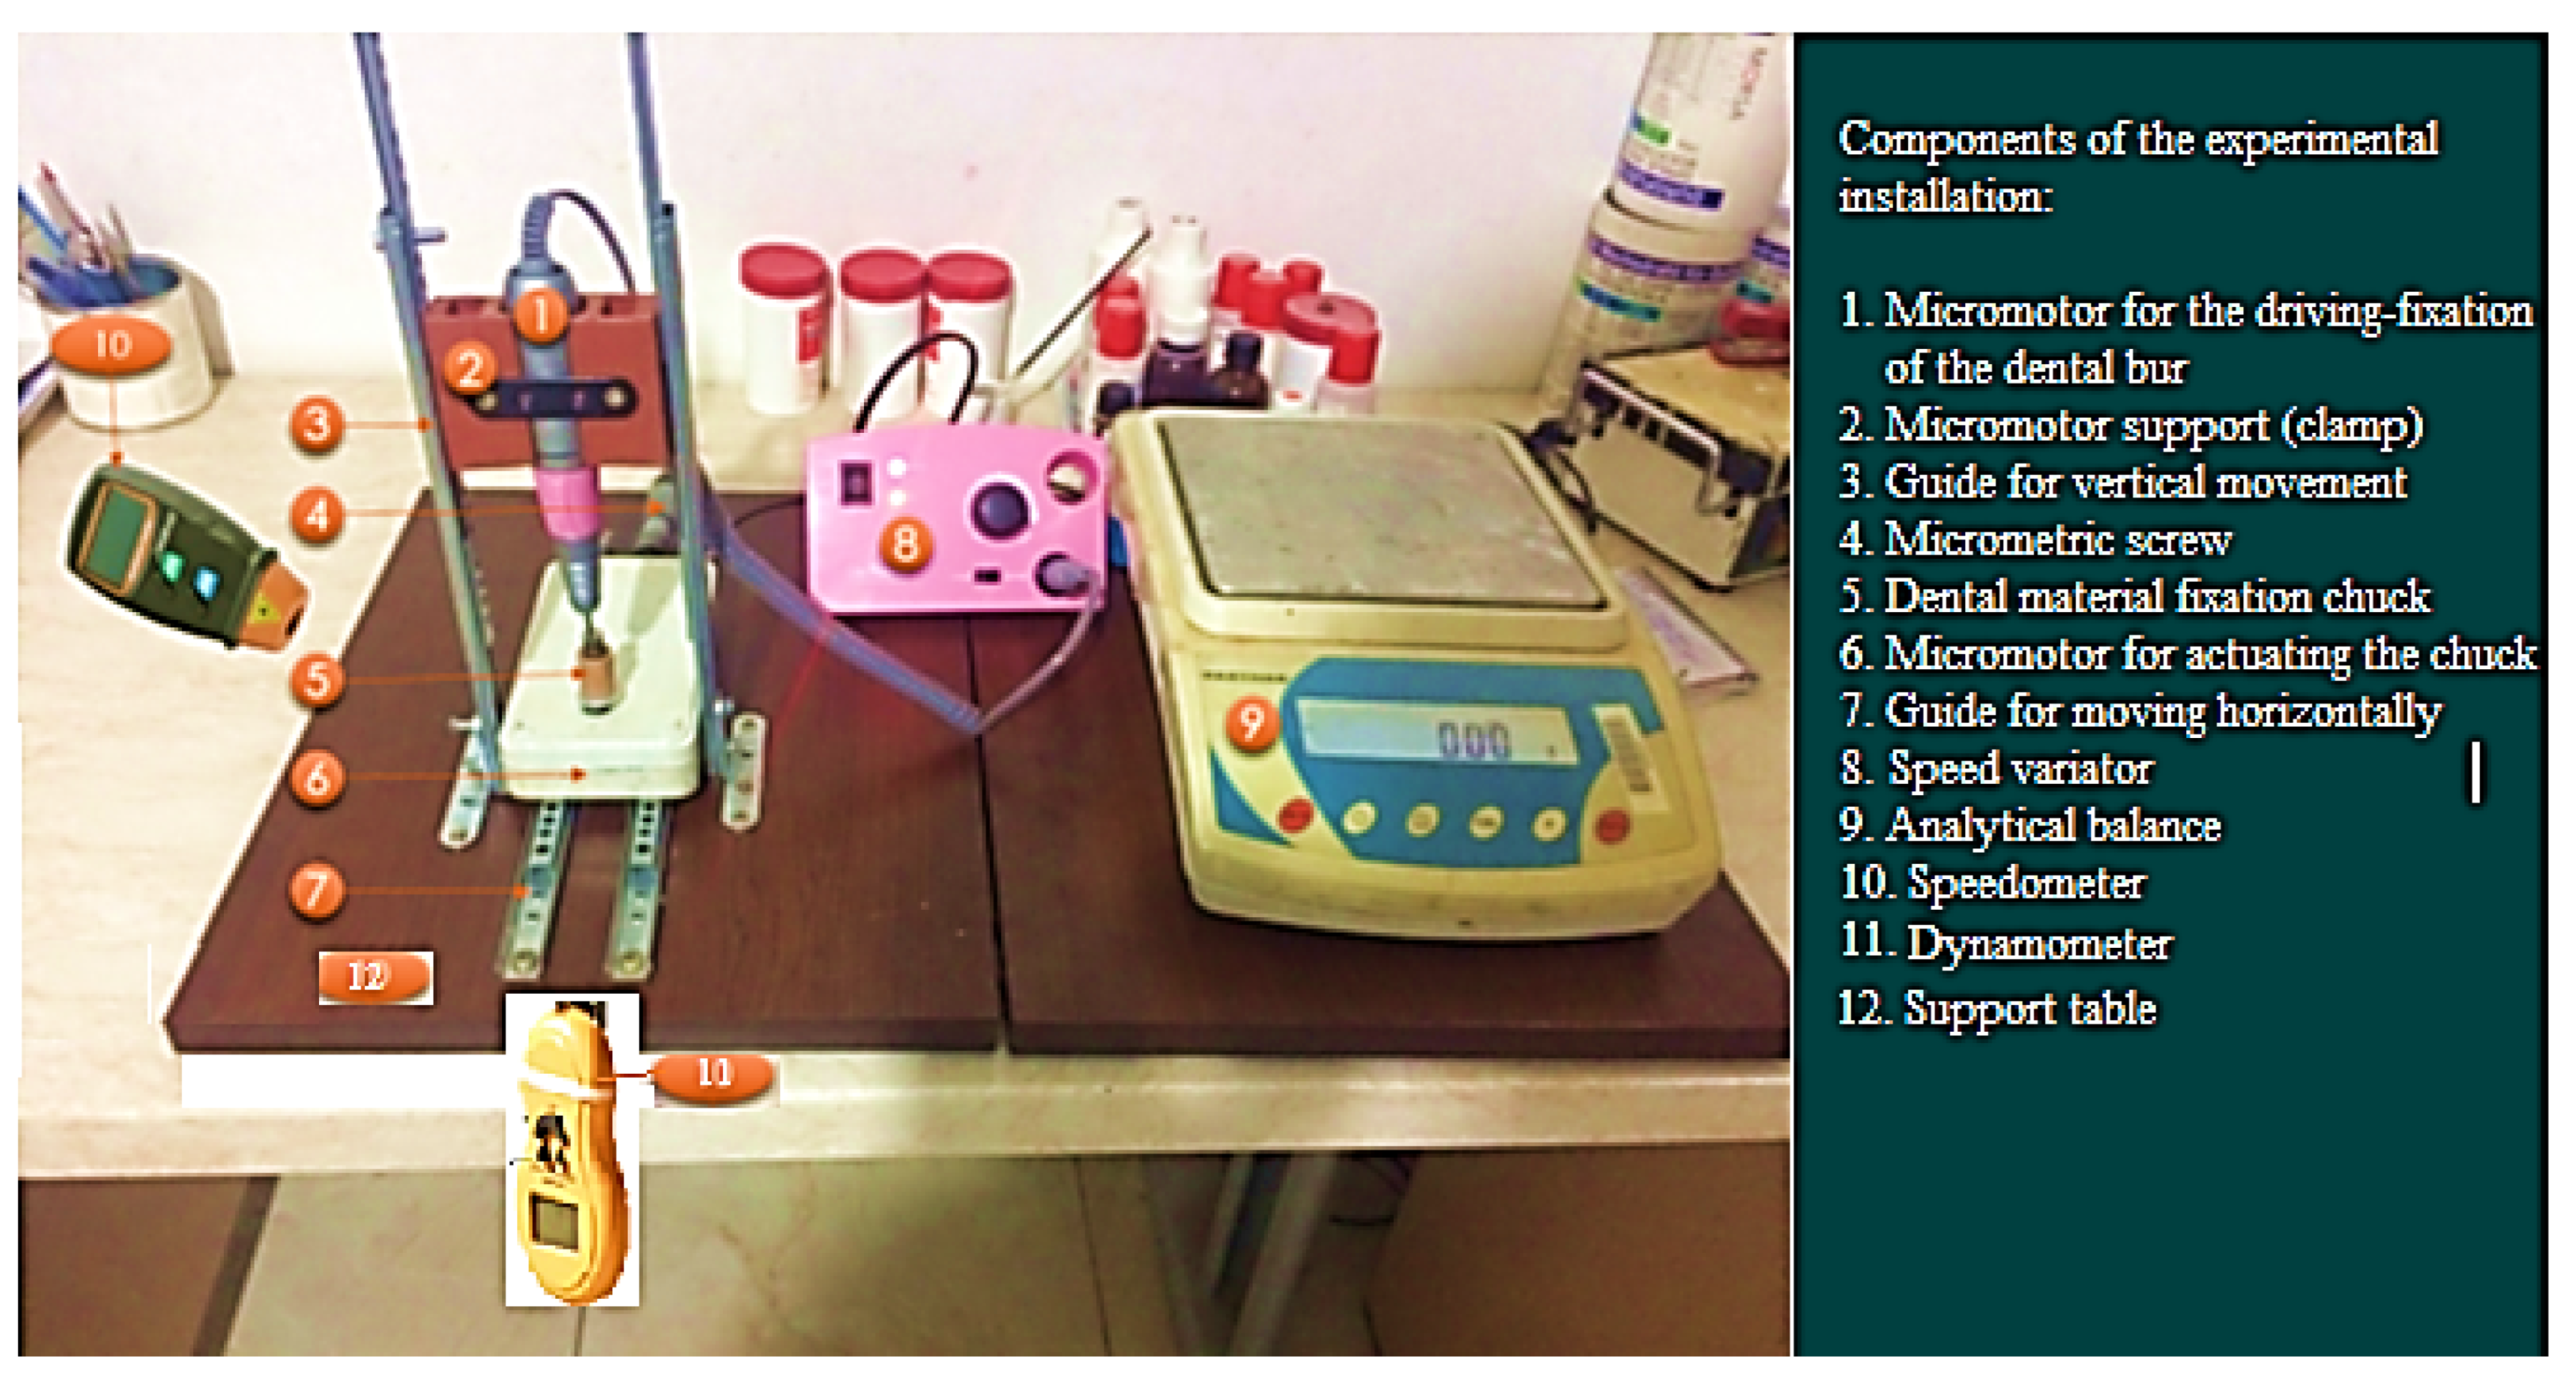
2. Materials and Methods
3. Results
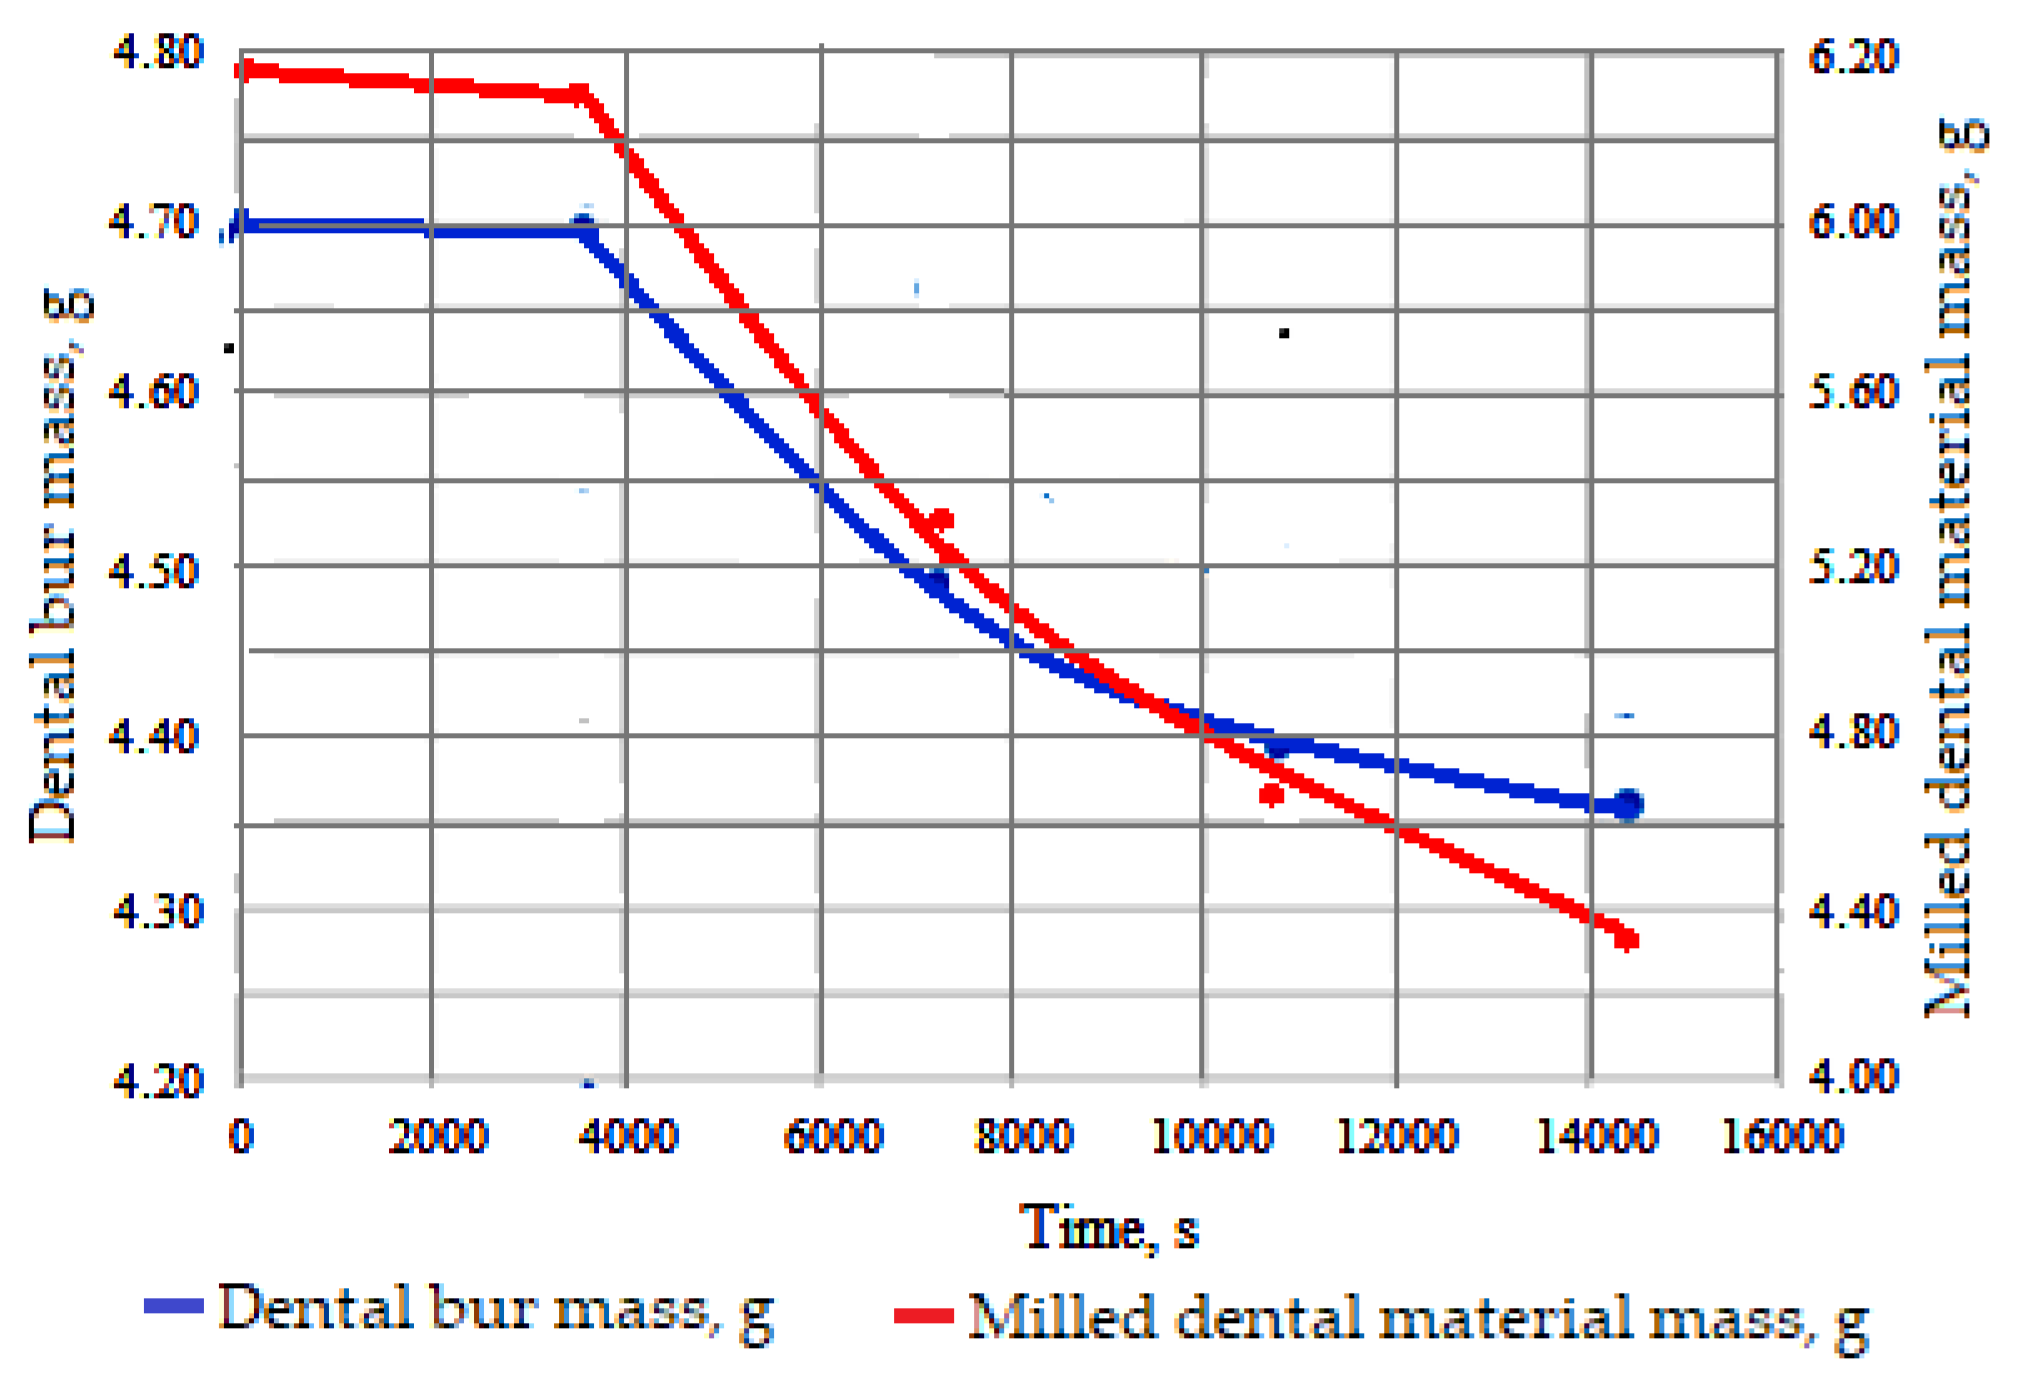
3.1. Estimation of Wear and Durability of Dental Burs
3.2. Reliability of Dental Burs: The Reliability–Durability Correlation
- -
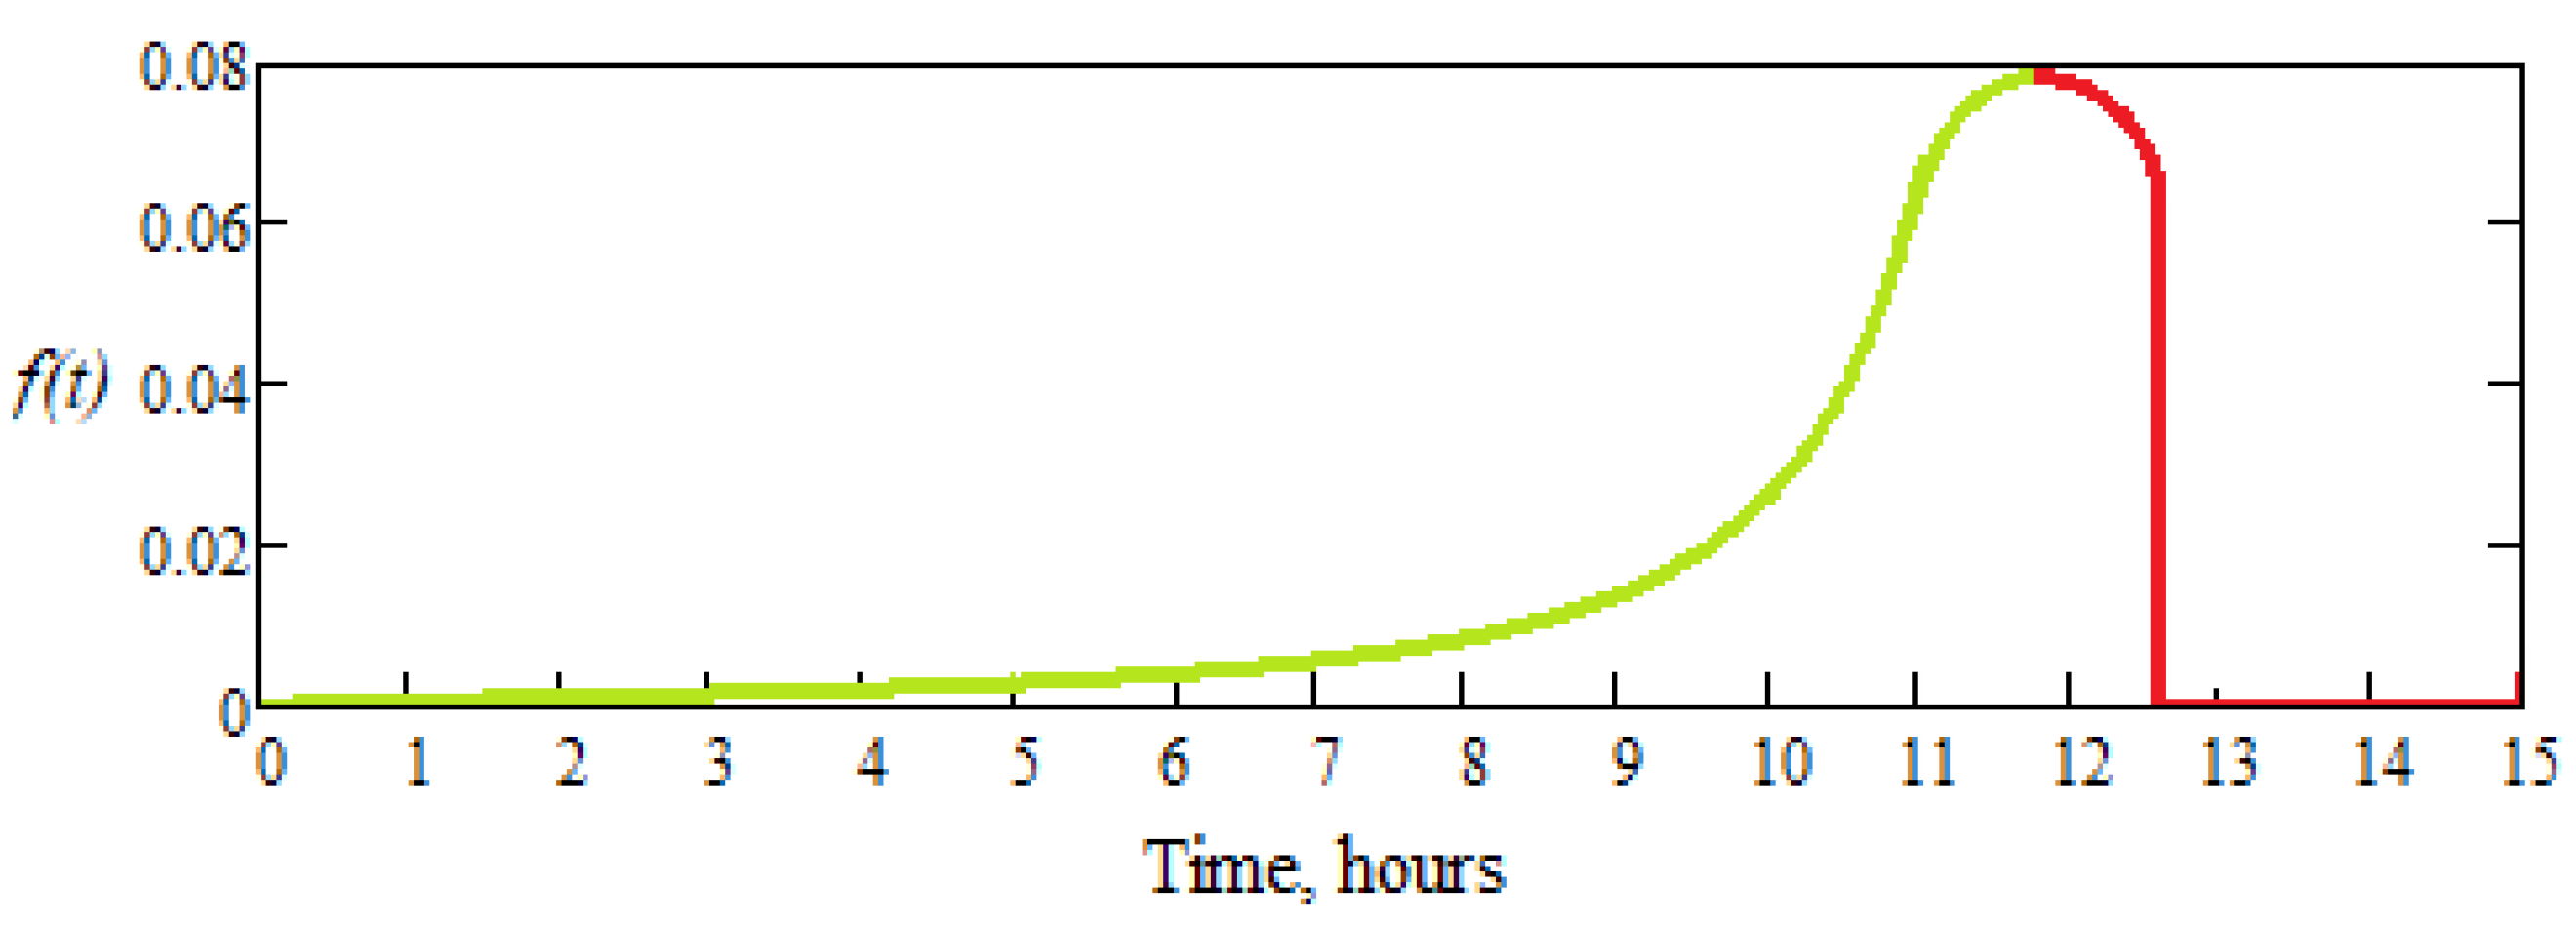
- The active part of dental burs operates with a very low probability of failure until a time, tmin, after which it increases rapidly until a time, tmax, when practically no bur is usable anymore, in general;
- -
- The time interval for removing from use the active part of a dental bur, tmax-tmin, is due to the small differences between the manufacturing characteristics of the same type of active part of dental burs (slightly different masses, angles, etc.).
- -
- The first zone, when t Є (0, 4) hours; there is no risk of failure, and h(t) has a linear variation, close to zero;
- -
- The second zone, when t Є (4, 8) hours; there are minimal (very low) chances of failure, although h(t) has a linear variation with a very small slope;
- -
- The third zone, when t Є (8, 10) hours; h(t) begins to increase, has a curvilinear variation, so the phenomenon of wear becomes visible, and the risk of failure is increasing;
- -
- The fourth zone, when t Є (10, 12) hours; h(t), increases suddenly, following an exponential curve and the risk of failure is very high.
4. Discussions
5. Conclusions
- The study presented in this paper was limited to the analysis and the consideration of only one parameter, mw, to study the phenomenon of wear based on the durability and reliability of a type of dental bur.
- The wear phenomenon limits the durability and reliability of the active part of a dental bur, by the parameter, mw, considered in the experimental program, studied based on the experimental results obtained in the work process and validated by polynomial interpolation
- Polynomial interpolation of the experimental data/results allowed the determination of the limit (extreme) wear values, when a dental bur becomes ineffective (i.e., must be replaced) and led to practical applications, useful for the determining of its lifetime, even for the optimization of the parameters, mw.
- Additionally, the results obtained by interpolation showed that the dental bur during the work process has a high efficiency, and the limit of use of a dental bur was establish by the determination durability and reliability, to ensure high dental-material-processing standards.
- The results closest to reality are those given by the interpolation function of the third degree, and they are in good agreement with the experimental results, but the complete solution of this problem without experimental information becomes an approximate one because the experiments were performed on only one type of dental bur.
- The researched parameter mw, measured by weighing, was observed to take different values at random between two limits; each value has its own frequency (a number of repetitions), and the distribution of these values (with their frequency) can be represented by a normal distribution law based on Gauss’s function.
- Similar studies can be justified and use other functional parameters of the active part of the researched dental bur to check the validity of the method used, regarding the lifetime (durability) and optimization of their operation (reliability).
- The continuation of the research method, by obtaining several experimental data and additional information for a more complete solution to the problem of wear of the active part of dental burs, method extension on other functional parameters that were not monitored, and other types of dental burs in order to record the parameters, is proposed, using new deterministic or even statistical models of the wear phenomenon.
- In this way, the influence (importance) of the parameter, mw, along with other characteristic/functional parameters mentioned in the paper will be compared and validated, and experimental data structured and discussed will be modeled and used to investigate the possibilities of improving or optimizing the working regimes of dental burs.
Author Contributions
Funding
Institutional Review Board Statement
Informed Consent Statement
Data Availability Statement
Conflicts of Interest
References
- Available online: http://dexonline.net (accessed on 6 May 2022).
- Burlacu, G.; Danet, N.; Bandrabur, C.; Duminica, T. Reliability, Maintainability and Availability of Technical Systems; MatixRom: Buharest, Romania, 2005. (In Romanian) [Google Scholar]
- Bârsan-Pipu, N.; Isaic-Maniu, A.; Vodă, V.G. Failure. Statistical Models with Applications; Economică: Bucharest, Romania, 1997. (In Romanian) [Google Scholar]
- Tudor, A.; Mirică, R.-F.; Laurian, T. Reliability of Mechanical Systems; BREN: Bucharest, Romania, 2003. (In Romanian) [Google Scholar]
- Available online: https://ro.wikipedia.org/wiki/Fiabilitate (accessed on 25 May 2022).
- Available online: https://doctoruldedinti.info/freze-stomatologice/ (accessed on 9 June 2022).
- Available online: https://en.wikipedia.org/wiki/Milling_cutter (accessed on 8 September 2022).
- Materials, Equipment, Instruments and Dental Consumables. Available online: https://www.dentotal.ro/ (accessed on 9 February 2022).
- Saracin, I.A.; Ilie, F.; Voicu, G. Structural properties of the friction couple, dental milling cutter-dental material, before the work process. Sci. Bull. Ser. B 2022, 84, 237–246. [Google Scholar]
- Saracin, A.; Voicu Gh Saracin, I.; Pandia, O. Detemination of use of dental materials and stemmatological frees on stand. In Proceedings of the Conference Engineering for Rural Development, Jelgava, Latvia, 22–24 March 2019. [Google Scholar]
- Baksa, T.; Kroupa, T.; Hanzl, P.; Zetek, M. Durability of Cutting Tools during Machining of Very Hard and Solid Materials. Procedia Eng. 2015, 100, 1414–1423. [Google Scholar] [CrossRef]
- Jozic, S.; Lela, B.; Bajic, D. A New Mathematical Model for Flank Wear Prediction Using Functional Data Analysis Methodology. Adv. Mater. Sci. Eng. 2014, 2014, 138168. [Google Scholar] [CrossRef]
- Ilie, F.; Saracin, I.A.; Voicu, G. Study of Wear Phenomenon of a Dental Milling Cutter by Statistical–Mathematical Modeling Based on the Experimental Results. Materials 2022, 15, 1903. [Google Scholar] [CrossRef] [PubMed]
- Fry, R.; McManus, S. Smooth Bump Functions and Geometry of Banach Spaces, A Brief Survey. Expo. Math. 2002, 20, 143–183. [Google Scholar] [CrossRef]
- Rowland, T. Bump Function, From Math World—A Wolfram Web Resource, Created by Eric W. Weisstein. Available online: https://mathworld.wolfram.com/BumpFunction.html (accessed on 12 December 2022).
- Tampu, I. The Metal Cutting Process. Tool Life, T&T Magazine—Technique and Technology, 2018. Available online: https://www.ttonline.ro/revista/scule/procesul-de-aschiere-a-metalelor-durata (accessed on 28 February 2023). (In Romanian).
- Caado-Vara, R.; Canal-Alonso, A.; Martin-del Rey, A.; De la Prieta, F.; Prieto, J. Smart Buildings IoT Networks Accuracy Evolution Prediction to Improve Their Reliability Using a Lotka–Volterra Ecosystem Model. Sensors 2019, 19, 4642. [Google Scholar] [CrossRef]
- Cardei, P.; Saracin, A.; Saracin, I. A classical mathematical model applied for the study of the phenomenon of wear of dental mills. Prepr. RG 2020. [Google Scholar] [CrossRef]
- Available online: https://dexonline.ro/definitie/uzur%C4%83 (accessed on 24 April 2023).
- Gatabazi, P.; Mba, J.C.; Pindza, E.; Labuschagne, C. Grey Lotka-Volterra models with application to cryptocurrencies adoption. Chaos Solitons Fractals 2019, 122, 47–57. [Google Scholar] [CrossRef]


 the probability that the dental bur, in good working condition until the moment when the failure begins.
  the probability density of failure of the dental bur and the moment in which it is fails.
the probability that the dental bur, in good working condition until the moment when the failure begins. the probability density of failure of the dental bur and the moment in which it is fails.
the probability density of failure of the dental bur and the moment in which it is fails.
the probability that the dental bur, in good working condition until the moment when the failure begins. the probability density of failure of the dental bur and the moment in which it is fails.
 the area where there is no instantaneous risk of failure.
  the area where the phenomenon of wear becomes visible, and the risk of failure increases curvilinear (after a curve).
  the area where the risk of failure increases suddenly (exponentially and the risk of failure is very high).
the area where there is no instantaneous risk of failure. the area where the phenomenon of wear becomes visible, and the risk of failure increases curvilinear (after a curve). the area where the risk of failure increases suddenly (exponentially and the risk of failure is very high).
the area where the risk of failure increases suddenly (exponentially and the risk of failure is very high).
the area where there is no instantaneous risk of failure. the area where the phenomenon of wear becomes visible, and the risk of failure increases curvilinear (after a curve). the area where the risk of failure increases suddenly (exponentially and the risk of failure is very high).


| Parameter | Notation | Unit of Measurement | Parameter Type |
|---|---|---|---|
| Time | t | s, min, h | Command |
| Mass lost by dental bur wear | mw | g | Input/Output |
| Milled mass (of dental material) | mm | g | Qualitative |
| Advance (Feed) | s | mm | Command |
| Rotational speed of dental bur | n/ω | rpm/s−1 | Command |
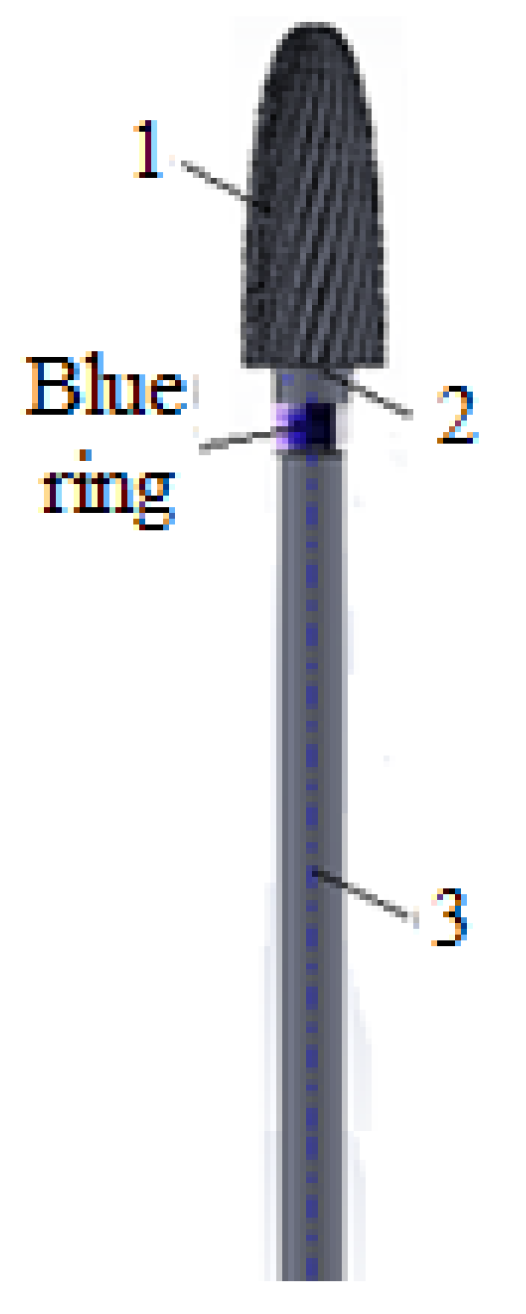
| Type of Bur/Features | Mass, mf [g] | Total Length, [mm] | Length of the Active Part, [mm] | Average Diameter, [mm] | Maximum Diameter, [mm] |
|---|---|---|---|---|---|
| Specimen dental bur | 4.701 | 52.750 | 14.500 | 5.400 | 6.200 |
| Name | Mass, mm [g] | Total Length, [mm] | Diameter, [mm] |
|---|---|---|---|
| Sample dental material | 6.18 | 13.00 | 8.60 |
| mw—Values by Interpolation of the Degree Polynomial (Function): | |||
|---|---|---|---|
| Polynomial Coefficients | Degree I | Degree II | Degree III |
| c00 | −0.315 | −0.003346 | 0 |
| c10 | 1.746·10−5 | −6.150·10−5 | 6.744·10−5 |
| c01 | 3.866·10−4 | 2.275·10−4 | −5.699·10−4 |
| c11 | 0 | 1.333·10−8 | −1.028·10−8 |
| c20 | 0 | 3.792·10−9 | −8.736·10−9 |
| c02 | 0 | 1.518·10−8 | 6.156·10−7 |
| c21 | 0 | 0 | 1.762·10−12 |
| c12 | 0 | 0 | −1.82·10−12 |
| c30 | 0 | 0 | 3.37·10−13 |
| c03 | 0 | 0 | −1.038·10−10 |
| ε % | 7.828 | 1.733 | 0.486 |
| Rotation Speed, [rpm] | Lifetime (Durability) in Hours, for mw, Given by the Polynomial Interpolation Function of: | ||
|---|---|---|---|
| Degree I | Degree II | Degree III | |
| 7000 | 12.753 | 11.720 | 11.517 |
| 12,000 | 8.558 | 7.886 | 7.824 |
| 20,000 | 5.998 | 5.984 | 5.795 |
| 35,000 | 3.623 | 3.597 | 3464 |
| No. Crt. | Rotational Speed of Dental Bur, Rpm | Lifetime (Duration). Calculated for mw, Hours |
|---|---|---|
| 1 | 7000 | 11.373 |
| 2 | 10.265 | |
| 3 | 12.613 | |
| 4 | 11.214 | |
| 5 | 11.620 | |
| 6 | 12,000 | 7.634 |
| 7 | 7.488 | |
| 8 | 8.358 | |
| 9 | 7.354 | |
| 10 | 7.786 | |
| 11 | 20,000 | 5.898 |
| 12 | 5.911 | |
| 13 | 5.098 | |
| 14 | 5.684 | |
| 15 | 5.884 | |
| 16 | 35,000 | 3.275 |
| 17 | 3.153 | |
| 18 | 3.523 | |
| 19 | 3.497 | |
| 20 | 3.372 | |
| Average time values of calculated life, hours | 7000 | 11.417 |
| 12,000 | 7.724 | |
| 20,000 | 5.695 | |
| 35,000 | 3.364 |
Disclaimer/Publisher’s Note: The statements, opinions and data contained in all publications are solely those of the individual author(s) and contributor(s) and not of MDPI and/or the editor(s). MDPI and/or the editor(s) disclaim responsibility for any injury to people or property resulting from any ideas, methods, instructions or products referred to in the content. |
© 2023 by the authors. Licensee MDPI, Basel, Switzerland. This article is an open access article distributed under the terms and conditions of the Creative Commons Attribution (CC BY) license (https://creativecommons.org/licenses/by/4.0/).
Share and Cite
Ilie, F.; Saracin, I.A. Establishing the Durability and Reliability of a Dental Bur Based on the Wear. Materials 2023, 16, 4660. https://doi.org/10.3390/ma16134660
Ilie F, Saracin IA. Establishing the Durability and Reliability of a Dental Bur Based on the Wear. Materials. 2023; 16(13):4660. https://doi.org/10.3390/ma16134660
Chicago/Turabian StyleIlie, Filip, and Ioan Alexandru Saracin. 2023. "Establishing the Durability and Reliability of a Dental Bur Based on the Wear" Materials 16, no. 13: 4660. https://doi.org/10.3390/ma16134660
APA StyleIlie, F., & Saracin, I. A. (2023). Establishing the Durability and Reliability of a Dental Bur Based on the Wear. Materials, 16(13), 4660. https://doi.org/10.3390/ma16134660