Article

Fabrication and Luminescent Properties of Highly Transparent Er:Y2O3 Ceramics by Hot Pressing Sintering

1
State Key Laboratory of High Performance Ceramics and Superfine Microstructure, Shanghai Institute of Ceramics, Chinese Academy of Sciences, Shanghai 200050, China
2
Collaborative Innovation Center for Advanced Organic Chemical Materials Co-Constructed by the Province and Ministry, Ministry of Education Key Laboratory for the Green Preparation and Application of Functional Materials, School of Material Science and Engineering, Hubei University, Wuhan 430062, China
3
Center of Materials Science and Optoelectronics Engineering, University of Chinese Academy of Sciences, Beijing 100049, China
4
Suzhou Research Institute, Shanghai Institute of Ceramics, Chinese Academy of Sciences, Taicang 215400, China
*
Authors to whom correspondence should be addressed.
These authors contributed equally to this work.
Materials 2023, 16(13), 4504; https://doi.org/10.3390/ma16134504
Submission received: 26 May 2023 / Revised: 13 June 2023 / Accepted: 15 June 2023 / Published: 21 June 2023
(This article belongs to the Special Issue Glasses and Ceramics for Luminescence Applications)

Abstract

:
Highly transparent Er:Y2O3 ceramics (1–9 at.% Er) were fabricated by hot pressing sintering with ZrO2 as the sintering additive. The microstructures, transmittance, luminescent properties, thermal conductivity, and mechanical properties of the Er:Y2O3 ceramic samples were investigated in detail. The samples all exhibited dense and fine grain microstructures; the average grain sizes were about 0.8 μm. The transmittance levels of the samples with various Er concentrations (2 mm thick) at the wavelengths of 600 and 2700 nm were ~74 and ~83%, respectively. As the Er doping concentration increased from 1 to 9 at.%, the up-conversion luminescence of the samples gradually changed from green to red, with the intensity ratio of red/green light increasing from 0.28 to 2.01. Meanwhile, the down-conversion luminescence properties of the specimens were also studied. When the samples were under 980 nm excitation, the emission bands were detected at 1552, 1573, 1639, and 1661 nm. The thermal conductivity of the samples was found to decrease from 8.72 to 5.81 W/(m·K) with an increase of the Er concentration from 1 to 9 at.%. Moreover, the microhardness and fracture toughness of the samples with 1 at.% Er concentration were ~8.51 GPa and ~1.03 MPa·m1/2, respectively.

1. Introduction

In recent decades, great efforts have focused on the development of rare earth (RE)-based transparent polycrystalline materials, such as Y3Al5O12 (YAG) and RE2O3 (RE = Y, Sc, or Lu), because of their potential applications as solid-state laser hosts, optical windows, and scintillators [1]. Compared to the commonly used YAG laser materials (the phonon energy is 875 cm−1, thermal conductivity is ~11 W/(m·K)), RE2O3 compounds have lower phonon energy levels (i.e., 565, 672, and 612 cm−1 for Y2O3, Sc2O3, and Lu2O3, respectively) and higher thermal conductivities (i.e., ~17, ~16.5, and ~12.5 W/(m·K) for Y2O3, Sc2O3, and Lu2O3) [2,3,4,5]. Apparently, Y2O3 possesses the lowest phonon energy level, which is beneficial for suppressing the multi-phonon non-radiative quenching. Meanwhile, Y2O3 (~17 W/m·K) [4] has a higher thermal conductivity compared to YAG (~11 W/m·K) [5], which is quite favorable for the thermal management of laser gain media. Therefore, transparent polycrystalline Y2O3 is widely considered a promising laser host material.
A series of RE-doped (e.g., Nd3+, Yb3+, Ho3+, Er3+, etc.) transparent Y2O3 ceramic materials have been successfully developed [6,7,8]. Among them, Er-doped Y2O3 showed more complicated luminescent behavior and therefore have greater potential applications [9,10,11,12,13,14,15,16,17]. When excited by commercially available 980 nm laser diodes (LD), Er-doped Y2O3 gives both up- and down-conversion emissions. The up-conversion luminescence is attributed to the 2H11/2/4S3/24I15/2 (~525–575 nm) and 4F9/24I15/2 (~650–680 nm) transitions, while the down-conversion one is due to the 4I13/24I15/2 (~1400–1700 nm) transition [9,14]. Compared to Nd3+ or Yb3+ ions, Er3+ in the cubic Y2O3 lattice shows down-conversion luminescence at longer wavelengths (i.e., ~1 μm for Nd3+ and Yb3+, 1.4–1.7 μm for Er3+), which makes Er-doped Y2O3 an excellent candidate material for eye-safe solid-state lasers [6,7,8,9].
However, it is not easy to fabricate transparent Y2O3 ceramics because of the high melting point of yttria (i.e., 2430 °C). According to the available literature, previously reported Er:Y2O3 transparent ceramics were fabricated by either a vacuum sintering method [18] or a hot-isostatic pressing route (HIP) [19]. The former method is very energy-intensive, requiring high sintering temperatures (e.g., ≥1800 °C) and long holding times (e.g., ~16 h). While the latter is quite uneconomical as a large amount of inert gas has to be used in the HIP process. In this work, highly transparent Y2O3 ceramics with various Er concentrations were fabricated by a convenient and economical hot-pressing method. The optical transmittance, microstructures, luminescence, and thermo-mechanical properties of the samples were investigated with respect to solid laser applications.

2. Materials and Methods

High-purity powders of Y2O3 (99.99%, Jiangyin Jiahua, China), Er2O3(99.995%, Rare-Chem, Huizhou, China), and Zr(NO3)4·3H2O (AR, Shanghai Diyang, Shanghai, China) powders were used as starting materials. According to the compositions of Y(1.98−x)Zr0.02ErxO3 (x = 0.02, 0.06, 0.10, 0.14, and 0.18, the concentration of Er is 1, 3, 5, 7, and 9 at.%, respectively), the powders were weighed and milled by ball milling with 3 mm ZrO2 balls in anhydrous ethanol at 250 rpm for 24 h (the mass ratio of powder, alcohol, and ball is 1:2:5). Next, the powder mixtures were dried at 60 °C for 24 h, the powders were sieved through a 200-mesh screen, then were calcined at 1200 °C for 4 h to remove any organic component completely. The calcined powders were dry pressed in a stainless-steel mold at 5 MPa. The green bodies were pre-sintered at 1400 °C for 2 h in a muffle furnace to enhance their strength. The pre-sintered bodies were wrapped with tantalum foil and hot-pressed at 1600 °C for 3 h at a mechanical pressure of 20 MPa under a vacuum of ~10−3 Pa. After the sintering step, the samples were annealed at 1400 °C for 5 h in air. Finally, all the sintered samples were double-side polished to a thickness of 2 mm for measurements.
Phase identification was carried out by an X-ray diffraction (XRD, D/max 2550 V, JPAT, Tokyo, Japan) analysis using Cu Kα radiation. According to the XRD data, the lattice parameter and unit cell volume of the ceramic samples were calculated. Based on the calculated unit cell volume, the theoretical densities of the samples were calculated using Equation (1) [20]:
ρth = ZM/NV
where Z is the number of molecules in a unit cell (Z = 16), M is the molecular weight, N is the Avogadro’s constant, and V is the unit cell volume. By the Archimedes method, the bulk densities of the samples were measured. The ratio between each specimen’s bulk density and theoretical density was used to calculate the relative densities. The microstructures of the thermal etched surfaces and the fracture surfaces of the transparent ceramics were observed by scanning electron microscope (SEM, TM-3000, HITACHI, Tokyo, Japan). Using the SEM images from the polished and thermally etched surfaces, the Nano Measurer (1.2) software calculated the average grain sizes of the samples. Optical transmittance and absorbance spectra of the samples were measured by a UV–VIS–NIR (V770, JASCO, Tokyo, Japan) spectrometer in the range from 190 to 2700 nm. Fluorescence and up-conversion luminescence spectra were measured on the ceramics at room temperature by spectrofluorometer (FLS-980, Edinburgh, UK), and a 980 nm continuous wave laser diode was used as the excitation. A Vickers hardness tester (HVS-5Z/LCD, Shanghai Taming Optical Instrument Co., Ltd., Shanghai, China) with five indentations was used to assess the microhardness and fracture toughness. The microhardness (H, GPa) was calculated using Equation (2):
H = 4kP/(d1 + d2)2
where P is the load (9.8 N) on the indenter, d1 and d2 are the indentation diagonals, and k is the shape factor of the indenter, which is 1.8544. The fracture toughness was determined by measuring the lengths of the cracks. The fracture toughness (KIc, MPa·m1/2) was calculated using Equation (3) [21]:
KIc = 9.81 × 1000 × P(3.14c)−3/2/[tan(68 × 3.14/180)]−1
where P is the load (9.8 N) on the indenter and c is the average lengths of the cracks. The thermal diffusivity and heat capacity of the ceramic specimens were measured using a laser flash analyzer (LFA467, Netzsch, Serb, Germany). The thermal conductivity was calculated using Equation (4):
k = α·ρ·cp
where k (W/(m·K)) signifies the thermal conductivity, α denotes the thermal diffusivity, ρ represents the density, and cp is the heat capacity.

3. Results and Discussion

Figure 1 displays the XRD patterns of the samples sintered at 1600 °C for 3 h with various Er concentrations. All the observed peaks matched well with the cubic yttria phase (JCPDS: 41-1109), and no apparent impurity phase was observed. This implies that the Zr4+ and Er3+ ions were incorporated into the yttria lattice. It was also found that the diffraction peaks of the Er:Y2O3 ceramics gradually shifted to higher angles with an increase in the Er concentration (see the right inset in Figure 1), which is ascribed to the shrinkage of the lattice of yttria caused by the partial substitution of smaller Er3+ (0.89 Å (CN = 6)) for larger Y3+ (0.90 Å (CN = 6)) [22].
Table 1 exhibits the calculated structural parameters (i.e., lattice parameters and unit cell volume) and densities (i.e., theoretical density (ρth), bulk density (ρap), and relative density (ρre)) of the samples. Both of the lattice parameters and unit cell volume decreased with an increase in the Er concentration, which is consistence with the XRD results. Furthermore, as the Er concentration increased, the theoretical density of the samples also increased as a result of the lattice shrinkage and the larger atomic weight of Er compared to that of Y. While the relative density was not strongly influenced by the doping concentration, all samples possessed high levels (i.e., ~99.9%) of the relative density.
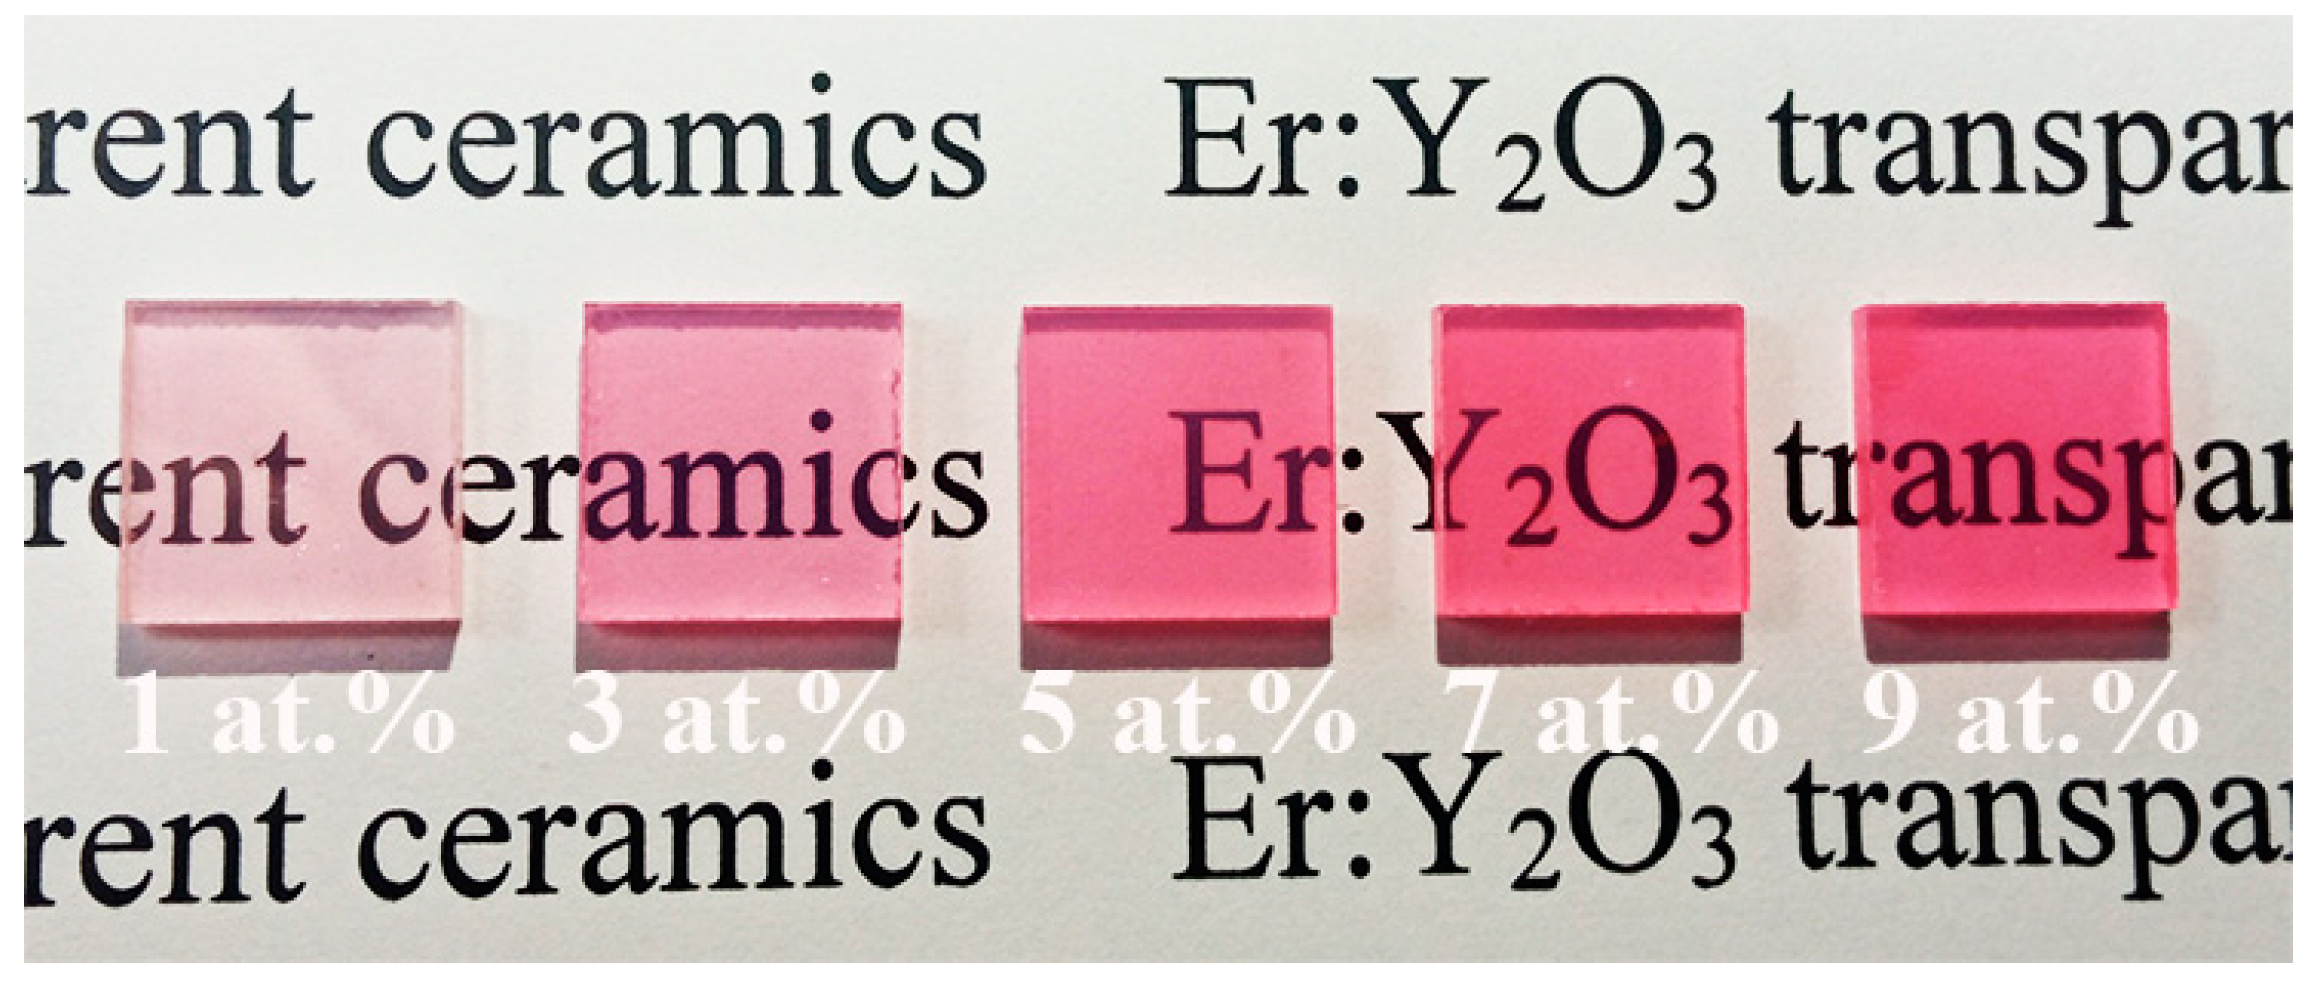
Figure 2 shows photographs of the Er:Y2O3 ceramics with various Er concentrations. Apparently the specimens were highly transparent, as the words below them can be clearly seen. In addition, the samples showed a reddish color, and the color became deeper with an increase in the Er doping concentration.
Figure 3 presents the in-line transmittance of the samples with various Er concentrations. The hot-pressed Er:Y2O3 ceramics exhibited excellent optical transparency in the near-infrared and visible regions. For the sample doped with 1 at.% Er, the transmittance rates at the wavelengths of 600 and 2700 nm were 73.7 and 82.8%, respectively. These transmittance levels are comparable to those of the Yb:Y2O3 transparent ceramics by hot pressing in our previous work [23]. Additionally, the specimens with 1, 3, and 9 at.% Er showed higher transmittance compared to the samples with 5 and 7 at.% Er, this may be due to the fact that the samples with 1, 3, and 9 at.% Er exhibited slightly higher relative densities compared to the samples with 5 and 7 at.% Er as shown in Table 1. Residual pores are known as strong light-scattering centers, which can remarkably decrease the optical transparency of transparent ceramic materials [18]. Furthermore, the absorption bands centered at 382, 525, 654, 800, 972, and 1535 nm are attributed to the transitions of Er3+ ions from the ground state of 4I15/2 to the excited states of 4G11/2, 2H11/2, 4F9/2, 4I9/2, 4I11/2, and 4I13/2, respectively [24].
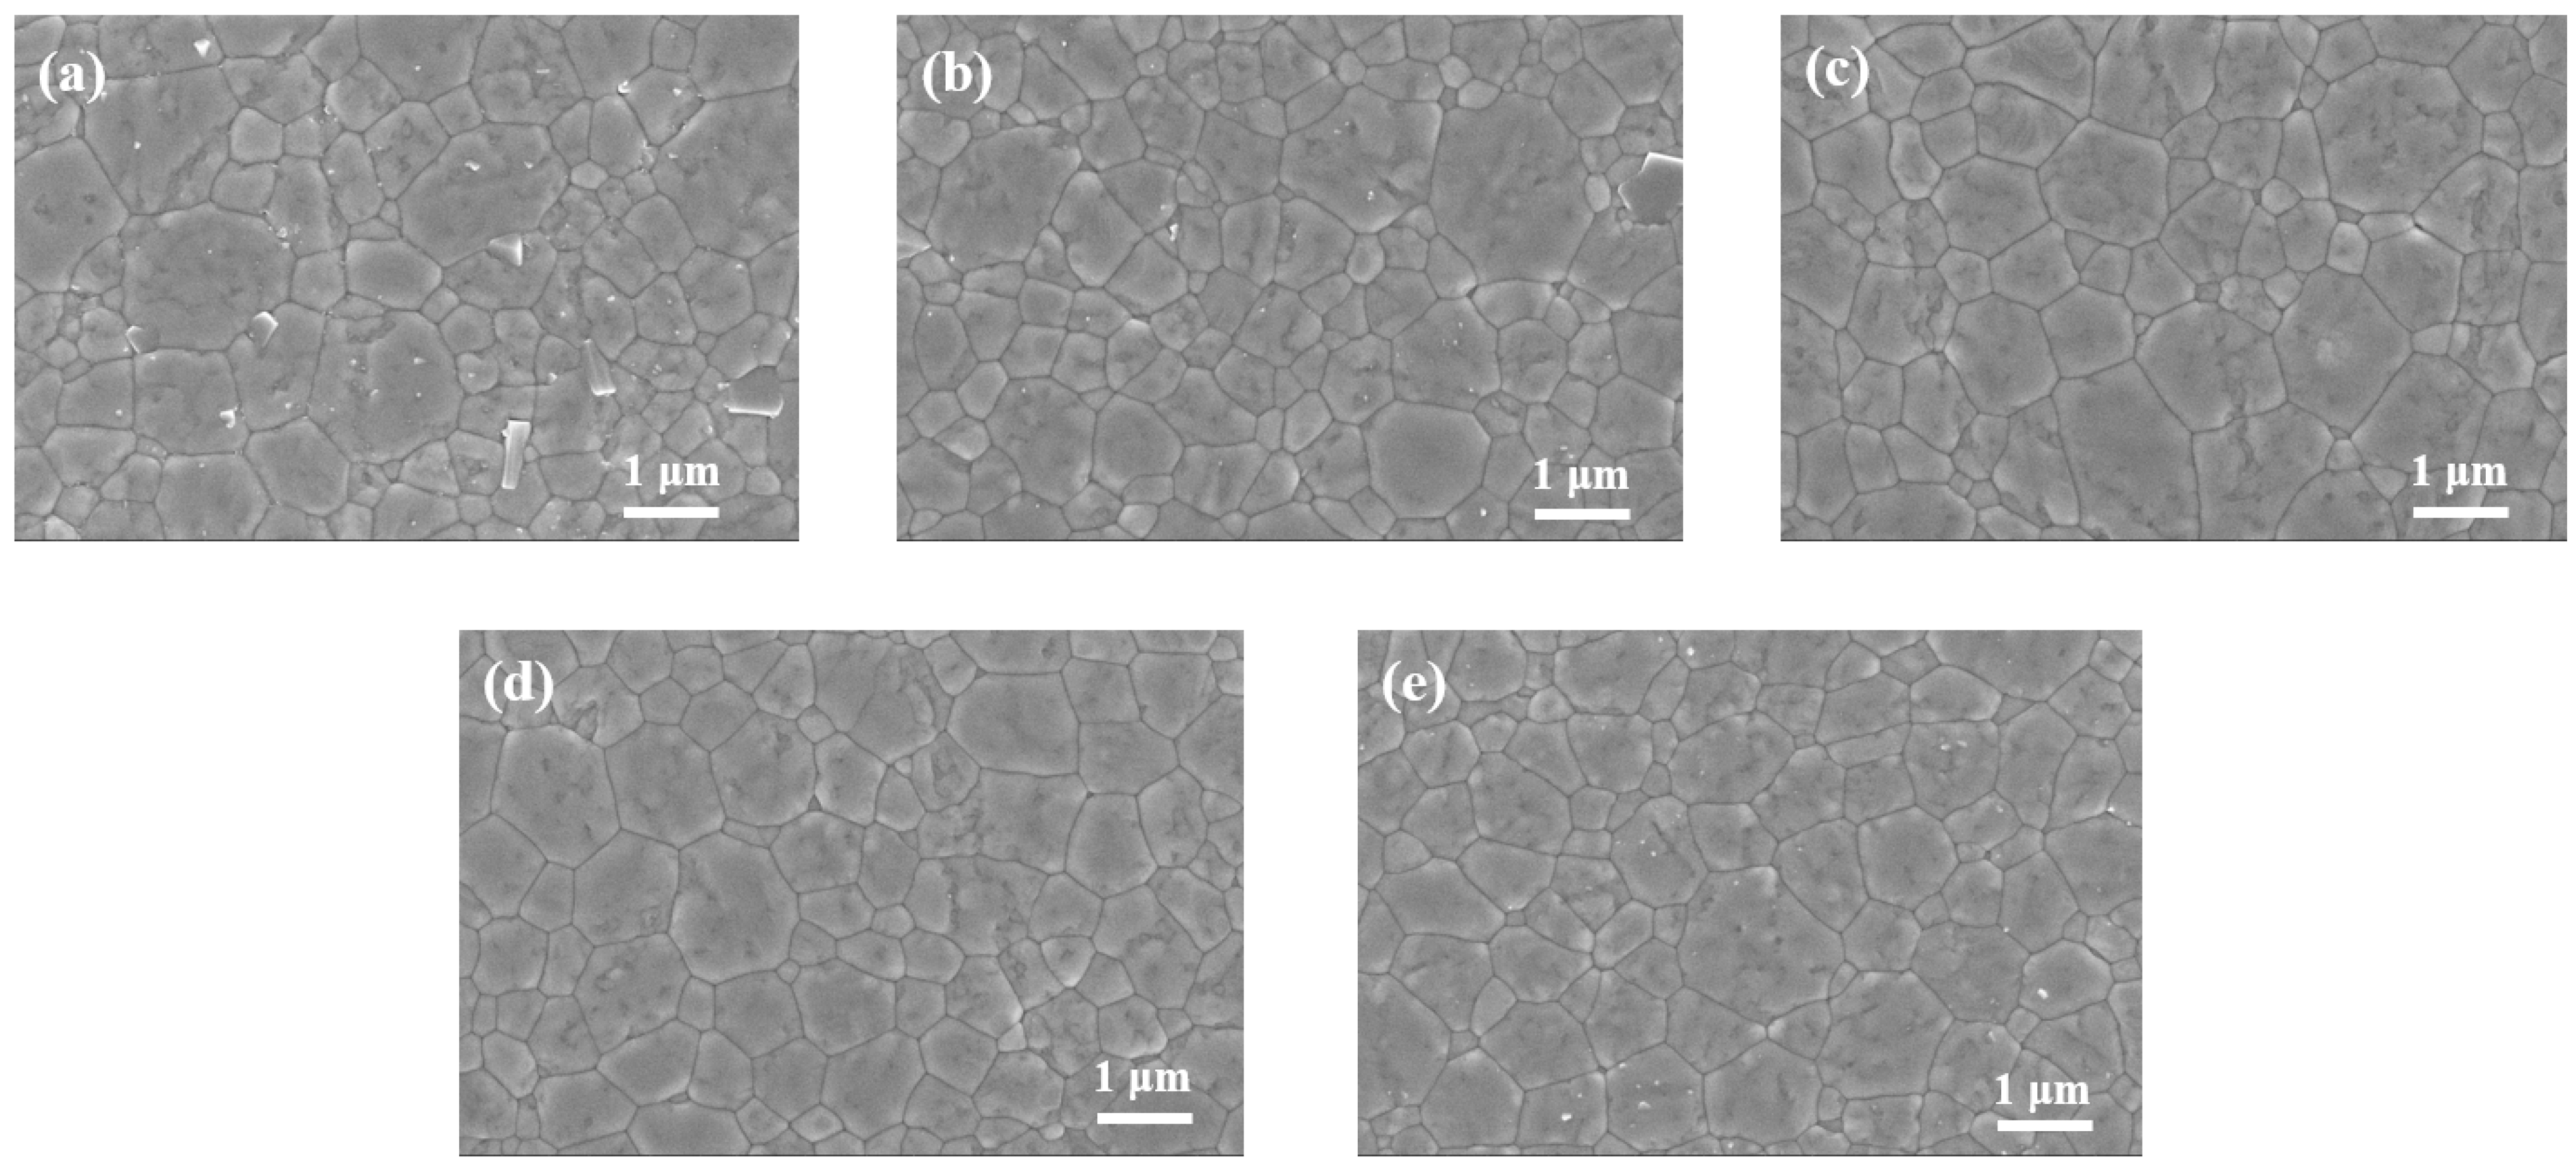
Figure 4a–e illustrate the SEM images of the Er:Y2O3 transparent ceramics doped with various Er concentrations. All samples showed dense microstructures, and no apparent residual pores were observed, which is consistent with the results of relative density (see Table 1). In addition, the average grain sizes of the present specimens (i.e., ~1 μm) are much finer compared to those of the previously reported Er:Y2O3 transparent ceramics fabricated by the pressureless sintering method (i.e., ~12.5 μm) [18]. Due to the mechanical pressure can effectively assist the densification of yttria so that the hot-pressing process can be carried out at much lower temperatures (e.g., 1600 °C) compared to the pressureless sintering route (e.g., ≥1800 °C), which can suppress the grain growth of Y2O3.
The grain size, microhardness, and fracture toughness of the samples are listed in Table 2. With an increase in the Er concentration from 1 to 9 at.%, the grain size slightly decreased from 0.85 to 0.76 µm, in turn, the microhardness increased from 8.51 to 8.63 GPa. It is well known that grain boundaries can block the dislocations generated by indenters, as a result, the microhardness of ceramic materials typically increases as the grain size decreases [25]. Meanwhile, the fracture toughness levels (i.e., ~1.03 MPa·m1/2) were not strongly affected by the doping concentration. The microhardness and fracture toughness of the present submicron-grained samples are higher compared to the large-grained Er:Y2O3 transparent ceramics by pressureless sintering (~12.5 μm in grain size, 8.05 GPa, and 0.99 MPa·m1/2) [18] owing to the much finer microstructures of the hot pressed samples.
To study the luminescent properties, the room temperature up-conversion luminescence spectra of the samples were measured under 980 nm excitation of a LD. As shown in Figure 5, all samples exhibited strong up-conversion luminescence in the visible region, which centered at 563 (green, 4S3/24I15/2) and 684 nm (red, 4F9/24I15/2). The up-conversion luminescence process occurs as follows (see Figure 6):
The green emission is generated by a two-step excitation process.
  • 4I15/24I11/2 (ground state absorption)
  • 4I11/24F7/2 (excited stated absorption)
  • 4F7/22H11/2/4S3/2 (multiphonon relaxation)
  • 2H11/2/4S3/24I15/2 (radiative relaxation)
The red emission is generated by a process including multiphonon relaxation and excited state absorption.
  • 4I15/24I11/2 (ground state absorption)
  • 4I11/24I13/2 (multiphonon relaxation)
  • 4I13/24F9/2 (excited state absorption)
  • 4F9/24I15/2 (radiative relaxation)
The intensities of these two up-conversion luminescence emissions changed with the variation of Er-doping concentration. In general, both of them became stronger as the Er concentration increased from 1 to 9 at.%, while the red light increased much more compared to the green one and the intensity ratio of the red and green emissions gradually increased from 0.3 to 2.1 (see Figure 7). The corresponding mechanism is that an increase in the concentration of the luminescent centers (i.e., Er3+) has a tendency to markedly enhance the cross-relaxation effect of 4F7/24F9/2 and 4I11/24I13/2, which increases the Er3+ population in 4F9/2 level of the red emission [15]. The insert of Figure 5 shows the digital photographs of the samples under 980 nm excitation, clearly, as the Er doping concentration increased from 1 to 9 at.%, the emission color gradually changed from green to yellow.
In addition to the up-conversion luminescence, the down-conversion emission properties of the samples were also studied. Figure 8 shows the emission spectra of the specimens over the wavelength region of 1400–1750 nm under 980 nm excitation. Strong emission bands were observed at 1552, 1573, 1639, and 1661 nm, which were attributed to the 4I13/24I15/2 transition [26]. Interestingly, the doping concentration dependence of the down-conversion luminescence was different from that of the up-conversion emission. The down-conversion intensity increased as the Er concentration increased to 5 at.%, above which the intensity decreased. According to the literature, if the Er3+ concentration is too high (e.g., 5 at.%), the lifetimes of both 4I11/2 and 4I13/2 states will be reduced, leading to a decrease in the population of 4I13/2 level, thereby decreasing the emission intensity [27].
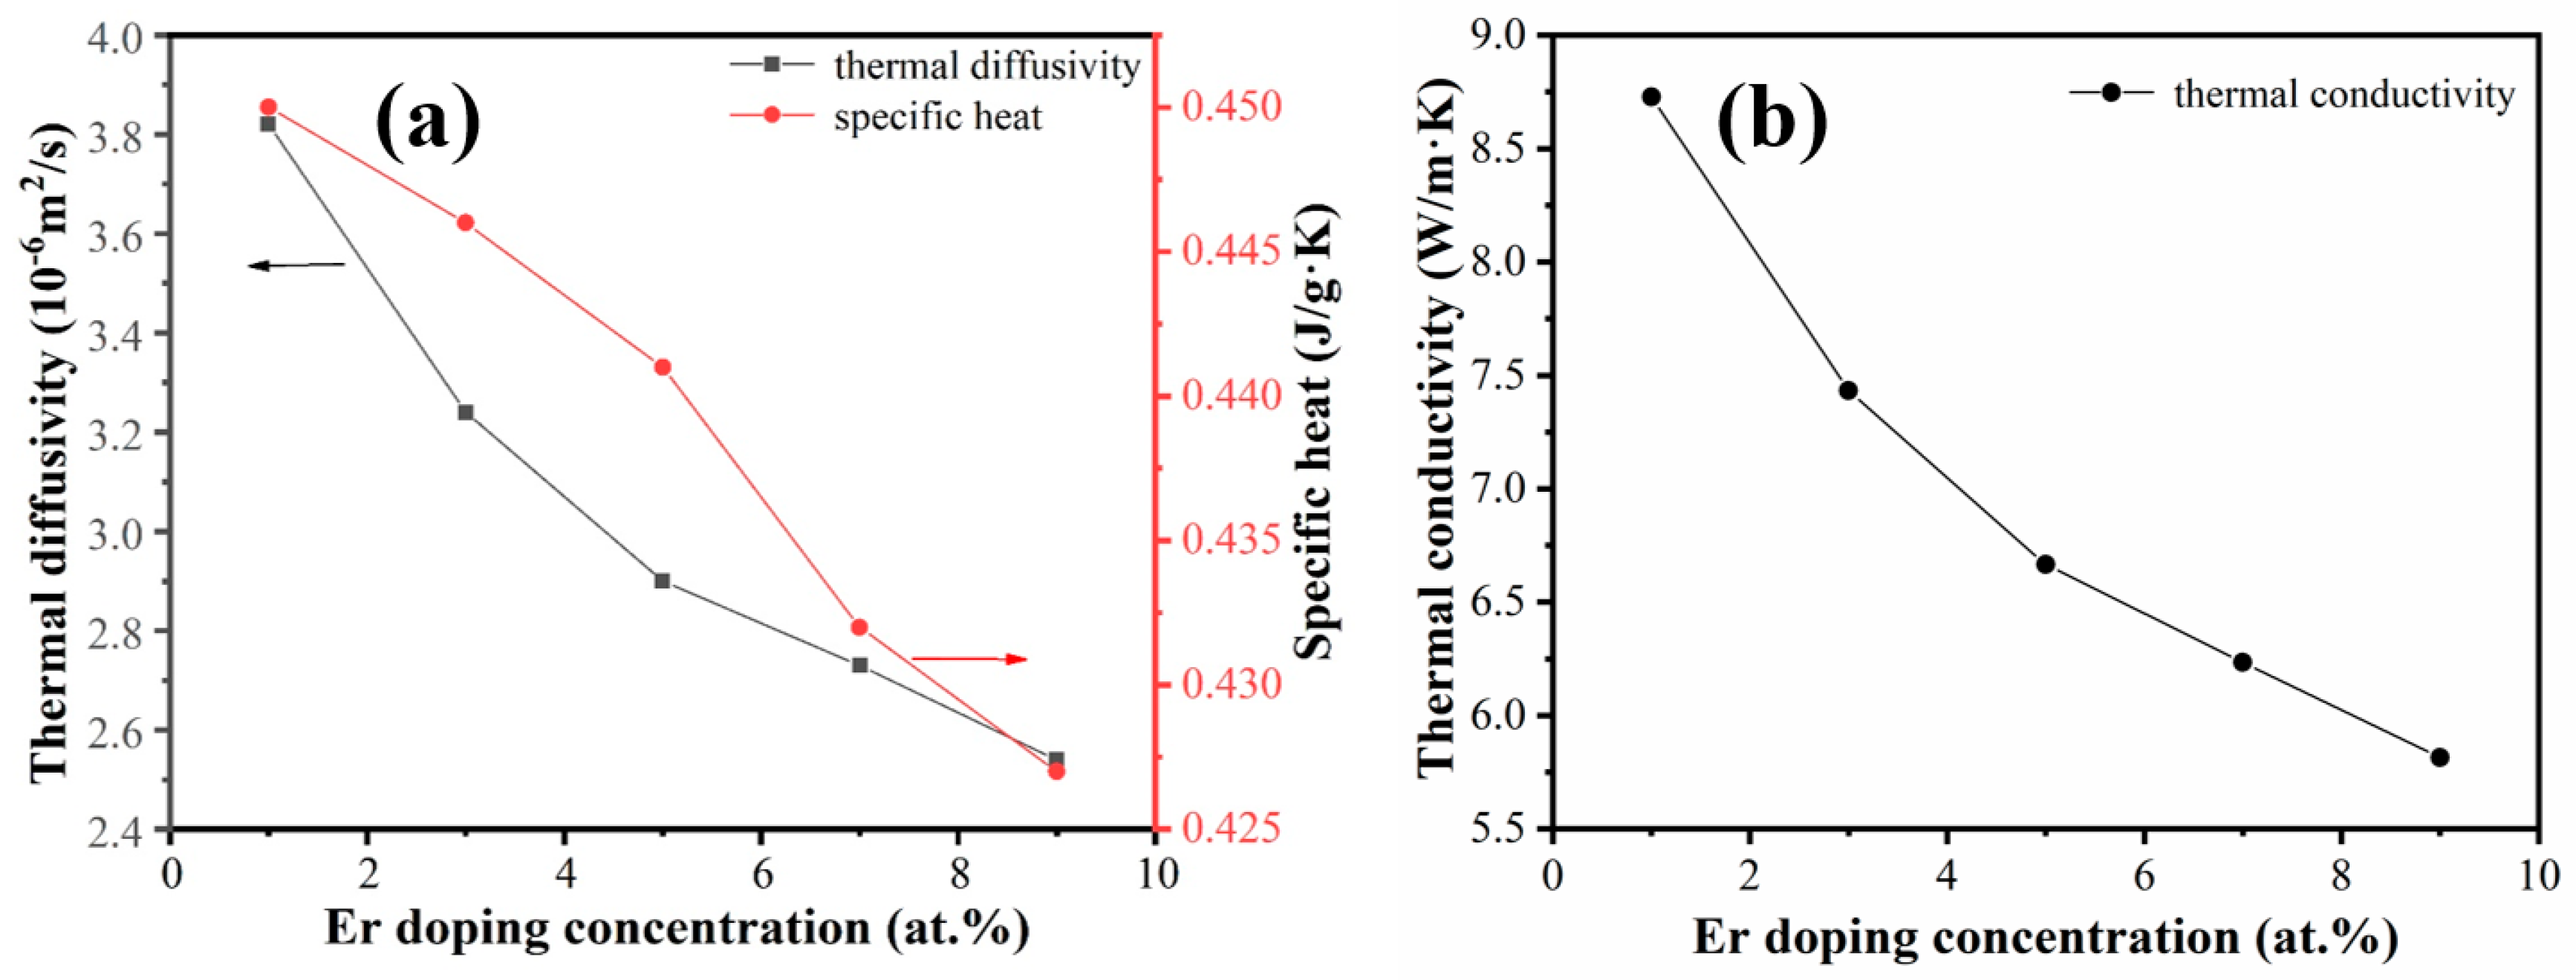
The variations of the thermal diffusivity and specific heat of the Er:Y2O3 ceramic samples as a function of the Er concentration at room temperature are presented in Figure 9a. As the Er3+ doping concentration increased from 1 at.% to 9 at.%, the thermal diffusivity of the sample decreased from 3.818 × 10⁻⁶ to 2.537 × 10⁻⁶ m2/s (decreased by 34%). On the other hand, the heat capacity was reduced by 5.1% (from 0.450 to 0.427 J/(g·K)), which was not strongly affected by the variation of the doping concentration. As a result, the thermal conductivity of the samples decreased from 8.72 to 5.81 W/(m·K). In the matrix of the Y2O3 ceramic, the heat transfer is dependent on lattice vibrations (phonon transport) [28]. When the Er3+ ions enter the lattice, structural distortion and point defects are introduced, resulting in stronger phonon scattering and a decrease in the phonon mean free path. This typically lowers the thermal conductivity of the ceramic samples. Zhu et al. [18] investigated the thermal properties of pressureless-sintered transparent Er:Y2O3 ceramic samples with concurrent addition of La2O3 and ZrO2 as sintering additives. The thermal conductivity levels of the pressureless-sintered transparent Er:Y2O3 ceramic samples were found to be much lower (i.e., ~5 W/(m·K)) compared to those the present samples, which is attributed to the higher sintering additive concentrations of the pressureless-sintered samples (i.e., 10 at.% La2O3 and 3 at.% ZrO2).

4. Conclusions

For the first time, highly transparent and submicro-grained Er:Y2O3 ceramics with various Er doping concentrations (1–9 at.%) were successfully fabricated by a hot-pressing method with 1 at.% ZrO2 as the sintering additive. Due to the relatively low sintering temperature and short holding time, submicron grain sizes were obtained, which led to better mechanical properties of the present samples compared to the pressureless sintered counterparts. The microhardness and fracture toughness of the hot pressed samples were ~8.51 GPa and ~1.03 MPa·m1/2, respectively. The present sample all exhibited high transmittance levels over the wavelength region of 400–2700 nm (e.g., ~74% at 600 nm, ~83% at 2700 nm). The up-conversion luminescence and the down-conversion emission properties of the Er:Y2O3 samples were both investigated, strong green and red up-conversion emissions were observed under the excitation of 980 nm diode laser. Meanwhile, under 980 nm excitation, strong down-conversion luminescence was also observed at 1400–1750 nm.

Author Contributions

Conceptualization, Y.L., C.L. and G.Z.; methodology, Y.L., C.L. and G.Z.; investigation, Y.L. and C.L.; writing—original draft, Y.L.; data curation, X.Q.; writing—review and editing, X.Q., L.G., G.Z. and S.W.; supervision, X.Q. and L.G.; project administration, L.G. and G.Z.; validation, J.J., T.Z., H.C. and Z.W.; funding acquisition, L.G., G.Z., T.Z., H.C. and Z.W. All authors have read and agreed to the published version of the manuscript.

Funding

This work was supported by National Natural Science Foundation of China (No. 51902093 and 52103357), Natural Science Foundation of Shanghai (No. 21ZR1473000), and Natural Science Foundation of Hubei Province (No. 2019CFB164).

Institutional Review Board Statement

Not applicable.

Informed Consent Statement

Not applicable.

Data Availability Statement

The data presented in this study are available on request from the corresponding author.

Conflicts of Interest

The authors declare that they have no known competing financial interest or personal relationship that could have appeared to influence the work reported in this paper.

References

  1. Ikesue, A.; Aung, Y.L. Ceramic laser materials. Nat. Photonics 2008, 2, 721–727. [Google Scholar] [CrossRef]
  2. Wang, L.; Huang, H.; Shen, D.; Zhang, J.; Chen, H.; Wang, Y.; Liu, X.; Tang, D. Room temperature continuous-wave laser performance of LD pumped Er:Lu2O3 and Er:Y2O3 ceramic at 2.7 μm. Opt. Express 2014, 22, 19495–19503. [Google Scholar] [CrossRef] [PubMed]
  3. Zhang, J.; Wang, S.; Rong, T.; Chen, L. Upconversion luminescence in Er3+ doped and Yb3+/Er3+ codoped yttria nanocrystalline powders. J. Am. Ceram. Soc. 2004, 87, 1072–1075. [Google Scholar] [CrossRef]
  4. Wei, G. Transparent ceramic lamp envelope materials. J. Phys. D Appl. Phys. 2005, 38, 3057. [Google Scholar] [CrossRef]
  5. Hostaša, J.; Nečina, V.; Uhlířová, T.; Biasini, V. Effect of rare earth ions doping on the thermal properties of YAG transparent ceramics. J. Eur. Ceram. Soc. 2019, 39, 53–58. [Google Scholar] [CrossRef]
  6. Kong, J.; Lu, J.; Takaichi, K.; Uematsu, T.; Ueda, K.; Tang, D.; Shen, D.; Yagi, H.; Yanagitani, T.; Kaminskii, A. Diode-pumped Yb:Y2O3 ceramic laser. Appl. Phys. Lett. 2003, 82, 2556–2558. [Google Scholar] [CrossRef]
  7. Lu, J.R.; Murai, T.; Takaichi, K.; Uematsu, T.; Ueda, K.-I.; Yagi, H.; Yanagitani, T.; Kaminskii, A. Nd3+:Y2O3 Ceramic Laser. Jpn. J. Appl. Phys. 2001, 40, L1277. [Google Scholar]
  8. Shen, Y.; Li, E.; Wang, J.; Tang, D.; Shen, D. Stable Q-switched mode-locking of an in-band pumped Ho: Y2O3 ceramic laser at 2117 nm. Quantum Electron. 2021, 51, 41. [Google Scholar] [CrossRef]
  9. Sanamyan, T. Diode pumped cascade Er:Y2O3 laser. Laser Phys. Lett. 2015, 12, 125804. [Google Scholar] [CrossRef]
  10. Fleischman, Z.D.; Sanamyan, T. Spectroscopic analysis of Er3+: Y2O3 relevant to 2.7 µm mid-IR laser. Opt. Mater. Express 2016, 6, 3109–3118. [Google Scholar] [CrossRef]
  11. Kokuoz, B.Y.; Serivalsatit, K.; Kokuoz, B.; Geiculescu, O.; McCormick, E.; Ballato, J. Er-Doped Y2O3 Nanoparticles: A Comparison of Different Synthesis Methods. J. Am. Ceram. Soc. 2009, 92, 2247–2253. [Google Scholar] [CrossRef]
  12. Sanamyan, T.; Simmons, J.; Dubinskii, M. Er3+-doped Y2O3 ceramic laser at ~2.7 μm with direct diode pumping of the upper laser level. Laser Phys. Lett. 2010, 7, 206. [Google Scholar] [CrossRef]
  13. Yanmin, Q.; Hai, G. Upconversion properties of Y2O3: Er films prepared by sol-gel method. J. Rare Earths 2009, 27, 406–410. [Google Scholar]
  14. Onodera, Y.; Nunokawa, T.; Odawara, O.; Wada, H. Upconversion properties of Y2O3: Er, Yb nanoparticles prepared by laser ablation in water. J. Lumin. 2013, 137, 220–224. [Google Scholar] [CrossRef] [Green Version]
  15. Capobianco, J.A.; Vetrone, F.; Boyer, J.C.; Speghini, A.; Bettinelli, M. Enhancement of red emission (4F9/24I15/2) via upconversion in bulk and nanocrystalline cubic Y2O3: Er3+. J. Phys. Chem. B 2002, 106, 1181–1187. [Google Scholar] [CrossRef]
  16. Vetrone, F.; Boyer, J.-C.; Capobianco, J.A.; Speghini, A.; Bettinelli, M. Concentration-dependent near-infrared to visible upconversion in nanocrystalline and bulk Y2O3: Er3+. Chem. Mater. 2003, 15, 2737–2743. [Google Scholar] [CrossRef]
  17. Zhang, J.; .Wang, S.W.; An, L.; Liu, M.; Chen, L. Infrared to visible upconversion luminescence in Er3+: Y2O3 transparent ceramics. J. Lumin. 2007, 122, 8–10. [Google Scholar] [CrossRef]
  18. Zhu, L.L.; Park, Y.-J.; Gan, L.; Go, S.-I.; Kim, H.-N.; Kim, J.-M.; Ko, J.-W. Fabrication and characterization of highly transparent Er: Y2O3 ceramics with ZrO2 and La2O3 additives. Ceram. Int. 2017, 43, 13127–13132. [Google Scholar] [CrossRef]
  19. Yin, D.; Wang, J.; Wang, Y.; Liu, P.; Ma, J.; Xu, X.; Shen, D.; Dong, Z.; Kong, L.B.; Tang, D. Fabrication of Er: Y2O3 transparent ceramics for 2.7 μm mid-infrared solid-state lasers. J. Eur. Ceram. Soc. 2020, 40, 444–448. [Google Scholar] [CrossRef]
  20. Chu, X.; Gan, L.; Ren, S.Q.; Wang, J.; Ma, Z.; Jiang, J.; Zhang, T.J. Low-loss and temperature-stable (1 − x) Li2TiO3–xLi3Mg2NbO6 microwave dielectric ceramics. Ceram. Int. 2020, 46, 8413–8419. [Google Scholar] [CrossRef]
  21. Cesar, P.F.; Della Bona, A.; Scherrer, S.S.; Tholey, M.; van Noort, A.; Vichi, A.; Kelly, R.; Lohbauer, U. ADM guidance—Ceramics: Fracture toughness testing and method selection. Dent. Mater. 2017, 33, 575–584. [Google Scholar] [CrossRef] [PubMed]
  22. Shannon, R.D. Revised effective ionic radii and systematic studies of interatomic distances in halides and chalcogenides. Acta Crystallogr. Sect. A Cryst. Phys. Diffr. Theor. Gen. Crystallogr. 1976, 3, 751–767. [Google Scholar] [CrossRef]
  23. Liu, C.R.; Zhou, G.H.; Jiang, J.; Hu, S.; Zhang, T.J.; Wang, S.W.; Xue, Z.H.; Lin, H.; Qin, X.P.; Gan, L. Fabrication and luminescence properties of highly transparent and submicrometer-grained Yb: Y2O3 ceramics by hot-pressing sintering. J. Alloys Compd. 2022, 898, 163002. [Google Scholar] [CrossRef]
  24. Wang, L.; Huang, H.; Shen, D.; Zhang, J.; Chen, H.; Tang, D. Diode-pumped high power 2.7 μm Er: Y2O3 ceramic laser at room temperature. Opt. Mater. 2017, 71, 70–73. [Google Scholar] [CrossRef]
  25. Gan, L.; Park, Y.-J.; Zhu, L.L.; Go, S.-I.; Kim, H.; Kim, J.-M.; Ko, J.-W. Fabrication and properties of La2O3-doped transparent yttria ceramics by hot-pressing sintering. J. Alloys Compd. 2017, 695, 2142–2148. [Google Scholar] [CrossRef]
  26. Gheorghe, C.; Georgescu, S.; Lupei, V.; Lupei, A.; Ikesue, A. Absorption intensities and emission cross section of Er3+ in Sc2O3 transparent ceramics. J. Appl. Phys. 2008, 103, 083116. [Google Scholar] [CrossRef]
  27. Xue, Y.L.; Zhu, F.; Wang, J.; Sun, S.; Hu, L.; Tang, D. Fabrication and comprehensive structural and spectroscopic properties of Er: Y2O3 transparent ceramics. J. Rare Earths 2022, 40, 1913–1919. [Google Scholar] [CrossRef]
  28. Zhang, L.; Pan, W. Structural and thermo-mechanical properties of Nd:Y2O3 transparent ceramics. J. Am. Ceram. Soc. 2015, 98, 3326–3331. [Google Scholar] [CrossRef]
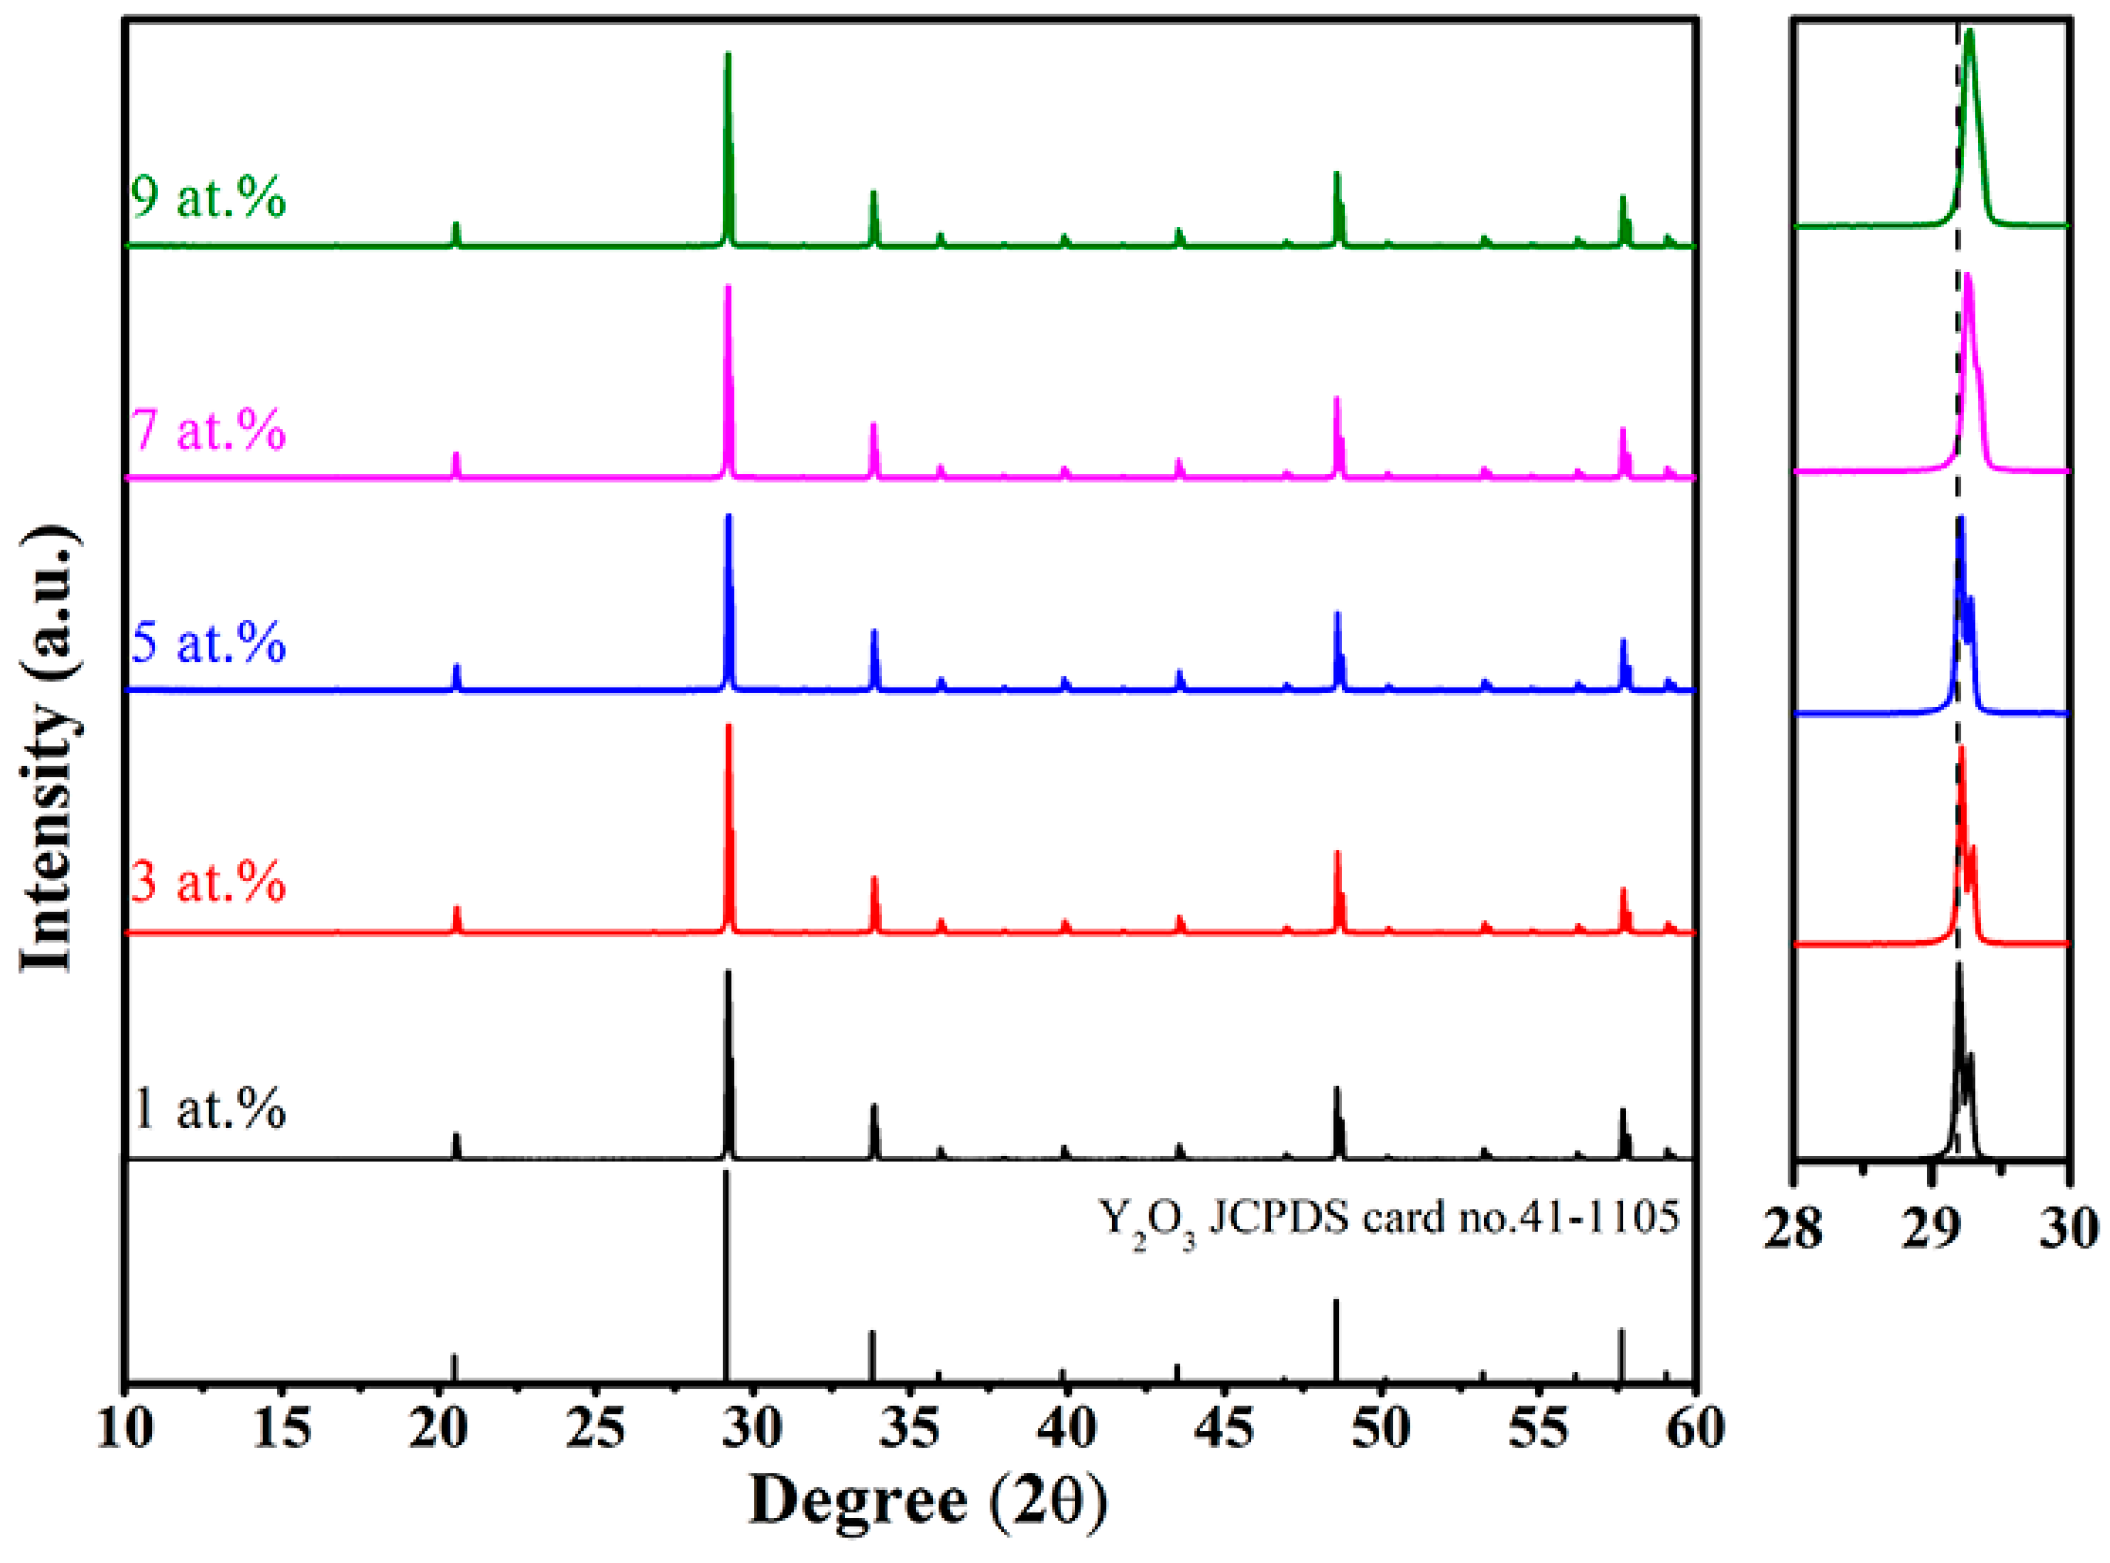
Figure 1. XRD patterns of the Er:Y2O3 ceramics with various Er concentrations.
Materials 16 04504 g001
Figure 2. Photographs of the Er:Y2O3 ceramic samples with various Er concentrations (2 mm thick).
Materials 16 04504 g002
Figure 3. In-line transmittance of the samples with various Er concentrations.
Materials 16 04504 g003
Figure 4. SEM images of the samples with (a) 1, (b) 3, (c) 5, (d) 7, amd (e) 9 at.% Er.
Materials 16 04504 g004
Figure 5. Room temperature up-conversion luminescence spectra of the samples excited by 980 nm laser, the insert shows the digital photographs of the samples under excitation.
Materials 16 04504 g005
Figure 6. The up-conversion mechanism of Er:Y2O3 transparent ceramics under the excitation of 980 nm diode laser.
Materials 16 04504 g006
Figure 7. Intensity ratio of the red and green (R/G) emissions of the samples as a function of Er concentration.
Materials 16 04504 g007
Figure 8. Down-conversion emission spectra of the Er:Y2O3 ceramics in the region of 1400–1750 nm.
Materials 16 04504 g008
Figure 9. (a) Thermal diffusivity and specific heat and (b) thermal conductivity of the Er:Y2O3 transparent ceramics with various Er concentrations.
Materials 16 04504 g009
Table 1. The structural parameters and densities of the samples with various Er concentrations.
Samples (at.%)Lattice Parameters a = b = c (nm)Unit Cell Volume (nm3)Calculated Theoretical Density (g/cm3)Bulk Density (g/cm3)Relative Density (%)
11.060011.191045.07855.077 ± 0.00799.97
31.059931.190795.14955.143 ± 0.01299.87
51.059891.190665.22015.212 ± 0.00599.84
71.059581.189605.29475.286 ± 0.01099.84
91.059431.189105.36705.361 ± 0.00699.88
Table 2. Grain size, microhardness, and fracture toughness of the samples with various Er concentrations.
Er Concentration (at.%)Grain Size (μm)Microhardness (GPa)Fracture Toughness (MPa·m1/2)
10.85 ± 0.418.51 ± 0.031.03 ± 0.02
30.81 ± 0.378.53 ± 0.051.02 ± 0.01
50.82 ± 0.388.57 ± 0.141.03 ± 0.03
70.77 ± 0.348.59 ± 0.091.04 ± 0.01
90.76 ± 0.328.63 ± 0.081.05 ± 0.01
Disclaimer/Publisher’s Note: The statements, opinions and data contained in all publications are solely those of the individual author(s) and contributor(s) and not of MDPI and/or the editor(s). MDPI and/or the editor(s) disclaim responsibility for any injury to people or property resulting from any ideas, methods, instructions or products referred to in the content.