Article

Incorporating Industrial By-Products into Geopolymer Mortar: Effects on Strength and Durability

1
Faculty of Civil Engineering, Hanoi University of Mining and Geology, 18 Pho Vien, Duc Thang, Hanoi 100000, Vietnam
2
Department of Bridge and Tunnel, Faculty of Civil Engineering, University of Transport Technology, 54 Trieu Khuc, Thanh Xuan, Hanoi 100000, Vietnam
3
Civil and Environmental Engineering Program, Graduate School of Advanced Science and Engineering, Hiroshima University, 1-4-1, Kagamiyama, Higashi-Hiroshima, Hiroshima 739-8527, Japan
*
Author to whom correspondence should be addressed.
Materials 2023, 16(12), 4406; https://doi.org/10.3390/ma16124406
Submission received: 25 May 2023 / Revised: 11 June 2023 / Accepted: 12 June 2023 / Published: 15 June 2023

Abstract

:
In recent years, the reuse of industrial waste has become increasingly important for sustainable development. Therefore, this study investigated the application of granulated blast furnace slag (GBFS) as a cementitious replacement material in fly-ash-based geopolymer mortar containing silica fume (GMS). The performance changes in the GMS samples manufactured with different GBFS ratios (0–50 wt%) and alkaline activators were evaluated. The results indicated that GBFS replacement from 0 wt% to 50 wt% significantly affects GMS performance, including improving the bulk density from 2235 kg/m3 to 2324 kg/m3, flexural-compressive strength from 5.83 MPa to 7.29 MPa and 63.5 MPa to 80.2 MPa, respectively; a decrease in water absorption and chloride penetration, and an improvement in the corrosion resistance of GMS samples. The GMS mixture containing 50 wt% GBFS demonstrated the best performances with notable results regarding strength and durability. Owing to the increased production of C-S-H gel, the microstructure of the GMS sample containing more GBFS was denser, as obtained via the scanning electron micrograph analysis results. Incorporating the three industrial by-products into geopolymer mortars was verified when all samples were determined to be in accordance with the relevant Vietnamese standards. The results demonstrate a promising method to manufacture geopolymer mortars that aid sustainable development.

1. Introduction

Concrete is a widely used material because of its advantageous structural qualities [1,2,3]. It is used in numerous constructed objects, such as buildings, bridges, highways, and dams. According to the United States Geological Survey, approximately 4.2 billion tons of ordinary Portland Cement (OPC) were produced globally in 2021, with an expected increase to 4.4 billion tons by the end of 2022 [4]. However, this material poses severe environmental issues related to pollution that precedes global warming. For instance, substantial temperatures—approximately 1400 °C—are necessary for cement production with high energy dispersion and emissions. It was reported that cement production (i.e., OPC) accounts for 5–9.5 percent of all CO2 emissions [5]. Thus, there is a pressing need to identify an environmentally preferable alternative to conventional concrete to decrease CO2 emissions [6,7].
Recent breakthroughs in materials sciences have centred on creating geopolymer concrete as an alternative to traditional concrete [8,9,10]. In theory, geopolymers are the result of alkali activation of any aluminosilicate substance. They have a three-dimensional aluminosilicate network structure and binding properties comparable to those of standard Portland cement (OPC). Compared to OPC, geopolymer concrete (GPC) performs more sustainably and robustly [8,11,12]. The development of GPC offers two key benefits. The first is the decline in the demand for OPC and other concrete types, which would substantially reduce CO2 emissions while preserving the performance (i.e., high tensile strength and better thermal insulation properties) [11,13]. The second advantage is the potential use of easily available industrial/agricultural by-products and building wastes, such as granulated blast furnace slag (GBFS) and fly ash (FA), which contribute to landfill waste [14,15].
Incorporating FA into geopolymer concrete offers a novel, beneficial, and environmentally friendly solution for waste material use while minimising the associated adverse effects on the environment and ecosystem [12,16]. FA-based geopolymers may be utilised as green cement with efficient use of natural resources because they often exhibit mechanical strength and durability that are almost on par with hydrated Portland cement [17,18,19]. However, incorporating FA into geopolymer concrete has a main disadvantage related to the low reactivity of FA-based geopolymers [20]. The low-reactivity process leads to slow setting and strength development. In addition, fly ash’s mullite and quartz contents remain unreacted during the process and are dissolved in an alkali-activator solution [21,22].
To address these problems, two different approaches have been investigated. The first uses the mechanical processing of FA, such as fine grinding and mechanical activation. Prior research has been conducted to determine how the mechanical processing of FA affects the reactivity and polymerisation of the substance [23,24]. Incorporating GBFS into FA-based geopolymers can happen differently depending on curing temperatures. At normal temperatures, the reaction is dominated by the dissolution and precipitation of CaO-SiO2-H2O (C–S–H) gel due to the alkali activation of GBFS. There is only a small interaction of FA and GBFS, probably due to the different kinetics of the dissolution process and species distribution. The improvement in setting time and compressive strength can be explained by forming cementitious C–S–H gel, which improved the setting and hardening of the geopolymer [25,26]. The geopolymerisation at high temperatures (e.g., 60 °C) is dominated by the combined interaction of fly ash and GBFS. This interaction is substantiated by the coexistence of C–S–H and Al2O3-SiO2-H2O (A–S–H) gel in the reaction products. The improvement in compressive strength with slag addition may be attributed to the formation of gel phases (C–S–H and A–S–H) and the compactness of microstructure [14,27,28]. In other words, the combination of GBFS and silica fume (SF) under high temperatures could improve the reactivity and polymerisation of FA [27,29,30] and is the main approach of the present study.
When applied to alkali-activated materials, GBFS acts as a precursor for calcium-rich aluminosilicates, enhancing properties such as compressive strength, density, and sulphate resistance [31,32]. Its inclusion in cement can reduce porosity and improve corrosion resistance. Studies have shown that GBFS positively affects sulphate resistance in concrete by reducing 3CaO·Al2O3 concentration and soluble Ca(OH)2, with the concentration of GBFS and sulphate resistance being positively correlated [33,34]. SF is a by-product of ferrosilicon production. It has an extremely fine particle size and is mostly used as a filler. It is a highly reactive pozzolanic material because it contains significant amorphous silicon dioxide. In addition to increasing the strength, the use of SF improves the cohesion between the binder and aggregates, owing to its tiny particle size. Thus, this reduces the mixture’s bleeding rate and segregation potential in its fresh form [35,36].
In the past few decades, GBFS and FA have been widely employed as supplemental materials to mitigate the negative environmental impacts of the concrete industry [37,38]. Approximately 450 million tons of FA and 530 million tons of GBFS are manufactured annually globally [37,39]. Between 25 and 65 percent of the FA and GBFS produced were reportedly recycled and reused [34,40]. Vietnam has approximately 20 thermal power plants, producing approximately 67.3 million tons of coal ash annually. The new plants presently being built are predicted to bring the total amount of coal consumed to 171 million tons, generating an enormous amount of FA by 2030 [41]. Each year, approximately 3 million tons of GBFS are produced by blast furnace pig iron companies in Vietnam [42]. Vietnam’s significant yearly FA output has recently been considered a potential commodity supply. Unfortunately, FA and GBFS are used less frequently in Vietnam and are typically disposed of in landfills, resulting in the loss of raw materials and negatively affecting the environment and human health. Thus far, in Vietnam, although several construction products utilising FA and GBFS as their primary binder materials have been reported [7,38,43], the potential to incorporate such materials into geopolymer mixtures containing silica fume has not yet been investigated.
Therefore, this study investigates the performance of a fly ash-based geopolymer mortar utilising the following Vietnamese by-products: FA, GBFS, and SF. The changes in the slump, compressive strength, density, water absorption, chloride resistance, and corrosion resistance of fly ash-based geopolymer mortar containing silica fume (GMS) were investigated. In addition, alkaline activators (i.e., 10 M sodium hydroxide and sodium silicate solutions) and initial heat curing (60 ± 5 °C) were applied to enhance the mortars’ performance. Based on the acquired data, the changes in these qualities and their relationships were subsequently determined and analysed.

2. Experimental Program

2.1. Experimental Variables

To investigate the feasibility of local GBFS, FA, and SF, the development of the slump flow, flexural strength, compressive strength, density, water absorption, chloride resistance, and corrosion resistance of fly ash-based geopolymer mortar with silica fume (GMS) was tracked (see Table 1).

2.2. Materials

The properties of the materials utilised were assessed in the laboratory in accordance with the relevant standards’ prescriptions. Fine aggregates for GMS mixes were Red River quartz sands (QS) (Hanoi-Vietnam) (Figure 1a), which complied with the TCVN 7570:2006 standard [44] with a fineness modulus and specific gravity of 3.0 and 2.65 g/cm3, respectively. Alumino-silicate materials (ASM) included class F fly ash (FA) taken at the thermal power plant “Vung Ang-Ha Tinh-Vietnam” (as per ASTM C618 [45]) (Figure 1b); granulated blast furnace slag (GBFS) of the Hoa Phat iron and steel factory “Hoa Phat–Hai Duong–Vietnam” (Figure 1c), and silica fume SF-90 (SF-90) from “Vina Pacific Co., Ltd., Hanoi, Vietnam” (Figure 1d).
Table 2 displays the physical characteristics and chemical compositions of FA, GBFS, and SF-90 using the Rietveld refinement with XRD [46] and X-ray fluorescence analysis, (Empyrean model manufactured by a PANalytical instrument, Almelo, The Netherlands), respectively. The FA was primarily comprised of SiO2 (54.32 wt%), Al2O3 (25.47 wt%), and CaO (4.65 wt%); the main components of GBFS were SiO2 (36.3 wt%), Al2O3 (17.97 wt%), and CaO (40.1 wt%), while those of SF-90 were SiO2 (91.33 wt%) and Al2O3 (1.24 wt%). Table 2 shows that the glass contents of FA, GBFS, and SF-90 were 43 wt%, 93 wt%, and 95 wt%, respectively. It also indicates that rising GBFS corresponds to rising CaO and overall amorphous phase contents. The relatively high glass contents of SF-90 and GBFS may be expected to positively affect the strength and microstructural characterisation of the geopolymers.
Figure 2 displays the FA, SF-90, and GBFS particle morphologies by using scanning electron microscopy (JEOL JSM-6390LV, Tokyo, Japan). Herein, FA particles were mostly spherical (Figure 2a) and SF-90 had particles of irregular shape with nano-sized grains (Figure 2b), whereas particles of the GBFS were angular and irregular in shape (Figure 2c). In agreement with Table 2, SEM indicated that the grain size of SF-90 was significantly smaller than that of FA and GBFS.
The X-ray diffraction (XRD) patterns of FA, GBFS, and SF-90 produced with a “D2-PHASER” X-ray diffractometer employing Cu-Kα radiation (Tokyo, Japan) are depicted in Figure 3. A non-crystalline phase existed in the GBFS and SF-90 structures, whereas a high content of quartz and mullite was observed in FA.
In addition, the alkali-activator solution was a mixture of Na2SiO3 and NaOH solutions. Sodium hydroxide solids with 98.5% purity (Viet-Nhat Co., Ltd., Hanoi, Vietnam) were produced by dissolving the NaOH flakes in water to the desired molarity. The sodium hydroxide solution had a molarity of 10 M and a specific gravity of 1.40 g/cm3. The composition of the 10 M NaOH solution was 31.4 wt% and water 68.8 wt%. Sodium silicate was used in the liquid form. The Na2SiO3 (Viet-Nhat Co., Ltd.) has a specific gravity of 1.55 g/cm3, a molar ratio (SiO2/Na2O) of 2.5, and compositions of 29.50 wt% SiO2, 11.80 wt% Na2O, and 58.70 wt% H2O. The chemical and physical properties of the sodium silicate solution are presented in Appendix A.
The SR-5000F “SilkRoad” (Hanoi-Korea Co., Ltd., Hanoi, Vietnam) was used as the superplasticiser admixture (SP). The specific gravity of the SP was 1.12 g/cm3, confirmed by the Vietnamese standard TCVN 8826:2011 [47]. According to the Vietnamese standard TCVN 4506:2012, tap water (W) was utilised to prepare sodium hydroxide solution and cure FA alkali-activated mortar specimens [48]. Herein, the presence of SR-5000F and the minimum amount of water were designed to mitigate the flash setting problem and increase the workability of the FA-based geopolymer mortars containing GBFS [27,49,50]. The steel reinforcement for corrosion resistance was normal Vietnamese steel bars (Thainguyen Tisco Co., Ltd., Hanoi, Vietnam) with a diameter of 10 mm and modulus of elasticity of 20 (GPa).

2.3. Mixture Proportions

According to Li et al. [51] and the absolute volume technique, the compositions of the FA alkali-activated mortar mixtures were estimated [52]. The fly ash-based geopolymer mortars were made specifically according to the following principles: the sodium silicate solution to sodium hydroxide solution ratio of 2.0 for all mixes, as referred to in a prior study, and the liquid-to-alumino-silicate materials (L/ASM) ratio of 0.35 by mass (ASM = FA + SF-90 + GBFS) [51,53,54]. The sodium hydroxide solution was first prepared by combining water and 98.5% pure NaOH flakes. The utilised sodium hydroxide solution had a 10M molarity. Sodium silicate was then added to this solution, which was allowed to cool to ambient temperature for 24 h.
To examine the effect of GBFS on the performance of GMS, it was used to replace 0%, 10%, 20%, 30%, 40%, and 50% of FA by weight to make GMS samples named GMS00, GMS10, GMS20, GMS30, GMS40, and GMS50, respectively. Silica fume was used as the modifier and was equal to 10% by weight of ASM. The relative volume of entrapped air in 1 m3 of mortar was 2.0% [31,32,55]. For all fly ash alkali-activated mortar mixes, a quartz sand to alumino-silicate material ratio (QS/ASM) of 1.30 was maintained [27,30]. The superplasticiser SR-5000F SilkRoad included 1.0 wt% by weight of ASM [13,14,53]. Details of the GMS mixture proportions used in this study are listed in Table 3.
Notably, the water included in the NaOH 10M and Na2SiO3 solutions was used to calculate the mix percentage (Table 3) (no extra water was added to the mixtures).
The SiO2/Al2O3, CaO, SiO2, and glass contents in the GMS samples are displayed in Appendix B. Here, the individual contributions from FA, SF-90, and GBFS were also used to indicate the overall glass content. The SiO2/Al2O3 ratio was maintained in the vicinity of 2.5, with an increase in GBFS quantity from 0 wt% to 50 wt%, which is characteristic of the structure of geopolymer materials [32]. Furthermore, an increase in the GBFS concentration corresponds to an increase in CaO and the overall glass content.

2.4. Samples Preparation

The GMS samples were prepared in the following two processes: first, the raw components were dry-mixed until homogenous mixtures were achieved; next, an alkali-activator solution was added to the dry powder and mixed for 3–5 min. The workability of the mortar mixture was assessed and placed into the corresponding molds. The beams (40 × 40 × 160 mm) were then cast for compressive and flexural strength and water absorption tests, while cylindrical samples (100 × 200 mm) were cast for chloride penetration and accelerated corrosion tests.
To promote the combined interaction of FA and GBFS, the molded samples were sealed in airtight bags and placed in a hot oven at 60 ± 5 °C and at 70% relative humidity for six hours [56,57]. After 24 h of heat curing, all the samples were demoded and subjected to normal maintenance (temperature of 25 ± 2 °C and humidity of approximately 90%) until testing. Herein, the two-stage curing cycle was used to avoid the overlapping of the dissolution–precipitation reaction at ambient temperature (25 ± 2 °C) and geopolymerisation reactions at heat curing (60 ± 5 °C).

2.5. Test Methods

The GMS samples underwent tests for slump flow, compressive strength, density, water absorption, chloride resistance, and corrosion resistance in line with the appropriate Vietnamese requirements to examine engineering qualities and long-term performance. The test results at each age were determined by calculating the arithmetic means for the three GMS samples. The microstructural properties of the materials were also examined (SEM model QUANTA 450, Tokyo, Japan). The following provides a detailed description of each test method.

2.5.1. Slump Flow and Bulk Density

The slump flow of the GMS samples was examined immediately and 15 and 30 min after mixing to check the workability. A mini-slump cone with dimensions of 100 × 70 × 60 mm was used in accordance with TCVN 3121-3:2003 [58]. Fresh GMS mortar was poured into a steel plate slump cone. The slump cone was elevated vertically, and the mortar flowed out freely. The maximum and orthogonal diameters were determined, and the mean of the three diameters was reported as the final slump flow value.
The bulk density ( ρ G M S ) was calculated via its weight (i.e., with a 1000 mL container) using Equation (1) [59].
ρ G M S = m G M S 1 × 10 3
where ρ G M S denotes the bulk density of fresh GMS, kg/m3; m G M S is the weight of fresh mortar (kg).

2.5.2. Compressive and Flexural Strength

According to TCVN 6016:2011, compressive tests were performed on beam samples (40 × 40 × 160 mm) [60]. Using a 500T computer-controlled compression test (ADVANTEST9-Control—Italy), the experiment was conducted at 1, 3, 7, 14, 28, 56, and 90 d with a constant loading rate of 2400 ± 200 N/s. The flexural strength of the GMS was measured using beam specimens (40 × 40 × 160 mm) with a loading rate of 50 ± 10 N/s, as per the standard TCVN 6016:2011. The test was performed after 28 d of curing, and the average flexural strength of the three specimens was reported.

2.5.3. Water Absorption

The water absorption of the GMS specimens was determined according to TCVN 3113:1993 at an age of 28 d [61]. The test procedures included the following: (1) measuring the dry weight (m0) after oven drying to a constant weight; (2) immersing in water for 24 h at 27 ± 2 °C; (3) checking the saturated weight (m1); and (4) calculating the water absorption using Equation (2).
W % = m 1 m 0 m 0 × 100 %

2.5.4. Chloride Penetration

According to TCVN 9337:2012, the permeability of chloride ions in the structure of GMS samples was assessed [62] at 28 d of curing age. This technique measures the amount of electrical energy that passes through a cylindrical GMS sample with a diameter of 100 mm and a height of 50 mm over the course of 6 h. In addition, the total electrical energy that passed through the GMS sample under test was estimated in Coulombs (C).

2.5.5. Accelerated Corrosion Test

The test procedures were in accordance with NT BUILD 356 [63]. The approach under consideration aims for an expedited evaluation of the degree of protection against corrosion in mortar constructions operating in demanding settings 28 d after curing. Figure 4 depicts the experimental apparatus and GMS samples with which the experiment was performed. The samples had the shape of cylinders with dimensions of 100 × 200 mm, and a steel rod 10 mm in diameter was placed in the centre of each sample. In this investigation, the subjects were exposed to a 3% NaCl solution for 90 d.

3. Results and Discussion

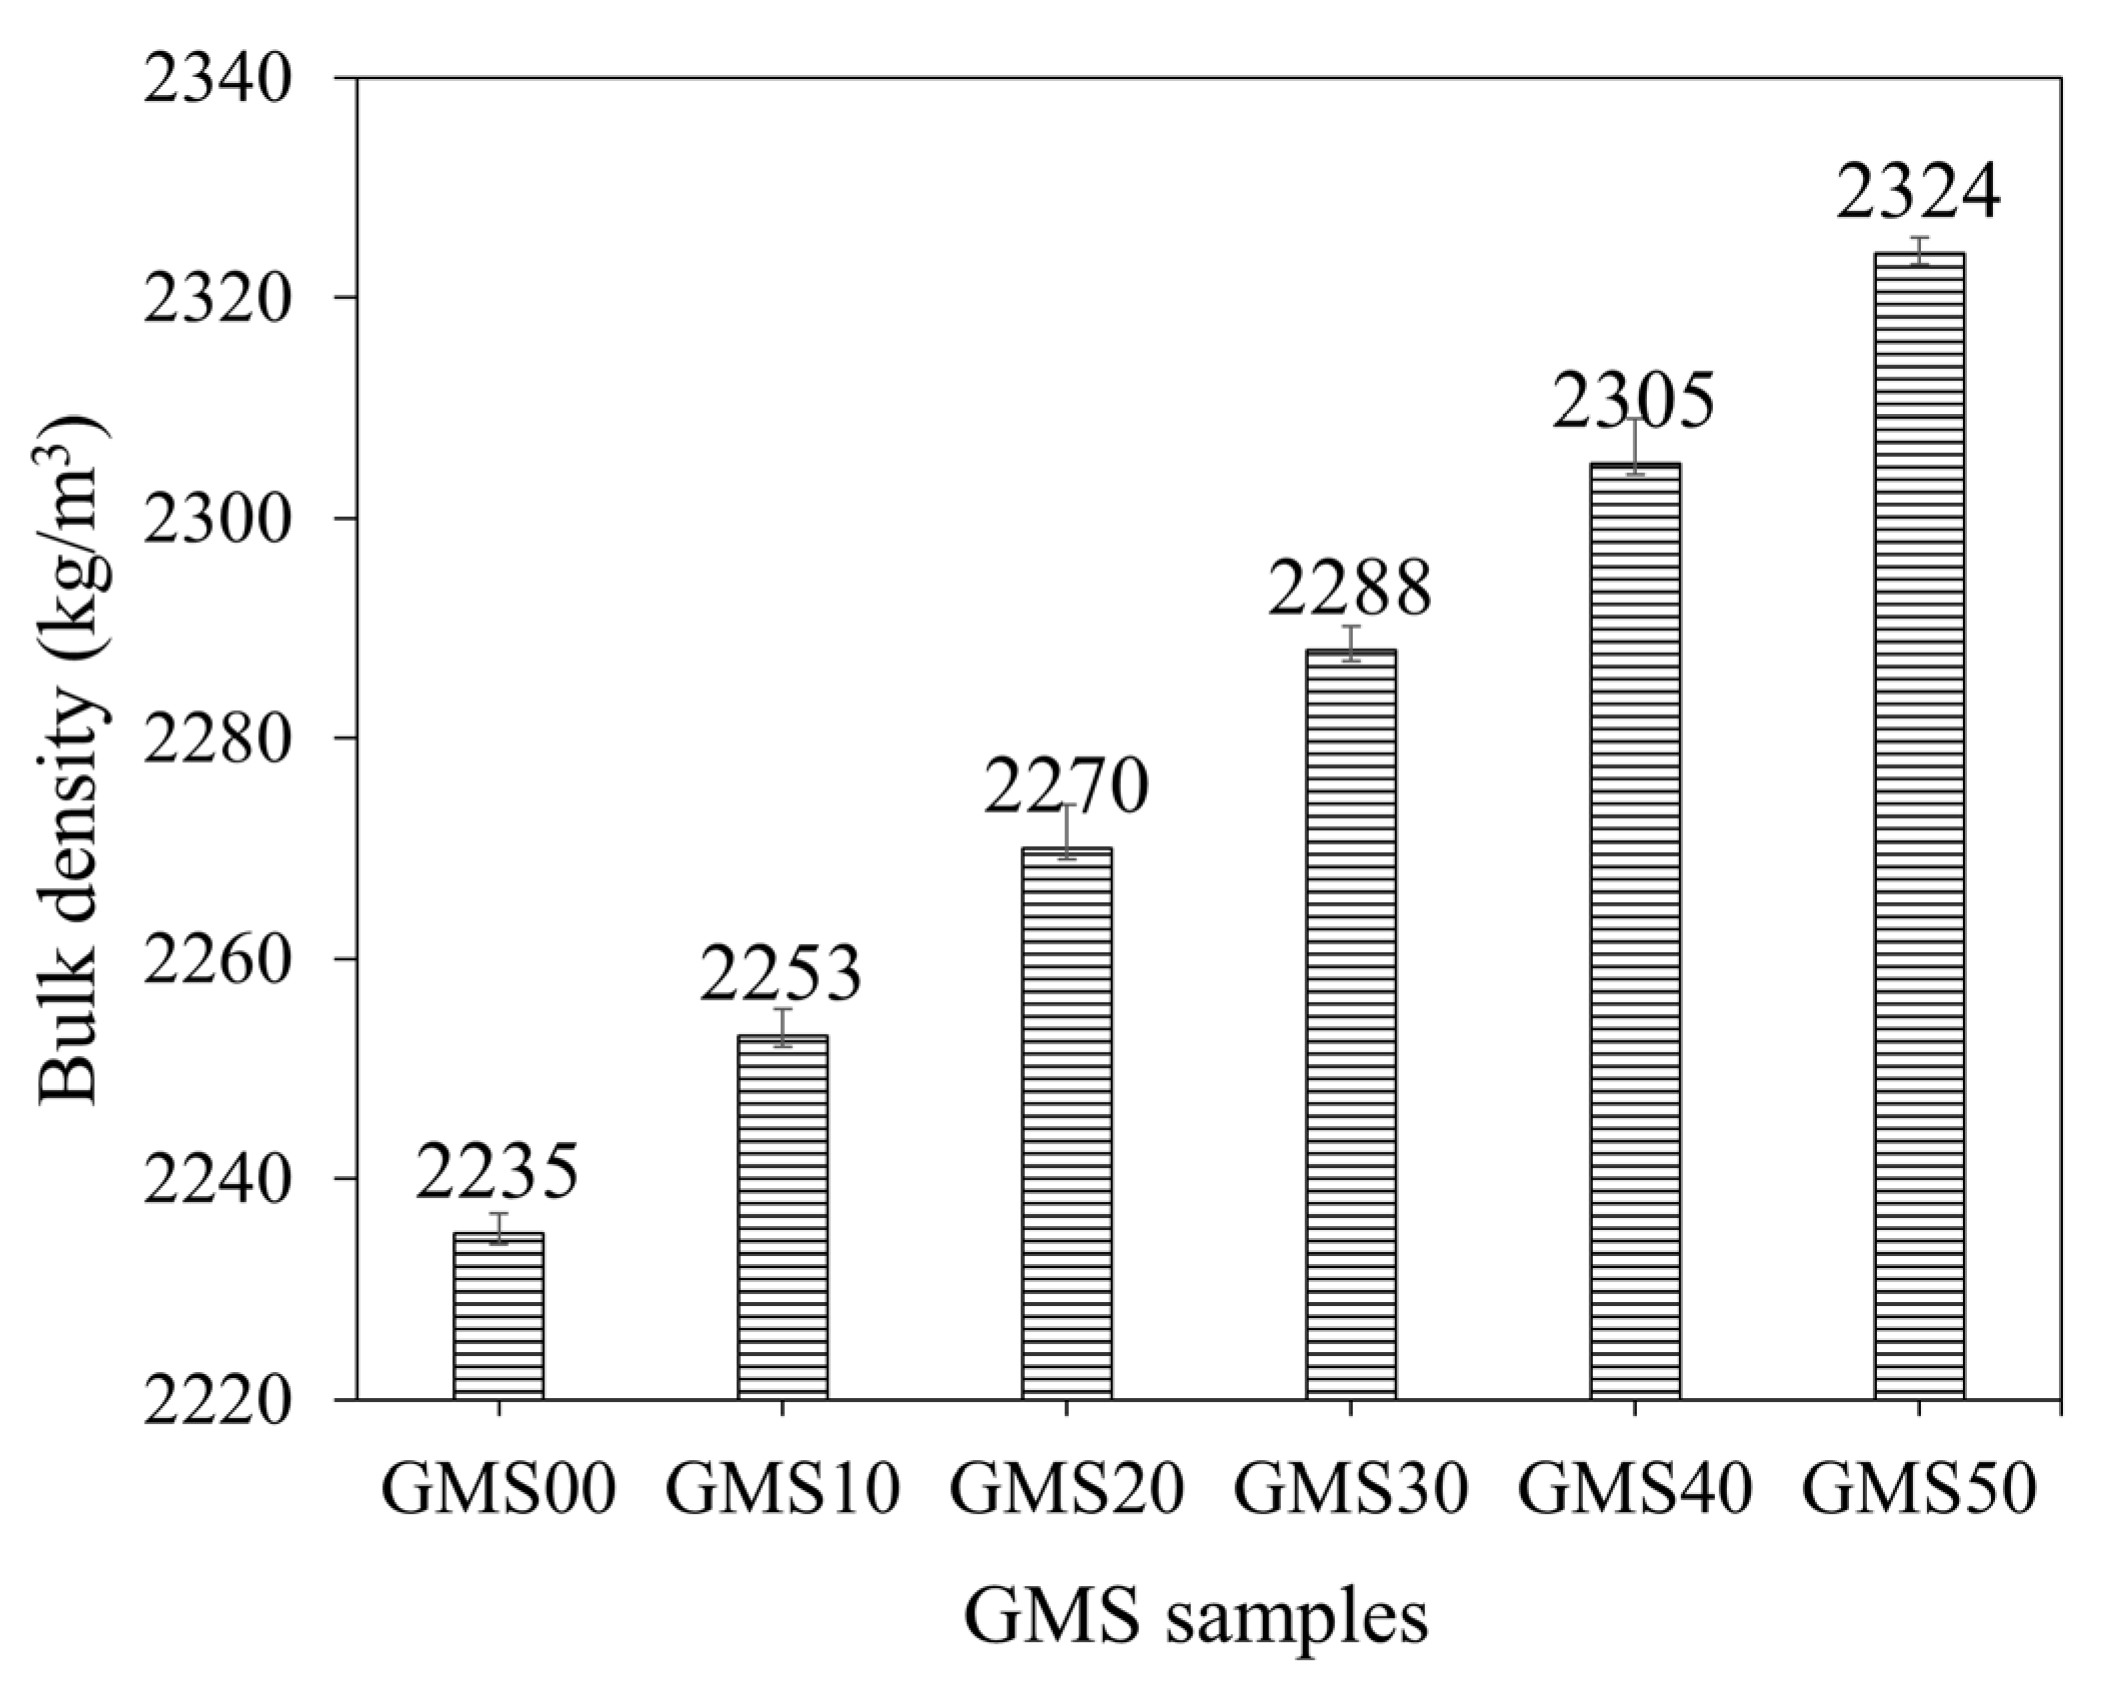
3.1. Slump Flow and Bulk Density of Fresh Mortars

Slump flow is a reliable index reflecting the workability and other properties of fresh and hardened geopolymer mortars [64]. Figure 5 shows the average value of the slump flow of the GMS samples. All GMS samples generally had excellent workability, with an 18–21 cm slump meeting Vietnamese construction requirements. The influence of GBFS content on the slump flow values was observed, with a lower slump flow obtained at a higher level of GBFS content. When the amount of GBFS increased, the proportion of particles with angular and irregular shapes (see Figure 3c) increased, whereas the proportion of spherical particles (Figure 3a) in FA decreased. The higher presence of angular particles and irregular shapes reduces the slump flow values [64,65]. In addition, because GBFS has a smaller particle size, more water would be absorbed as more GBFS was included, resulting in lower slump flow [66].
The influence of GBFS on the bulk density of fresh GMS mortars is shown in Figure 6. The results indicated that adding GBFS at different levels increased the average density of the mortar mixtures from 2235 kg/m3 to 2324 kg/m3. The bulk density values of fresh mortars with 0%, 10%, 20%, 30%, 40%, and 50% by weight of GBFS were 2235, 2253, 2270, 2288, 2305, and 2324 kg/m3, respectively, which were 18, 35, 53, 70 and 89 kg/m3 higher than that of the GMS00 (0 wt% GFBS), respectively. The higher specific gravity of the GFBS (see Table 2) may explain the increment in the bulk density values. In addition, the smaller particle size of GBFS compared to that of FA could be another reason. Accordingly, with a higher amount of GFBS in the mixture, a better packing density was obtained, which increased the bulk density [43,67].

3.2. SEM Observation

SEM analysis was used to describe the changes in the morphology of the microstructure of the GMS samples at 7 d. Figure 7 depicts the changes in the microstructure of the GMS samples with different amounts of GFBS. Owing to the increased production of C-S-H gel, the microstructure of the GMS sample containing more GBFS was generally denser. In the GMS00 samples, partially reacted cenospheres were the primary characteristic (Figure 7a). In the GMS10 and GMS20 samples with 10% and 20% by weight of GBFS, respectively, the cenosphere was coated with the reaction product (Figure 7b,c). The structure of the gel phase at the surface of the FA particles, which grows outwards in the hydroxide system, was observed in agreement with a previous finding [68]. When the GBFS content increased to 30%, 40%, and 50%, small prismatic structures with diffused borders and long fibers in clusters were observed (Figure 7d,e), and fibrous products were detected (Figure 7f).
Notably, the highly active nano-SiO2 content of SF-90 tends to react rapidly with the Na2O content of the alkaline medium and the CaO concentration of GBFS. It improves the microstructure of geopolymer mortars by generating CaO-Al2O3-SiO2-H2O, CaO-SiO2-H2O, and Al2O3-SiO2-H2O gels. Hence, owing to these gels’ enhanced production, the GMS sample’s microstructure with a greater GBFS concentration was denser [27,30]. The results provide reliable proof to clarify the changes in compressive strength, flexural strength, density, water absorption, chloride resistance, and corrosion resistance, as presented in the following sections.

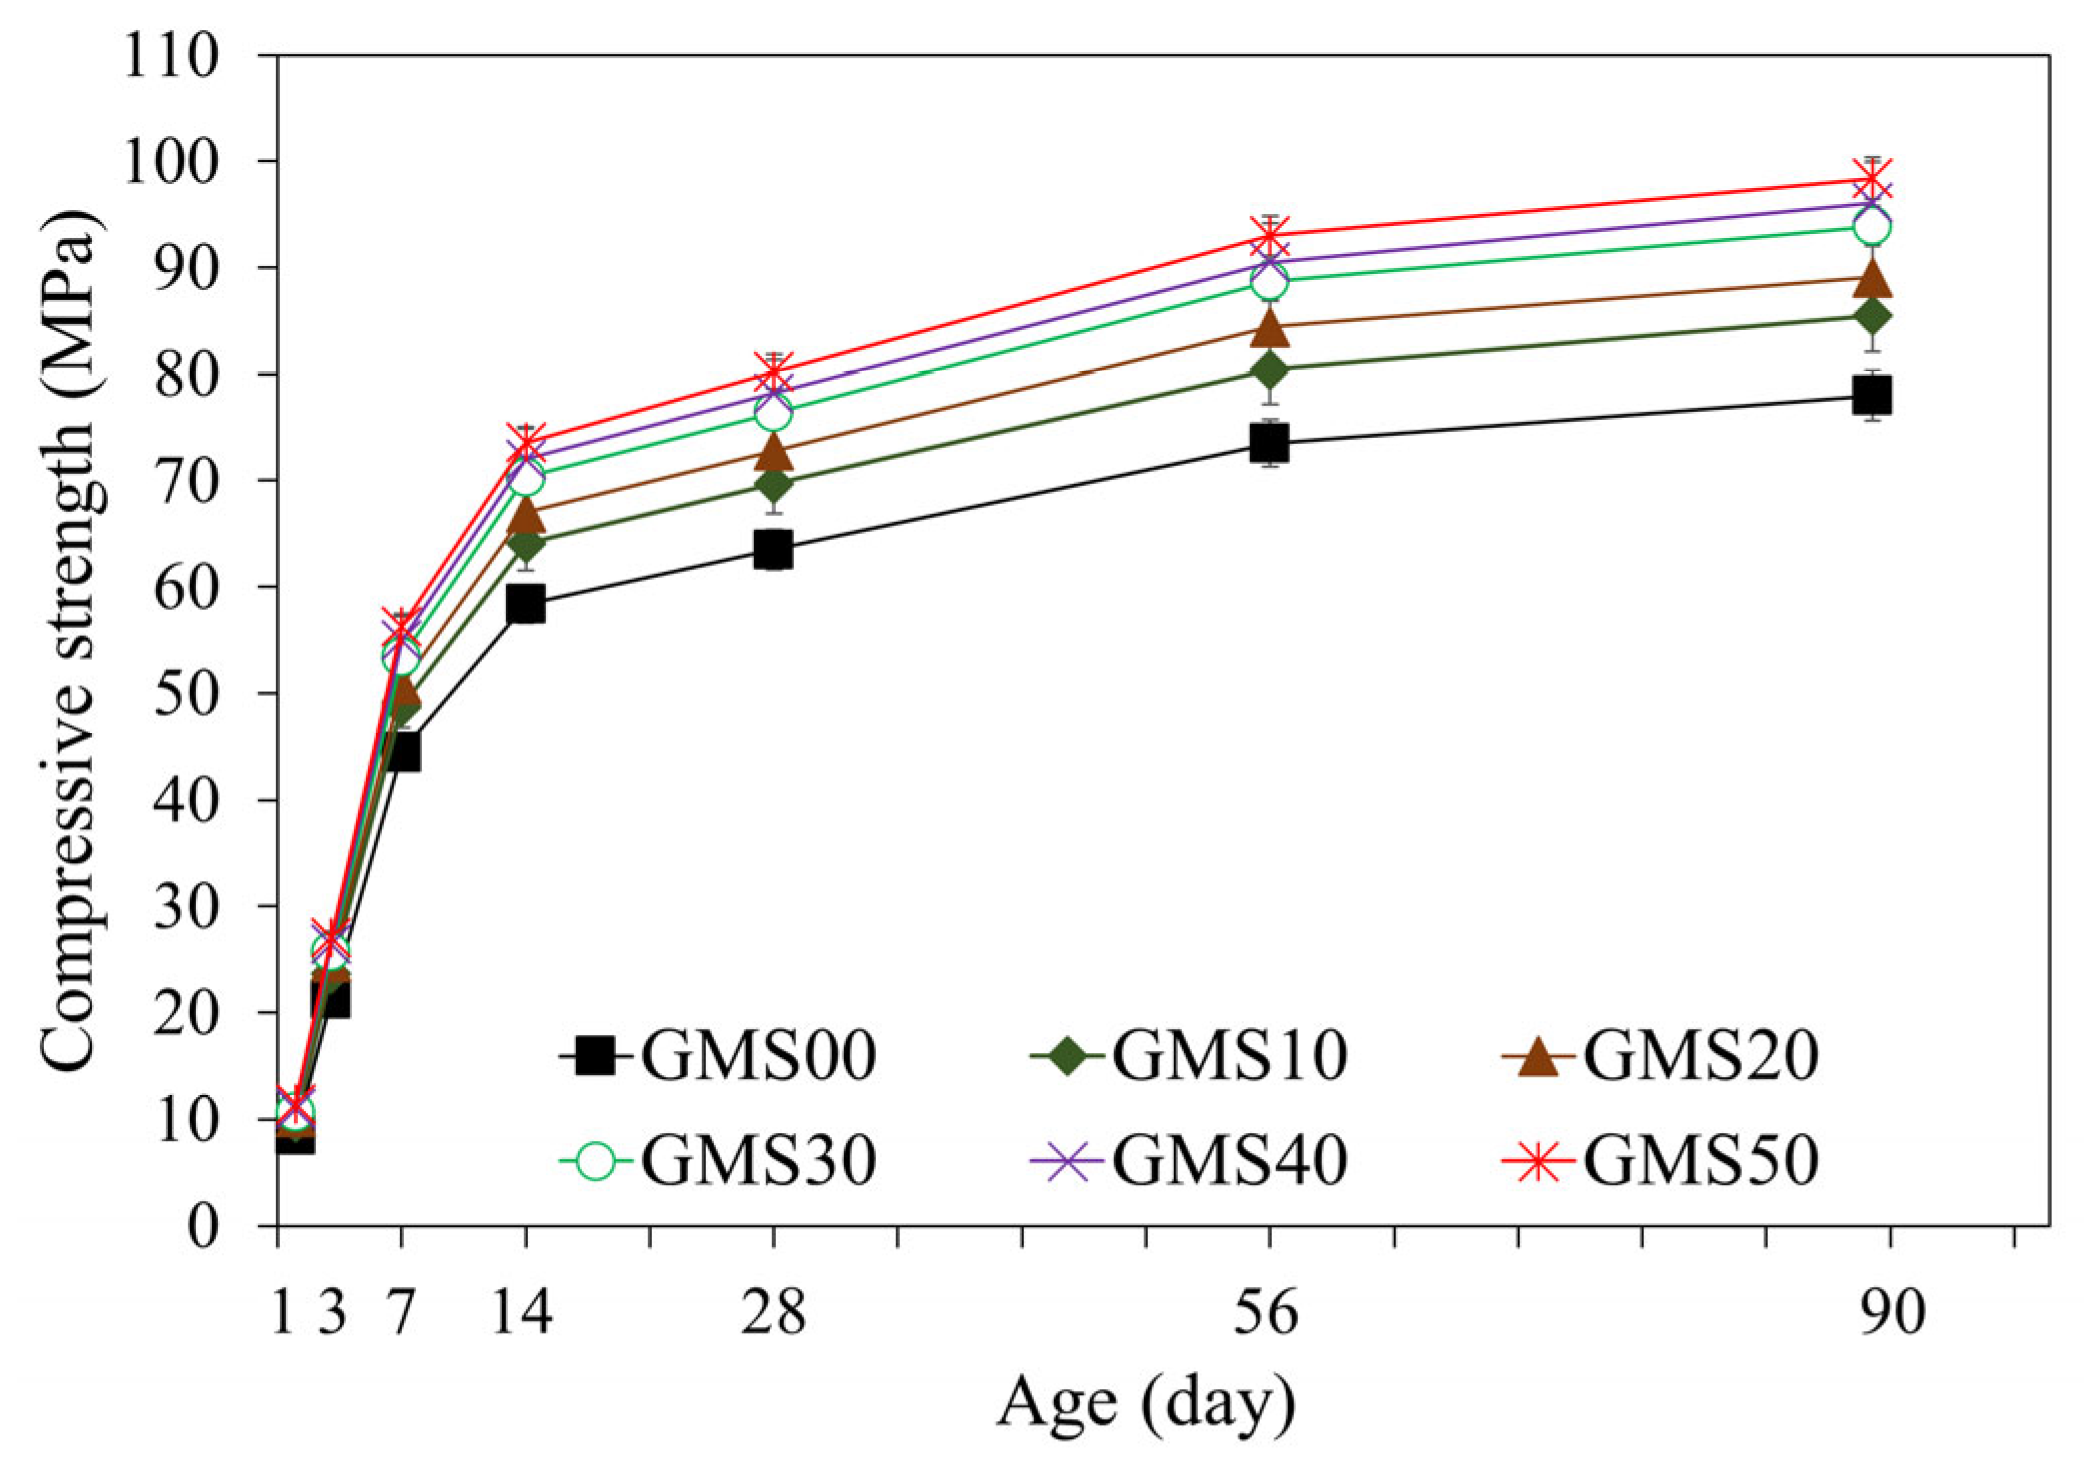
3.3. Compressive and Flexural Strength

The compressive strength is critical as the primary mechanical index used to evaluate the GMS performance [64,69]. The changes in the compressive strength of the GMS samples produced with different GBFS contents are indicated in Figure 8. Over time, the overall compressive strength of the samples increased. The increase in compressive strength may result from the formation of extra hydration products, which fill the porous microstructure of the geopolymer mortar [64,65]. As a result, the number of hydration products increases as the hydration stages develop, leading to a more compact microstructure and a higher compressive strength. The results at 28 d of curing age indicate that the 50 wt% GMS samples had the highest compressive strength, followed by the (10–40) wt% GMS samples. The compressive strengths of the GMS samples with 50%, 40%, 30%, 20%, and 10% by weight of GBFS were 80.2, 78.2, 76.4, 72.8, and 69.7 MPa, respectively, which were 26.30%, 23.15%, 20.31%, 14.65%, and 9.76% greater than that of the GMS00 (0 wt% GFBS), respectively. Based on the results at 28 d, the GMS samples can be classified as M30 under TCVN 4314:2003 [70].
Furthermore, the influence of GBFS on the compressive strength of the GMS samples was determined, with a positive correlation between compressive strength and GBFS content at each time point. For example, the results at 90 d indicate a decrease in the compressive strength from GMS50 (50 wt% GBFS) to GMS00 (0 wt% GBFS). Specifically, the compressive strengths of the GMS samples containing 50%, 40%, 30%, 20%, and 10% by weight of GBFS were 98.4, 96.1, 93.9, 89.1, and 85.5 MPa, respectively, which were 26.15%, 23.21%, 20.38%, 14.23%, and 9.62% higher than that of GMS00 (0 wt% GFBS), respectively. Herein, the increment in compressive strength could be supported by the denser bulk density of the GMS samples produced with GBFS (Figure 6) and its lower porosity [43,64]. Moreover, the SEM observations (Figure 7) and the strong positive relationship between compressive strength and bulk density (Figure 9) provide compelling evidence for explaining the changes in compressive strength.
Table 4 shows the changes in the compressive and flexural strength values at 1, 3, 7, 14, 28, 56, and 90 d, along with the changes in SiO2/Al2O3 and glass content. The experimental results proved that GBFS and glass content positively correlate with compressive and flexural strength increments. More specifically, when the percentage of glass increased from 48.2 wt% to 73.2 wt% (see Table 4), the hydration products steadily increased, resulting in a denser microstructure [64,71]. In addition, regarding reactivity, the high CaO and Al2O3 concentrations of GBFS paired with the high SiO2 content of SF-90 are essential for triggering the reaction with the activator to produce calcium aluminum silicate hydrate products [20]. The flexural-to-compressive strength ratios of the test samples fluctuated only from 1/11 to 1/9, similar to that of traditional cement mortars [72].

3.4. Water Absorption

The water absorption of geopolymer mortar depends on its composition, curing circumstances, and aggregate porosity, and is a helpful index to evaluate its durability [73,74]. Owing to their decreased porosity and chemical resistance, geopolymer mortars absorb less water than Portland cement mortars [64]. The changes in the water absorption of the GMS samples at 28 d are shown in Figure 10, with the lower water absorption obtained at a higher amount of GBFS. For instance, at 28 d, the water absorptions of the GMS specimens with 0%, 10%, 20%, 30%, 40%, and 50% by weight of GBFS were 7.15%, 6.48%, 5.94%, 5.67%, 4.86%, and 4.15%, respectively. The lower water absorption could be closely related to the bulk density (Figure 6) and porosity [43,64]. All geopolymerisation products of these compounds filled the gaps in the binder stone because of the geopolymerisation reaction of aluminosilicate materials, such as FA, GBFS, and SF-90, resulting in a denser microstructure and reduced water absorption of the GMS specimens. In addition, SEM results (Figure 7) and the close correlation between water absorption and bulk density (Figure 11) give solid evidence for understanding the variations in water absorption.
In addition, with the same liquid-to-alumino-silicate material ratio of 0.35, the water absorption of all GMS produced with GBFS, that is, from 10 wt% to 50 wt% GBFS, was lower than that of the control specimens GMS00 (see Figure 9). Because GBFS is glassy, the reaction product of the system depends on the response of its Al2O3 and CaO concentrations, as well as its SiO2 content. Thus, higher levels of GBFS are associated with increased amounts of C-A-S-H and N-C-S-H reaction products.

3.5. Chloride Resistance

An important aspect of concrete longevity is its resistance to chloride attack. The quick chloride permeability test is frequently used to determine the chloride resistance in concrete (RCPT). Figure 12 displays the changes in the total charge passed (Coulomb) for the GMS samples at the 28 d curing age. The results at 28 d showed that GMS50 had the lowest charge passing value, followed by GMS40 and GMS00, in increasing order. Based on TCVN 9337:2012 [62], the GMS samples were classified as very low (GMS50), low (GMS40, GMS30, and GMS20), or moderate (GMS10 and GMS00). This finding demonstrates that the GMS sample is resistant to chloride penetration, providing a new solution for the construction sector.
In addition, Figure 12 shows how GBFS affected the total charge passed. The total charge passed was demonstrated to inversely correlate with GBFS concentration when SF-90 was held constant, which is consistent with variations in water absorption (see Figure 8). Specifically, the charge passed values of the GMS samples with 50%, 40%, 30%, 20%, and 10% by weight of GBFS were 842C, 985C, 1437C, 1680C, and 2180C, respectively. This is compared to GMS00 (0 wt% GFBS), which had charge pass values that were 71.42%, 66.56%, 51.21%, 41.97%, and 25.97% lower. The lower charge passed values of the GMS samples could be explained by the higher bulk density (Figure 6) and lower porosity of the GMS samples produced with GBFS [43,64]. In addition, the SEM results (Figure 7) and the high correlation between the total charge passed, and bulk density (Figure 13) provide robust evidence for explaining the chloride resistance variations.

3.6. The Time Initial Crack

Figure 14 depicts the beginning fracture of the test samples for six compositions to evaluate the corrosion of reinforcement in the environment of 3% NaCl solution by the NT Build 356 standard [63]. The results showed that for all tested GMS with different GBFS contents, the experimental time for the destruction of the tested samples was 45–88 d (see Figure 15). In detail, mortar combinations containing GBFS exhibited significantly longer destruction durations compared to the control mixture, with the order decreasing from GMS50 to GMS00. (GMS00). Herein, the denser microstructure (Figure 7), increased bulk density (Figure 16a), and decreased water absorption (Figure 16b) of GMS samples containing GBFS might all be contributing factors to the longer time initial crack.

4. Conclusions

This study examined the performance of a fly ash-based geopolymer mortar using the following three Vietnamese by-products: FA, GBFS, and SF. Changes in the slump flow, compressive strength, density, water absorption, chloride resistance, and corrosion resistance of the GMS samples were explored in detail. The following conclusions were reached in light of the experimental findings:
  • The Vietnamese GBFS content significantly affected the geopolymer mortars’ workability mixtures and strength behaviour. Increasing the GBFS content from 0 wt% to 50 wt% reduced the slump of the mixtures significantly, whereas it had less effect on the densities of the GMS samples. The slump and density of the GMS samples were recorded in the range of 18–21 cm and 2235–2324 kg/m3, respectively.
  • The compressive strength of the GMS samples increased from 1 d to 90 d due to the curing period test; the flexural-to-compressive strength ratios of the test samples only changed from 1/11 to 1/9. The GBFS concentration significantly affected the flexural-compressive strength values at 28 d of curing, which ranged from 5.83 MPa to 7.29 MPa and 63.5 MPa to 80.2 MPa, respectively.
  • The GBFS replacement amount reduced the water absorption and chloride penetration while enhancing the corrosion resistance of the GMS samples. This is because all geopolymerisation products of FA, SF-90, and GBFS with the alkali-activator solution filled the gaps in the binder stone, hence decreasing the water absorption of the GMS-sample. Extremely low chloride ion permeability may be achieved by including 50 wt% GBFS in the mixes. Based on the standard NT Build 356 results, the initial cracking of the test mortar occurred between 45 and 88 d.
The results of this study verified the applicability of incorporating three Vietnamese by-products (FA, GBFS, and SF) to produce geopolymer mortars, as verified by the relevant Vietnamese standards. It also clarified the great potential of GBFS to improve the performance of GMS products, including flexural-compressive strength, corrosion of reinforcement, water absorption, and chloride resistance. Given the constraints of this study, future research should analyse and evaluate the long-term evolution of compressive-flexural strength, water absorption, bulk density, and void volume. Furthermore, further studies should use FTIR and XRD methods to prove the newly created gels in the microstructure of mortars.

Author Contributions

Conceptualization, M.H.N.; Methodology, M.H.N.; Investigation, T.V.L.; Resources, T.V.L.; Data curation, M.H.N.; Writing—original draft, T.V.L.; Writing—review & editing, M.H.N.; Visualization, T.V.L.; Funding acquisition, T.V.L. All authors have read and agreed to the published version of the manuscript.

Funding

This research was financially supported by the Ministry of Education and Training of Vietnam (MOET) project B2021-MDA-11.

Institutional Review Board Statement

Not applicable.

Informed Consent Statement

Not applicable.

Data Availability Statement

The data are not publicly available due to the privacy of program data.

Conflicts of Interest

The authors declare no conflict of interest.

Appendix A

Table A1 shows the physical and chemical properties of the Na2SiO3 liquid used in this study.
Table A1. The physical and chemical properties of the Na2SiO3 liquid.
Chemical FormulaNa2O
(wt%)
SiO2
(wt%)
H2O
(wt%)
AppearanceColorMolecular WeightSpecific Gravity
Na2O·xSiO2·yH2O11.8029.5058.70Liquid (Gel)Light Yellow Liquid184.04 g1.55 g/cm3

Appendix B

Table A2 shows the composition of the SiO2/Al2O3 ratio, CaO, Al2O3, SiO2, and glass content in GMS samples used in this study.
Table A2. The composition of SiO2/Al2O3 ratio, CaO, Al2O3, SiO2, and glass content in GMS samples.
Sample
Code
Compositions of Raw Materials (wt%)CaO
(wt%)
SiO2
(wt%)
Al2O3
(wt%)
SiO2/Al2O3Glass Content (wt%)
FASF-90GBFSFASF-90GBFSTotal
GMS00901004.258.2722.802.5638.79.50.048.2
GMS108010107.356.1122.082.5434.49.59.353.2
GMS2070102010.553.9421.362.5330.19.518.658.2
GMS3060103013.651.7720.642.5125.89.527.963.2
GMS4050104016.849.6119.922.4921.59.537.268.2
GMS5040105019.947.4419.202.4717.29.546.573.2

References

  1. Neville, A.M. Properties of Concrete, 5th ed.; Pearson: London, UK, 2011. [Google Scholar]
  2. Luukkonen, T.; Abdollahnejad, Z.; Yliniemi, J.; Kinnunen, P.; Illikainen, M. One-Part Alkali-Activated Materials: A Review. Cem. Concr. Res. 2018, 103, 21–34. [Google Scholar] [CrossRef]
  3. Mehta, P.K.; Monteiro, P.J.M. Concrete, Microstructure, Properties and Materials; McGraw-Hill Education: New York, NY, USA, 2014. [Google Scholar]
  4. United States Geological Surveys (USGS). Mineral Commodity Summaries 2022—Cement; United States Geological Surveys: Reston, VA, USA, 2022. [Google Scholar]
  5. Olivier, J.G.J.; Schure, K.M.; Peters, J.A.H.W. Trends in Global CO2 and Total Greenhouse Gas Emissions. PBL Neth. Environ. Assess. Agency 2017, 5, 1–11. [Google Scholar]
  6. Van Damme, H. Concrete Material Science: Past, Present, and Future Innovations. Cem. Concr. Res. 2018, 112, 5–24. [Google Scholar] [CrossRef]
  7. Nguyen, M.H.; Huynh, T.-P. Turning Incinerator Waste Fly Ash into Interlocking Concrete Bricks for Sustainable Development. Constr. Build. Mater. 2022, 321, 126385. [Google Scholar] [CrossRef]
  8. Duxson, P.; Fernández-Jiménez, A.; Provis, J.L.; Lukey, G.C.; Palomo, A.; van Deventer, J.S.J. Geopolymer Technology: The Current State of the Art. J. Mater. Sci. 2007, 42, 2917–2933. [Google Scholar] [CrossRef]
  9. Li, C.; Sun, H.; Li, L. A Review: The Comparison between Alkali-Activated Slag (Si+Ca) and Metakaolin (Si+Al) Cements. Cem. Concr. Res. 2010, 40, 1341–1349. [Google Scholar] [CrossRef]
  10. Mehta, A.; Siddique, R. An Overview of Geopolymers Derived from Industrial By-Products. Constr. Build. Mater. 2016, 127, 183–198. [Google Scholar] [CrossRef]
  11. Amran, Y.H.M.; Alyousef, R.; Alabduljabbar, H.; El-Zeadani, M. Clean Production and Properties of Geopolymer Concrete; A Review. J. Clean. Prod. 2020, 251, 119679. [Google Scholar] [CrossRef]
  12. Farooq, F.; Jin, X.; Faisal Javed, M.; Akbar, A.; Izhar Shah, M.; Aslam, F.; Alyousef, R. Geopolymer Concrete as Sustainable Material: A State of the Art Review. Constr. Build. Mater. 2021, 306, 124762. [Google Scholar] [CrossRef]
  13. Palomo, A.; Blanco-Varela, M.T.; Granizo, M.L.; Puertas, F.; Vazquez, T.; Grutzeck, M.W. Chemical Stability of Cementitious Materials Based on Metakaolin. Cem. Concr. Res. 1999, 29, 997–1004. [Google Scholar] [CrossRef]
  14. Singh, B.; Ishwarya, G.; Gupta, M.; Bhattacharyya, S.K. Geopolymer Concrete: A Review of Some Recent Developments. Constr. Build. Mater. 2015, 85, 78–90. [Google Scholar] [CrossRef]
  15. Toniolo, N.; Boccaccini, A.R. Fly Ash-Based Geopolymers Containing Added Silicate Waste. A Review. Ceram. Int. 2017, 43, 14545–14551. [Google Scholar] [CrossRef]
  16. Zhuang, X.Y.; Chen, L.; Komarneni, S.; Zhou, C.H.; Tong, D.S.; Yang, H.M.; Yu, W.H.; Wang, H. Fly Ash-Based Geopolymer: Clean Production, Properties and Applications. J. Clean. Prod. 2016, 125, 253–267. [Google Scholar] [CrossRef]
  17. Duan, P.; Yan, C.; Zhou, W. Compressive Strength and Microstructure of Fly Ash Based Geopolymer Blended with Silica Fume under Thermal Cycle. Cem. Concr. Compos. 2017, 78, 108–119. [Google Scholar] [CrossRef]
  18. Okoye, F.N.; Prakash, S.; Singh, N.B. Durability of Fly Ash Based Geopolymer Concrete in the Presence of Silica Fume. J. Clean. Prod. 2017, 149, 1062–1067. [Google Scholar] [CrossRef]
  19. Amran, M.; Debbarma, S.; Ozbakkaloglu, T. Fly Ash-Based Eco-Friendly Geopolymer Concrete: A Critical Review of the Long-Term Durability Properties. Constr. Build. Mater. 2021, 270, 121857. [Google Scholar] [CrossRef]
  20. Ryu, G.S.; Lee, Y.B.; Koh, K.T.; Chung, Y.S. The Mechanical Properties of Fly Ash-Based Geopolymer Concrete with Alkaline Activators. Constr. Build. Mater. 2013, 47, 409–418. [Google Scholar] [CrossRef]
  21. Provis, J.L. Geopolymers and Other Alkali Activated Materials: Why, How, and What? Mater. Struct. 2014, 47, 11–25. [Google Scholar] [CrossRef]
  22. Myers, R.J.; L’Hôpital, E.; Provis, J.L.; Lothenbach, B. Effect of Temperature and Aluminium on Calcium (Alumino)Silicate Hydrate Chemistry under Equilibrium Conditions. Cem. Concr. Res. 2015, 68, 83–93. [Google Scholar] [CrossRef]
  23. Collins, F.; Sanjayan, J.G. Effect of Pore Size Distribution on Drying Shrinking of Alkali-Activated Slag Concrete. Cem. Concr. Res. 2000, 30, 1401–1406. [Google Scholar] [CrossRef]
  24. Ye, H.; Radlińska, A. Shrinkage Mechanisms of Alkali-Activated Slag. Cem. Concr. Res. 2016, 88, 126–135. [Google Scholar] [CrossRef] [Green Version]
  25. Li, Z.; Liu, S. Influence of Slag as Additive on Compressive Strength of Fly Ash-Based Geopolymer. J. Mater. Civ. Eng. 2007, 19, 470–474. [Google Scholar] [CrossRef]
  26. Buchwald, A.; Hilbig, H.; Kaps, C. Alkali-Activated Metakaolin-Slag Blends—Performance and Structure in Dependence of Their Composition. J. Mater. Sci. 2007, 42, 3024–3032. [Google Scholar] [CrossRef]
  27. Kumar, S.; Kumar, R.; Mehrotra, S.P. Influence of Granulated Blast Furnace Slag on the Reaction, Structure and Properties of Fly Ash Based Geopolymer. J. Mater. Sci. 2010, 45, 607–615. [Google Scholar] [CrossRef]
  28. Zhang, P.; Gao, Z.; Wang, J.; Guo, J.; Hu, S.; Ling, Y. Properties of Fresh and Hardened Fly Ash/Slag Based Geopolymer Concrete: A Review. J. Clean. Prod. 2020, 270, 122389. [Google Scholar] [CrossRef]
  29. Dai, X.; Aydın, S.; Yardımcı, M.Y.; Lesage, K.; De Schutter, G. Effects of Activator Properties and GGBFS/FA Ratio on the Structural Build-up and Rheology of AAC. Cem. Concr. Res. 2020, 138, 106253. [Google Scholar] [CrossRef]
  30. Gao, X.; Yu, Q.L.; Brouwers, H.J.H. Characterization of Alkali Activated Slag–Fly Ash Blends Containing Nano-Silica. Constr. Build. Mater. 2015, 98, 397–406. [Google Scholar] [CrossRef]
  31. Kuo, W.-T.; Wang, H.-Y.; Shu, C.-Y. Engineering Properties of Cementless Concrete Produced from GGBFS and Recycled Desulfurization Slag. Constr. Build. Mater. 2014, 63, 189–196. [Google Scholar] [CrossRef]
  32. Sharmila, P.; Dhinakaran, G. Compressive Strength, Porosity and Sorptivity of Ultra Fine Slag Based High Strength Concrete. Constr. Build. Mater. 2016, 120, 48–53. [Google Scholar] [CrossRef]
  33. Higgins, D.D. Increased Sulfate Resistance of Ggbs Concrete in the Presence of Carbonate. Cem. Concr. Compos. 2003, 25, 913–919. [Google Scholar] [CrossRef]
  34. Ahmaruzzaman, M. A Review on the Utilization of Fly Ash. Prog. Energy Combust. Sci. 2010, 36, 327–363. [Google Scholar] [CrossRef]
  35. Cheah, C.B.; Tan, L.E.; Ramli, M. The Engineering Properties and Microstructure of Sodium Carbonate Activated Fly Ash/Slag Blended Mortars with Silica Fume. Compos. Part B Eng. 2019, 160, 558–572. [Google Scholar] [CrossRef]
  36. Kurdowski, W.; Nocuń-Wczelik, W. The Tricalcium Silicate Hydration in the Presence of Active Silica. Cem. Concr. Res. 1983, 13, 341–348. [Google Scholar] [CrossRef]
  37. Zhao, H.; Sun, W.; Wu, X.; Gao, B. The Properties of the Self-Compacting Concrete with Fly Ash and Ground Granulated Blast Furnace Slag Mineral Admixtures. J. Clean. Prod. 2015, 95, 66–74. [Google Scholar] [CrossRef]
  38. Özbay, E.; Erdemir, M.; Durmuş, H.I. Utilization and Efficiency of Ground Granulated Blast Furnace Slag on Concrete Properties—A Review. Constr. Build. Mater. 2016, 105, 423–434. [Google Scholar] [CrossRef]
  39. Gholampour, A.; Ozbakkaloglu, T. Performance of Sustainable Concretes Containing Very High Volume Class-F Fly Ash and Ground Granulated Blast Furnace Slag. J. Clean. Prod. 2017, 162, 1407–1417. [Google Scholar] [CrossRef]
  40. Tsakiridis, P.E.; Papadimitriou, G.D.; Tsivilis, S.; Koroneos, C. Utilization of Steel Slag for Portland Cement Clinker Production. J. Hazard. Mater. 2008, 152, 805–811. [Google Scholar] [CrossRef] [PubMed]
  41. Nu, N.T. An Experimental Study of Reusing Coal Ash for Base Course of Road Pavement in Viet Nam. Electron. J. Geotech. Eng. 2019, 24, 945–960. [Google Scholar]
  42. Hoan, V.N.; Linh, V.V. Properties of Cement and Concrete Using Portland Cement Blended and Ground Granulated Blast Furnace Slag as Mineral Admixture. In Proceedings of the International Conference of Science and Technology of Building Materials for Sustainable Development, Hanoi, Vietnam, 31 November 2019. [Google Scholar]
  43. Nguyen, M.H.; Nguyen, V.T.; Huynh, T.-P.; Hwang, C.-L. Incorporating Industrial By-Products into Cement-Free Binders: Effects on Water Absorption, Porosity, and Chloride Penetration. Constr. Build. Mater. 2021, 304, 124675. [Google Scholar] [CrossRef]
  44. TCVN 7570:2006; Aggregates for Concrete and Mortar—Specifications. Ministry of Science and Technology: Hanoi, Vietnam, 2006.
  45. ASTM C618; Standard Specification for Coal Fly Ash and Raw or Calcined Natural Pozzolan for Use in Concrete. ASTM International: West Conshohocken, PA, USA, 2019.
  46. McCusker, L.B.; Von Dreele, R.B.; Cox, D.E.; Louër, D.; Scardi, P. Rietveld Refinement Guidelines. J. Appl. Cryst. 1999, 32, 36–50. [Google Scholar] [CrossRef] [Green Version]
  47. TCVN 8826:2011; Chemical Admixtures for Concrete. Ministry of Science and Technology: Hanoi, Vietnam, 2021.
  48. TCVN 4506:2012; Water for Concrete and Mortar—Technical Specification. Ministry of Science and Technology: Hanoi, Vietnam, 2012.
  49. Saha, S.; Rajasekaran, C. Enhancement of the Properties of Fly Ash Based Geopolymer Paste by Incorporating Ground Granulated Blast Furnace Slag. Constr. Build. Mater. 2017, 146, 615–620. [Google Scholar] [CrossRef]
  50. Wang, Y.; Xiao, R.; Hu, W.; Jiang, X.; Zhang, X.; Huang, B. Effect of Granulated Phosphorus Slag on Physical, Mechanical and Microstructural Characteristics of Class F Fly Ash Based Geopolymer. Constr. Build. Mater. 2021, 291, 123287. [Google Scholar] [CrossRef]
  51. Li, N.; Shi, C.; Zhang, Z.; Wang, H.; Liu, Y. A Review on Mixture Design Methods for Geopolymer Concrete. Compos. Part B Eng. 2019, 178, 107490. [Google Scholar] [CrossRef]
  52. Reddy, M.S.; Dinakar, P.; Rao, B.H. Mix Design Development of Fly Ash and Ground Granulated Blast Furnace Slag Based Geopolymer Concrete. J. Build. Eng. 2018, 20, 712–722. [Google Scholar] [CrossRef]
  53. Van Lam, T.; Van Ngan, P.; Minh, N.D.B. Effect of Liquid-to-Alumino-Silicate Material Ratio and Rice Husk Ash Content on the Properties of Geopolymer Concrete. In Proceedings of FORM 2021; Akimov, P., Vatin, N., Eds.; Springer International Publishing: Cham, Switzerland, 2022; pp. 85–97. [Google Scholar]
  54. Rekha, Y.; Suriya, S.; Hamedul Irshad, H.M. Comparative Study on Oven Curing of Geo-Polymer Concrete over Conventional Concrete. Mater. Today Proc. 2022, 55, 462–469. [Google Scholar] [CrossRef]
  55. Song, H.-W.; Saraswathy, V. Studies on the Corrosion Resistance of Reinforced Steel in Concrete with Ground Granulated Blast-Furnace Slag—An Overview. J. Hazard. Mater. 2006, 138, 226–233. [Google Scholar] [CrossRef] [PubMed]
  56. Hwang, C.-L.; Huynh, T.-P. Effect of Alkali-Activator and Rice Husk Ash Content on Strength Development of Fly Ash and Residual Rice Husk Ash-Based Geopolymers. Constr. Build. Mater. 2015, 101, 1–9. [Google Scholar] [CrossRef]
  57. Noushini, A.; Castel, A. The Effect of Heat-Curing on Transport Properties of Low-Calcium Fly Ash-Based Geopolymer Concrete. Constr. Build. Mater. 2016, 112, 464–477. [Google Scholar] [CrossRef]
  58. TCVN 3121-3:2003; Mortar for Masonry—Test Methods; Part 3: Determination of Consistence of Fresh Mortar. Ministry of Science and Technology: Hanoi, Vietnam, 2003.
  59. Larrard, F.D. Concrete Mixture Proportioning: A Scientific Approach; CRC Press: London, UK, 2014; ISBN 978-0-429-17909-9. [Google Scholar]
  60. TCVN 6016:2011; Cement—Test Methods—Determination of Strength. Ministry of Science and Technology: Hanoi, Vietnam, 2011.
  61. TCVN 3113:1993; Heavyweight Concrete—Method for Determination of Water Absorption. Ministry of Science and Technology: Hanoi, Vietnam, 1993.
  62. TCVN 9337:2012; Heavy Concrete—Method for Electrical Indication of Concrete’s Ability to Resist Chloride Ion Penetration. Ministry of Science and Technology: Hanoi, Vietnam, 2012.
  63. Build, N.T. Concrete, Repairing Materials and Protective Coating: Embedded Steel Method, Chloride Permeability. NT Build 1989, 356, 3 pape. [Google Scholar]
  64. Zhang, P.; Zheng, Y.; Wang, K.; Zhang, J. A Review on Properties of Fresh and Hardened Geopolymer Mortar. Compos. Part B Eng. 2018, 152, 79–95. [Google Scholar] [CrossRef]
  65. Al-Majidi, M.H.; Lampropoulos, A.; Cundy, A.; Meikle, S. Development of Geopolymer Mortar under Ambient Temperature for in Situ Applications. Constr. Build. Mater. 2016, 120, 198–211. [Google Scholar] [CrossRef] [Green Version]
  66. Ge, Z.; Wang, Y.; Sun, R.; Wu, X.; Guan, Y. Influence of Ground Waste Clay Brick on Properties of Fresh and Hardened Concrete. Constr. Build. Mater. 2015, 98, 128–136. [Google Scholar] [CrossRef]
  67. Jones, M.R.; Zheng, L.; Newlands, M.D. Comparison of Particle Packing Models for Proportioning Concrete Constitutents for Minimum Voids Ratio. Mat. Struct. 2002, 35, 301–309. [Google Scholar] [CrossRef]
  68. Xu, H.; Van Deventer, J.S.J. The Geopolymerisation of Alumino-Silicate Minerals. Int. J. Miner. Process. 2000, 59, 247–266. [Google Scholar] [CrossRef] [Green Version]
  69. Nguyen, M.H.; Mai, H.-V.T.; Trinh, S.H.; Ly, H.-B. A Comparative Assessment of Tree-Based Predictive Models to Estimate Geopolymer Concrete Compressive Strength. Neural Comput. Appl. 2022, 35, 6569–6588. [Google Scholar] [CrossRef]
  70. TCVN 4314:2003; Mortar for Masonry—Specifications. Ministry of Science and Technology: Hanoi, Vietnam, 2003.
  71. Huang, G.; Ji, Y.; Li, J.; Hou, Z.; Dong, Z. Improving Strength of Calcinated Coal Gangue Geopolymer Mortars via Increasing Calcium Content. Constr. Build. Mater. 2018, 166, 760–768. [Google Scholar] [CrossRef]
  72. Hossain, M.M.; Karim, M.R.; Hasan, M.; Hossain, M.K.; Zain, M.F.M. Durability of Mortar and Concrete Made up of Pozzolans as a Partial Replacement of Cement: A Review. Constr. Build. Mater. 2016, 116, 128–140. [Google Scholar] [CrossRef]
  73. Nguyen, M.H.; Nakarai, K.; Nishio, S. Durability Index for Quality Classification of Cover Concrete Based on Water Intentional Spraying Tests. Cem. Concr. Compos. 2019, 104, 103355. [Google Scholar] [CrossRef]
  74. Basheer, L.; Kropp, J.; Cleland, D.J. Assessment of the Durability of Concrete from Its Permeation Properties: A Review. Constr. Build. Mater. 2001, 15, 93–103. [Google Scholar] [CrossRef]
Figure 1. Types of raw materials.
Materials 16 04406 g001
Figure 2. SEM micrographs of (a)—FA “Vung Ang”, (b)—Silica fume SF-90, and (c)—GBFS “Hoa Phat”.
Materials 16 04406 g002
Figure 3. XRD patterns of FA, GBFS, and SF-90.
Materials 16 04406 g003
Figure 4. Accelerated corrosion test: (a) preparation of the samples and (b) scheme test setup.
Materials 16 04406 g004
Figure 5. The average value slump cone of GMS fresh mortars.
Materials 16 04406 g005
Figure 6. Bulk density of fresh GMS mortars.
Materials 16 04406 g006
Figure 7. SEM of GMS samples.
Materials 16 04406 g007
Figure 8. Changes in compressive strength of GMS samples.
Materials 16 04406 g008
Figure 9. Correlation between compressive strength and bulk density of GMS samples at 28, 56, and 90 d.
Materials 16 04406 g009
Figure 10. Water absorption of hardened GMS mortars at 28 d.
Materials 16 04406 g010
Figure 11. Correlation between water absorption and bulk density of GMS samples.
Materials 16 04406 g011
Figure 12. Total charge passed through GMS samples.
Materials 16 04406 g012
Figure 13. Correlation between total charge passed and bulk density of GMS samples.
Materials 16 04406 g013
Figure 14. The time initial crack of GMS samples.
Materials 16 04406 g014
Figure 15. Corrosion failure of GMS samples.
Materials 16 04406 g015
Figure 16. Correlation between time initial crack and (a) bulk density and (b) water absorption of GMS samples.
Materials 16 04406 g016
Table 1. Test variables.
VariableValue/Item
GBFS/(FA + GBFS + SF), (wt%)0, 10, 20, 30, 40, and 50
Evaluated propertiesSlump flow, bulk density, compressive strength, flexural strength, density, water absorption, chloride resistance, and corrosion resistance.
Table 2. Physical properties and chemical compositions of FA, SF-90, and GBFS.
ItemsFASF-90GBFS
Physical properties
Specific gravity2.322.232.92
Specific surface area (m2/g)1.3018.170.92
Mean particle size (μm)26.6<120.8
Glass content (wt%)439593
Major crystalline phasesMullite, Quartz-Gehlinite
Average chemical composition (wt%)
SiO254.3291.3332.96
Al2O325.471.2417.97
FexOy5.140.350.86
CaO4.65-36.08
MgO1.28-8.39
Na2O1.121.11-
K2O1.571.12-
SO31.45-0.72
P2O51.252.310.25
Loss upon ignition3.752.542.77
Table 3. Ingredient proportions of GMS samples.
MixturesFA (kg/m3)GBFS (kg/m3)SF-90 (kg/m3)QS (kg/m3)SP (kg/m3)NaOH (kg/m3)Na2SiO3 (kg/m3)W (kg/m3)
GMS0075608410928.4030.881182
GMS10677858511018.4731.081.6184
GMS205971718511098.5331.382.2185
GMS305162588611188.6031.582.9187
GMS404333478711278.6731.883.5188
GMS503494378711368.7432.084.2190
Table 4. The average value of flexural-compressive strength of GMS samples.
Sample
Code
SiO2/Al2O3Glass Content (wt%)Flexural Strength (MPa)Compressive Strength at Different Curing Ages (MPa)
1 d3 d7 d14 d28 d56 d90 d
GMS-012.5648.25.838.521.344.558.463.573.578
GMS-022.5453.26.459.723.748.764.169.780.485.5
GMS-032.5358.26.5310.224.850.86772.884.489.1
GMS-042.5163.27.0510.725.753.470.376.488.793.9
GMS-052.4968.27.111126.5557278.290.596.1
GMS-062.4773.27.2911.427.156.373.680.29398.4
Disclaimer/Publisher’s Note: The statements, opinions and data contained in all publications are solely those of the individual author(s) and contributor(s) and not of MDPI and/or the editor(s). MDPI and/or the editor(s) disclaim responsibility for any injury to people or property resulting from any ideas, methods, instructions or products referred to in the content.

