Article

Comparison of (K0.5Na0.5)NbO3 Single Crystals Grown by Seed-Free and Seeded Solid-State Single Crystal Growth

1
School of Materials Science and Engineering, Chonnam National University, 77 Yongbong-ro, Buk-gu, Gwangju 61186, Republic of Korea
2
Department of Chemistry, Chonnam National University, 77 Yongbong-ro, Buk-gu, Gwangju 61186, Republic of Korea
*
Author to whom correspondence should be addressed.
Current address: Department of Mechanical and Energy Engineering, University of Rwanda-College of Science and Technology, Kigali P.O. Box 3900, Rwanda.
Materials 2023, 16(10), 3638; https://doi.org/10.3390/ma16103638
Submission received: 3 March 2023 / Revised: 3 May 2023 / Accepted: 8 May 2023 / Published: 10 May 2023
(This article belongs to the Special Issue Design and Processing of Piezoelectric/Ferroelectric Ceramics)

Abstract

:
(K0.5Na0.5)NbO3-based piezoelectric ceramics are of interest as a lead-free replacement for Pb(Zr,Ti)O3. In recent years, single crystals of (K0.5Na0.5)NbO3 with improved properties have been grown by the seed-free solid-state crystal growth method, in which the base composition is doped with a specific amount of donor dopant, inducing a few grains to grow abnormally large and form single crystals. Our laboratory experienced difficulty obtaining repeatable single crystal growth using this method. To try and overcome this problem, single crystals of 0.985(K0.5Na0.5)NbO3-0.015Ba1.05Nb0.77O3 and 0.985(K0.5Na0.5)NbO3-0.015Ba(Cu0.13Nb0.66)O3 were grown both by seed-free solid-state crystal growth and by seeded solid-state crystal growth using [001] and [110]-oriented KTaO3 seed crystals. X-ray diffraction was carried out on the bulk samples to confirm that single-crystal growth had taken place. Scanning electron microscopy was used to study sample microstructure. Chemical analysis was carried out using electron-probe microanalysis. The single crystal growth behaviour is explained using the mixed control mechanism of grain growth. Single crystals of (K0.5Na0.5)NbO3 could be grown by both seed-free and seeded solid-state crystal growth. Use of Ba(Cu0.13Nb0.66)O3 allowed a significant reduction in porosity in the single crystals. For both compositions, single crystal growth on [001]-oriented KTaO3 seed crystals was more extensive than previously reported in the literature. Large (~8 mm) and relatively dense (<8% porosity) single crystals of 0.985(K0.5Na0.5)NbO3-0.015Ba(Cu0.13Nb0.66)O3 can be grown using a [001]-oriented KTaO3 seed crystal. However, the problem of repeatable single crystal growth remains.

1. Introduction

Ceramics based on (K0.5Na0.5)NbO3 (KNN) have been extensively studied over the last twenty years as replacements for lead-based piezoelectric ceramics such as Pb(Zr,Ti)O3 and Pb(Mg1/3Nb2/3)O3 [1,2]. The base KNN material has only moderate piezoelectric properties (d33 = 70–90 pC/N, kp = 0.36–0.39, kt = 0.4, k33 = 0.51) [3,4]. Considerable improvements in properties have been achieved by shifting and/or merging the temperatures of the rhombohedral-orthorhombic and orthorhombic-tetragonal phase transitions to/at approximately room temperature [2,5,6,7,8]. Properties have also been improved by preparing KNN and KNN-based single crystals [9,10]. The use of single crystals allows the poling direction of the sample to be oriented in the crystallographic direction that has the best properties [11,12,13,14,15]. Domain engineering and ac poling techniques can also be used to improve the properties [16,17,18]. Single crystals of KNN-based materials have been prepared by methods such as flux growth, top-seeded solution growth, Bridgman growth and solid-state crystal growth [9,12,14,15,19,20,21,22].
In the solid-state crystal growth (SSCG) method, a piece of a single crystal (the seed crystal) is enclosed in a pellet of ceramic powder. The pellet is sintered, and a single crystal of the ceramic grows on the seed crystal [23,24,25]. The SSCG method has several advantages over conventional solution-growth techniques such as lower operating costs (due to the use of standard laboratory furnaces, obviating the need for specialised crystal growth furnaces and expensive Pt crucibles), reduced processing times, lower processing temperatures, and improved composition control [25]. KNN and KNN-based single crystals several millimetres in size have been grown by this method, the size being limited by the size and crystallographic orientation of the seed crystal [12,22,26,27,28,29,30,31,32,33]. However, using the SSCG method to grow KNN single crystals also has some disadvantages. The only suitable seed crystal found so far for KNN is KTaO3, which is expensive [34]. Single-crystal growth in the [001] direction is very slow, necessitating the use of [110]-oriented seed crystals [22,31]. This is inconvenient, as the best piezoelectric properties are found in the [001] direction [12,35,36]. Also, for KNN single crystals, the size of the grown crystal is limited by the size of the seed crystal because single crystal growth essentially stops once the rapidly growing (110) face has grown itself out of existence [22]. This also means that not all of the ceramic sample can be converted into a single crystal. Abnormal grain growth in the matrix can impede the growth of the single crystal and the single crystals are often very porous [26,27,31,37,38].
To overcome the limitation of having to use KTaO3 seed crystals, work has been carried out by several groups on seed-free solid-state crystal growth (seed-free SSCG). In this method, KNN-based single crystals are grown without using seed crystals by carefully controlling dopant addition and sintering schedule [39,40,41,42,43]. Grain growth is suppressed in the sample except for a small number of grains which grow rapidly to form abnormal grains. These abnormal grains grow and consume all the matrix grains in the sample, forming single crystals. Single crystals of centimetre size have been grown with good piezoelectric properties in KNN and KNN-based systems [39,40,41,42,43,44,45,46,47,48,49,50,51]. KNN-based single crystals grown by this method were successfully used to prepare an intravascular photoacoustic probe [52] and show potential for use as actuators [46,53].
Although seed-free SSCG has the advantage of not needing seed crystals, it also has some limitations. It is difficult to control the number and size of single crystals that grow in each sample, as the formation of abnormal grains takes place randomly. Morimoto et al. were able to limit the single-crystal growth of KNN to one crystal per sample by careful control of the alkali/niobium ratio and the amount of CuO and Bi2O3 dopants [43,54]. Sometimes, the grown single crystals are very porous [55]. In addition, work in our laboratory has found problems with the repeatability of the experiments. Single crystals can be grown successfully two or three times from a particular batch of powder, but after that single crystals no longer grow. For seed-free SSCG to take place, the sample has to contain at least one grain which is large enough to grow abnormally into a single crystal [24]. A particular sample may or may not contain such a grain depending upon its grain-size distribution. To overcome this problem, an artificially large grain may be added in the form of a seed crystal i.e., seeded SSCG, more commonly called SSCG. Ha et al. used a KTaO3 seed crystal to grow a single crystal of KNN in a composition originally developed for seed-free SSCG [56], but as far as we know no more work has been carried out on this topic. In the present work, we grow single crystals of two previously developed seed-free KNN compositions by both seed-free SSCG and seeded SSCG and compare the single crystals grown by each method.

2. Materials and Methods

Powders of composition 98.5 mol% (K0.5Na0.5)NbO3-1.5 mol% Ba1.05Nb0.77O3 (KNBaN) and 98.5 mol% (K0.5Na0.5)NbO3-1.5 mol% Ba(Cu0.13Nb0.66)O3 (KNBaCuN)were prepared by the mixed oxide method. These two compositions were found by Rahman et al. to be suitable for growing single crystals by seed-free SSCG [41]. Raw materials of Na2CO3 (Acros Organics, Geel, Belgium, 99.5% or Kanto, Tokyo, Japan, 99.8%), K2CO3 (Alfa Aesar, Heysham, Lancashire, United Kingdom, 99% or Daejung, Siheung-si, Republic of Korea, 99.5%), BaCO3 (Alfa Aesar, 99.8%), CuO (Alfa Aesar, 99.7%), and Nb2O5 (Daejung, 99.9%) were dried in an oven at 250 °C for 5 h to remove any adsorbed moisture. Stoichiometric amounts of the raw materials were ball-milled for 18 h in high-purity (99.9%) ethanol in a polypropylene jar with zirconia balls. Most of the ethanol in the slurries was evaporated by using a hot plate and magnetic stirrer and then the remaining ethanol was removed by drying the pastes in an oven at 80 °C for 24 h. The dried powders were crushed in an agate mortar and pestle and sieved through a 180 µm mesh to remove any agglomerates. The ground powders were calcined in high-purity alumina crucibles with lids at 900 °C for 3 h with heating and cooling rates of 5 °C·min−1. The calcined powders were ball-milled for 18 h as before. Separate jars, zirconia balls, mortar and pestles, sieves, and crucibles were used for each powder to avoid cross-contamination with CuO between powders. X-ray diffraction (XRD, Malvern Panalytical Empyrean, Malvern, UK) of the calcined powders was carried out in Bragg–Brentano geometry using CuKα radiation with a scan range of 20–90° 2θ, a step size of 0.026° and a scan speed of 3°·min−1. Background removal and pattern smoothing were carried out using Match! (Crystal Impact, Bonn, Germany). Kα2 peaks were not removed. The powders were stored in a desiccator.
For seed-free SSCG experiments, 0.5 g of powder was hand-pressed into a pellet in a stainless-steel die of 10 mm diameter. The pellet was then cold-isostatically pressed at 50 MPa. Samples were buried in packing powder in an alumina crucible with a lid and sintered at 1125 °C (KNBaCuN samples) or 1135 °C (KNBaN samples) for between 20–21 h, with heating and cooling rates of 5 °C·min−1. For seeded SSCG experiments, a KTaO3 seed crystal (MTI Corp, Richmond, CA, USA) with [001] or [110] orientation and dimensions of 2.5 mm × 2.5 mm × 0.5 mm was buried in the centre of 0.6 g powder and hand-pressed into a pellet in a stainless-steel die of 10 mm diameter. The pellet was then cold-isostatically pressed at 50 MPa. Samples were buried in packing powder in an alumina crucible with a lid and sintered at 1125 °C (KNBaCuN samples) or 1135 °C (KNBaN samples) for between 5–20 h, with heating and cooling rates of 5 °C·min−1. Separate crucibles were used for each composition to avoid CuO cross-contamination. The KNBaN samples were buried in packing powder of the same KNBaN composition but due to an experimental error, the seeded SSCG KNBaCuN samples were buried in a 98.5 mol% (K0.5Na0.5)(Nb0.99Sb0.01)O3-1.5 mol% Ba(Cu0.13Nb0.66)O3 packing powder. This may cause the seeded SSCG KNBaCuN single crystals to contain a trace amount of Sb. As a result, the Sb content of both the seed-free and seeded SSCG KNBaCuN single crystals was checked for during chemical analysis.
X-ray diffraction (XRD, Malvern Panalytical Empyrean, Malvern, UK) of the sintered bulk samples was carried out in Bragg-Brentano geometry using CuKα radiation with a scan range of 20–90° 2θ, a step size of 0.026°, and a scan speed of 3 °·min−1. Background removal and pattern smoothing were carried out using Match! (Crystal Impact, Bonn, Germany). Kα2 peaks were not removed. Single crystal XRD was carried out on selected samples grown by seeded SSCG with [001] KTaO3 seeds. For single-crystal XRD, the samples were vertically sectioned and polished to remove the part of the single crystal that contained the KTaO3 seed crystal. The polycrystalline regions of the sample were then removed by grinding with SiC paper, leaving only the KNN single crystal. Reflection data were collected using a Bruker APEX-II CCD-based diffractometer (Bruker AXS GmbH, Karlsruhe, Germany) with graphite-monochromated MoKα radiation (λ = 0.71073 Å). The hemisphere of the reflection data was collected as ω scan frames at 0.5°/frame and an exposure time of 5 s/frame. The cell parameters were determined and refined using the APEX2 program [57]. The data were corrected for Lorentz and polarization effects and an empirical absorption correction was applied using the SADABS program [58]. The compound structures were solved by direct methods and refined by full-matrix least squares using the SHELXTL program package [59] and Olex2 [60] with anisotropic thermal parameters for all nonhydrogen atoms. The chemical formula (K0.5Na0.5)NbO3 was used to refine the data.
For microscopy, samples were vertically sectioned with a diamond-wheel saw and polished to a 1 μm finish. The halves of the polished samples were thermally etched and Pt coated for microstructural analysis by scanning electron microscopy (SEM, Hitachi S-4700, Tokyo, Japan) equipped with an energy-dispersive X-ray spectrometer (EDX, Horiba EMAX Energy EX-200, Kyoto, Japan) using standard-less analysis. Grain-size distributions of some of the samples were measured from the micrographs using ImageJ v.1.46 software. The area of the grains was measured and converted to equivalent 2D spherical radii. At least 250 grains were measured for each sample. Porosity in the samples was estimated from the micrographs using ImageJ v.1.46. Electron probe microanalysis (EPMA, JEOL JXA-8530F PLUS, Tokyo, Japan) was carried out on selected single crystals to determine their chemical composition. Samples were polished to a 1 μm finish using diamond paste but not thermally etched. Wavelength-dispersive spectroscopy analysis was carried out using an accelerating voltage of 15 kV. NaAlSi2O6, KNbO3, BaSO4, Cu, and Sb were used as standards.

3. Results

3.1. 98.5 mol% (K0.5Na0.5)NbO3-1.5 mol% Ba1.05Nb0.77O3 Seed-Free Solid-State Crystal Growth

XRD patterns of the calcined KNBaN and KNBaCuN powders are shown in Figure 1. Both patterns can be indexed with Crystallography Open Database pattern #96-230-0500 for (K0.5Na0.5)NbO3 (orthorhombic, Amm2). Both powders appear to be single phase. The peaks are very broad and neighbouring peaks merge together, making identification of individual peaks difficult. The broad peaks indicate a submicron particle size [61]. Both powders had been stored in a desiccator for over 12 months when these XRD patterns were taken, indicating that both powders are stable against the formation of second phases.
Single crystals of KNBaN grown by seed-free SSCG at 1135 °C for 20 h are shown in Figure 2. Several single crystals up to ~5 mm in size have grown in the sample. The single crystals that grew from the bottom of the sample are a different colour than those that grew from the top of the sample. The density of a piece of this sample was measured by the Archimedes method in deionised water. The density value (mean and standard deviation of five measurements) was 89.8 ± 0.3% of the theoretical density, using the calculated theoretical density value from Table 4.
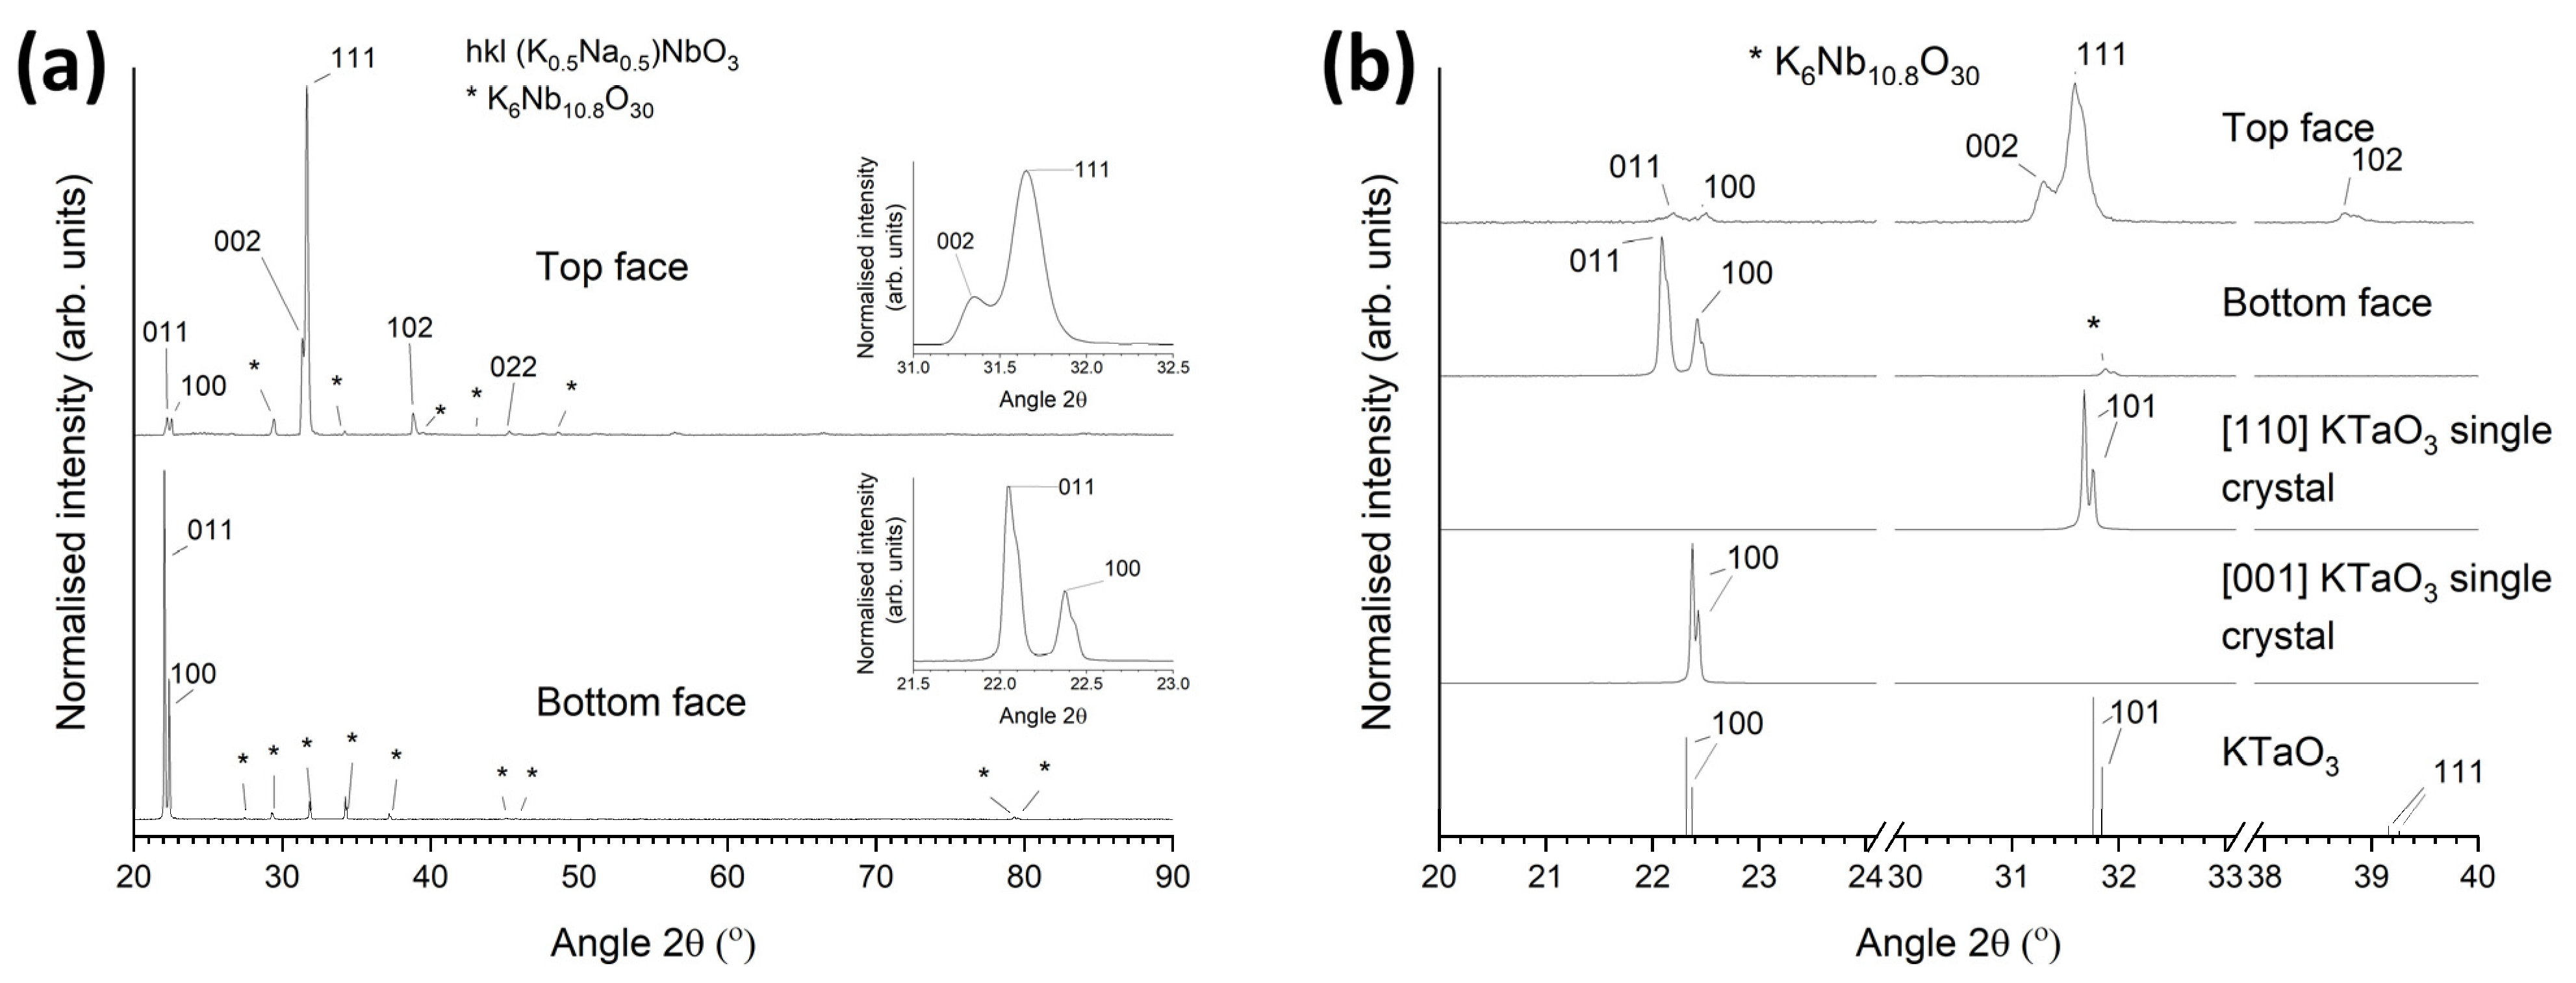
XRD patterns of the as-sintered top and bottom faces of this sample are shown in Figure 3a. The insets show the major peaks. Both patterns were indexed using Crystallography Open Database pattern #96-230-0500 for (K0.5Na0.5)NbO3 (orthorhombic, Amm2). The pattern of the top face contains very strong 111 and 002 peaks and weaker 011, 100, 102, 022, and 202 peaks. The pattern of the bottom face contains strong 011 and 100 peaks and possibly very weak 022 and 200 peaks, visible if the intensity is viewed with a square-root scale. Both patterns contain peaks of a K6Nb10.8O30 second phase. For an X-ray diffractometer in the Bragg–Brentano configuration, only crystallographic planes which are parallel to the sample surface can diffract X-rays [62]. The appearance of very intense peaks shows that a large portion of the sample is single crystalline and that single crystals from a particular part of the sample grew with the same orientation. The weaker peaks from the top face of the sample may belong to single crystals that grew in a different orientation or to remaining matrix grains. The single crystals in the bottom part of the sample have grown in a different orientation to those in the top part of the sample. The splitting of the major peaks (111/002 for the top face and 011/100 for the bottom face) indicates the presence of non-180° ferroelectric or ferroelastic domains [63,64,65].
Figure 3b shows XRD patterns of the samples in the range 20–40° 2θ. XRD patterns of [110] and [001]-oriented KTaO3 single-crystal substrates scanned under the same conditions are also shown for comparison, along with the XRD stick pattern for KTaO3 (Crystallography Open Database pattern #96-210-2088 for KTaO3, cubic, P m 3 m ). FWHM values of the major peaks of the samples and single-crystal substrates were measured using the intermediate Lorentzian peak profile in Match! (Table 1). The Kα2 peaks were removed from the spectra before the FWHM values were measured. The peaks of the samples are much broader than the peaks of the KTaO3 substrates, and their corresponding FWHM values are larger. The increase in broadness and FWHM of the sample peaks compared to those of the KTaO3 substrates indicates the presence of strains, dislocations, ferroelastic domain walls, or local compositional variations in the KNBaN single crystals grown by seed-free SSCG [62,64,66,67,68].
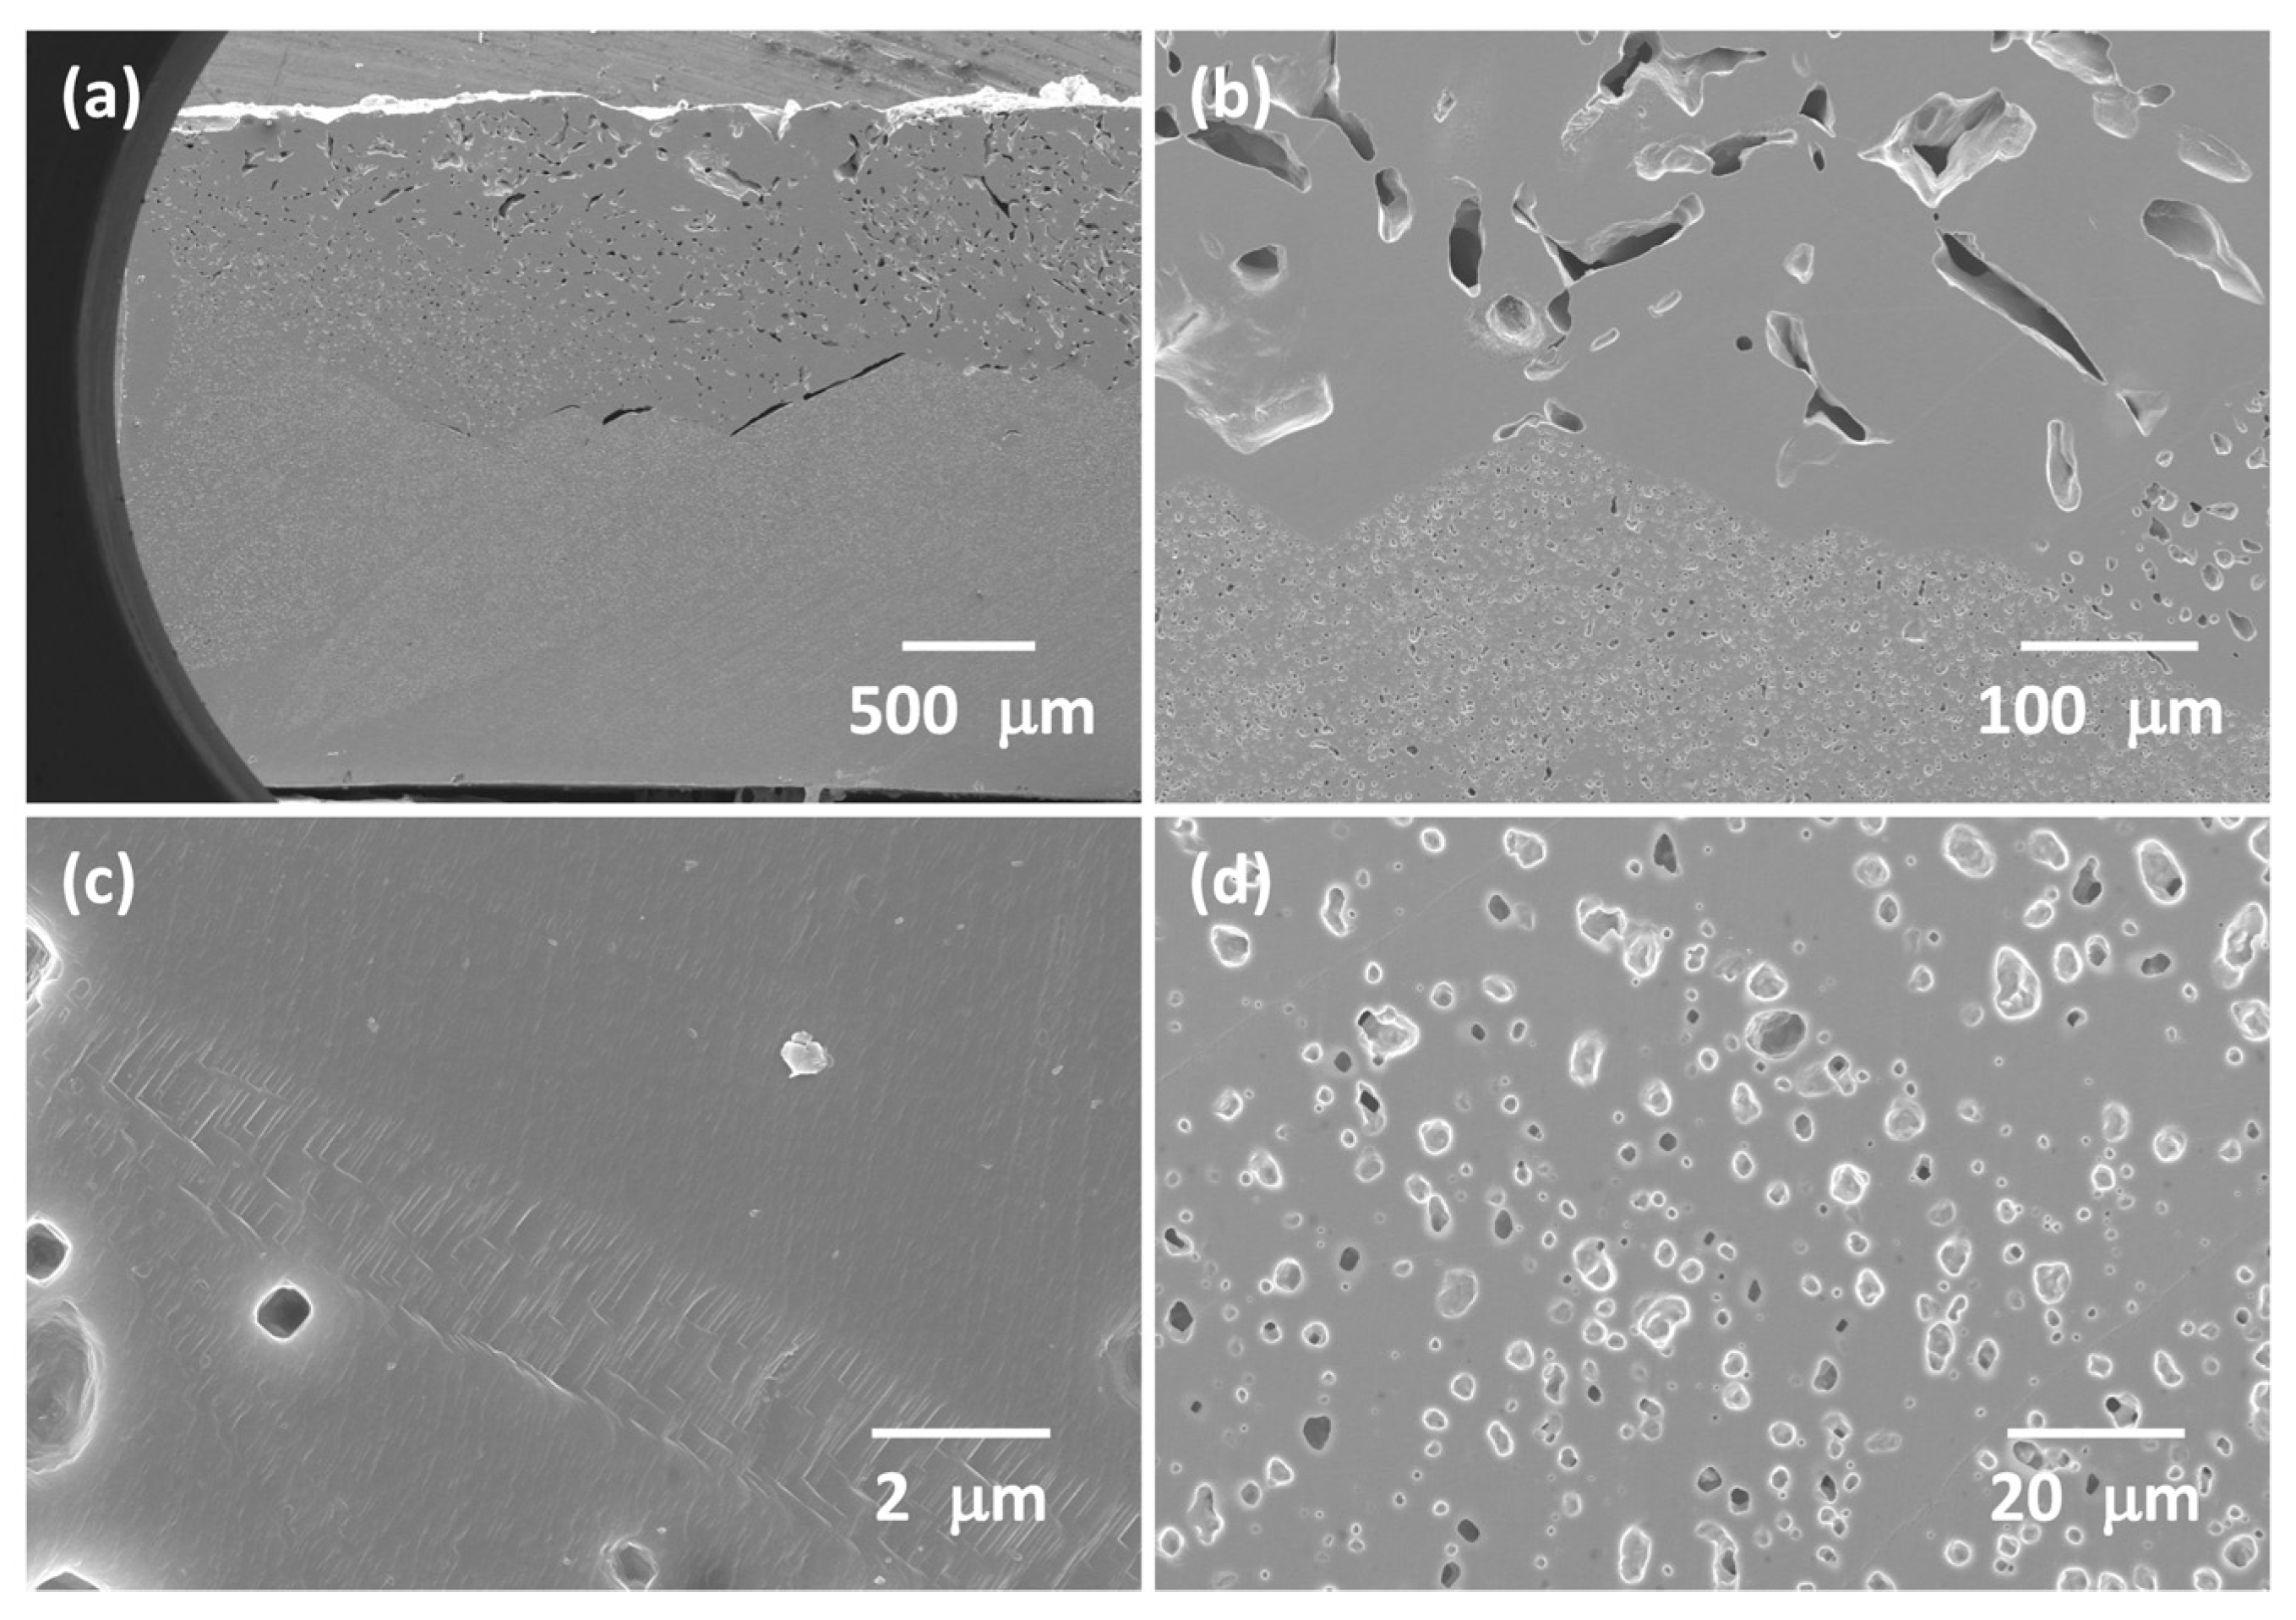
SEM micrographs of the polished and etched cross section of another KNBaN sample sintered at 1135 °C for 20 h are shown in Figure 4. Single crystals appear to have grown from the top and bottom faces of the sample. The sample is very porous. Estimates of the porosity measured from SEM micrographs are given in Table 2. The porosity values agree reasonably well with the density value of the sample in Figure 2. The single crystals that grew in the top part of the sample have fewer but larger pores than the single crystals that grew in the bottom part of the sample. The single crystals that grew in the top part of the sample are more porous than the single crystals that grew in the bottom part of the sample, and the porosity is less uniform. This probably explains the different colours of the single crystals in Figure 2 as the light will be reflected and scattered to different degrees by the differing number and size of the pores [69,70]. The boundaries between the crystals growing from the top and bottom parts of the sample are clearly faceted (Figure 4a,b). The boundary between two single crystals is shown in Figure 4c. The boundary does not look like a normal grain boundary, instead appearing as a series of steps. This boundary may possibly be a low-angle grain boundary, appearing as a series of dislocations [71]. Apart from this boundary dividing the top and bottom parts of the sample, no other grain boundaries were found. Porosity from a single crystal that grew in the bottom part of the sample is shown in Figure 4d. The pores are rectangular in shape and are aligned in the same direction. The EPMA results of the other half of the sample from Figure 4 are given in Table 3. The single crystals are slightly deficient in Na and K compared to the nominal composition. Ba1.05Nb0.77O3 has formed a complete solid solution with KNN.
Figure 5a shows a bulk XRD pattern of the as-sintered face of a KNBaN sample sintered at 1135 °C for 20 h in which seed-free SSCG did not take place. The pattern is typical of a polycrystalline ceramic and is indexed using Crystallography Open Database pattern #96-230-0500 for (K0.5Na0.5)NbO3 (orthorhombic, Amm2). The peaks are broad, due to the submicron size of the grains [61]. Figure 5 also shows an SEM micrograph of the same sample (Figure 5b). The sample consists of cubic submicron grains with stepped surfaces. Many small dots are present on the steps, but they are too small to measure their composition with SEM-EDS. Figure 5c shows the grain-size distribution of the sample. The grain-size distribution is very narrow and unimodal, with a mean grain size and standard deviation of 0.12 ± 0.04 μm.

3.2. 98.5 mol% (K0.5Na0.5)NbO3-1.5 mol% Ba1.05Nb0.77O3 Seeded Solid-State Crystal Growth: [001] KTaO3 Seed

A picture of a KNBaN single crystal grown on a [001] KTaO3 seed crystal is shown in Figure 6a. A cube-shaped single crystal has grown in the sample. Polycrystalline regions can be seen at the edges of the sample. An XRD pattern of the as-sintered top face of this sample is shown in Figure 6b. The pattern was indexed using Crystallography Open Database pattern #96-230-0500 for (K0.5Na0.5)NbO3. Unlike the patterns in Figure 3, as well as strong peaks belonging to the single crystal (in this case, 011 and 100 peaks), there are many peaks belonging to the polycrystalline regions at the edges of the sample. Peaks belonging to a K6Nb10.8O30 second phase are also present. Figure 6c shows a magnified region of the XRD pattern in the range of 21.5–23.0° 2θ. The XRD pattern of the [001] KTaO3 single-crystal substrate and the Crystallography Open Database stick pattern #96-210-2088 for KTaO3 are also shown for reference. The KNBaN single crystal has grown epitaxially on the KTaO3 seed crystal. The d-spacing and FWHM of the 011 and 100 peaks of the single crystal are given in Table 1. It is clear that the peaks of the single crystal grown by SSCG on a [001] KTaO3 seed crystal have shifted to lower d-spacing values than the peaks of the single crystals grown by seed-free SSCG. The 011 and 100 peaks of the seeded KNN SSCG single crystal are also more closely-spaced than the 011 and 100 peaks of the seed-free KNN SSCG single crystal, indicating that epitaxial growth of the KNN single crystal on the KTaO3 seed crystal has caused a small change in lattice parameters. The FWHM values of the 011 and 100 peaks of the seeded KNN SSCG single crystal are larger than those of the 011 and 100 peaks of the seed-free KNN SSCG single crystal, indicating that epitaxial growth of the KNN single crystal on the KTaO3 seed crystal has caused an increase in strain and/or a change in domain structure.
Figure 6d shows a diffraction pattern of the KNBaN single crystal taken by single-crystal XRD. The appearance of Bragg peaks confirms that the sample is a single crystal [72]. The single-crystal XRD results for this sample are given in Table 4. The full results are given in Tables S1–S6 of the Supplementary Materials. The data is refined using a monoclinic unit cell with space group P2. KNN can be indexed with an orthorhombic or monoclinic unit cell depending on the choice of axes [73]. The theoretical density value in Table 4 is calculated using the nominal composition of KNBaN. The theoretical density is higher than that for KNN [74], due to the incorporation of Ba.
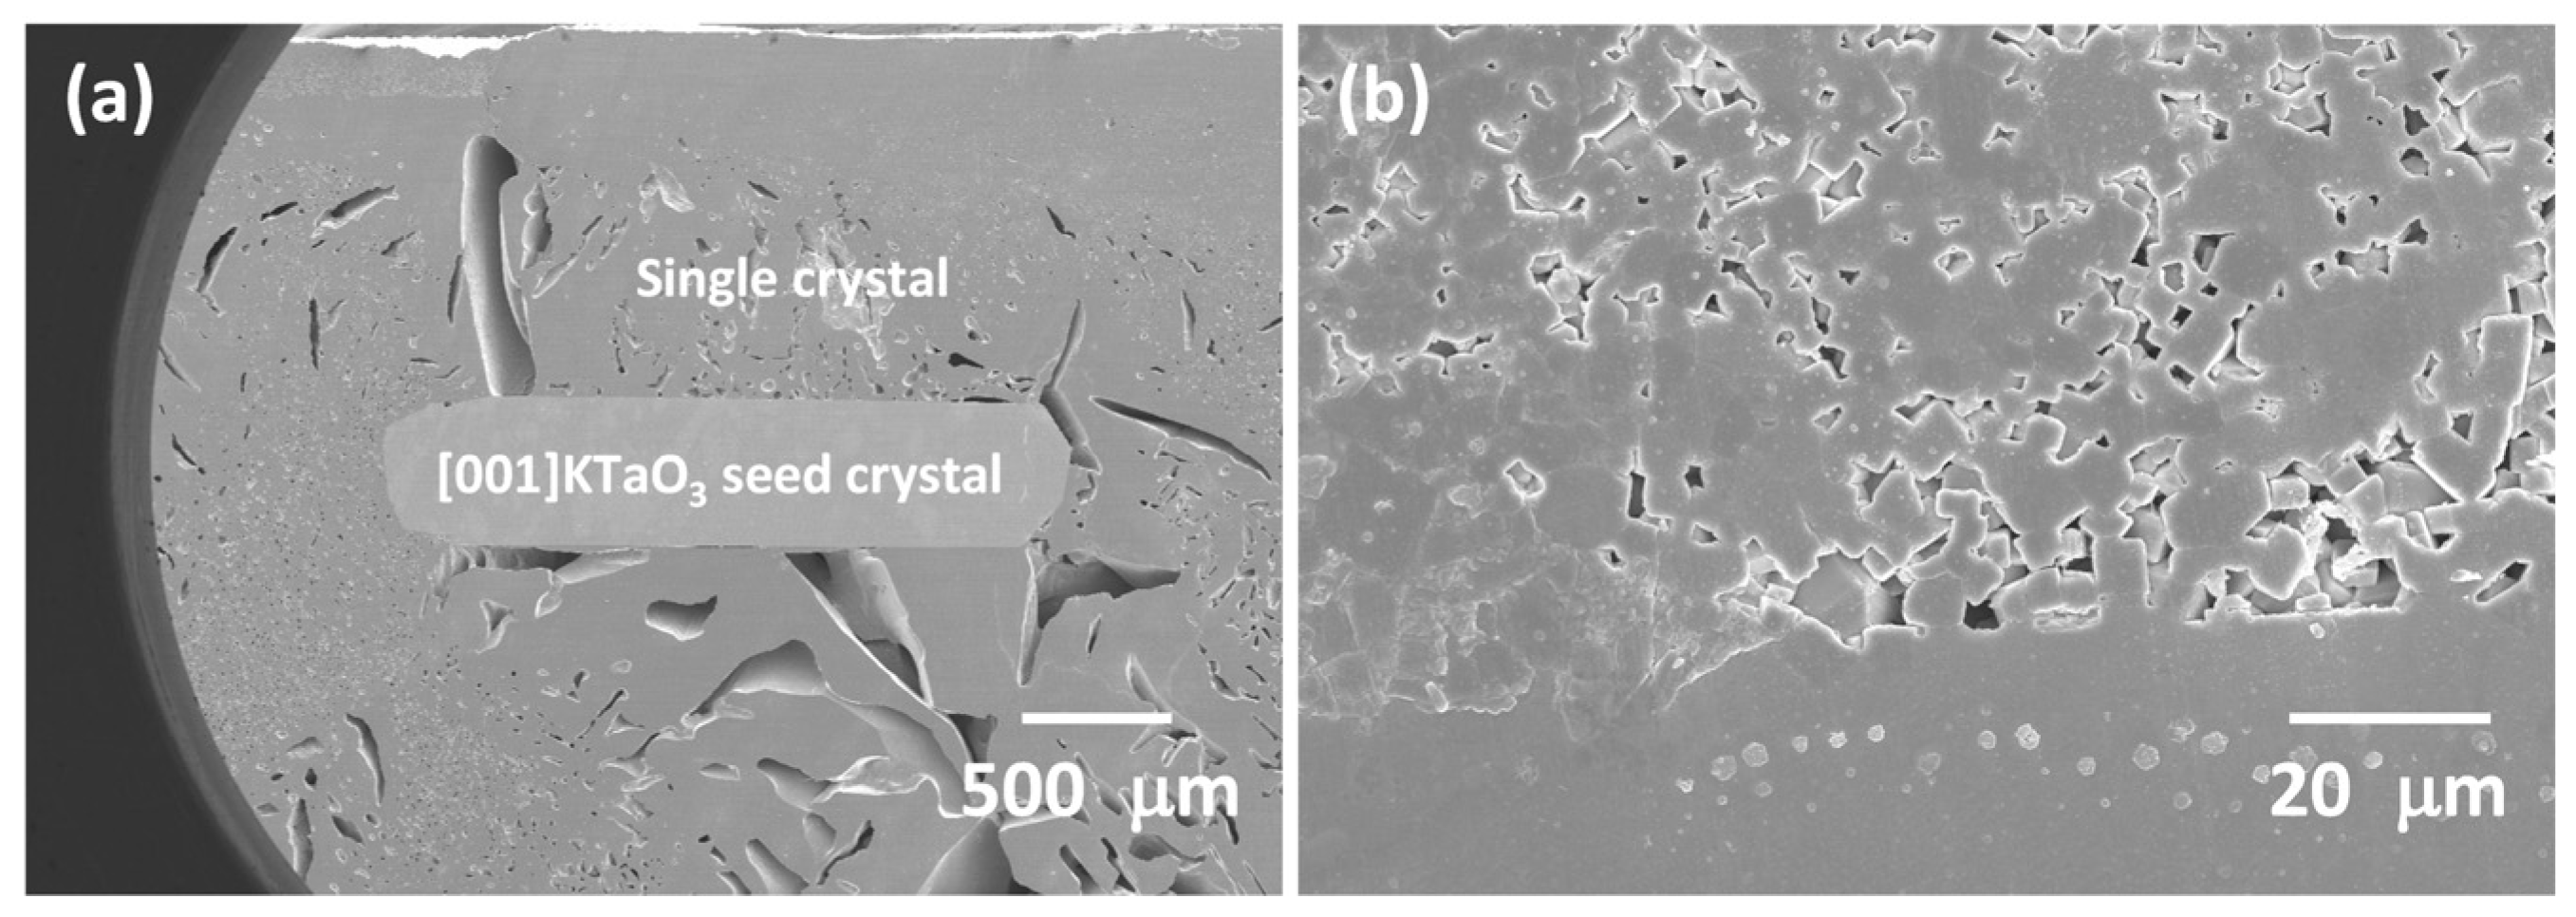
Figure 7a shows a cross-sectional polished and etched SEM micrograph of a KNBaN sample with [001] KTaO3 seed crystal sintered at 1135 °C for 5 h. A single crystal has grown throughout almost the whole sample. The single crystal is very porous, with a wide range of pore sizes. The mean porosity value is intermediate between that of the KNBaN single crystals grown by seed-free SSCG (Table 2). A region of matrix grains is visible in the top left corner of Figure 7a. This region is shown in Figure 7b. The edge of the single crystal is visible at the bottom of the micrograph. Grain growth has taken place, with cubic grains of up to 10 μm in diameter present. EDS of the second-phase particles on the single crystal shows them to contain Na, K, and Cl. They are probably contamination picked up during sample polishing and etching.

3.3. 98.5 mol% (K0.5Na0.5)NbO3-1.5 mol% Ba(Cu0.13Nb0.66)O3 Seed-Free Solid-State Crystal Growth

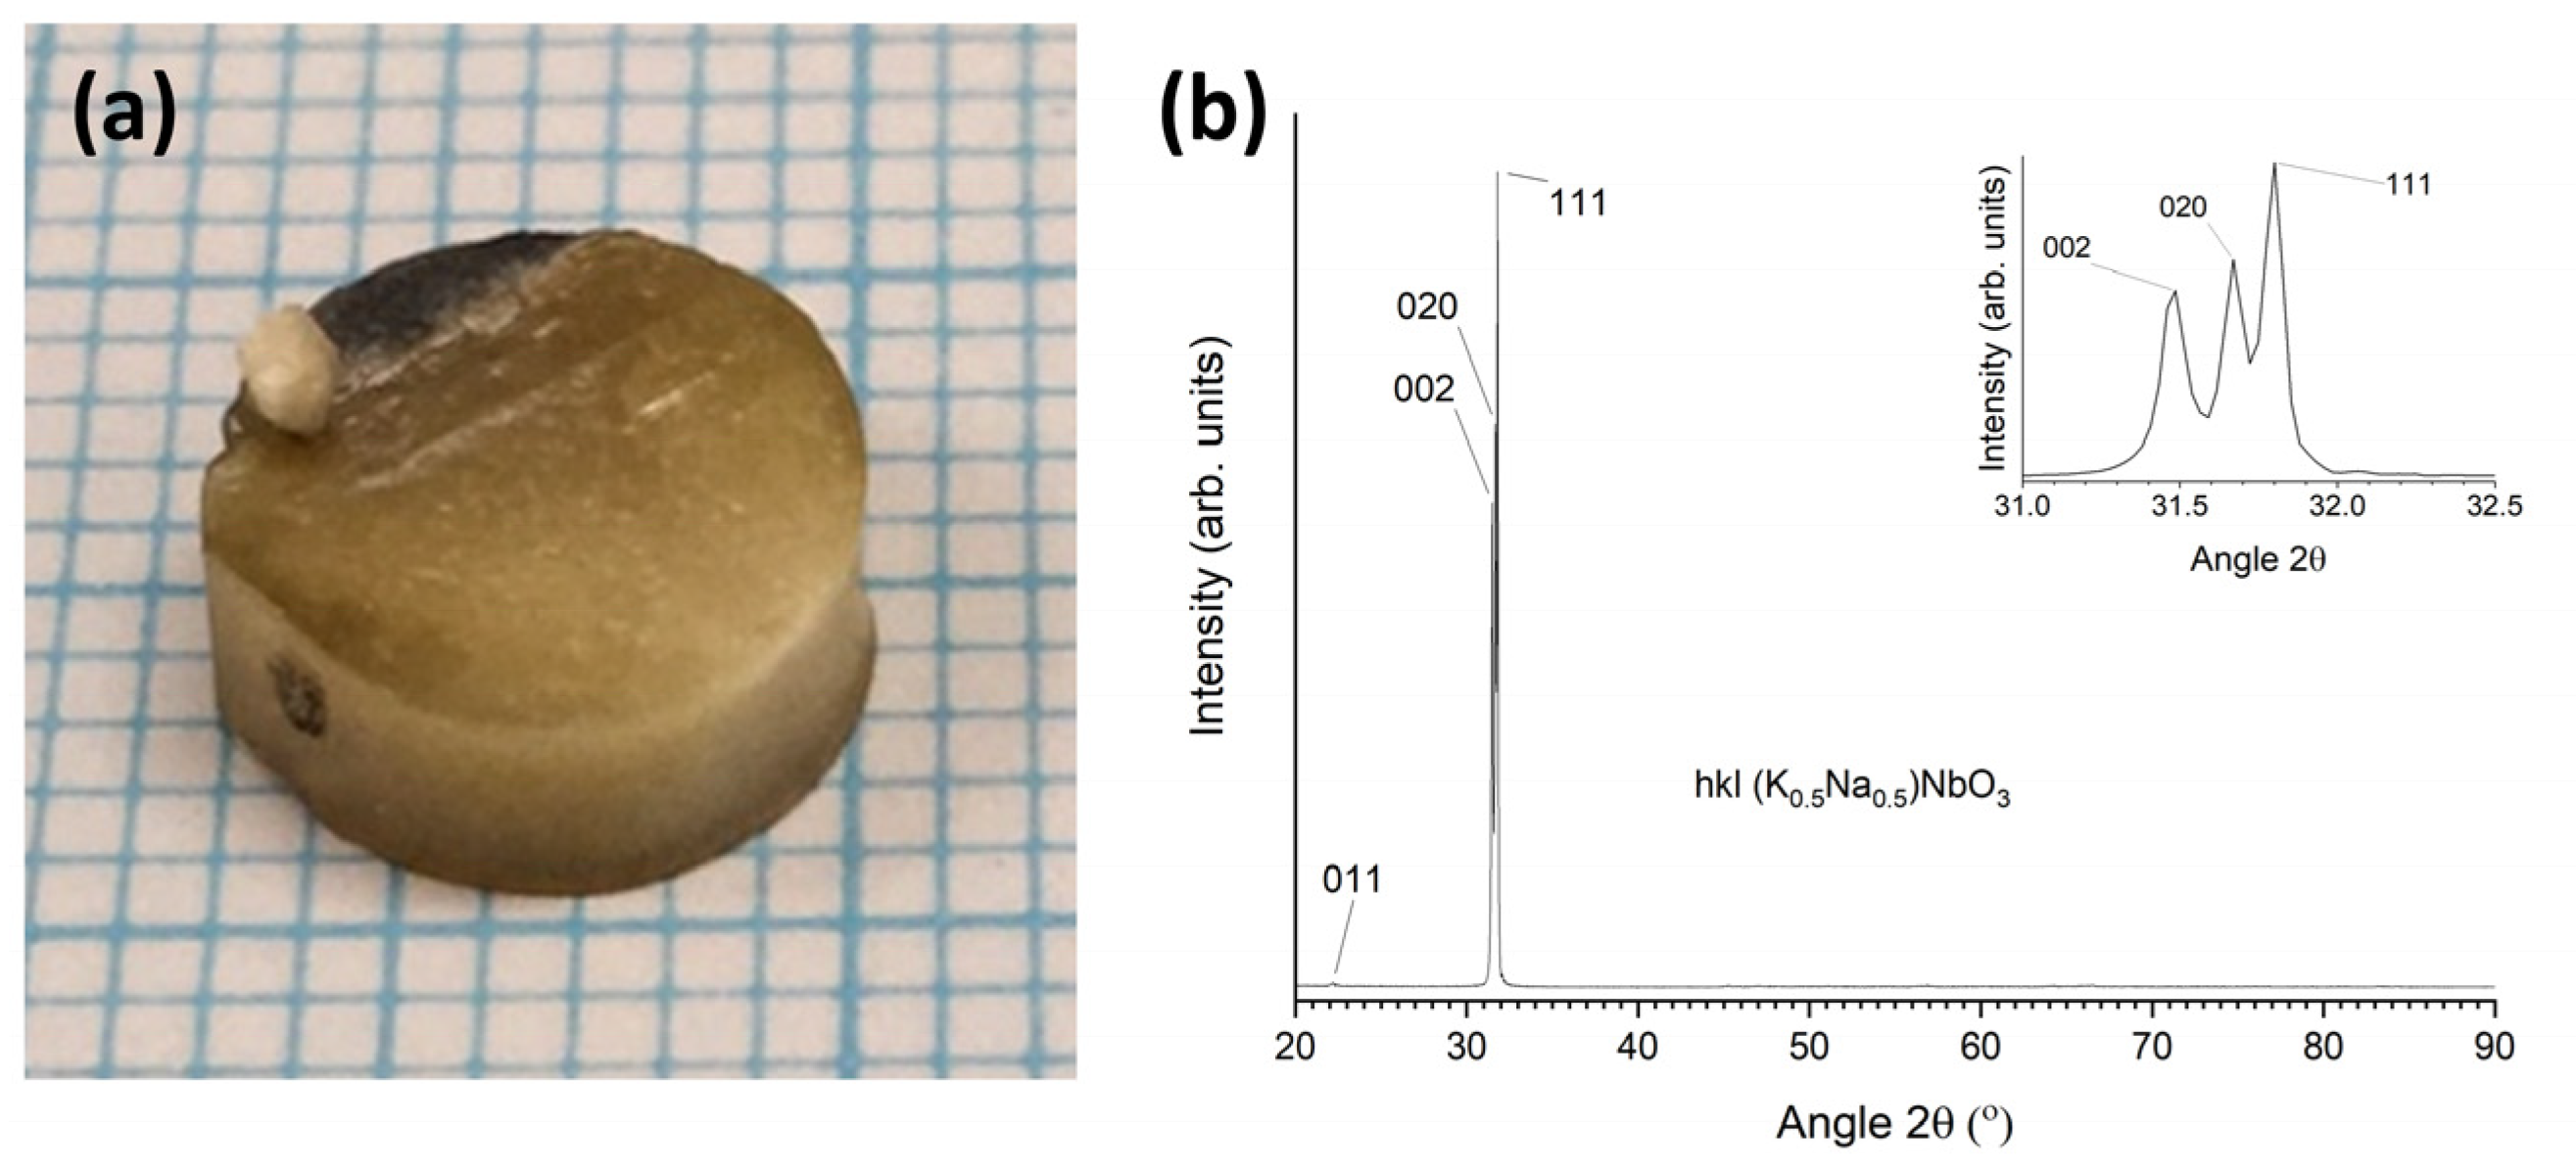
A single crystal grown by seed-free SSCG in a KNBaCuN sample is shown in Figure 8a. A single crystal, bronze in colour, has grown through most of the sample. A polycrystalline region, grey in colour, is present in the top left part of the sample. The sample is similar in appearance to those grown by Ahn et al. [39,42]. The polycrystalline part of the sample was removed by grinding and the Archimedes density of the single-crystal part was measured as before. The Archimedes density (mean and standard deviation of five measurements) is 96.6 ± 0.3% theoretical density, using the theoretical density value from Table 4. The density is slightly lower than that of other KNN single crystals prepared by seed-free SSCG [54]. An XRD pattern of a sectioned and polished sample prepared under identical conditions is shown in Figure 8b. The pattern was indexed using Crystallography Open Database pattern #96-230-0500 for (K0.5Na0.5)NbO3. Strong 002, 020, and 111 peaks are present, as well as a weak 011 peak. A magnified plot of the intense peaks is shown in the inset. Very weak 022, 202, and 222 peaks, as well as very weak secondary-phase peaks of K3Nb8O21 or K6Nb10.8O30, are visible if the intensity is viewed with a log scale. Unlike the corresponding seed-free SSCG KNBaN sample (Figure 3, top face), the peaks at 31~32° 2θ are narrow and are split into three peaks. Peak positions and FWHM are given in Table 1. The FWHM values for the 111 and 020 peaks of the seed-free SSCG KNBaCuN sample are smaller than the corresponding values for the seed-free SSCG KNBaN sample, indicating less strain or a change in domain structure in the KNBaCuN single crystal. The XRD pattern for this sample was taken on a polished sample, whereas the pattern for the seed-free SSCG KNBaN sample was taken on the as-sintered sample. Possibly polishing has removed some of the strain from the sample.
SEM micrographs of a polished and etched KNBaCuN sample sintered at 1125 °C for 20 h are shown in Figure 9. This sample was polished on its top face. In this sample, several single crystals have grown (Figure 9a). This sample also contains pores (Figure 9b,c), although far fewer than the corresponding KNBaN sample. The porosity is approximately between half and one quarter of that of the corresponding KNBaN sample (Table 2). The porosity value agrees well with the theoretical density of the sample in Figure 8a. The grain boundaries between the single crystals appear to be regular grain boundaries and are faceted (Figure 9d). The steps on the surfaces of the single crystals in (Figure 9d) may be present because the surfaces are vicinal or may have been caused by the faceting of the polished surfaces into lower-energy crystallographic planes during thermal etching [75,76]. SEM-EDS of the hexagon-shaped phases in Figure 9d shows them to contain Si and Al. They are probably contamination picked up during sample polishing and etching.
Table 5 shows EPMA results for a KNBaCuN sample sintered at 1125 °C for 21 h. Similar to the KNBaN sample, this sample is also Na and K deficient. Most of the Ba(Cu0.13Nb0.66)O3 appears to have entered a solid solution with (K0.5Na0.5)NbO3. The Cu is assumed to enter the B-site of the perovskite lattice [77,78]. Some Cu may have not entered into a solid solution but the small amount of Cu makes accurate measurement difficult. The origin of the trace amount of Sb is not known, as this sample was buried in 98.5 mol% (K0.5Na0.5)NbO3-1.5 mol% Ba(Cu0.13Nb0.66)O3 packing powder during sintering.

3.4. 98.5 mol% (K0.5Na0.5)NbO3-1.5 mol% Ba(Cu0.13Nb0.66)O3 Seeded Solid-State Crystal Growth: [001] KTaO3 Seed

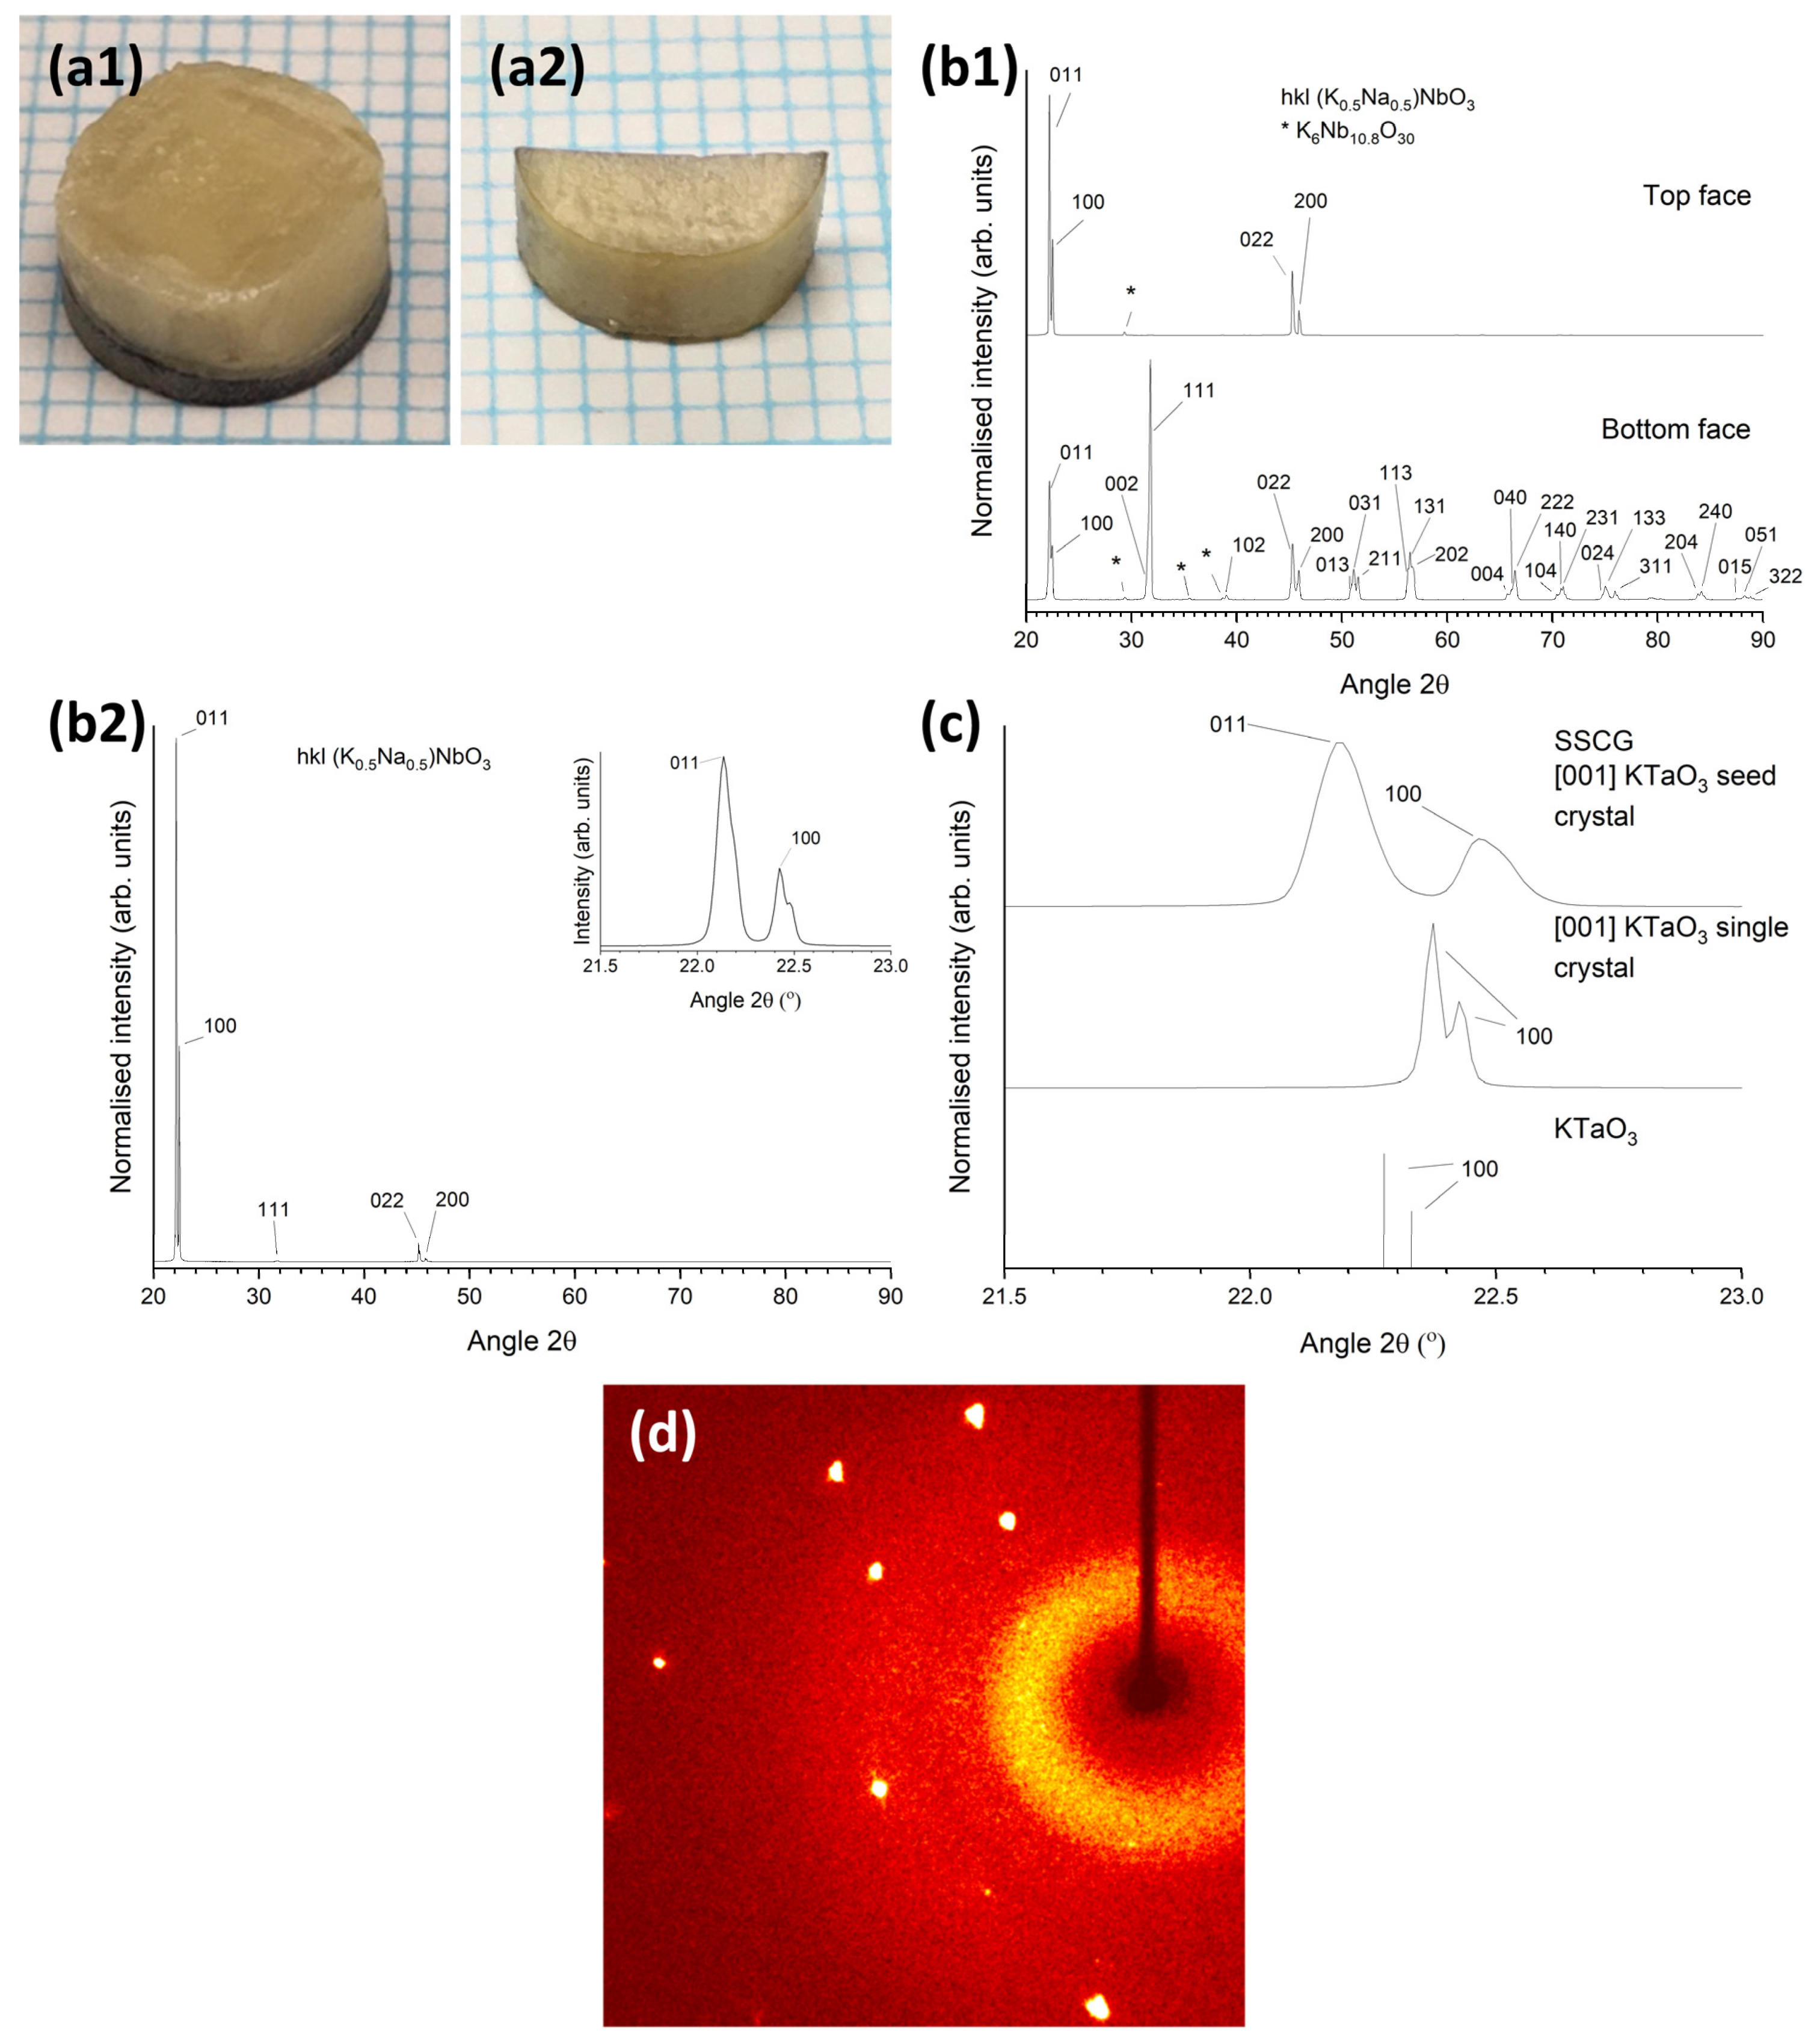
Pictures of single crystals grown in KNBaCuN samples with [001] KTaO3 seed crystals sintered at 1125 °C for 10 h are shown in Figure 10. In Figure 10(a1) a single crystal has partially grown through the sample and in Figure 10(a2) a single crystal has grown throughout the whole sample (the sample was sectioned before the picture was taken). Figure 10b shows XRD patterns of the as-sintered samples in Figure 10a. All patterns were indexed using Crystallography Open Database pattern #96-230-0500 for (K0.5Na0.5)NbO3. The pattern of the top face of the sample in Figure 10(b1) shows strong 0kl and h00 peaks, along with very weak 104 and 033 peaks (visible when intensity is viewed with a log scale), indicating that the top part of the sample in Figure 10(a1) is a single crystal. The pattern of the bottom face shows that the bottom part of the sample is polycrystalline. A K6Nb10.8O30 second phase is also present. Figure 10(b2) shows a pattern of the top face of the sample from Figure 10(a2). The pattern was indexed using Crystallography Open Database pattern #96-230-0500 for (K0.5Na0.5)NbO3. Strong 011 and 100 peaks are present, as well as weak 111, 022, and 200 peaks. Very weak 031, 113, and 222 peaks are visible if the intensity is viewed with a log scale, along with a very-weak secondary-phase peak (K6Nb10.8O30). A magnified plot of the 011 and 100 peaks is shown in the inset.
Figure 10c shows the XRD pattern of the sample from (Figure 10(b1), top face) in the range 21.5–23.0° 2θ, along with the XRD pattern of the [001]-oriented KTaO3 single-crystal substrate and the stick pattern for KTaO3. The KNBaCuN single crystal has grown epitaxially on the KTaO3 seed crystal. The d-spacings and FWHM values of the 011 and 100 peaks of the KNN single crystal are given in Table 1. Similar to the KNBaN single crystal grown on a [001] KTaO3 seed crystal, there is a mismatch in d-spacing between the KNN single crystal and the [001] KTaO3 substrate. The mismatch between the KNN single crystal 100 peak and the 100 peak of the KTaO3 seed crystal is smaller for the KNBaCuN single crystal (0.0164 Å) than for the KNBaN single crystal (0.0261 Å). The FWHM values of the 011 and 100 peaks of the KNBaCuN single crystal are also smaller than those of the KNBaN single crystal grown on a [001] KTaO3 seed crystal, indicating less strain in the KNBaCuN single crystal. The 011 and 100 peaks of the KNBaCuN single crystal are more clearly separated than those of the KNBaN single crystal due to their narrower widths (Figure 6c). Figure 10d shows a diffraction pattern of the KNBaCuN single crystal taken by single-crystal XRD. The appearance of Bragg peaks again confirms that the sample is a single crystal. The single crystal XRD results for a KNBaCuN single crystal grown on a [001] KTaO3 seed crystal by sintering at 1125 °C for 10 h are given in Table 4. The full results are given in Tables S7–S12 of the Supplementary Materials. The theoretical density value in Table 4 is calculated using the nominal composition of KNBaCuN. The small change in density and unit-cell parameters is due to the incorporation of Cu.
Figure 11 shows polished and etched cross-sectional SEM micrographs of a KNBaCuN single crystal grown on a [001] KTaO3 seed crystal [the other half of the sample from Figure 10(a2)]. The single crystal is much less porous than the corresponding KNBaN single crystal. The region of the single crystal next to the seed crystal is shown in Figure 11b. The pores are rectangular in shape and are aligned in the same direction. Porosity in this region is approximately equal to that of the seed-free SSCG KNBaN single crystal grown from the bottom of the sample (Table 2). The region of the single crystal next to the sample edge is shown in Figure 11c. This region is completely pore free.
Table 6 shows the EPMA results for a KNBaCuN sample with a [001] KTaO3 seed crystal sintered at 1125 °C for 10 h. Similar to the previous samples, this sample is also Na and K deficient. Compared to the KNBaN sample, the KNBaCuN samples are more alkali deficient. All of the Ba(Cu0.13Nb0.66)O3 appears to have entered solid solution with KNN. The sample contains a trace amount of Sb. For this sample, a 98.5 mol% (K0.5Na0.5)(Nb0.99Sb0.01)O3-1.5 mol% Ba(Cu0.13Nb0.66)O3 packing powder was used during sintering. However, the Sb content is the same as that of the KNBaCuN sample prepared by seed-free SSCG with a (K0.5Na0.5)NbO3-1.5 mol% Ba(Cu0.13Nb0.66)O3 packing powder (Table 5). Use of the (K0.5Na0.5)(Nb0.99Sb0.01)O3-1.5 mol% Ba(Cu0.13Nb0.66)O3 packing powder did not appear to affect the composition of the KNBaCuN single crystal.
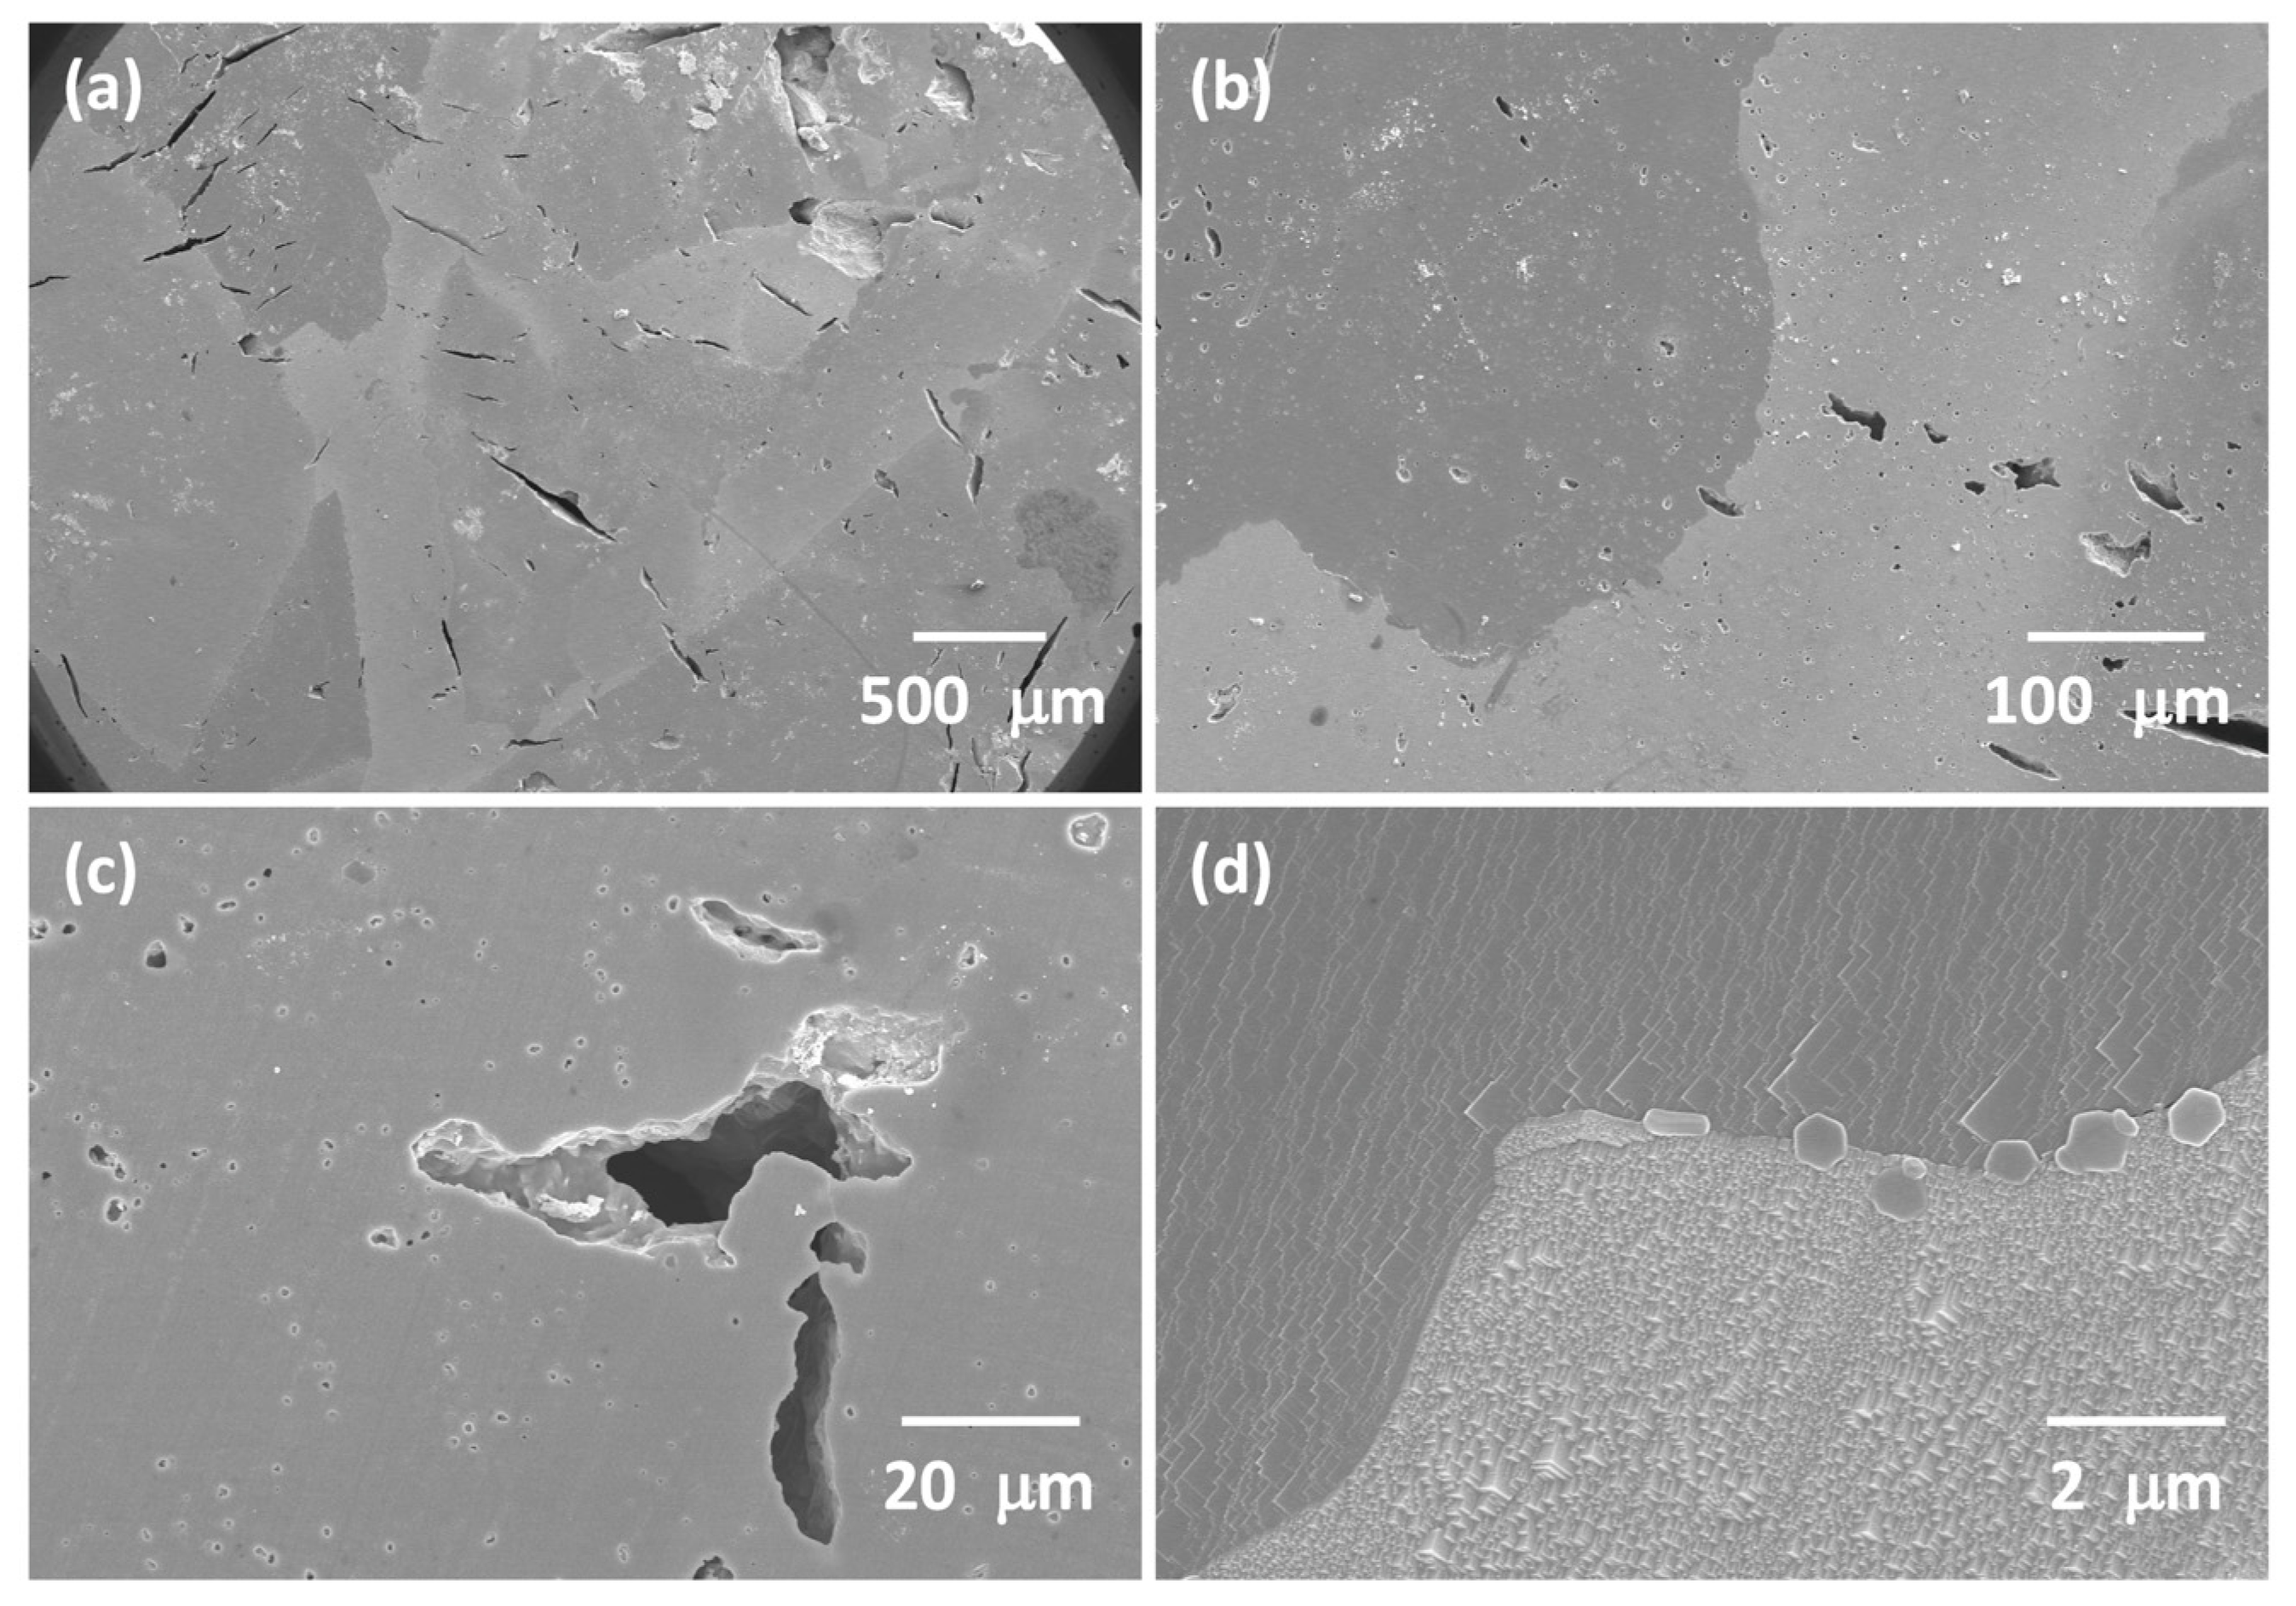
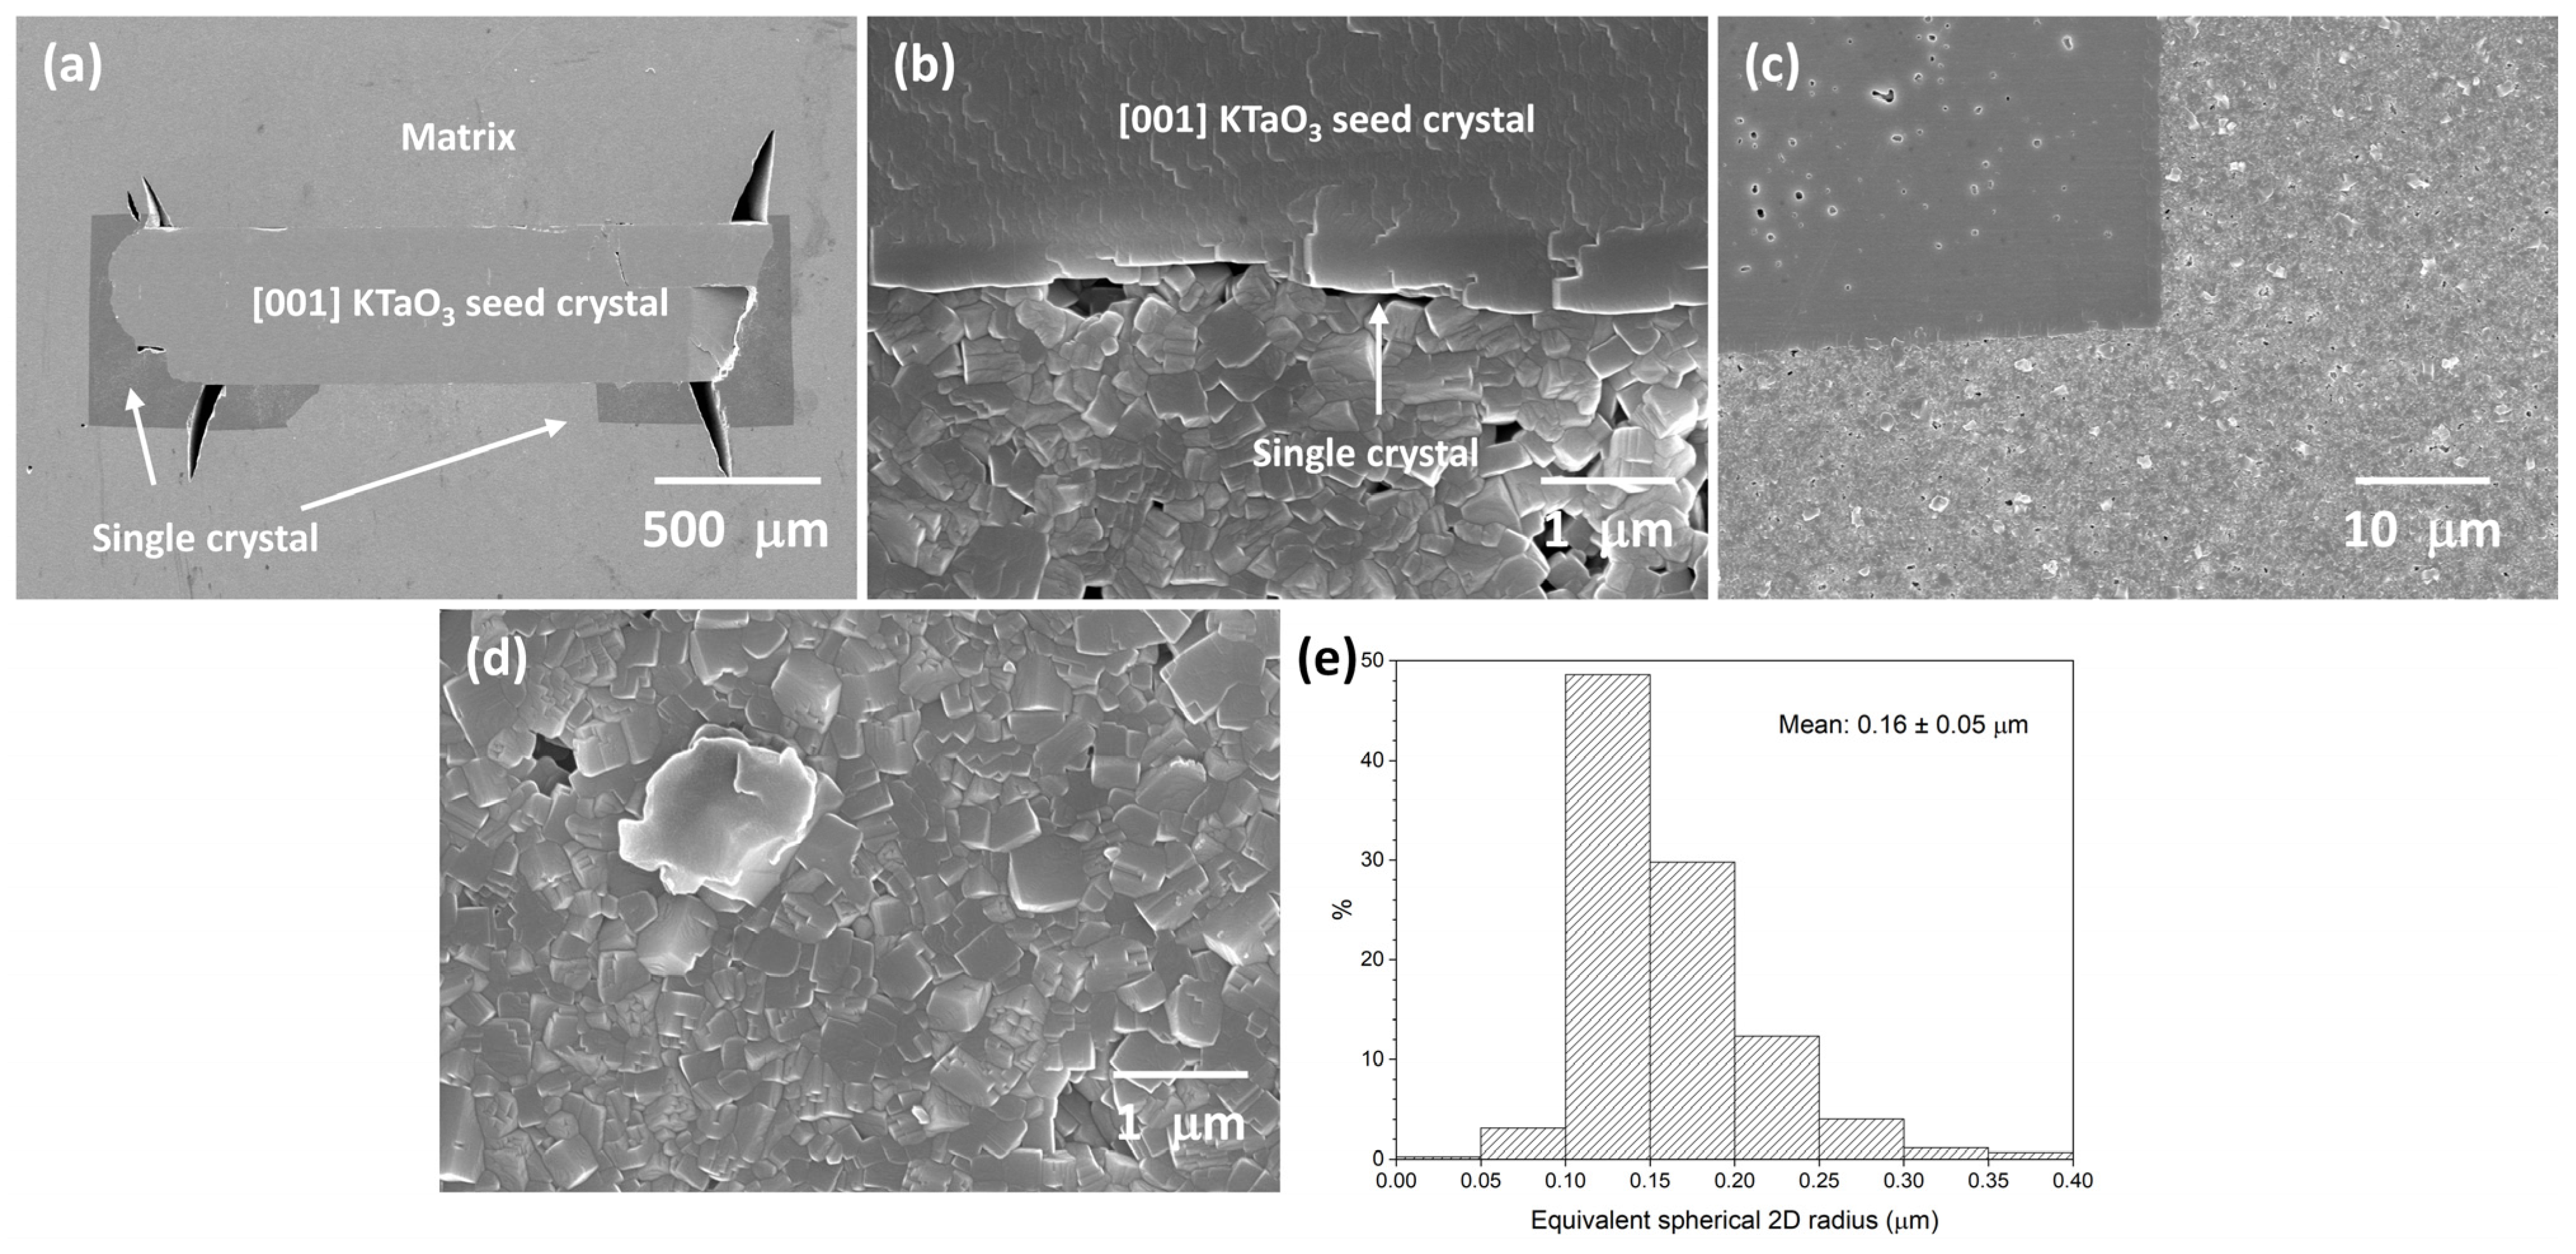
Figure 12 shows SEM micrographs of a KNBaCuN SSCG experiment that was unsuccessful. Single-crystal growth has only taken place at the edges and along part of the bottom face of the seed crystal (Figure 12a). For the rest of the bottom face of the seed crystal, single-crystal growth has barely taken place (Figure 12b). Even in the regions where single-crystal growth has taken place, it is very limited compared to the sample in Figure 11. The single crystal contains small pores (Figure 12c). Matrix grain size in this sample is submicron and no abnormal grain growth appears to have taken place (Figure 12d). The matrix is dense and contains small pores. Second-phase particles are visible in the matrix (Figure 12c,d). EDS shows these particles contain Na, K, Cu, and Nb and are Cu rich, containing between 17–27 at.% Cu. Figure 12e shows the grain-size distribution of the matrix grains. The grain-size distribution is narrow and unimodal, with a mean grain size and standard deviation of 0.16 ± 0.05 μm.

3.5. 98.5 mol% (K0.5Na0.5)NbO3-1.5 mol% Ba(Cu0.13Nb0.66)O3 Seeded Solid-State Crystal Growth: [110] KTaO3 Seed

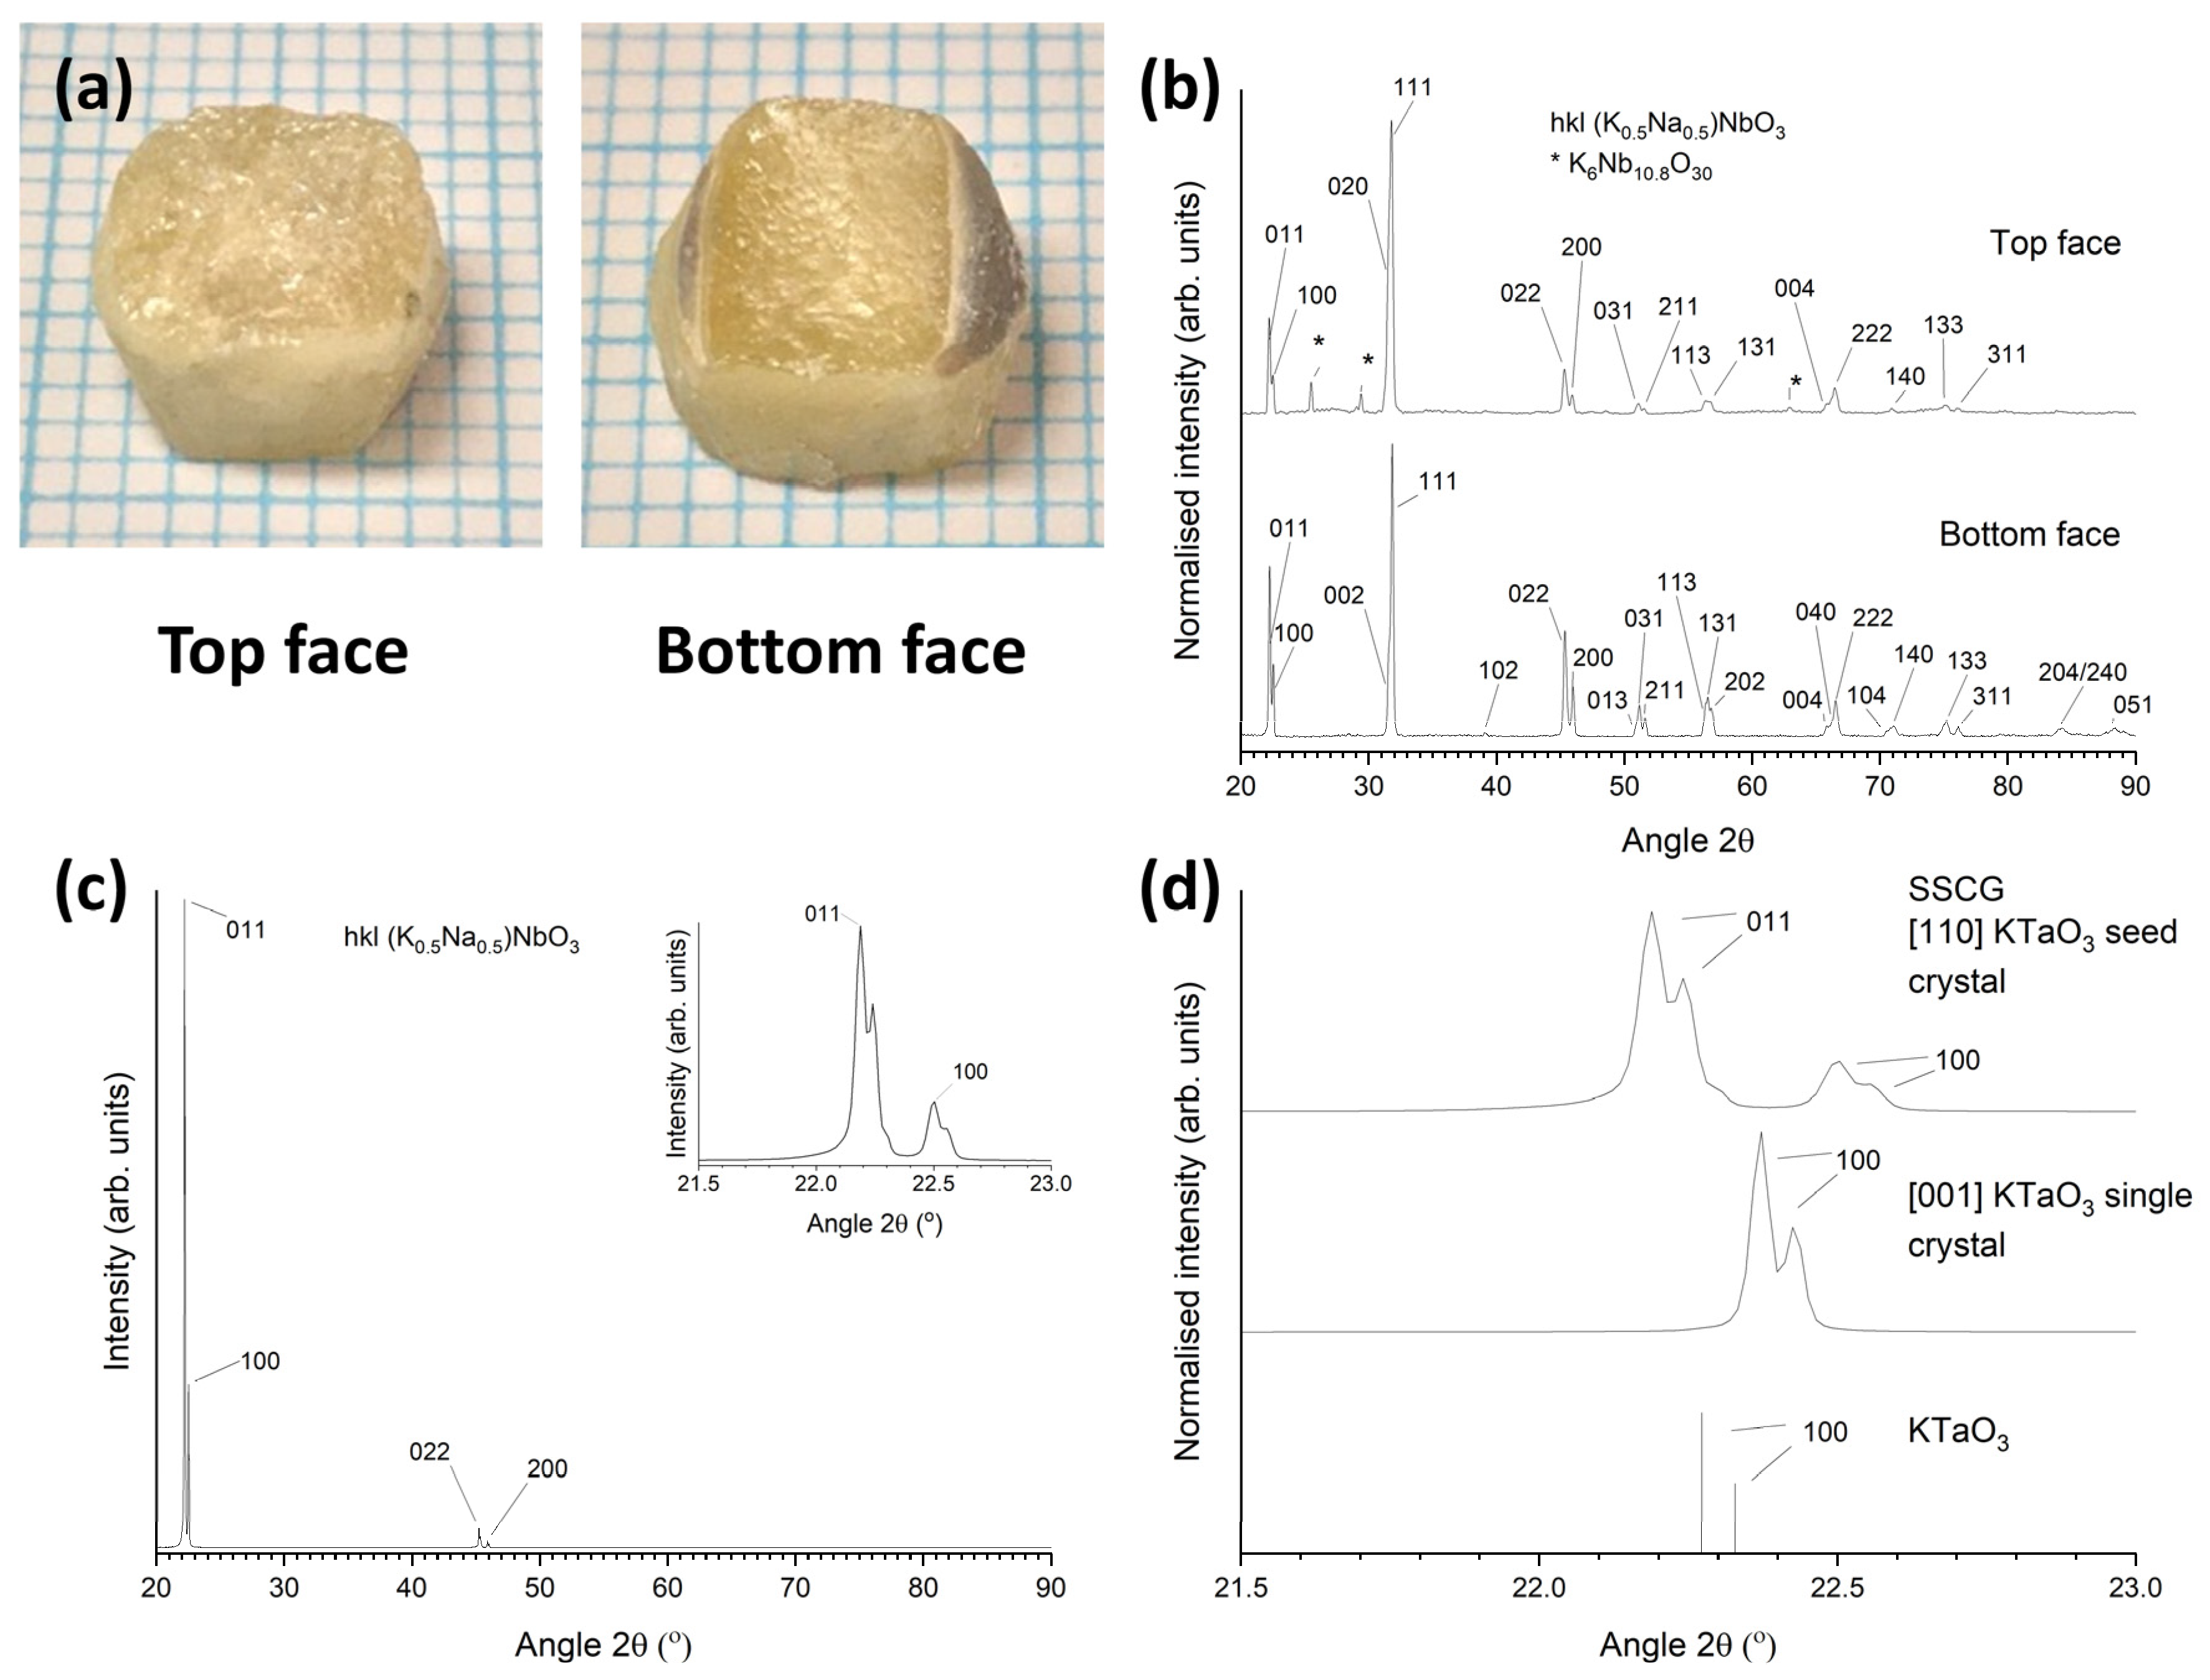
Figure 13a shows pictures of a KNBaCuN sample with [110] KTaO3 seed crystal sintered at 1125 °C for 10 h. A single crystal has grown throughout almost the whole sample. The bottom face of the sample shows some grey-coloured polycrystalline regions. Figure 13b shows bulk XRD patterns of the as-sintered top and bottom faces of this sample. Both patterns were indexed using Crystallography Open Database pattern #96-230-0500 for (K0.5Na0.5)NbO3. Unlike the sample grown with a [001] KTaO3 seed crystal, this sample appears to be polycrystalline on both faces. Figure 13c shows an XRD pattern of the cross-sectioned and polished face of the same sample. The pattern shows strong 0kl and h00 peaks. This shows that the sample is actually a single crystal. A magnified plot of the 011 and 100 peaks is shown in the inset.
Figure 13d shows the XRD pattern of the sample from Figure 13c in the range 21.5–23.0° 2θ, along with the XRD pattern of the [001]-oriented KTaO3 single-crystal substrate and the stick pattern for KTaO3. The d-spacings and FWHM values of the 011 and 100 peaks of the KNN single crystal are given in Table 1. The peaks are noticeably narrower and the values of FWHM are smaller than the corresponding peaks of the KNBaCuN sample grown on a [001] KTaO3 seed crystal (Figure 10(b2,c)). The FWHM values of the 011 and 100 peaks are similar to that of the [110] KTaO3 substrate. The XRD pattern in Figure 13c,d was taken using a polished sample whereas the XRD pattern in Figure 10(b2,c) was taken using the as-grown sample. Possibly polishing can remove some of the strain in the sample.
Figure 14 shows SEM micrographs of the cross-sectioned, polished, and thermally etched sample shown in Figure 13. A single crystal has grown on the [110] KTaO3 seed crystal and has consumed almost all the matrix grains in the sample. The single crystal is very porous, similar to the KNBaN single crystal grown on a [001] KTaO3 seed crystal (Figure 7 and Table 2). The pores appear aligned in certain directions (Figure 14b). The boundary between the single crystal and the remaining matrix grains is shown in Figure 14c. Grain growth has taken place in the matrix in this sample. Some island grains are also trapped inside the single crystal.

4. Discussion

Several workers have studied the conditions necessary for seed-free SSCG to take place in (K0.5Na0.5)NbO3. Ahn et al. found that the formation of a liquid phase (by addition of CuO) and compensation of Na loss during sintering by donor doping (Ba) promoted seed-free SSCG [39]. Rahman et al. found that seed-free SSCG (with or without the addition of CuO) took place only within a certain range of donor addition [41]. Jiang et al. also found that seed-free SSCG only took place within a certain range of LiBiO3 addition [40]. Morimoto et al. found that adjusting the alkali/niobium ratio and the addition of Bi2O3 could control the number of single crystals that grew in K/Na-deficient samples, with too much Bi2O3 addition preventing crystal growth [43,54]. Donor doping also affects grain-growth behaviour in BaTiO3 and SrTiO3, with abnormal grain growth taking place up to a certain amount of donor dopant addition while further addition suppresses grain growth [79,80].
Solid-state crystal growth and seed-free solid-state crystal growth are basically a form of deliberately induced abnormal grain growth, in which some grains with sufficient driving force for growth grow to an unusually large size. The equation for ΔG, the driving force for the growth of a particular grain in a system with solid/liquid interfaces is [81,82,83]:
G = 2 γ V m 1 r 1 r
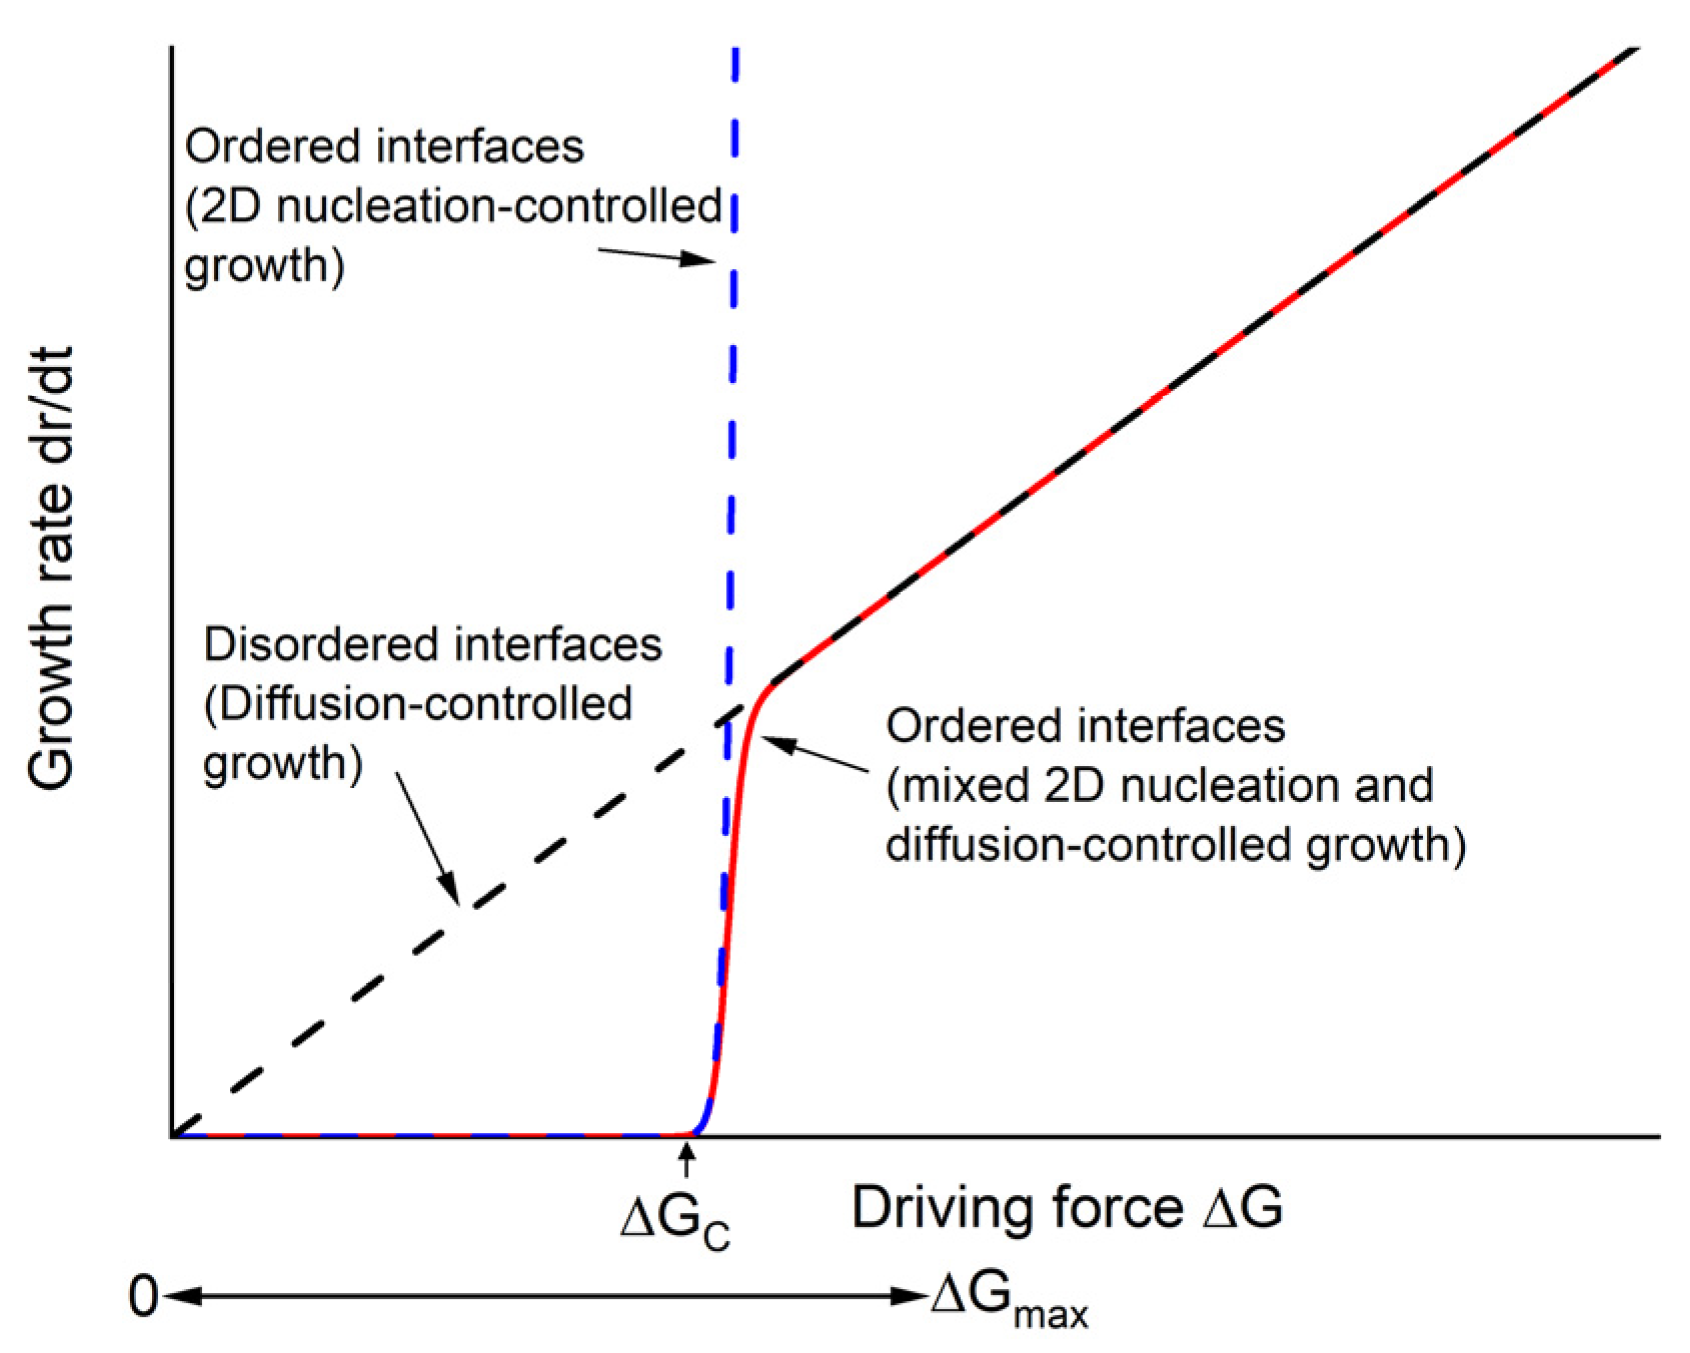
where γ is the solid/liquid interfacial energy, Vm is the molar volume, r is the radius of the grain and r is the radius of a critical grain that has ΔG = 0, i.e., is neither growing nor shrinking (≈mean grain size). Numerous investigations have shown that abnormal grain-growth behaviour depends on the structure of the grain boundaries or solid/liquid interfaces [79,80,83,84,85,86,87,88,89,90,91,92]. Grain boundaries and solid/liquid interfaces can be disordered (rough) or ordered (faceted) on an atomic scale. If the solid–liquid interfaces are disordered, then atoms can easily attach at any point on the grain surface and grain growth is limited by the rate at which atoms can diffuse across the interface between the growing and shrinking grains. The grain-growth rate is a linear function of ΔG (the black dashed line in Figure 15 [93]) [81,94,95]. In this case, all grains with ΔG > 0 can grow and abnormal grain growth does not take place. If the solid–liquid interfaces are ordered, then atoms can only attach to the grain at low-energy sites such as 2D nuclei or steps formed by screw dislocations. The grain-growth rate is then a nonlinear function of ΔG [81,82,94,95]. The grain-growth rate for 2D nucleation-controlled growth is an exponential function of ΔG, as shown by the dashed blue curve in Figure 15. In this case, only grains with values of ΔG greater than the critical value ΔGC are able to grow noticeably. For grains with ΔG > ΔGC, interface roughening takes place and the growth rate becomes diffusion-controlled (the solid red curve in Figure 15) [82,95,96]. Depending on the relative values of ΔGC and ΔGmax (the driving force for the growth of the largest grain in the system), different types of non-normal growth such as pseudonormal (ΔGC << ΔGmax), abnormal (ΔGC ≈ ΔGmax), and stagnant (ΔGC >> ΔGmax) can take place [82,94,95]. Similar grain-growth behaviour takes place in systems with solid/solid grain boundaries [84,97,98]. This mechanism of describing grain-growth behaviour has been called the mixed control mechanism of grain growth [24,81,99].
In systems with ordered grain boundaries or solid–liquid interfaces, the edge-free energy ε (the excess energy caused by an edge such as the edge of a 2D nucleus or the edge of a step formed by a screw dislocation meeting the grain surface) plays an important role in governing the grain-growth behaviour. For systems with solid–liquid interfaces where grain growth is 2D nucleation-controlled, the relationship between ΔGC and ε is [81,95,100,101]:
G C = π ε 2 k T h l n ψ n 0 1
where k is the Boltzmann constant, h is the step height of the 2D nucleus and n0 is the number density of atoms in the liquid. ψ = n * ν e x p Δ G m / k T , where n* is the number of atoms in a position near to a critical 2D nucleus, ν is the vibration frequency of atoms in the liquid, and ΔGm is the activation energy for jumping across the liquid–solid interface. The value of ε, and hence ΔGC, can be altered by changing the sintering atmosphere, material composition, and sintering temperature [76,81,84,85,95,102,103,104,105].
From Figure 5 and Figure 12, it can be seen that the (K0.5Na0.5)NbO3 grains in both KNBaN and KNBaCuN are cubic in shape, with sharp corners and edges. This implies a high value of ε and hence ΔGC [92,94,106,107]. The submicron grain size, narrow grain-size distributions, and lack of abnormal grain growth even after extended sintering, i.e., stagnant grain growth, also imply high values of ε and ΔGC. Moon and Kang defined abnormal grains as grains with a size >3 times the mean grain size [108]. Following their definition, it appears that a small number of abnormal grains are just beginning to form in the KNBaN sample in Figure 5 after extended sintering, whereas abnormal grains did not yet form in the KNBaCuN sample in Figure 12. The occurrence of seed-free SSCG may then be due to stagnant grain growth followed by abnormal grain growth [81,82,94,104]. Initially, all the grains in the sample have ΔG < ΔGC and can grow only very slowly. After some time, the largest grains in the system may grow large enough to have ΔG ≈ ΔGC. At this point, their growth rate increases rapidly (the solid red curve in Figure 15) and they form abnormal grains. As the other grains are barely growing, these abnormal grains can keep on growing to a large size by consuming all the matrix grains. Eventually, the abnormal grains impinge on each other and cannot grow further e.g., Figure 9. This is also seen in the work of Jiang et al. where there is a time delay before single-crystal growth takes place, and this time delay decreases as the sintering temperature increases [40]. The increased sintering temperature reduces ε [76,81,94,95] and hence ΔGC. This reduces the time needed for the largest grains in the sample to grow large enough to have ΔG ≈ ΔGC and form abnormal grains.
In the case of seeded SSCG, the KTaO3 seed crystal acts as an artificial abnormal grain with ΔG > ΔGC. A KNN single crystal grows epitaxially on the seed crystal and consumes the surrounding matrix grains [19,34]. The growth behaviour of the single crystals grown on [001] KTaO3 seed crystals in the present work is very unusual. The [001] direction is the slowest growth direction in KNN, while the [110] direction is believed to be the fastest growth direction. Single crystals of KNN-based materials grown by SSCG on [001] KTaO3 seed crystals generally show limited growth (up to several hundred μm) and always show less growth compared to single crystals grown on [110] KTaO3 seed crystals [22,26,31]. However, in the present work, KNN single crystals grown on [001] KTaO3 seed crystals have grown to a size of several mm (Figure 6 and Figure 10(a1)), even consuming the entire pellet in one case (Figure 10(a2)). The growth rate of the single crystals is comparable to that of the crystal grown on a [110] KTaO3 seed crystal (Figure 13a). The driving force for the growth of the single crystal in SSCG is inversely proportional to the mean grain size and it was found that suppression of matrix grain growth could promote single-crystal growth of KNN in the [001] direction [109]. However, in other cases, single-crystal growth in the [001] direction was limited even for systems with micron-sized matrix grains [31,110]. So the reason for the unusually rapid growth in the [001] direction is not yet clear. The growth behaviour of the KNN single crystal on a [110] KTaO3 seed crystal is also noteworthy. Usually, the rapidly growing {110} planes grow themselves out of existence and the crystal takes a rhombohedral shape bounded by slowly growing {001} planes [22,26,27,31,32]. At this point, single-crystal growth essentially stops, which means that the size of the single crystal is limited by the size of the seed crystal. However, in the present work, the KNN single crystal had consumed almost the entire pellet (Figure 13a and Figure 14), implying that the single crystal keeps growing even when bounded by {001} planes.
The processing conditions, size, output ratio (defined as the% area of the top face of the sample face which was converted into single crystals), and chemical composition of the KNN single crystals grown in the present work are compared with those grown by seed-free SSCG in the literature (Table 7). The KNN single crystals grown in the present work are of comparable size to those grown by seed-free SSCG [33,39,40,41,42,43,46,54]. The processing temperatures and times are also similar to those in previous studies of seed-free SSCG. In some SSCG experiments in the present work, almost the entire volume of the pellet was converted into a single crystal (Figure 10 and Figure 13). This compares favourably with previous seed-free SSCG experiments in which multiple single crystals grow in a pellet, limiting their size [33,39,40,42,43,45,54], although Morimoto et al. could restrict the number of single crystals to one per pellet by careful control of the composition and dopant addition [43,54].
The single crystals are all alkali deficient (Table 3, Table 5 and Table 6) due to the evaporation of the volatile alkali elements during sintering. This is sometimes seen in (K0.5Na0.5)NbO3-based single crystals grown by SSCG [19,32], as well as in (KxNa1-x)NbO3 single crystals grown by other methods [111,112,113]. Charge neutrality is maintained through the formation of oxygen vacancies according to the defect reaction [114]:
2 A A x + O O x 2 V A + V O + 2 A ( g ) + 1 2 O 2 ( g ) ( A = K ,   Na )
Control of alkali loss is important as a decrease in the alkali/niobium ratio affects the single-crystal growth behaviour through the formation of compensating oxygen vacancies [43,54]. Oxygen vacancies can also affect electrical properties [114]. The purity of the KNN single crystals grown in the present work is similar to that of KNN crystals prepared by other workers (Table 7). The chemical compositions of the KNBaCuN single crystals are similar to those grown by Ahn et al. [42]. They found that their single crystals contained less Na than K, but in the present work, the single crystals usually contained less K than Na. This may be due to the higher vapour pressure of K over KNN compared to Na [115] and the difficulty of accurately measuring alkali content using energy dispersive spectroscopy [116] as opposed to the wavelength-dispersive spectroscopy used in the present work. Compared to the single crystals grown by Morimoto et al., the single crystals in the present work are Na deficient [54]. Single crystals grown by Yao et al. [33] and Jiang et al. [40] were slightly Na excess and K deficient The samples in the present work are Na deficient in comparison. Alkali loss may possibly be reduced by using alkali-excess packing powder or by sealing the crucible lid with alumina cement. According to the EPMA results, all or almost all of the Ba1.05Nb0.77O3 and Ba(Cu0.13Nb0.66)O3 components enter a solid solution with (K0.5Na0.5)NbO3. However, the appearance of Cu-rich second-phase particles indicates otherwise for Ba(Cu0.13Nb0.66)O3 (Figure 12).
The KNBaN single crystals grown by seed-free SSCG in the present work grow in 011/100 orientation (with intense diffraction peaks at ~22° 2θ) or in 002/111 orientation (with intense diffraction peaks at ~32° 2θ) (Figure 3). KNN single crystals grown by seed-free SSCG by other workers grew with (100)pseudocubic orientation with an intense diffraction peak at ~22° 2θ [39,40,42,52,53] or with (020)orthorhombic orientation with an intense diffraction peak at ~32° 2θ [33,40]. The KNBaN single crystals grown by seed-free SSCG in the present work grow in the same orientations as those grown by other workers, the differences in Miller indices being due to the different unit cells used by different authors. The orientation of KNBaN and KNBaCuN single crystals grown on [001] KTaO3 seed crystals is controlled by the seed crystal as expected.
The single crystals grown in the KNBaN samples are very porous (Table 2, Figure 4 and Figure 7). During sintering, if pores are unable to migrate along with the single crystal/matrix grain boundary, they can separate from the boundary and become trapped in the single crystal [117,118,119]. Once trapped inside the crystal, the pores are very difficult to remove as the gas inside the pore must diffuse through the crystal lattice to the single crystal/matrix grain boundary [117]. Pore coalescence and swelling can also take place [120,121,122]. The single crystals grown in the KNBaCuN samples are less porous than the single crystals grown in the KNBaN samples (Table 2, Figure 9 and Figure 11), with the exception of the single crystal grown on the [110] KTaO3 seed crystal (Figure 14). The Archimedes density measurements of the seed-free SSCG samples also show that the KNBaCuN sample has a higher density than the KNBaN sample. The Ba(Cu0.13Nb0.66)O3 component is believed to form a liquid phase during sintering, which may help densify the sample before single-crystal growth begins [39,42]. CuO and Cu-containing compounds have been found to be effective sintering aids for (K0.5Na0.5)NbO3 [123,124]. This liquid phase may be the cause of the secondary-phase particles visible in Figure 12c,d).
The single crystals grown by seed-free SSCG in the KNBaCuN samples have fewer fine pores than the single crystal grown on the [001] KTaO3 seed crystal (Figure 9c and Figure 11b), although more larger pores are present. In the seeded SSCG sample, a large grain with ΔG > ΔGC is already present in the form of the KTaO3 seed crystal. Therefore single-crystal growth probably takes place more quickly in the seeded SSCG sample than in the seed-free SSCG sample, where time is needed for a grain to grow large enough to have ΔG > ΔGC. This gives the seed-free SSCG sample more time to densify before single-crystal growth starts. In the seeded SSCG sample, crystal growth begins before the sample has fully densified. This also explains why the single-crystal region near the [001] KTaO3 seed crystal (Figure 11b) is porous while the region near the edge is dense (Figure 11c); the edges of the sample had enough time to completely densify before the single crystal reached them. The KNBaCuN single crystal grown on the [110] KTaO3 seed crystal may be more porous because the crystal is expected to grow more rapidly than the crystal grown on the [001] KTaO3 seed crystal. The crystal grows and incorporates the pores before they can be removed from the matrix. The smaller pores in the single crystals are cubic in shape and align along certain directions. The pores act as ”negative crystals” [117] and try to take on the equilibrium crystal shape [125].
Single-crystal growth of (K0.5Na0.5)NbO3-based single crystals by SSCG has generally suffered from three problems: the need for expensive KTaO3 seed crystals, porosity in the single crystals and the limited size of crystals that can be grown. The present work has shown that the addition of Ba(Cu0.13Nb0.66)O3 to (K0.5Na0.5)NbO3 is effective in reducing porosity in the single crystals and increasing the size of the grown crystals, particularly in the [001] growth direction. This is particularly useful as the [001] orientation has the best piezoelectric properties [12,35,36]. The reason why some single-crystal growth experiments are unsuccessful is not yet known. As mentioned earlier, both powders are free of secondary phases even after storage (Figure 1) so there does not appear to be a problem with deterioration of the powders. In addition, the XRD patterns of successful growth experiments show second-phase peaks, so the presence of a second phase does not appear to prevent single-crystal growth. In the seed-free SSCG experiments, a sample may by chance fail to have any grains large enough to grow into single crystals, but the seeded SSCG experiments always have at least one grain that is large enough to grow i.e., the seed crystal. Further experiments need to be carried out to address this problem.

5. Conclusions

Single crystals of (K0.5Na0.5)NbO3-Ba1.05Nb0.77O3 and (K0.5Na0.5)NbO3- Ba(Cu0.13Nb0.66)O3 were grown by seed-free solid-state crystal growth and seeded solid-state crystal growth. Single crystals several millimetres in size were grown using [001]-oriented KTaO3 seed crystals in both systems. Such crystals are unusually large, as the [001] direction is the slowest growth direction in (K0.5Na0.5)NbO3, and are larger than (K0.5Na0.5)NbO3-based single crystals previously grown by this method. In the (K0.5Na0.5)NbO3-Ba1.05Nb0.77O3 system, single crystals grown by seed-free solid-state crystal growth and single crystals grown in the [001] direction using seeded solid-state crystal growth were very porous. In the (K0.5Na0.5)NbO3- Ba(Cu0.13Nb0.66)O3 system, porosity could be significantly reduced in single crystals grown by seed-free solid-state crystal growth and in single crystals grown in the [001] direction using seeded solid-state crystal growth. Single crystals grown in the [110] direction were still very porous despite the use of Ba(Cu0.13Nb0.66)O3. The combination of [001]-oriented KTaO3 seed crystals and Ba(Cu0.13Nb0.66)O3 addition allows large and dense single crystals to be grown, but the issue of repeatability still needs to be solved.

Supplementary Materials

The following supporting information can be downloaded at: https://www.mdpi.com/article/10.3390/ma16103638/s1, Table S1: Crystal data and structure refinement for a 98.5 mol% (K0.5Na0.5)NbO3-1.5 mol% Ba1.05Nb0.77O3 single crystal grown on a [001] KTaO3 seed crystal by sintering at 1135 °C for 20 h (KNBaN); Table S2: Fractional Atomic Coordinates (×104) and Equivalent Isotropic Displacement Parameters (Å2 × 10³) for KNBaN. Ueq is defined as 1/3 of the trace of the orthogonalised UIJ tensor; Table S3: Anisotropic Displacement Parameters (Å2 × 10³) for KNBaN. The Anisotropic displacement factor exponent takes the form: −2π2[h2a*2U11 + 2hka*b*U12 + …]; Table S4: Bond Lengths for KNBaN; Table S5: Bond Angles for KNBaN; Table S6: Atomic Occupancy for KNBaN; Table S7: Crystal data and structure refinement for a 98.5 mol% (K0.5Na0.5)NbO3-1.5 mol% Ba(Cu0.13Nb0.66)O3 single crystal grown on a [001] KTaO3 seed crystal by sintering at 1125 °C for 10 h (KNBaCuN); Table S8: Fractional Atomic Coordinates (×104) and Equivalent Isotropic Displacement Parameters (Å2 × 10³) for KNBaCuN. Ueq is defined as 1/3 of the trace of the orthogonalised UIJ tensor; Table S9: Anisotropic Displacement Parameters (Å2 × 10³) for KNBaCuN. The Anisotropic displacement factor exponent takes the form: −2π2[h2a*2U11 + 2hka*b*U12 + …]; Table S10: Bond Lengths for KNBaCuN; Table S11: Bond Angles for KNBaCuN; Table S12 Atomic Occupancy for KNBaCuN.

Author Contributions

Conceptualization, J.G.F.; Data curation, J.G.F.; Formal analysis, J.G.F., T.T.Ð., J.M. and J.L.; Funding acquisition, J.G.F.; Investigation, J.G.F., S.-H.S., T.T.Ð., E.U. and J.M.; Methodology, J.G.F.; Project administration, J.G.F.; Resources, J.G.F. and J.L.; Supervision, J.G.F. and J.L.; Visualization, J.G.F. and J.L.; Writing—original draft, J.G.F.; Writing—review & editing, J.G.F., S.-H.S., T.T.Ð. and E.U. All authors have read and agreed to the published version of the manuscript.

Funding

This work was supported by a National Research Foundation of Korea (NRF) grant funded by the Korean government (MSIT) (No. 2021R1F1A1046778).

Institutional Review Board Statement

Not applicable.

Informed Consent Statement

Not applicable.

Data Availability Statement

The data presented in this study are available on request from the corresponding author.

Acknowledgments

The authors would like to thank Kyeong-Kap Jeong and Jung-Yeol Park (Centre for Research Facilities, Chonnam National University) for operating the XRD and EPMA respectively, and Hey-Jeong Kim (Centre for Development of Fine Chemicals, Chonnam National University) for operating the SEM.

Conflicts of Interest

The authors declare no conflict of interest. The funders had no role in the design of the study; in the collection, analyses, or interpretation of data; in the writing of the manuscript; nor in the decision to publish the results.

References

  1. Zheng, T.; Wu, J.; Xiao, D.; Zhu, J. Recent development in lead-free perovskite piezoelectric bulk materials. Prog. Mater. Sci. 2018, 98, 552–624. [Google Scholar] [CrossRef]
  2. Wu, J.; Xiao, D.; Zhu, J. Potassium–Sodium Niobate Lead-Free Piezoelectric Materials: Past, Present, and Future of Phase Boundaries. Chem. Rev. 2015, 115, 2559–2595. [Google Scholar] [CrossRef] [PubMed]
  3. Ringgaard, E.; Wurlitzer, T.; Wolny, W.W. Properties of Lead-Free Piezoceramics Based on Alkali Niobates. Ferroelectrics 2005, 319, 97–107. [Google Scholar] [CrossRef]
  4. Jaeger, R.E.; Egerton, L. Hot Pressing of Potassium-Sodium Niobates. J. Am. Ceram. Soc. 1962, 45, 209–213. [Google Scholar] [CrossRef]
  5. Lv, X.; Wu, J.; Zhao, C.; Xiao, D.; Zhu, J.; Zhang, Z.; Zhang, C.; Zhang, X.-x. Enhancing temperature stability in potassium-sodium niobate ceramics through phase boundary and composition design. J. Eur. Ceram. Soc. 2019, 39, 305–315. [Google Scholar] [CrossRef]
  6. Go, S.-H.; Eum, J.-M.; Kim, D.-S.; Chae, S.-J.; Kim, S.-W.; Kim, E.-J.; Chae, Y.-G.; Woo, J.-U.; Nahm, S. Piezoelectricity of (K,Na)(Nb,Sb)O3–SrZrO3(Bi,Ag)ZrO3 piezoceramics and their application in planar-type actuators. J. Mater. Chem. C 2021, 9, 16741–16750. [Google Scholar] [CrossRef]
  7. Wang, X.; Wu, J.; Xiao, D.; Cheng, X.; Zheng, T.; Zhang, B.; Lou, X.; Zhu, J. Large d33 in (K,Na)(Nb,Ta,Sb)O3-(Bi,Na,K)ZrO3 lead-free ceramics. J. Mater. Chem. A 2014, 2, 4122–4126. [Google Scholar] [CrossRef]
  8. Lv, X.; Wu, J.; Zhu, J.; Xiao, D. Enhanced temperature stability in the R–T phase boundary with dominating intrinsic contribution. Phys. Chem. Chem. Phys. 2018, 20, 20149–20159. [Google Scholar] [CrossRef]
  9. Liu, H.; Veber, P.; Rödel, J.; Rytz, D.; Fabritchnyi, P.B.; Afanasov, M.I.; Patterson, E.A.; Frömling, T.; Maglione, M.; Koruza, J. High-performance piezoelectric (K,Na,Li)(Nb,Ta,Sb)O3 single crystals by oxygen annealing. Acta Mater. 2018, 148, 499–507. [Google Scholar] [CrossRef]
  10. Hu, C.; Tian, H.; Meng, X.; Shi, G.; Cao, W.; Zhou, Z. High-quality K0.47Na0.53NbO3 single crystal toward high performance transducer. RSC Adv. 2017, 7, 7003–7007. [Google Scholar] [CrossRef]
  11. Ge, W.; Liu, H.; Zhao, X.; Li, X.; Pan, X.; Lin, D.; Xu, H.; Jiang, X.; Luo, H. Orientation dependence of electrical properties of 0.96Na0.5Bi0.5TiO3-0.04BaTiO3 lead-free piezoelectric single crystal. Appl. Phys. A 2009, 95, 761–767. [Google Scholar] [CrossRef]
  12. Fujii, I.; Ueno, S.; Wada, S. Fabrication of <111>c-oriented (K0.5Na0.5)NbO3 Single Crystal by Solid-State Cyrstal Growth Method. In Proceedings of the 2020 Joint Conference of the IEEE International Frequency Control Symposium and International Symposium on Applications of Ferroelectrics (IFCS-ISAF), Keystone, CO, USA, 19–23 July 2020; pp. 1–2. [Google Scholar]
  13. Wada, S.; Seike, A.; Tsurumi, T. Poling Treatment and Piezoelectric Properties of Potassium Niobate Ferroelectric Single Crystals. Jpn. J. Appl. Phy. 2001, 40, 5690–5697. [Google Scholar] [CrossRef]
  14. Liu, H.; Koruza, J.; Veber, P.; Rytz, D.; Maglione, M.; Rödel, J. Orientation-dependent electromechanical properties of Mn-doped (Li,Na,K)(Nb,Ta)O3 single crystals. Appl. Phys. Lett. 2016, 109, 152902. [Google Scholar] [CrossRef]
  15. Deng, H.; Zhao, X.; Zhang, H.; Chen, C.; Li, X.; Lin, D.; Ren, B.; Jiao, J.; Luo, H. Orientation dependence of electrical properties of large-sized sodium potassium niobate lead-free single crystals. CrystEngComm 2014, 16, 2760–2765. [Google Scholar] [CrossRef]
  16. Wada, S.; Muraoka, K.; Kakemoto, H.; Tsurumi, T.; Kumagai, H. Enhanced Piezoelectric Properties of Potassium Niobate Single Crystals by Domain Engineering. Jpn. J. Appl. Phys. 2004, 43, 6692–6700. [Google Scholar] [CrossRef]
  17. Sun, E.; Cao, W. Relaxor-based ferroelectric single crystals: Growth, domain engineering, characterization and applications. Prog. Mater. Sci. 2014, 65, 124–210. [Google Scholar] [CrossRef]
  18. Liu, J.; Qiu, C.; Qiao, L.; Song, K.; Guo, H.; Xu, Z.; Li, F. Impact of alternating current electric field poling on piezoelectric and dielectric properties of Pb(In1/2Nb1/2)O3–Pb(Mg1/3Nb2/3)O3–PbTiO3 ferroelectric crystals. J. Appl. Phys. 2020, 128, 094104. [Google Scholar] [CrossRef]
  19. Fisher, J.G.; Benčan, A.; Holc, J.; Kosec, M.; Vernay, S.; Rytz, D. Growth of potassium sodium niobate single crystals by solid state crystal growth. J. Cryst. Growth 2007, 303, 487–492. [Google Scholar] [CrossRef]
  20. Chen, K.; Xu, G.; Yang, D.; Wang, X.; Li, J. Dielectric and piezoelectric properties of lead-free 0.95(Na0.5K0.5)NbO3–0.05LiNbO3 crystals grown by the Bridgman method. J. Appl. Phys. 2007, 101, 044103. [Google Scholar] [CrossRef]
  21. Tian, H.; Hu, C.; Meng, X.; Tan, P.; Zhou, Z.; Li, J.; Yang, B. Top-Seeded Solution Growth and Properties of K1–xNaxNbO3 Crystals. Cryst. Growth Des. 2015, 15, 1180–1185. [Google Scholar] [CrossRef]
  22. Yang, J.; Yang, Q.; Li, Y.; Liu, Y. Growth mechanism and enhanced electrical properties of K0.5Na0.5NbO3-based lead-free piezoelectric single crystals grown by a solid-state crystal growth method. J. Eur. Ceram. Soc. 2016, 36, 541–550. [Google Scholar] [CrossRef]
  23. Benčan, A.; Tchernychova, E.; Uršič, H.; Kosec, M.; Fisher, J. Growth and Characterization of Single Crystals of Potassium Sodium Niobate by Solid State Crystal Growth. In Ferroelectrics-Material Aspects; Lallart, M., Ed.; InTech: Rijeka, Croatia, 2011; pp. 87–108. [Google Scholar]
  24. Kang, S.J.L.; Park, J.H.; Ko, S.Y.; Lee, H.Y. Solid-State Conversion of Single Crystals: The Principle and the State-of-the-Art. J. Am. Ceram. Soc. 2015, 98, 347–360. [Google Scholar] [CrossRef]
  25. Milisavljevic, I.; Wu, Y. Current status of solid-state single crystal growth. BMC Mater. 2020, 2, 2. [Google Scholar] [CrossRef]
  26. Fujii, I.; Ueno, S.; Wada, S. Effect of sintering temperature on the growth of (K0.5Na0.5)NbO3 single crystals fabricated by the solid-state crystal growth method. Jpn. J. Appl. Phys. 2019, 58, SLLD01. [Google Scholar] [CrossRef]
  27. Fujii, I.; Ueno, S.; Wada, S. Effects of sintering aid and atmosphere powder on the growth of (K0.5Na0.5)NbO3 single crystals fabricated by solid-state crystal growth method. J. Eur. Ceram. Soc. 2020, 40, 2970–2976. [Google Scholar] [CrossRef]
  28. Bencan, A.; Tchernychova, E.; Godec, M.; Fisher, J.; Kosec, M. Compositional and structural study of a (K0.5Na0.5)NbO3 single crystal prepared by solid state crystal growth. Microsc. Microanal. 2009, 15, 435–440. [Google Scholar] [CrossRef] [PubMed]
  29. Ursic, H.; Bencan, A.; Skarabot, M.; Godec, M.; Kosec, M. Dielectric, ferroelectric, piezoelectric, and electrostrictive properties of K0.5Na0.5NbO3 single crystals. J. Appl. Phys. 2010, 107, 033705. [Google Scholar] [CrossRef]
  30. Fisher, J.G.; Benčan, A.; Bernard, J.; Holc, J.; Kosec, M.; Vernay, S.; Rytz, D. Growth of (Na, K, Li)(Nb, Ta)O3 single crystals by solid state crystal growth. J. Eur. Ceram. Soc. 2007, 27, 4103–4106. [Google Scholar] [CrossRef]
  31. Uwiragiye, E.; Farooq, M.U.; Moon, S.-H.; Pham, T.L.; Nguyen, D.T.; Lee, J.-S.; Fisher, J.G. High performance lead-free piezoelectric 0.96(K0.48Na0.52)NbO3-0.03[Bi0.5(Na0.7K0.2Li0.1)0.5]ZrO3-0.01(Bi0.5Na0.5)TiO3 single crystals grown by solid state crystal growth and their phase relations. J. Eur. Ceram. Soc. 2017, 37, 4597–4607. [Google Scholar] [CrossRef]
  32. Uwiragiye, E.; Pham, T.L.; Fisher, J.G.; Lee, J.S.; Lee, B.W.; Ko, J.H.; Kim, H.P.; Jo, W. Sintering Aid-Assisted Growth of 0.95(K0.5Na0.5)NbO3–0.05(Bi0.5Na0.5)(Zr0.85Sn0.15)O3 Single Crystals by the Solid-State Crystal Growth Method and Their Characterization. Phys. Status Solidi 2022, 219, 2100875. [Google Scholar] [CrossRef]
  33. Yao, X.; Jiang, M.; Li, W.; Lu, H.; Li, L.; Rao, G. Effects of the calcined temperature of ingredients on the growth, structure and electrical properties of (K0.5Na0.5)NbO3-based single crystals. J. Mater. Sci. Mater. Electron. 2020, 31, 21971–21980. [Google Scholar] [CrossRef]
  34. Yang, J.; Fu, Z.; Yang, Q.; Li, Y.; Liu, Y. Effect of seeds and sintering additives on (K,Na,Li)NbO3 lead-free single crystals grown by a solid-state crystal growth method. J. Ceram. Soc. Jpn. 2016, 124, 365–369. [Google Scholar] [CrossRef]
  35. Gupta, S.; Belianinov, A.; Okatan, M.B.; Jesse, S.; Kalinin, S.V.; Priya, S. Fundamental limitation to the magnitude of piezoelectric response of <001>(pc) textured K0.5Na0.5NbO3 ceramic. Appl. Phys. Lett. 2014, 104, 5. [Google Scholar] [CrossRef]
  36. Yu, Q.; Li, J.F.; Sun, W.; Zhou, Z.; Xu, Y.; Xie, Z.K.; Lai, F.P.; Wang, Q.M. Electrical properties of K0.5Na0.5NbO3 thin films grown on Nb:SrTiO3 single-crystalline substrates with different crystallographic orientations. J. Appl. Phys. 2013, 113, 5. [Google Scholar] [CrossRef]
  37. Fisher, J.G.; Bencan, A.; Kosec, M.; Vernay, S.; Rytz, D. Growth of dense single crystals of potassium sodium niobate by a combination of solid-state crystal growth and hot pressing. J. Am. Ceram. Soc. 2008, 91, 1503–1507. [Google Scholar] [CrossRef]
  38. Koruza, J.; Liu, H.; Höfling, M.; Zhang, M.-H.; Veber, P. (K,Na)NbO3-based piezoelectric single crystals: Growth methods, properties, and applications. J. Mater. Res. 2020, 35, 990–1016. [Google Scholar] [CrossRef]
  39. Ahn, C.-W.; Rahman, A.; Ryu, J.; Choi, J.-J.; Kim, J.-W.; Yoon, W.-H.; Choi, J.-H.; Park, D.-S.; Hahn, B.-D. Composition Design for Growth of Single Crystal by Abnormal Grain Growth in Modified Potassium Sodium Niobate Ceramics. Cryst. Growth Des. 2016, 16, 6586–6592. [Google Scholar] [CrossRef]
  40. Jiang, M.; Randall, C.A.; Guo, H.; Rao, G.; Tu, R.; Gu, Z.; Cheng, G.; Liu, X.; Zhang, J.; Li, Y. Seed-Free Solid-State Growth of Large Lead-Free Piezoelectric Single Crystals: (Na1/2K1/2)NbO3. J. Am. Ceram. Soc. 2015, 98, 2988–2996. [Google Scholar] [CrossRef]
  41. Rahman, A.; Cho, K.-H.; Ahn, C.-W.; Ryu, J.; Choi, J.-J.; Kim, J.-W.; Yoon, W.-H.; Choi, J.-H.; Park, D.-S.; Hahn, B.-D. A composition design rule for crystal growth of centimeter scale by normal sintering process in modified potassium sodium niobate ceramics. J. Eur. Ceram. Soc. 2018, 38, 1416–1420. [Google Scholar] [CrossRef]
  42. Ahn, C.-W.; Lee, H.-Y.; Han, G.; Zhang, S.; Choi, S.-Y.; Choi, J.-J.; Kim, J.-W.; Yoon, W.-H.; Choi, J.-H.; Park, D.-S.; et al. Self-Growth of Centimeter-Scale Single Crystals by Normal Sintering Process in Modified Potassium Sodium Niobate Ceramics. Sci. Rep. 2015, 5, 17656. [Google Scholar] [CrossRef]
  43. Morimoto, T.; Shimono, S.; Yoshiichi, Y.; Kishimura, H.; Ishii, K. Conditions of large unitary (K, Na)NbO3 system single crystals for rapid solid-state crystal growth method. Jpn. J. Appl. Phy. 2023, 62, 035501. [Google Scholar] [CrossRef]
  44. Zhang, J.; Jiang, M.; Cheng, G.; Gu, Z.; Liu, X.; Song, J.; Li, L.; Du, Y. Microstructure, piezoelectric, ferroelectric and dielectric properties of Na0.5K0.5NbO3 single crystals prepared by seed-free solid-state crystal growth. Ferroelectrics 2016, 502, 210–220. [Google Scholar] [CrossRef]
  45. Song, J.; Hao, C.; Yan, Y.; Zhang, J.; Li, L.; Jiang, M. Enhanced piezoelectric property and microstructure of large CaZrO3-doped Na0.5K0.5NbO3-based single crystal with 20 mm over. Mater. Lett. 2017, 204, 19–22. [Google Scholar] [CrossRef]
  46. Jiang, M.; Zhang, J.; Rao, G.; Li, D.; Randall, C.A.; Li, T.; Peng, B.; Li, L.; Gu, Z.; Liu, X.; et al. Ultrahigh piezoelectric coefficient of a lead-free K0.5Na0.5NbO3-based single crystal fabricated by a simple seed-free solid-state growth method. J. Mater. Chem. C 2019, 7, 14845–14854. [Google Scholar] [CrossRef]
  47. Li, D.; Jiang, M.; Han, S.; Jin, Q.; Xu, Y.; Yao, X.; Zhang, K.; Li, L.; Miao, L.; Zhou, C.; et al. Influence of trace lithium addition on the structure and properties of K0.5Na0.5NbO3-based single crystals. J. Mater. Sci. Mater. Electron. 2020, 31, 4857–4866. [Google Scholar] [CrossRef]
  48. Yao, X.; Jiang, M.; Han, S.; Li, D.; Xu, Y.; Li, L.; Rao, G. Microstructure and electrical properties of CuO-doped K0.5Na0.5NbO3-based single crystals with low dielectric loss. J. Mater. Res. 2021, 36, 1182–1194. [Google Scholar] [CrossRef]
  49. Lu, H.; Jiang, M.; Yao, X.; Zhang, Z.; Wang, W.; Li, L.; Rao, G. The effect of the annealing temperature on the structure and electrical properties of Li/Ta-modified (K0.5Na0.5)NbO3-based piezoelectric crystals. J. Mater. Sci. Mater. Electron. 2022, 33, 2816–2828. [Google Scholar] [CrossRef]
  50. Ren, P.; Jiang, M.; Lu, H.; Li, L.; Cheng, S.; Wang, T.; Zhao, Y.; Rao, G. Optimized microstructure and electrical properties in 0.997(0.996K0.5Na0.5NbO3–0.004MnBiO3)–0.003B2O3 single crystals via Li-doping. J. Mater. Sci. Mater. Electron. 2023, 34, 465. [Google Scholar] [CrossRef]
  51. Wang, T.; Jiang, M.; Li, L.; Cheng, S.; Lu, H.; Ren, P.; Zhao, Y.; Rao, G. Effects of MnO2-doping on growth, structure and electrical properties of lead-free piezoelectric K0.5Na0.5NbO3-BiAlO3 single crystals. J. Alloys Compd. 2023, 935, 168126. [Google Scholar] [CrossRef]
  52. Zhu, B.P.; Zhu, Y.H.; Yang, J.; Ou-Yang, J.; Yang, X.F.; Li, Y.X.; Wei, W. New Potassium Sodium Niobate Single Crystal with Thickness-independent High-performance for Photoacoustic Angiography of Atherosclerotic Lesion. Sci. Rep. 2016, 6, 8. [Google Scholar] [CrossRef]
  53. Yang, J.; Zhang, F.; Yang, Q.; Liu, Z.; Li, Y.; Liu, Y.; Zhang, Q. Large piezoelectric properties in KNN-based lead-free single crystals grown by a seed-free solid-state crystal growth method. Appl. Phys. Lett. 2016, 108, 182904. [Google Scholar] [CrossRef]
  54. Morimoto, T.; Shimono, S.; Ishii, K. Growth of large unitary (K,Na)NbO3 single crystals using a seed-free solid-state crystal growth method by adjusting the B-site excess ratios and additional Bi2O3. Jpn. J. Appl. Phy. 2020, 59, SP1001. [Google Scholar] [CrossRef]
  55. Hao, C.Y.; Gu, Z.F.; Cheng, G.; Li, L.; Zhang, J.W.; Song, J.G.; Yan, Y.F.; Jiang, M.H. Composition design and electrical property of a pure KxNa1−xNbO3 single crystal fabricated by the seed-free solid-state crystal growth. J. Mater. Sci. Mater. Electron. 2017, 28, 18357–18365. [Google Scholar] [CrossRef]
  56. Ha, S.-J.; Park, J.-H.; Cho, K.-H.; Cha, H.-A.; Choi, J.-J.; Han, B.-D.; Ahn, C.-W. Research on eco-friendly piezoelectric seed material manufacturing using abnormal grain growth. In 2022 Fall Meeting of the Korean Ceramic Society; The Korean Ceramic Society: Seoul, Republic of Korea, 2022; p. 45. [Google Scholar]
  57. Bruker-AXS. APEX2. Version 2014.11-0; Bruker-AXS: Madison, WI, USA, 2014. [Google Scholar]
  58. Krause, L.; Herbst-Irmer, R.; Sheldrick, G.M.; Stalke, D. Comparison of silver and molybdenum microfocus X-ray sources for single-crystal structure determination. J. Appl. Crystallogr. 2015, 48, 3–10. [Google Scholar] [CrossRef] [PubMed]
  59. Sheldrick, G. Crystal structure refinement with SHELXL. Acta Cryst. C 2015, 71, 3–8. [Google Scholar] [CrossRef]
  60. Dolomanov, O.V.; Bourhis, L.J.; Gildea, R.J.; Howard, J.A.K.; Puschmann, H. OLEX2: A complete structure solution, refinement and analysis program. J. Appl. Crystallogr. 2009, 42, 339–341. [Google Scholar] [CrossRef]
  61. Cullity, B.D.; Stock, S.R. Chapter 5 Diffraction III: Real Samples. In Elements of X-ray Diffraction; Prentice Hall: Upper Saddle River, NJ, USA, 2001; pp. 167–184. [Google Scholar]
  62. Lee, M. Characterization of Thin Films by X-Ray Diffraction. In X-ray Diffraction for Materials Research: From Fundamentals to Applications; Apple Academic Press Inc.: Oakville, ON, Canada, 2016; pp. 182–223. [Google Scholar]
  63. Iamsasri, T.; Tutuncu, G.; Uthaisar, C.; Pojprapai, S.; Jones, J.L. Analysis methods for characterizing ferroelectric/ferroelastic domain reorientation in orthorhombic perovskite materials and application to Li-doped Na0.5K0.5NbO3. J. Mater. Sci. 2013, 48, 6905–6910. [Google Scholar] [CrossRef]
  64. Ochoa, D.A.; Esteves, G.; Iamsasri, T.; Rubio-Marcos, F.; Fernández, J.F.; García, J.E.; Jones, J.L. Extensive domain wall contribution to strain in a (K,Na)NbO3-based lead-free piezoceramics quantified from high energy X-ray diffraction. J. Eur. Ceram. Soc. 2016, 36, 2489–2494. [Google Scholar] [CrossRef]
  65. Deng, H.; Zhang, H.; Zhao, X.; Chen, C.; Wang, X.A.; Li, X.; Lin, D.; Ren, B.; Jiao, J.; Luo, H. Direct observation of monoclinic ferroelectric phase and domain switching process in (K0.25Na0.75)NbO3 single crystals. CrystEngComm 2015, 17, 2872–2877. [Google Scholar] [CrossRef]
  66. Malic, B.; Jenko, D.; Bernard, J.; Cilensek, J.; Kosec, M. Synthesis and Sintering of (K,Na)NbO3 Based Ceramics. Mat. Res. Soc. Proc. 2002, 755, 83–88. [Google Scholar] [CrossRef]
  67. Pecharsky, V.K.; Zavalij, P.Y. Chapter 8 The Powder Diffraction Pattern. In Fundamentals of Powder Diffraction and Structural Characterization of Materials, 2nd ed.; Springer Science + Business Media: New York, NY, USA, 2009; pp. 151–202. [Google Scholar]
  68. Daniels, J.E.; Jones, J.L.; Finlayson, T.R. Characterization of domain structures from diffraction profiles in tetragonal ferroelastic ceramics. J. Phys. D Appl. Phys. 2006, 39, 5294. [Google Scholar] [CrossRef]
  69. Peelen, J.G.J.; Metselaar, R. Light scattering by pores in polycrystalline materials: Transmission properties of alumina. J. Appl. Phys. 1974, 45, 216–220. [Google Scholar] [CrossRef]
  70. Apetz, R.; Bruggen, M.P.B. Transparent Alumina: A Light-Scattering Model. J. Am. Ceram. Soc. 2003, 86, 480–486. [Google Scholar] [CrossRef]
  71. Chiang, Y.M.; Birnie, D.; Kingery, W.D. Chapter 2 Defects in Ceramics. In Physical Ceramics: Principles for Ceramic Science and Engineering; John Wiley and Sons: New York, NY, USA, 1997; pp. 101–184. [Google Scholar]
  72. Pecharsky, V.K.; Zavalij, P.Y. Chapter 7 Geometry of Diffraction by Lattices. In Fundamentals of Powder Diffraction and Structural Characterization of Materials, 2nd ed.; Springer Science + Business Media: New York, NY, USA, 2009; pp. 133–149. [Google Scholar]
  73. Tellier, J.; Malic, B.; Dkhil, B.; Jenko, D.; Cilensek, J.; Kosec, M. Crystal structure and phase transitions of sodium potassium niobate perovskites. Solid State Sci. 2009, 11, 320–324. [Google Scholar] [CrossRef]
  74. Kosec, M.; Kolar, D. On activated sintering and electrical properties of NaKNbO3. Mater. Res. Bull. 1975, 10, 335–340. [Google Scholar] [CrossRef]
  75. Williams, E.D.; Bartelt, N.C. Thermodynamics of Surface Morphology. Science 1991, 251, 393–400. [Google Scholar] [CrossRef]
  76. Jeong, H.-C.; Williams, E.D. Steps on surfaces: Experiment and theory. Surf. Sci. Rep. 1999, 34, 171–294. [Google Scholar] [CrossRef]
  77. Ke, S.M.; Huang, H.T.; Fan, H.Q.; Lee, H.K.; Zhou, L.M.; Mai, Y.W. Antiferroelectric-like properties and enhanced polarization of Cu-doped K0.5Na0.5NbO3 piezoelectric ceramics. Appl. Phys. Lett. 2012, 101, 082901. [Google Scholar] [CrossRef]
  78. Eichel, R.-A.; Erünal, E.; Drahus, M.D.; Smyth, D.M.; Van Tol, J.; Acker, J.; Kungl, H.; Hoffmann, M.J. Local variations in defect polarization and covalent bonding in ferroelectric Cu2+-doped PZT and KNN functional ceramics at the morphotropic phase boundary. Phys. Chem. Chem. Phys. 2009, 11, 8698. [Google Scholar] [CrossRef]
  79. Chung, S.Y.; Yoon, D.Y.; Kang, S.J.L. Effects of donor concentration and oxygen partial pressure on interface morphology and grain growth behavior in SrTiO3. Acta Mater. 2002, 50, 3361–3371. [Google Scholar] [CrossRef]
  80. An, S.M.; Kang, S.J.L. Boundary structural transition and grain growth behavior in BaTiO3 with Nd2O3 doping and oxygen partial pressure change. Acta Mater. 2011, 59, 1964–1973. [Google Scholar] [CrossRef]
  81. Jung, Y.I.; Yoon, D.Y.; Kang, S.J.L. Coarsening of polyhedral grains in a liquid matrix. J. Mater. Res. 2009, 24, 2949–2959. [Google Scholar] [CrossRef]
  82. Kang, S.J.L.; Lee, M.G.; An, S.M. Microstructural Evolution During Sintering with Control of the Interface Structure. J. Am. Ceram. Soc. 2009, 92, 1464–1471. [Google Scholar] [CrossRef]
  83. Park, Y.J.; Hwang, N.M.; Yoon, D.Y. Abnormal growth of faceted (WC) grains in a (Co) liquid matrix. Metall. Mater. Trans. A 1996, 27, 2809–2819. [Google Scholar] [CrossRef]
  84. Fisher, J.G.; Kang, S.J.L. Microstructural changes in (Na0.5K0.5)NbO3 ceramics sintered in various atmospheres. J. Eur. Ceram. Soc. 2009, 29, 2581–2588. [Google Scholar] [CrossRef]
  85. Fisher, J.G.; Choi, S.Y.; Kang, S.J.L. Influence of Sintering Atmosphere on Abnormal Grain Growth Behaviour in Potassium Sodium Niobate Ceramics Sintered at Low Temperature. J. Korean Ceram. Soc. 2011, 48, 641–647. [Google Scholar] [CrossRef]
  86. Lee, B.K.; Chung, S.Y.; Kang, S.J.L. Grain boundary faceting and abnormal grain growth in BaTiO3. Acta Mater. 2000, 48, 1575–1580. [Google Scholar] [CrossRef]
  87. Yoon, B.K.; Lee, B.A.; Kang, S.J.L. Growth behavior of rounded (Ti,W)C and faceted WC grains in a Co matrix during liquid phase sintering. Acta Mater. 2005, 53, 4677–4685. [Google Scholar] [CrossRef]
  88. Jang, C.-W.; Kim, J.; Kang, S.-J.L. Effect of Sintering Atmosphere on Grain Shape and Grain Growth in Liquid-Phase-Sintered Silicon Carbide. J. Am. Ceram. Soc. 2002, 85, 1281–1284. [Google Scholar] [CrossRef]
  89. Lee, S.B.; Yoon, D.Y.; Hwang, N.M.; Henry, M.F. Grain boundary faceting and abnormal grain growth in nickel. Metall. Mater. Trans. A 2000, 31, 985–994. [Google Scholar] [CrossRef]
  90. Kwon, S.K.; Hong, S.H.; Kim, D.Y.; Hwang, N.M. Coarsening Behavior of Tricalcium Silicate (C3S) and Dicalcium Silicate (C2S) Grains Dispersed in a Clinker Melt. J. Am. Ceram. Soc. 2000, 83, 1247–1252. [Google Scholar] [CrossRef]
  91. Jung, S.H.; Yoon, D.Y.; Kang, S.J.L. Mechanism of abnormal grain growth in ultrafine-grained nickel. Acta Mater. 2013, 61, 5685–5693. [Google Scholar] [CrossRef]
  92. Choi, K.; Hwang, N.M.; Kim, D.Y. Effect of Grain Shape on Abnormal Grain Growth in Liquid-Phase-Sintered Nb1−xTixC–Co Alloys. J. Am. Ceram. Soc. 2002, 85, 2313–2318. [Google Scholar] [CrossRef]
  93. Le, P.G.; Tran, H.T.; Lee, J.-S.; Fisher, J.G.; Kim, H.-P.; Jo, W.; Moon, W.-J. Growth of single crystals in the (Na1/2Bi1/2)TiO3–(Sr1–xCax)TiO3 system by solid state crystal growth. J. Adv. Ceram. 2021, 10, 973–990. [Google Scholar] [CrossRef]
  94. Fisher, J.G.; Kang, S.-J.L. Strategies and practices for suppressing abnormal grain growth during liquid phase sintering. J. Am. Ceram. Soc. 2019, 102, 717–735. [Google Scholar] [CrossRef]
  95. Kang, S.-J.L.; Jung, Y.-I.; Jung, S.-H.; Fisher, J.G. Interface Structure-Dependent Grain Growth Behavior in Polycrystals. In Microstructural Design of Advanced Engineering Materials; Molodov, D.A., Ed.; Wiley-VCH Verlag GmbH & Co. KGaA.: Weinheim, Germany, 2013; pp. 299–322. [Google Scholar]
  96. Yoon, D.Y.; Cho, Y.K. Roughening transition of grain boundaries in metals and oxides. J. Mater. Sci. 2005, 40, 861–870. [Google Scholar] [CrossRef]
  97. An, S.M.; Yoon, B.K.; Chung, S.Y.; Kang, S.J.L. Nonlinear driving force-velocity relationship for the migration of faceted boundaries. Acta Mater. 2012, 60, 4531–4539. [Google Scholar] [CrossRef]
  98. Jung, S.H.; Kang, S.J.L. Repetitive grain growth behavior with increasing temperature and grain boundary roughening in a model nickel system. Acta Mater. 2014, 69, 283–291. [Google Scholar] [CrossRef]
  99. Kang, S.J.L.; Ko, S.Y.; Moon, S.Y. Mixed control of boundary migration and the principle of microstructural evolution. J. Ceram. Soc. Jpn. 2016, 124, 259–267. [Google Scholar] [CrossRef]
  100. Burton, W.K.; Cabrera, N.; Frank, F.C. The Growth of Crystals and the Equilibrium Structure of Their Surfaces. Philos. Trans. R. Soc. A 1951, 243, 299–358. [Google Scholar]
  101. Hirth, J.P.; Pound, G.M. Growth and Evaporation of Liquids and Dislocation-Free Crystals. In Condensation and Evaporation: Nucleation and Growth Kinetics; Pergamon Press: Oxford, UK, 1963; pp. 77–106. [Google Scholar]
  102. Markov, I.V. Crystal-Ambient Phase Equilibrium. In Crystal Growth for Beginners: Fundamentals of Nucleation, Crystal Growth and Epitaxy, 2nd ed.; World Scientific: Singapore, 2003; pp. 1–76. [Google Scholar]
  103. Cho, Y.K.; Yoon, D.Y.; Kim, B.K. Surface Roughening Transition and Coarsening of NbC Grains in Liquid Cobalt-Rich Matrix. J. Am. Ceram. Soc. 2004, 87, 443–448. [Google Scholar] [CrossRef]
  104. Heo, Y.H.; Jeon, S.C.; Fisher, J.G.; Choi, S.Y.; Hur, K.H.; Kang, S.J.L. Effect of step free energy on delayed abnormal grain growth in a liquid phase-sintered BaTiO3 model system. J. Eur. Ceram. Soc. 2011, 31, 755–762. [Google Scholar] [CrossRef]
  105. Trung, D.T.; Fisher, J.G. Controlled-Atmosphere Sintering of KNbO3. Appl. Sci. 2020, 10, 2131. [Google Scholar] [CrossRef]
  106. Jo, W.; Kim, D.Y.; Hwang, N.M. Effect of Interface Structure on the Microstructural Evolution of Ceramics. J. Am. Ceram. Soc. 2006, 89, 2369–2380. [Google Scholar] [CrossRef]
  107. Effect of Crystal Shape on the Grain Growth during Liquid Phase Sintering of Ceramics. J. Korean Ceram. Soc. 2006, 43, 728–733. [CrossRef]
  108. Moon, K.S.; Kang, S.J.L. Coarsening Behavior of Round-Edged Cubic Grains in the Na1/2Bi1/2TiO3-BaTiO3 System. J. Am. Ceram. Soc. 2008, 91, 3191–3196. [Google Scholar] [CrossRef]
  109. Fisher, J.G.; Benčan, A.; Godnjavec, J.; Kosec, M. Growth behaviour of potassium sodium niobate single crystals grown by solid-state crystal growth using K4CuNb8O23 as a sintering aid. J. Eur. Ceram. Soc. 2008, 28, 1657–1663. [Google Scholar] [CrossRef]
  110. Farooq, M.U.; Ko, S.Y.; Fisher, J.G. Effect of SrTiO3 content on the growth of (100-x)(K0.5Na0.5)NbO3-xSrTiO3 lead-free piezoelectric single crystals grown by the solid-state crystal growth method. Adv. Appl. Ceram. 2016, 115, 81–88. [Google Scholar] [CrossRef]
  111. Rafiq, M.A.; Costa, V.M.E.; Vilarinho, P.M. Establishing the Domain Structure of (K0.5Na0.5)NbO3 (KNN) Single Crystals by Piezoforce-Response Microscopy. Sci. Adv. Mater. 2014, 6, 426–433. [Google Scholar] [CrossRef]
  112. Bah, M.; Alyabyeva, N.; Retoux, R.; Giovannelli, F.; Zaghrioui, M.; Ruyter, A.; Delorme, F.; Monot-Laffez, I. Investigation of the domain structure and hierarchy in potassium-sodium niobate lead-free piezoelectric single crystals. RSC Adv. 2016, 6, 49060–49067. [Google Scholar] [CrossRef]
  113. Hu, C.; Meng, X.; Zhang, M.-H.; Tian, H.; Daniels, J.E.; Tan, P.; Huang, F.; Li, L.; Wang, K.; Li, J.-F.; et al. Ultra-large electric field–induced strain in potassium sodium niobate crystals. Sci. Adv. 2020, 6, eaay5979. [Google Scholar] [CrossRef] [PubMed]
  114. Rafiq, M.A.; Tkach, A.; Costa, M.E.; Vilarinho, P.M. Defects and charge transport in Mn-doped K0.5Na0.5NbO3 ceramics. Phys. Chem. Chem. Phys. 2015, 17, 24403–24411. [Google Scholar] [CrossRef] [PubMed]
  115. Popovič, A.; Bencze, L.; Koruza, J.; Malič, B. Vapour pressure and mixing thermodynamic properties of the KNbO3–NaNbO3 system. RSC Adv. 2015, 5, 76249–76256. [Google Scholar] [CrossRef]
  116. Samardzžija, Z.; Bernik, S.; Marinenko, R.B.; Malič, B.; Čeh, M. An EPMA Study on KNbO3 and NaNbO3 Single Crystals–Potential Reference Materials for Quantitative Microanalysis. Microchim. Acta 2004, 145, 203–208. [Google Scholar] [CrossRef]
  117. Chiang, Y.M.; Birnie, D.; Kingery, W.D. Chapter 5 Microstructure. In Physical Ceramics: Principles for Ceramic Science and Engineering; John Wiley and Sons: New York, NY, USA, 1997; pp. 351–513. [Google Scholar]
  118. Kang, S.J.L. Grain Growth and Densification in Porous Materials. In Sintering: Densification, Grain Growth and Microstructure; Elsevier Butterworth Heineman: Oxford, UK, 2005; pp. 145–170. [Google Scholar]
  119. German, R.M. Solid-State Sintering Fundamentals. In Sintering Theory and Practice; John Wiley and Sons: New York, NY, USA, 1996; pp. 67–141. [Google Scholar]
  120. Oh, U.C.; Chung, Y.S.; Kim, D.Y.; Yoon, D.N. Effect of Grain Growth on Pore Coalescence During the Liquid-Phase Sintering of MgO-CaMgSiO4 Systems. J. Am. Ceram. Soc. 1988, 71, 854–857. [Google Scholar] [CrossRef]
  121. German, R.M. Liquid-Phase Sintering. In Sintering Theory and Practice; John Wiley and Sons: New York, NY, USA, 1996; pp. 225–312. [Google Scholar]
  122. Xiong, Y.; Hu, J.; Shen, Z. Dynamic pore coalescence in nanoceramic consolidated by two-step sintering procedure. J. Eur. Ceram. Soc. 2013, 33, 2087–2092. [Google Scholar] [CrossRef]
  123. Liu, Y.; Chu, R.; Xu, Z.; Lv, H.; Wu, L.; Yang, Y.; Li, G. Effects of K4CuNb8O23 on phase structure and electrical properties of K0.5Na0.5NbO3–LiSbO3 lead-free piezoceramics. Phys. B Condens. Matter 2012, 407, 2573–2577. [Google Scholar] [CrossRef]
  124. Ahmadi Moghadam, H.; Barzegar, A. Low-temperature sintering of K0.5Na0.5NbO3 lead free ceramics using nano CuO sintering aid. J. Mater. Sci. Mater. Electron. 2017, 28, 13161–13167. [Google Scholar] [CrossRef]
  125. Rheinheimer, W.; Bäurer, M.; Chien, H.; Rohrer, G.S.; Handwerker, C.A.; Blendell, J.E.; Hoffmann, M.J. The equilibrium crystal shape of strontium titanate and its relationship to the grain boundary plane distribution. Acta Mater. 2015, 82, 32–40. [Google Scholar] [CrossRef]
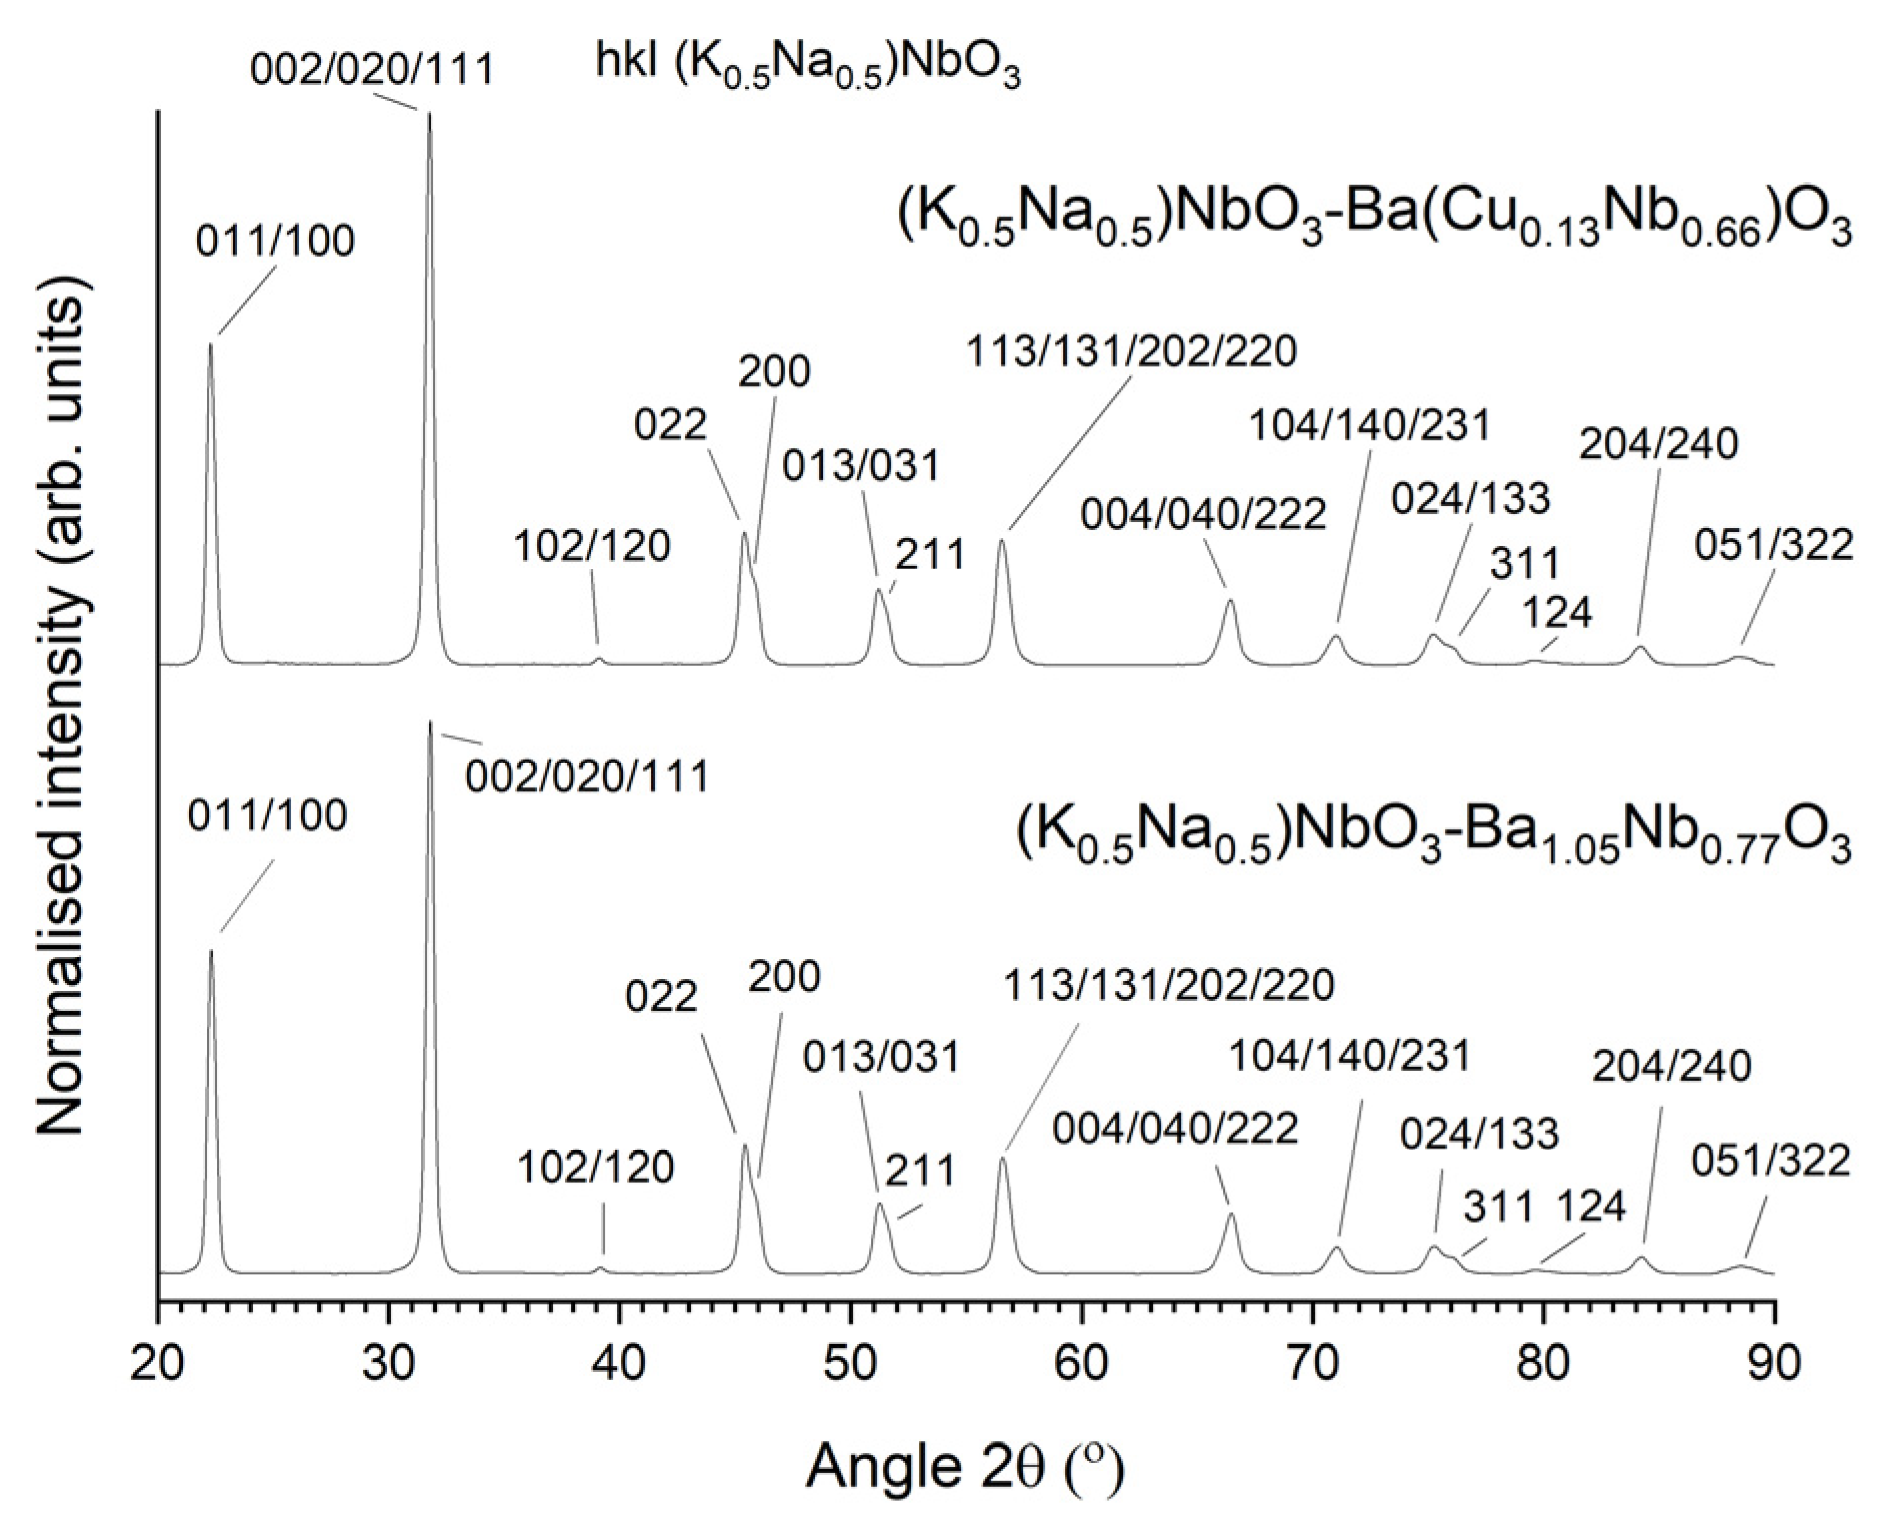
Figure 1. XRD patterns of calcined 98.5 mol% (K0.5Na0.5)NbO3-1.5 mol% Ba1.05Nb0.77O3 and 98.5 mol% (K0.5Na0.5)NbO3-1.5 mol% Ba(Cu0.13Nb0.66)O3 powders.
Materials 16 03638 g001
Figure 2. Pictures of a 98.5 mol% (K0.5Na0.5)NbO3-1.5 mol% Ba1.05Nb0.77O3 sample sintered at 1135 °C for 20 h: (a) top; (b) bottom; (c) side. Each blue line = 1 mm.
Materials 16 03638 g002
Figure 3. (a) XRD patterns of the as-sintered top and bottom faces of the 98.5 mol% (K0.5Na0.5)NbO3-1.5 mol% Ba1.05Nb0.77O3 sample from Figure 2: (b) XRD patterns of the samples in the range 20–40° 2θ, along with XRD patterns of [110] and [001]-oriented KTaO3 single-crystal substrates and the stick pattern for KTaO3.
Materials 16 03638 g003
Figure 4. Cross-section SEM micrographs of a 98.5 mol% (K0.5Na0.5)NbO3-1.5 mol% Ba1.05Nb0.77O3 sample sintered at 1135 °C for 20 h: (a,b) single-crystal regions; (c) boundary between two single crystals; (d) porosity in the single crystal.
Materials 16 03638 g004
Figure 5. (a) XRD pattern of the as-sintered face of an unsuccessful 98.5 mol% (K0.5Na0.5)NbO3-1.5 mol% Ba1.05Nb0.77O3 sample sintered at 1135 °C for 20 h; (b) SEM micrograph of the sample; (c) grain-size distribution of the sample.
Materials 16 03638 g005
Figure 6. (a) Picture of a 98.5 mol% (K0.5Na0.5)NbO3-1.5 mol% Ba1.05Nb0.77O3 single crystal grown on a [001] KTaO3 seed crystal by sintering at 1135 °C for 20 h. Each blue line = 1 mm; (b) XRD pattern of the top face of the as-sintered sample in (a); (c) XRD pattern of the sample in (a) in the range 21.5–23.0° 2θ, along with an XRD pattern of the [001]-oriented KTaO3 single-crystal substrate and the stick pattern for KTaO3; (d) diffraction pattern of the 98.5 mol% (K0.5Na0.5)NbO3-1.5 mol% Ba1.05Nb0.77O3 single crystal taken by single-crystal XRD.
Materials 16 03638 g006
Figure 7. (a) SEM micrograph of a 98.5 mol% (K0.5Na0.5)NbO3-1.5 mol% Ba1.05Nb0.77O3 sample with [001] KTaO3 seed crystal sintered at 1135 °C for 5 h; (b) SEM micrograph of the matrix region in part (a).
Materials 16 03638 g007
Figure 8. (a) Picture of a 98.5 mol% (K0.5Na0.5)NbO3-1.5 mol% Ba(Cu0.13Nb0.66)O3 sample sintered at 1125 °C for 21 h. Each blue line = 1 mm; (b) XRD pattern of a sectioned and polished 98.5 mol% (K0.5Na0.5)NbO3-1.5 mol% Ba(Cu0.13Nb0.66)O3 sample sintered at 1125 °C for 21 h.
Materials 16 03638 g008
Figure 9. SEM micrographs of a 98.5 mol% (K0.5Na0.5)NbO3-1.5 mol% Ba(Cu0.13Nb0.66)O3 sample sintered at 1125 °C for 20 h: (a) single crystals; (b,c) porosity in the single crystals; (d) boundary between two single crystals.
Materials 16 03638 g009
Figure 10. (a1,a2) Pictures of 98.5 mol% (K0.5Na0.5)NbO3-1.5 mol% Ba(Cu0.13Nb0.66)O3 single crystals grown on [001] KTaO3 seed crystals by sintering at 1125 °C for 10 h. Each blue line = 1 mm; (b1,b2) XRD patterns of the as-sintered samples. Patterns (b1,b2) correspond to (a1,a2) respectively; (c) XRD pattern of the sample in (b1 top face) in the range 21.5–23.0° 2θ, along with the XRD pattern of the [001]-oriented KTaO3 single-crystal substrate and the stick pattern for KTaO3; (d) diffraction pattern of the 98.5 mol% (K0.5Na0.5)NbO3-1.5 mol% Ba(Cu0.13Nb0.66)O3 single crystal taken by single-crystal XRD.
Materials 16 03638 g010
Figure 11. SEM micrographs of a 98.5 mol% (K0.5Na0.5)NbO3-1.5 mol% Ba(Cu0.13Nb0.66)O3 sample with [001] KTaO3 seed crystal sintered at 1125 °C for 10 h: (a) cross section of sample; (b) region near the seed crystal; (c) region near the sample edge.
Materials 16 03638 g011
Figure 12. SEM micrographs of an unsuccessful 98.5 mol% (K0.5Na0.5)NbO3-1.5 mol% Ba(Cu0.13Nb0.66)O3 sample with [001] KTaO3 seed crystal sintered at 1125 °C for 10 h: (a) cross section of sample; (b) region near seed crystal; (c) porosity in single crystal; (d) matrix grains; (e) grain-size distribution of the matrix grains.
Materials 16 03638 g012
Figure 13. (a) Pictures of a 98.5 mol% (K0.5Na0.5)NbO3-1.5 mol% Ba(Cu0.13Nb0.66)O3 sample with [110] KTaO3 seed crystal sintered at 1125 °C for 10 h. Each blue line = 1 mm; (b) XRD patterns of the above sample as-sintered; (c) XRD pattern of the sample after vertical cross sectioning and polishing; (d) XRD pattern of the sample in (c) in the range 21.5–23.0° 2θ, along with the XRD pattern of the [001]-oriented KTaO3 single-crystal substrate and the stick pattern for KTaO3.
Materials 16 03638 g013
Figure 14. SEM micrographs of a 98.5 mol% (K0.5Na0.5)NbO3-1.5 mol% Ba(Cu0.13Nb0.66)O3 sample with [110] KTaO3 seed crystal sintered at 1125 °C for 10 h: (a) cross section of sample; (b) single-crystal region; (c) region near sample edge.
Materials 16 03638 g014
Figure 15. Schematic plot of growth rate vs. driving force for different types of interface (modified from [93]).
Materials 16 03638 g015
Table 1. d-spacing and FWHM values of the major peaks of the 98.5 mol% (K0.5Na0.5)NbO3-1.5 mol% Ba1.05Nb0.77O3 (KNBaN) and 98.5 mol% (K0.5Na0.5)NbO3-1.5 mol% Ba(Cu0.13Nb0.66)O3 (KNBaCuN) single crystals and KTaO3 single-crystal substrates.
Peakd-Spacing (Å) FWHM (° 2θ)
KNBaN seed-free SSCG (top face) 111 2.82640.1541
KNBaN seed-free SSCG (top face) 0022.85230.1327
KNBaN seed-free SSCG (bottom face) 0114.02830.0517
KNBaN seed-free SSCG (bottom face) 1003.97100.0657
KNBaN SSCG [100] KTaO3 seed crystal 0113.99920.1687
KNBaN SSCG [100] KTaO3 seed crystal 1003.9450.1701
KNBaCuN seed-free SSCG 1112.80960.0678
KNBaCuN seed-free SSCG 0202.82030.0721
KNBaCuN seed-free SSCG 0022.83680.1031
KNBaCuN SSCG [100] KTaO3 seed crystal 0114.00670.0942
KNBaCuN SSCG [100] KTaO3 seed crystal 1003.95470.0763
KNBaCuN SSCG [110] KTaO3 seed crystal 0113.99450.0444
KNBaCuN SSCG [110] KTaO3 seed crystal 1003.94040.0477
KTaO3 substrate 1003.97110.0348
KTaO3 substrate 1102.82270.0520
Table 2. Porosity values of the 98.5 mol% (K0.5Na0.5)NbO3-1.5 mol% Ba1.05Nb0.77O3 (KNBaN) and 98.5 mol% (K0.5Na0.5)NbO3-1.5 mol% Ba(Cu0.13Nb0.66)O3 (KNBaCuN) single crystals estimated from SEM micrographs.
SampleMean Porosity (%)Standard Deviation (%)Number of Micrographs Measured
KNBaN seed-free SSCG (top face)12.919.735
KNBaN seed-free SSCG (bottom face)7.412.243
KNBaN seeded SSCG [100] KTaO3 seed crystal10.155.253
KNBaCuN seed-free SSCG2.983.854
KNBaCuN seeded SSCG [100] KTaO3 seed crystal (region next to seed crystal)8.321.172
KNBaCuN seeded SSCG [110] KTaO3 seed crystal12.105.802
Table 3. EPMA results of a 98.5 mol% (K0.5Na0.5)NbO3-1.5 mol% Ba1.05Nb0.77O3 sample sintered at 1135 °C for 20 h. Results are normalised to 0.997 formula units of Nb. The nominal composition assumes that Ba1.05Nb0.77O3 forms a complete solid solution with (K0.5Na0.5)NbO3.
ElementNaKBaNb
Top half0.477 ± 0.0070.472 ± 0.0060.015 ± 0.0000.997
Bottom half0.483 ± 0.0030.464 ± 0.0050.016 ± 0.0010.997
Nominal0.4930.4930.0160.997
Table 4. Single crystal XRD results of a 98.5 mol% (K0.5Na0.5)NbO3-1.5 mol% Ba1.05Nb0.77O3 (KNBaN) single crystal grown on a [001] KTaO3 seed crystal by sintering at 1135 °C for 20 h and a 98.5 mol% (K0.5Na0.5)NbO3-1.5 mol% Ba(Cu0.13Nb0.66)O3 (KNBaCuN) single crystal grown on a [001] KTaO3 seed crystal by sintering at 1125 °C for 10 h.
SampleCrystal SystemSpace GroupUnit Cell Parameters (Å)Unit Cell Angles (°)Unit Cell Volume (Å3)Formula Units per Unit CellTheoretical Density (g⋅ cm−3)R1wR2
KNBaN seeded SSCG [100] KTaO3 seed crystalmonoclinicP2a = 3.9761(4)
b = 3.9637(5)
c = 3.9918(4)
α = 90
β = 90.072(6)
γ = 90
62.911(12)14.580.02120.0575
KNBaCuN seeded SSCG [100] KTaO3 seed crystalmonoclinicP2a = 3.9714(6)
b = 3.9683(5)
c = 3.9996(6)
α = 90
β = 89.999(9)
γ = 90
63.033(16)14.560.02650.0715
Table 5. EPMA results of a 98.5 mol% (K0.5Na0.5)NbO3-1.5 mol% Ba(Cu0.13Nb0.66)O3 sample sintered at 1125 °C for 21 h. Results are normalised to 0.997 formula units of B-site cations. Cu is assumed to enter the B-sites. The nominal composition assumes that Ba(Cu0.13Nb0.66)O3 forms a complete solid solution with (K0.5Na0.5)NbO3.
ElementNaKBaCuSbNb
0.434 ± 0.0140.416 ± 0.0040.017 ± 0.0010.001 ± 0.0010.004 ± 0.0000.992 ± 0.001
Nominal0.4930.4930.0150.00200.995
Table 6. EPMA results of a 98.5 mol% (K0.5Na0.5)NbO3-1.5 mol% Ba(Cu0.13Nb0.66)O3 sample with [001] KTaO3 seed crystal sintered at 1125 °C for 10 h. Results are normalised to 0.997 formula units of B-site cations. Cu is assumed to enter the B-sites. The nominal composition assumes that Ba(Cu0.13Nb0.66)O3 forms a complete solid solution with (K0.5Na0.5)NbO3.
ElementNaKBaCuSbNb
0.413 ± 0.0120.464 ± 0.0040.015 ± 0.0010.002 ± 0.0010.004 ± 0.0000.991 ± 0.001
Nominal0.4930.4930.0150.00200.995
Table 7. Comparison of processing conditions, size, output ratio, and chemical composition of the 98.5 mol% (K0.5Na0.5)NbO3-1.5 mol% Ba1.05Nb0.77O3 (KNBaN) and 98.5 mol% (K0.5Na0.5)NbO3-1.5 mol% Ba(Cu0.13Nb0.66)O3 (KNBaCuN) single crystals grown in the present work with those grown by seed-free SSCG in the literature.
Sample NameNominal CompositionCompositionSintering Temperature (°C)Sintering Time (h)Size (mm)Output Ratio (Area%)Reference
KNBaN seed-free SSCG (K0.493Na0.493Ba0.016)
Nb0.997O3
(K0.472Na0.477Ba0.015)
Nb0.997O3/
(K0.464Na0.483Ba0.016)
Nb0.997O3
113520–21~5~100This work
KNBaN SSCG [100] KTaO3 seed crystal(K0.493Na0.493Ba0.016)
Nb0.997O3
Not analysed11355–20 h~5~67This work
KNBaCuN seed-free SSCG(K0.493Na0.493Ba0.015)
(Nb0.995Cu0.002)O3
(K0.416Na0.434Ba0.017)
(Nb0.992Cu0.001Sb0.004)O3
112520–21~7~91This work
KNBaCuN SSCG [100] KTaO3 seed crystal(K0.493Na0.493Ba0.015)
(Nb0.995Cu0.002)O3
(K0.464Na0.413Ba0.015)
(Nb0.991Cu0.002Sb0.004)O3
112510~7~100This work
KNBaCuN SSCG [110] KTaO3 seed crystal(K0.493Na0.493Ba0.015)
(Nb0.995Cu0.002)O3
Not analysed112510~8~78This work
KNBaCuN seed-free SSCG(K0.493Na0.493Ba0.015)
(Nb0.995Cu0.005)O3
(K0.454Na0.426Ba0.014)
(Nb1.106Cu0.000)O3
11202~23~62–89[42]
KNN-LiBiO399.5(99.6K0.5Na0.5NbO3
0.4LiBiO3)–0.5MnO2
Na0.525K0.443NbO3110521~18~93–99[33]
KNN-LiBiO3(1-x)Na0.5K0.5NbO3-xLiBiO3 (x = 0.001–0.006)(Na0.51K0.47Bi0.005)Nb1.125O3 (1110 °C, 12 h)1080–11203–24~12~90–100[40]
KNN-CuO-Bi2O3Na0.495K0.495NbO3-1.5 wt% CuO-0.5 wt% Bi2O3(Na0.494K0.468Bi0.004)
(Nb1.032Cu0.002)O3
106015~15~68[54]
Disclaimer/Publisher’s Note: The statements, opinions and data contained in all publications are solely those of the individual author(s) and contributor(s) and not of MDPI and/or the editor(s). MDPI and/or the editor(s) disclaim responsibility for any injury to people or property resulting from any ideas, methods, instructions or products referred to in the content.