
Degradation Processes of Medieval and Renaissance Glazed Ceramics

 ,
,
Abstract
1. Introduction
- Study of defects created by the interaction of the glaze with the shard;
- Study of surface defects of glazes caused by the effect of the surrounding environment on the glaze layer itself.
2. Materials and Methods
2.1. Studied Archaeological Glazed Ceramics
2.2. Initial Characterisation of the Glazes and Their Ceramic Bodies
2.3. Evaluation of the Glaze Fit
2.4. Identification of the Origin of Deterioration
3. Results
3.1. Initial Characterisation of the Studied Samples
3.2. Evaluation of the Glaze Fit and Identification of the Causes and Origins of Defects
4. Discussion
5. Conclusions
Author Contributions
Funding
Institutional Review Board Statement
Informed Consent Statement
Data Availability Statement
Acknowledgments
Conflicts of Interest
References
- Özçatal, M.; Yaygingöl, M.; İssi, A.; Turan, S.; Okyar, F.; Pfeiffer Taş, Ş.; Nastova, I.; Grupče, O.; Minčeva-Šukarova, B. Characterization of lead glazed potteries from Smyrna (Izmir/Turkey) using multiple analytical techniques; Part I: Glaze and engobe. Ceram. Int. 2014, 40, 2143–2151. [Google Scholar] [CrossRef]
- Domoney, K.; Shortland, A.J.; Kuhn, S. Characterization of 18th-century Meissen porcelain using SEM-EDS. Archaeometry 2012, 54, 454–474. [Google Scholar] [CrossRef]
- Doménech-Carbó, A.; Doménech-Carbó, M.T. Electrochemical characterization of archaeological tin-opacified lead-alkali glazes and their corrosion processes. Electroanalysis 2005, 17, 1959–1969. [Google Scholar] [CrossRef]
- Maltoni, S.; Silvestri, A.; Maritan, L.; Molin, G. The Medieval lead-glazed pottery from Nogara (north-east Italy): A multi-methodological study. J. Archaeol. Sci. 2012, 39, 2071–2078. [Google Scholar] [CrossRef]
- Figueiredo, M.O.; Silva, T.P.; Veiga, J.P. A XANES study of the structural role of lead in glazes from decorated tiles, XVI to XVIII century manufacture. Appl. Phys. A 2006, 83, 209–211. [Google Scholar] [CrossRef]
- Dik, J.; Hermens, E.; Peschar, R.; Schenk, H. Early production recipes for lead antimonate yellow in Italian art. Archaeometry 2005, 47, 593–607. [Google Scholar] [CrossRef]
- Sposito, G. The Chemistry of Soils, 2nd ed.; Oxford University Press: Oxford, UK, 2008; ISBN 978-019-5313-697. [Google Scholar]
- Strawn, D.; Bohn, H.L.; O’Connor, G.A. Soil Chemistry, 5th ed.; Wiley Blackwell: Hoboken, NJ, USA, 2020; ISBN 978-111-9515-180. [Google Scholar]
- Rejšek, K.; Vácha, R.; O’Connor, G.A. Nauka o Půdě, 5th ed.; Agriprint: Olomouc, Czech Republic, 2018; ISBN 978-80-87091-82-1. [Google Scholar]
- Clark, D.E.; Zoitos, B.K. Corrosion of Glass, Ceramics and Ceramic Superconductors: Principles, Testing, Characterization and Applications; Noyes Publications: New York, NY, USA, 1992; ISBN 0-8155-1283-X. [Google Scholar]
- Ohtake, K.; Kariya, M.; Ichimura, T. Leaching mechanism of PbO-SiO2 glasses in acid solution. J. Non-Cryst. Solids 1982, 49, 339–350. [Google Scholar] [CrossRef]
- Eppler, R.A.; Obstler, M. Understanding Glazes; The American Ceramic Society: Westerville, OH, USA, 2005; ISBN 1-57498-222-2. [Google Scholar]
- Hlaváč, J. Základy Technologie Silikátů, 2nd ed.; SNTL: Praha, Czech Republic, 1988. [Google Scholar]
- Thomas, E.; Tuttle, M.A.; Miller, E. Study of glaze penetration and its effect on glaze fit: I-III. J. Am. Ceram. Soc. 1945, 28, 52–62. [Google Scholar] [CrossRef]
- Kara, A.; Stevens, R. Interactions between an ABS type leadless glaze and a biscuit fired bone china body during glost firing. Part II: Investigation of interactions. J. Eur. Ceram. Soc. 2002, 22, 1103–1112. [Google Scholar] [CrossRef]
- Califano, A.; Baiesi, M.; Bertolin, C. Novel risk assessment tools for the climate-induced mechanical decay of wooden structures: Empirical and machine learning approaches. Forces Mech. 2022, 7, 100094. [Google Scholar] [CrossRef]
- Kavanová, M.; Kloužková, A.; Kloužek, J. Characterization of the interaction between glazes and ceramic bodies. Ceram.-Silik. 2017, 61, 267–275. [Google Scholar] [CrossRef]
- Taylor, J.R.; Bull, A.C. Ceramics Glaze Technology, 1st ed.; Pergamon Press: Oxford, UK, 1986; ISBN 0-08-033466-0. [Google Scholar]
- Kolářová, M.; Kloužková, A.; Kloužek, J.; Schwarz, J. Thermal behaviour of glazed ceramic bodies. J. Therm. Anal. Calorim. 2020, 142, 217–229. [Google Scholar] [CrossRef]
- Harman, C.G. Suggestions for solution of difficult glaze-fit problems. J. Am. Ceram. Soc. 1944, 27, 231–233. [Google Scholar] [CrossRef]
- Costa, M.; Cachim, P.; Coroado, J.; Rocha, F.; Velosa, A. Ancient wall tiles–The importance of the glaze/ceramic interface in glaze detachment. Mater. Sci. 2014, 20, 108–113. [Google Scholar] [CrossRef][Green Version]
- Kolářová, M.; Kloužková, A.; Stodolová, K.; Kloužek, J.; Dvořáková, P.; Kohoutková, M. Interaction of historical lead glazes with corrosive media. Ceram.–Silik. 2021, 65, 417–426. [Google Scholar] [CrossRef]
- Halsberghe, L. Ceramics threatened by acid-induced salts. In Conservation Science, Proceeding of the Conservation Science, Edinburgh, Scotland, 22–24 May 2002; Townsend, J.H., Eremin, K., Adriaens, A., Eds.; Archetype: London, UK, 2003; pp. 18–24. ISBN 1873132883. [Google Scholar]
- Römich, H. Historic glass and its interaction with the environment. In The Conservation of Glass and Ceramics: Research, Practise and Training, 1st ed.; Tennet, N.H., Ed.; James & James: London, UK, 1999; pp. 5–14. ISBN 978-18-73936-18-4. [Google Scholar]
- Jones, R.L. Chemical Corrosion of E-Glass Fibers in Oxalic and Other Organic Acids. J. Am. Ceram. Soc. 2006, 89, 20–23. [Google Scholar] [CrossRef]
- El-Batal, F.H.; Khalil, E.M.A.; Hamdy, Y.M.; Zidan, H.M.; Aziz, M.S.; Abdelghany, A.M. Infrared reflection spectroscopy for precise tracking of corrosion behavior in 3d-transition metals doped binary lead silicate glass. Phys. B Condens. Matter 2010, 405, 2648–2653. [Google Scholar] [CrossRef]
- Cailleteau, C.; Angeli, F.; Devreux, F.; Gin, S.; Jestin, J.; Jollivet, P.; Spalla, O. Insight into silicate-glass corrosion mechanisms. Nat. Mater. 2008, 7, 978–983. [Google Scholar] [CrossRef] [PubMed]
- Bonnet, C.; Bouquillon, A.; Turrell, S.; Deram, V.; Mille, B.; Salomon, J.; Thomassin, J.H.; Fiaud, C. Alteration of lead silicate glasses due to leaching in heated acid solutions. J. Non-Cryst. Solids 2003, 323, 214–220. [Google Scholar] [CrossRef]
- Robinet, L.; Hall, C.; Eremin, K.; Fearn, S.; Tate, J. Alteration of soda silicate glasses by organic pollutants in museums: Mechanisms and kinetics. J. Non-Cryst. Solids 2009, 355, 1479–1488. [Google Scholar] [CrossRef]
- Robinet, L.; Eremin, K.; Coupry, C.; Hall, C.; Lacome, N. Effect of organic acid vapors on the alteration of soda silicate glass. J. Non-Cryst. Solids 2007, 353, 1546–1559. [Google Scholar] [CrossRef]
- Jones, R.L.; Stewart, J. The kinetics of corrosion of e-glass fibres in sulphuric acid. J. Non-Cryst. Solids 2010, 356, 2433–2436. [Google Scholar] [CrossRef]
- Geisler, T.; Janssen, A.; Scheiter, D.; Stephan, T.; Berndt, J.; Putnis, A. Aqueous corrosion of borosilicate glass under acidic conditions: A new corrosion mechanism. J. Non-Cryst. Solids 2010, 356, 1458–1465. [Google Scholar] [CrossRef]
- Peterson, M.; Bernardin, A.M.; Kuhnen, N.C.; Riella, H.G. Evaluation of the steger method in the determination of ceramic-glaze joining. Mater. Sci. Eng. A 2007, 466, 183–186. [Google Scholar] [CrossRef]
- Schurecht, H.G. Fitting glazes to ceramic bodies. J. Am. Ceram. Soc. 1943, 26, 93–98. [Google Scholar] [CrossRef]
- Tandon, R.; Green, D.J. Residual stress determination using strain gage measurements. J. Am. Ceram. Soc. 1990, 73, 2628–2633. [Google Scholar] [CrossRef]
- Blakely, A.M. Life history of a glaze: II, Measurement of stress in a cooling glaze. J. Am. Ceram. Soc. 1938, 21, 243–251. [Google Scholar] [CrossRef]
- Johnson, A.L. Stresses in porcelain glazes. J. Am. Ceram. Soc. 1939, 22, 363–366. [Google Scholar] [CrossRef]
- Mattyasovszky-Zsolnay, L. Investigations on crazing: I. Delayed thermal constraction and crazing of ceramic glazes. J. Am. Ceram. Soc. 1946, 29, 200–203. [Google Scholar] [CrossRef]
- Hanykýř, V.; Kutzendörfer, J. Technologie Keramiky, 2nd ed.; Silikátový Svaz: Praha, Czech Republic, 2010; ISBN 978-80-86821-48-1. [Google Scholar]
- Kim, H.J.; Han, Y.S.; Kim, D.H.; Kim, D.M.; Choi, J.H.; Lee, S.M.; Kim, H.T. The generation of residual stress in ABS type glaze of commercial bone china. J. Eur. Ceram. Soc. 2016, 36, 899–903. [Google Scholar] [CrossRef]
- Morrell, R. Application of thermodilatometry to ceramic science. Anal. Proc. 1981, 18, 430–450. [Google Scholar] [CrossRef]
- Sighinolfi, D. Experimental study of deformations and state of tension in traditional ceramic materials. Mater. Ceram. Ceram. Mater. 2011, 63, 226–232. [Google Scholar]
- Oujiří, F. Napěťové vztahy v systému střep-glazura granilie. Zprav. Silikátového Svazu 2005, 2, 10–20. [Google Scholar]
- Jolivet, V.; Morizet, Y.; Hamon, J.; Paris, M.; Suzuki-Muresan, T. The influence of iodide on glass transition temperature of high-pressure nuclear waste glasses. J. Am. Ceram. Soc. 2021, 104, 1360–1369. [Google Scholar] [CrossRef]
- Hassan, R.M.; Nefati, R.; Abd-Elnaiem, A.M.; Dahshan, A. Activation energies during glass transition and fragility of the As 30 Te 64 Ga 6 chalcogenide glass. Phys. Scr. 2021, 96, 085703. [Google Scholar] [CrossRef]
- Frey, M.; Neuber, N.; Gross, O.; Zimmer, B.; Possart, W.; Busch, R. Determining the fragility of bulk metallic glass forming liquids via modulated DSC. J. Phys. Condens. Matter 2020, 32, 324004. [Google Scholar] [CrossRef]
- Souri, D. Crystallization kinetic of Sb–V2O5–TeO2 glasses investigated by DSC and their elastic moduli and Poisson’s ratio. Phys. B Condens. Matter 2015, 456, 185–190. [Google Scholar] [CrossRef]
- Kaky, K.M.; Lakshminarayana, G.; Baki, S.O.; Taufiq-Yap, Y.H.; Kityk, I.V.; Mahdi, M.A. Structural, thermal, and optical analysis of zinc boro-aluminosilicate glasses containing different alkali and alkaline modifier ions. J. Non-Cryst. Solids 2017, 456, 55–63. [Google Scholar] [CrossRef]
- Čiháková, J.; Müller, M. Malostranská Rotunda Svatého Václava v Praze: Rotunda of St. Wenceslaus in Prague’s Malá Strana; Národní Památkový Ústav: Praha, Czech Republic, 2020; ISBN 978-80-87220-17-7. [Google Scholar]
- Blažková, G. Castrum Pragense 13: Nálezy Hmotné Kultury z Renesančních Odpadních Jímek z Pražského Hradu; Archeologický Ústav AV ČR: Ptaha, Czech Republic, 2016; ISBN 978-80-87365-94-6. [Google Scholar]
- Liritzis, I.; Xanthopoulou, V.; Palamara, E.; Papageorgiou, I.; Iliopoulos, I.; Zacharias, N.; Vafiadou, A.; Karydas, A.G. Characterization and provenance of ceramic artifacts and local clays from Late Mycenaean Kastrouli (Greece) by means of p-XRF screening and statistical analysis. J. Cult. Herit. 2020, 46, 61–81. [Google Scholar] [CrossRef]
- Giovanna, F.; Giacomo, E.; Alessandro, M.; Austacio, B.; Rocco, L. Glazed sgraffito ware from Torre Alemanna (Foggia, fifteenth to sixteenth century A.D.): Technological aspects of a local production. Archaeol. Anthropol. Sci. 2022, 14, 1–25. [Google Scholar] [CrossRef]
- Li, T.; Yao, S.; He, L.; Yu, X.; Shan, S. Compositional study of household ceramic assemblages from a Late Neolithic (5300–4500 cal BP) earthen walled-town in the middle Yangtze River valley of China. J. Archaeol. Sci. Rep. 2021, 39, 103159. [Google Scholar] [CrossRef]
- Priven, A.I. General method for calculating the properties of oxide glasses and glass forming melts from their composition and temperature. Glass Technol. 2004, 45, 244–254. [Google Scholar]
- Revelo, R.J.; Menegazz, A.P.; Ferreira, E.B. Cathode-Ray Tube panel glass replaces frit in transparent glazes for ceramic tiles. Ceram. Int. 2018, 44, 13790–13796. [Google Scholar] [CrossRef]
- Kloužková, A.; Zemenová, P.; Kohoutková, M.; Mazač, Z. Ageing of fired-clay ceramics: Comparative study of rehydroxylation processes in a kaolinitic raw material and moon-shaped ceramic idol from the Bronze Age. Appl. Clay Sci. 2016, 119, 358–364. [Google Scholar] [CrossRef]
- Mazurin, O.V. Glass properties: Compilation, evaluation, and prediction. J. Non-Cryst. Solids 2005, 351, 1103–1112. [Google Scholar] [CrossRef]
- Dvořáková, P.; Kloužková, A.; Kohoutková, M.; Kolářová, M. Moisture expansion of Ca-rich ceramic body. IOP Conf. Ser. Mater. Sci. Eng. 2021, 1050, 012004. [Google Scholar] [CrossRef]
- Coutinho, M.L.; Miller, A.Z.; Macedo, M.F. Biological colonization and biodeterioration of architectural ceramic materials: An overview. J. Cult. Herit. 2015, 16, 759–777. [Google Scholar] [CrossRef]
- NF P13-302. Céramique. Entrevous en Terre Cuite Pour Planchers en Béton à Poutrelles Préfabriquées Avec Dalle de Compression Coulée en Oeuvre. 1983. Available online: https://www.boutique.afnor.org/en-gb/standard/nf-p13302/hollow-clay-blocks-for-floors-made-with-precast-concrete-beams/fa018371/10587%E8%BF%99%E4%B8%AA%E6%A0%87%E5%87%86%E6%88%91%E6%90%9C%E7%B4%A2%E4%BA%86%EF%BC%8C%E6%B2%A1%E6%89%BE%E5%88%B0%E5%85%B7%E4%BD%93%E7%9A%84publisher (accessed on 27 December 2022).


| Label | Photo Documentation | Location | Date | Description |
|---|---|---|---|---|
| R1 |  | Lesser Town Square, Romanesque St. Wenceslas Rotunda on the premises of the Charles University building | 11th to 12th century | Fragment of square tile with dark black-brown glaze |
| R2 |  | Fragment of square tile with dark black-brown glaze | ||
| R3 |  | Fragment of square tile with dark black-brown glaze | ||
| R4 |  | Fragment of hexagonal tile with dark black-brown glaze | ||
| G1 |  | The western cloister of the Benedictine Arch-Abbey | 13th century | Fragments from ceramic mosaic pavement with transparent and dark brown glazes |
| G2 |  | |||
| G3 |  | |||
| S1 |  | Prague Castle complex waste pit located in the Salm Palace | 16th century | Pedestal corner of stove tile with brown glaze |
| S2 |  | Fragment of stove tile with dark brown glaze | ||
| S3 |  | Fragment of stove tile with blue-brown glaze | ||
| S4 |  | Fragment of stove tile with brown glaze | ||
| S5 |  | Fragment of stove tile with black-brown glaze | ||
| S6 |  | Fragment of stove tile with light brown glaze | ||
| S7 |  | Prague Castle complex waste pit located in the Schwarzenberg Palace | 17th century | Fragment of square stove tile with green glaze |
| S8 |  | 16th century | Fragment of rectangular stove tile with green glaze | |
| W1 |  | Prague Castle complex waste pit located in the Schwarzenberg Palace | 16th century | Fragment of large-format wall tile with green glaze |
| W2 |  | Prague Castle complex waste pit located in the Schwarzenberg Palace | 16th century | Fragment of large-format wall tile with multi-coloured glazes |
| M1 |  | Prague Castle complex waste pit C | 17th–18th century | Fragment of cooking pipkin with dark brown glaze |
| T1 |  | Prague Castle complex waste pit B | 16th century | Fragment of distillation lid with green glaze |
| T2 |  | Fragment of technical bowl with green glaze | ||
| T3 |  | Fragment of technical bowl with green glaze | ||
| F1 |  | Prague Castle complex waste pit H and C | 18th century | Fragment of a faience import plate with blue onglaze decoration |
| F2 |  | Fragment of a faience import plate with blue onglaze decoration |
| Label | Measuring Method | Tn (°C) | σbody (MPa) | σglaze (MPa) | Total Mismatch Δ (MPa) | Identified Defects | Corrosion Products |
|---|---|---|---|---|---|---|---|
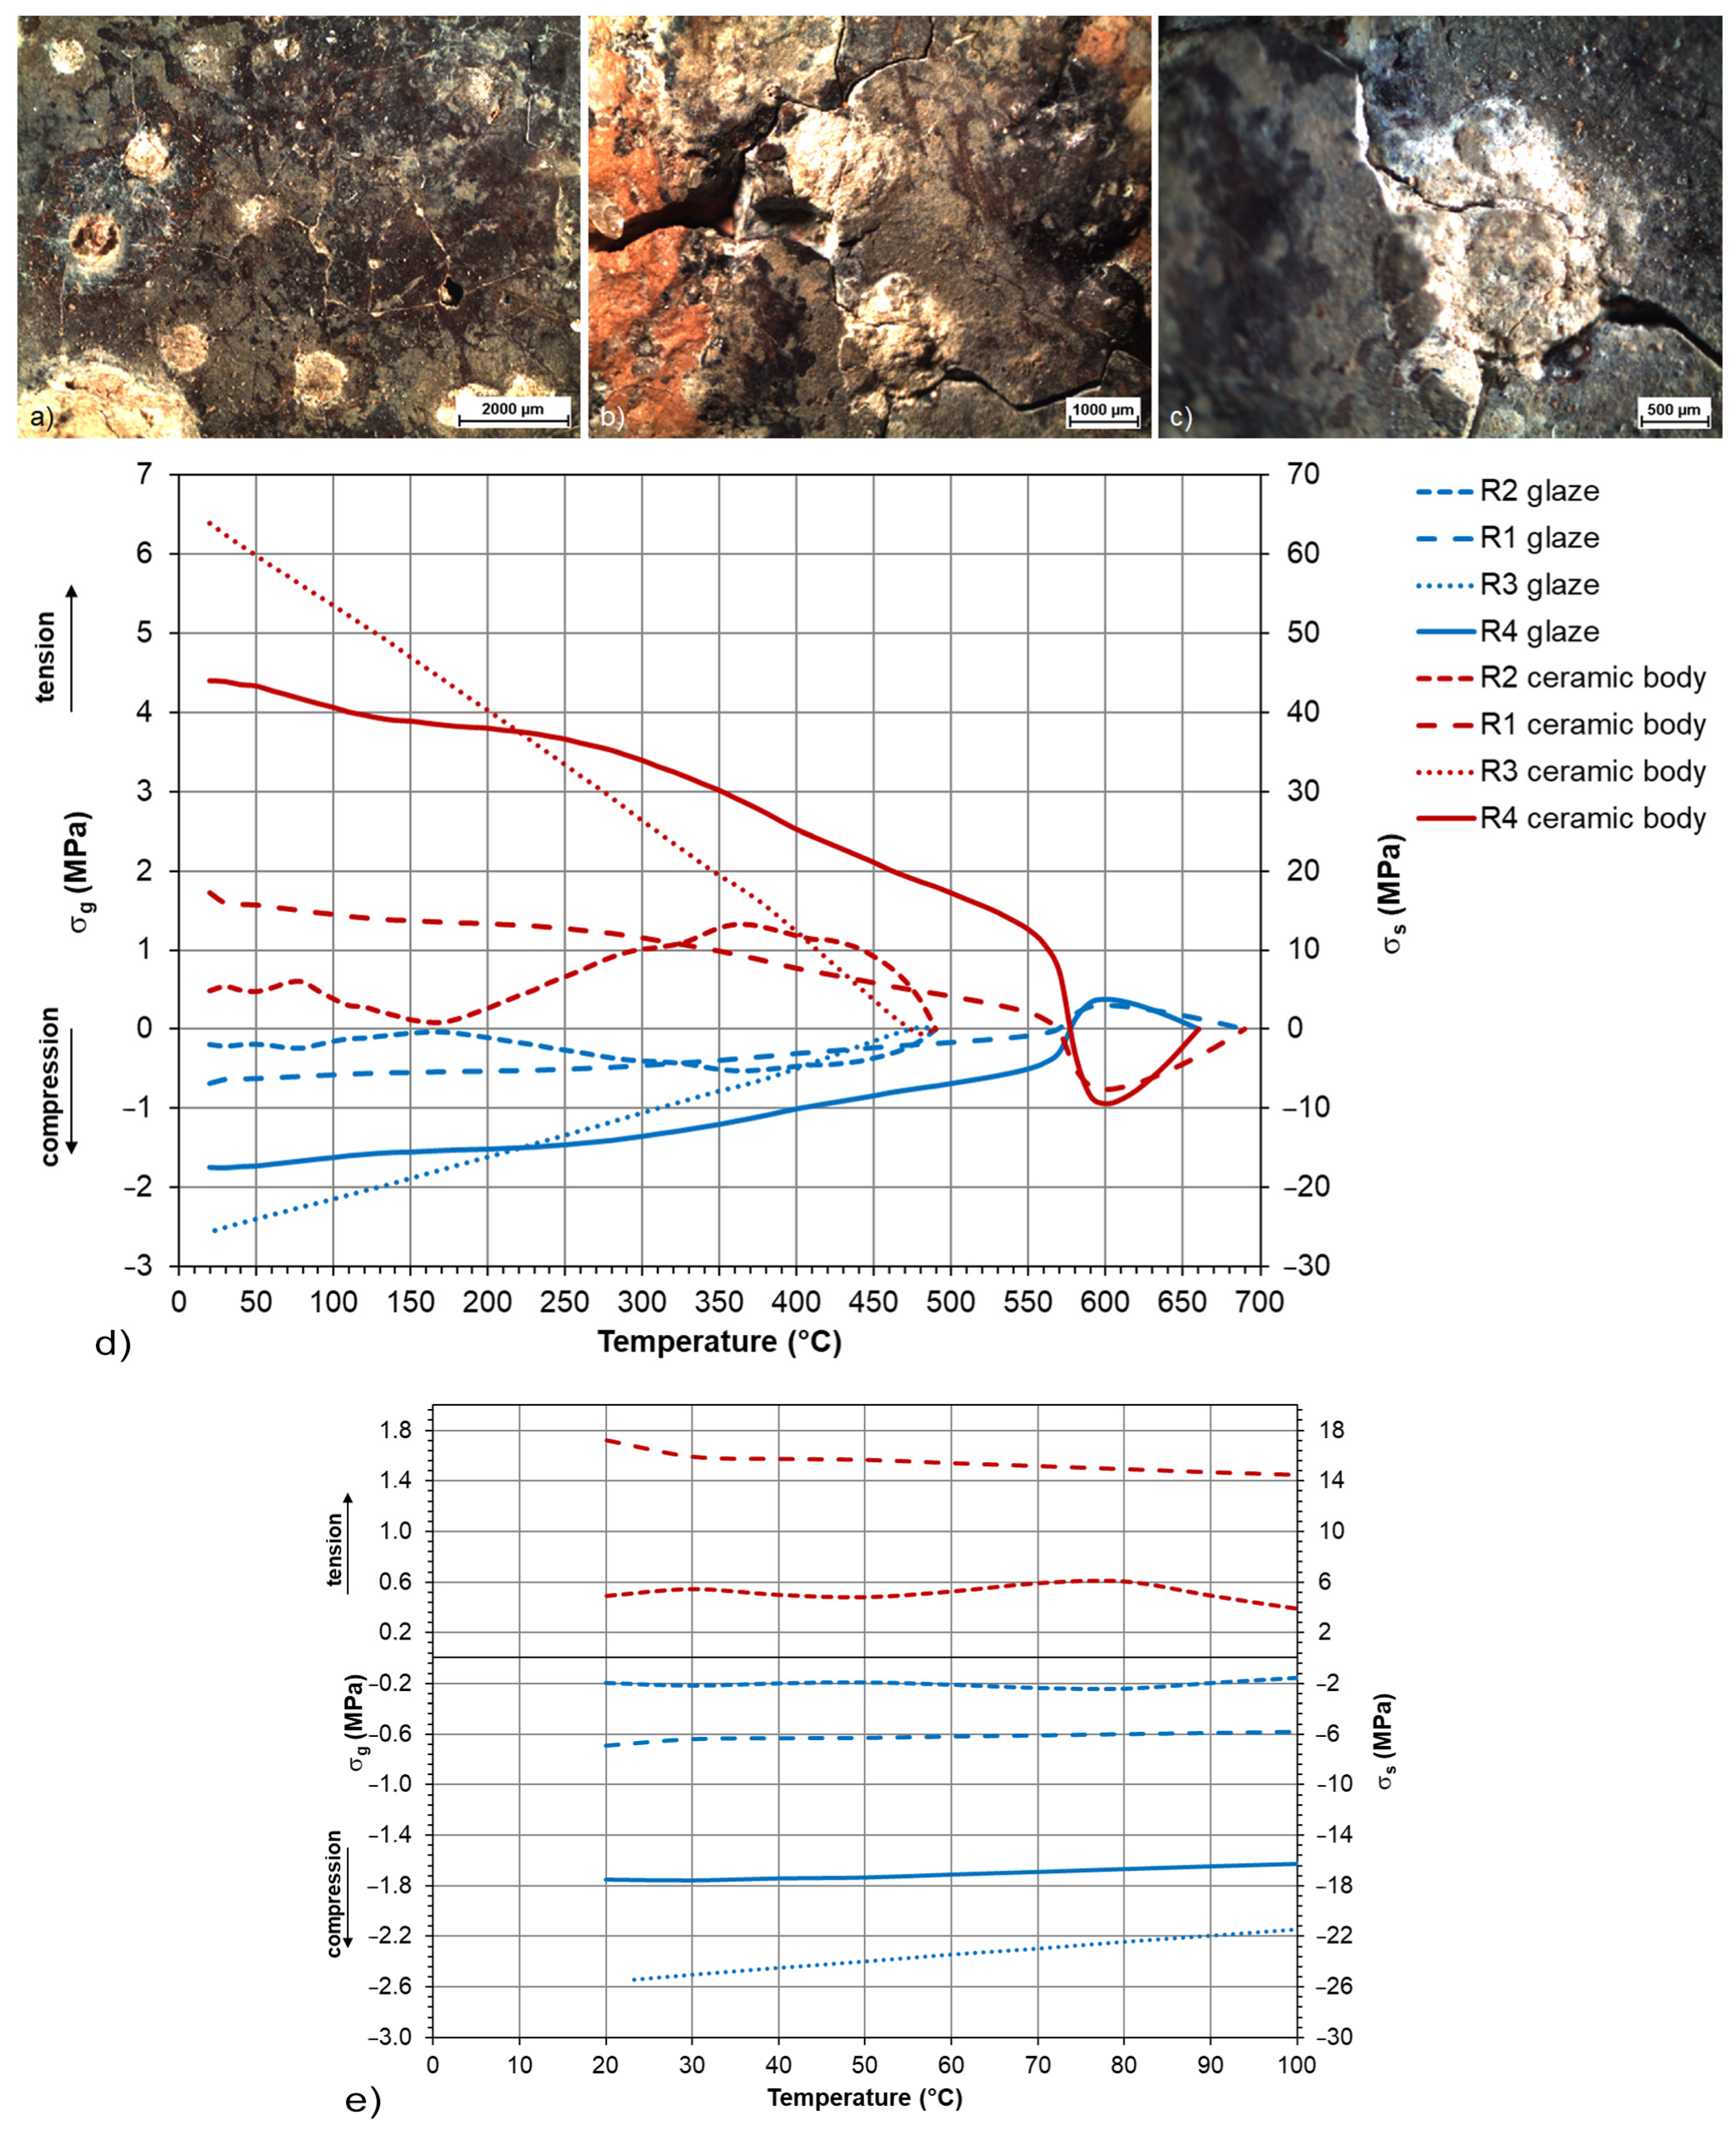
| R1 | DIL/TMA | 680 | 0.79 | −0.05 | 0.84 | delay peeling/mechanical abrasion | hydrated phosphates and carbonates |
| R2 | DIL/calculation | 490 | 5.43 | −0.22 | 5.65 | delay peeling/mechanical abrasion | hydrated phosphates and carbonates |
| R3 | DIL/calculation | 490 | 63.65 | −2.54 | 66.19 | speckling/mechanical abrasion | hydrated phosphates and carbonates |
| R4 | DIL/TMA | 660 | 44.00 | −1.75 | 45.75 | delay peeling/mechanical abrasion/ speckling | hydrated phosphates and carbonates (cerussite) |
| G1 | DIL/calculation | 640 | 96.92 | −3.88 | 100.8 | peeling/speckling/ delaycrazing | not present |
| G2 | DIL/calculation | 640 | 93.42 | −3.74 | 97.16 | peeling/speckling | not present |
| G3 | DIL/calculation | 640 | 86.65 | −3.47 | 90.12 | speckling/ delay crazing | not present |
| S1 | DIL/calculation | 560 | −86.91 | 1.76 | 88.67 | crazing/ salt efflorescence/speckling | hydrated phosphates |
| S2 | DIL/calculation | 580 | −66.90 | 2.73 | 69.63 | crazing/mechanical abrasion | not identified |
| S3 | DIL/TMA | 540 | −68.17 | 3.01 | 71.18 | crazing | not identified |
| S4 | DIL/TMA | 480 | −100.73 | 2.07 | 102.80 | crazing/corrosion pinholes/mechanical abrasion | hydrated phosphates and sulphates |
| S5 | DIL/TMA | 530 | −43.19 | 1.73 | 44.92 | crazing/corrosion pinholes | hydrated phosphates and sulphates |
| S6 | DIL/calculation | 500 | −77.47 | 2.93 | 80.40 | crazing | not present |
| S7 | DIL/calculation | 540 | −94.05 | 1.97 | 96.02 | crazing/ iridescence | hydrated phosphates |
| S8 | DIL/calculation | 550 | −93.09 | 1.94 | 95.03 | crazing iridescence/ corrosion pinholes | hydrated phosphates |
| W1 | DIL/calculation | 620 | 25.84 | −0.36 | 26.20 | delay crazing/salt efflorescence | not identified |
| W2 | DIL/calculation | 610 | 18.04 | −0.26 | 18.30 | delay crazing/iridescence | not identified |
| M1 | DIL/calculation | 460 | −120.46 | 4.89 | 125.35 | crazing/mechanical abrasion/corrosion pinholes | not identified |
| F1 | DIL/calculation | 560 | 90.09 | −3.60 | 93.69 | delay crazing/blisters/ mechanical abrasion | not identified |
| F2 | DIL/calculation | 540 | 61.35 | −2.45 | 63.80 | blisters/ mechanical abrasion | not identified |
| T1 | DIL/calculation | 630 | 18.04 | −0.69 | 18.73 | delay crazing/mechanical abrasion/ salt efflorescence | hydrated phosphates and sulphates |
| T2 | DIL/TMA | 620 | 17.20 | −0.36 | 17.56 | delay crazing/mechanical abrasion | hydrated phosphates and sulphates |
| T3 | DIL/calculation | 620 | 16.25 | −0.65 | 16.90 | delay crazing/mechanical abrasion | hydrated phosphates and sulphates |
Disclaimer/Publisher’s Note: The statements, opinions and data contained in all publications are solely those of the individual author(s) and contributor(s) and not of MDPI and/or the editor(s). MDPI and/or the editor(s) disclaim responsibility for any injury to people or property resulting from any ideas, methods, instructions or products referred to in the content. |
© 2022 by the authors. Licensee MDPI, Basel, Switzerland. This article is an open access article distributed under the terms and conditions of the Creative Commons Attribution (CC BY) license (https://creativecommons.org/licenses/by/4.0/).
Share and Cite
Kolářová, M.; Kloužková, A.; Kohoutková, M.; Kloužek, J.; Dvořáková, P. Degradation Processes of Medieval and Renaissance Glazed Ceramics. Materials 2023, 16, 375. https://doi.org/10.3390/ma16010375
Kolářová M, Kloužková A, Kohoutková M, Kloužek J, Dvořáková P. Degradation Processes of Medieval and Renaissance Glazed Ceramics. Materials. 2023; 16(1):375. https://doi.org/10.3390/ma16010375
Chicago/Turabian StyleKolářová, Mária, Alexandra Kloužková, Martina Kohoutková, Jaroslav Kloužek, and Pavla Dvořáková. 2023. "Degradation Processes of Medieval and Renaissance Glazed Ceramics" Materials 16, no. 1: 375. https://doi.org/10.3390/ma16010375
APA StyleKolářová, M., Kloužková, A., Kohoutková, M., Kloužek, J., & Dvořáková, P. (2023). Degradation Processes of Medieval and Renaissance Glazed Ceramics. Materials, 16(1), 375. https://doi.org/10.3390/ma16010375