
Laboratory Test and Geochemical Modeling of Cement Paste Degradation, in Contact with Ammonium Chloride Solution


Abstract
:1. Introduction
Ca6[Si(OH)6]2·(CO3)2·(SO4)2·24H2O + 2Al(OH)4− + SO42− + 2OH−
Ca6[Si(OH)6]2·(CO3)2·(SO4)2·24H2O + Al2O3·xH2O + CaSO4·2H2O + 7H2O + 4Ca2+ + 8NH3↑
2CaSO4·2H2O + 2H4SiO4 + 2CaCO3 + 26H2O + 2Ca2+ + 4Cl− + 4NH3↑
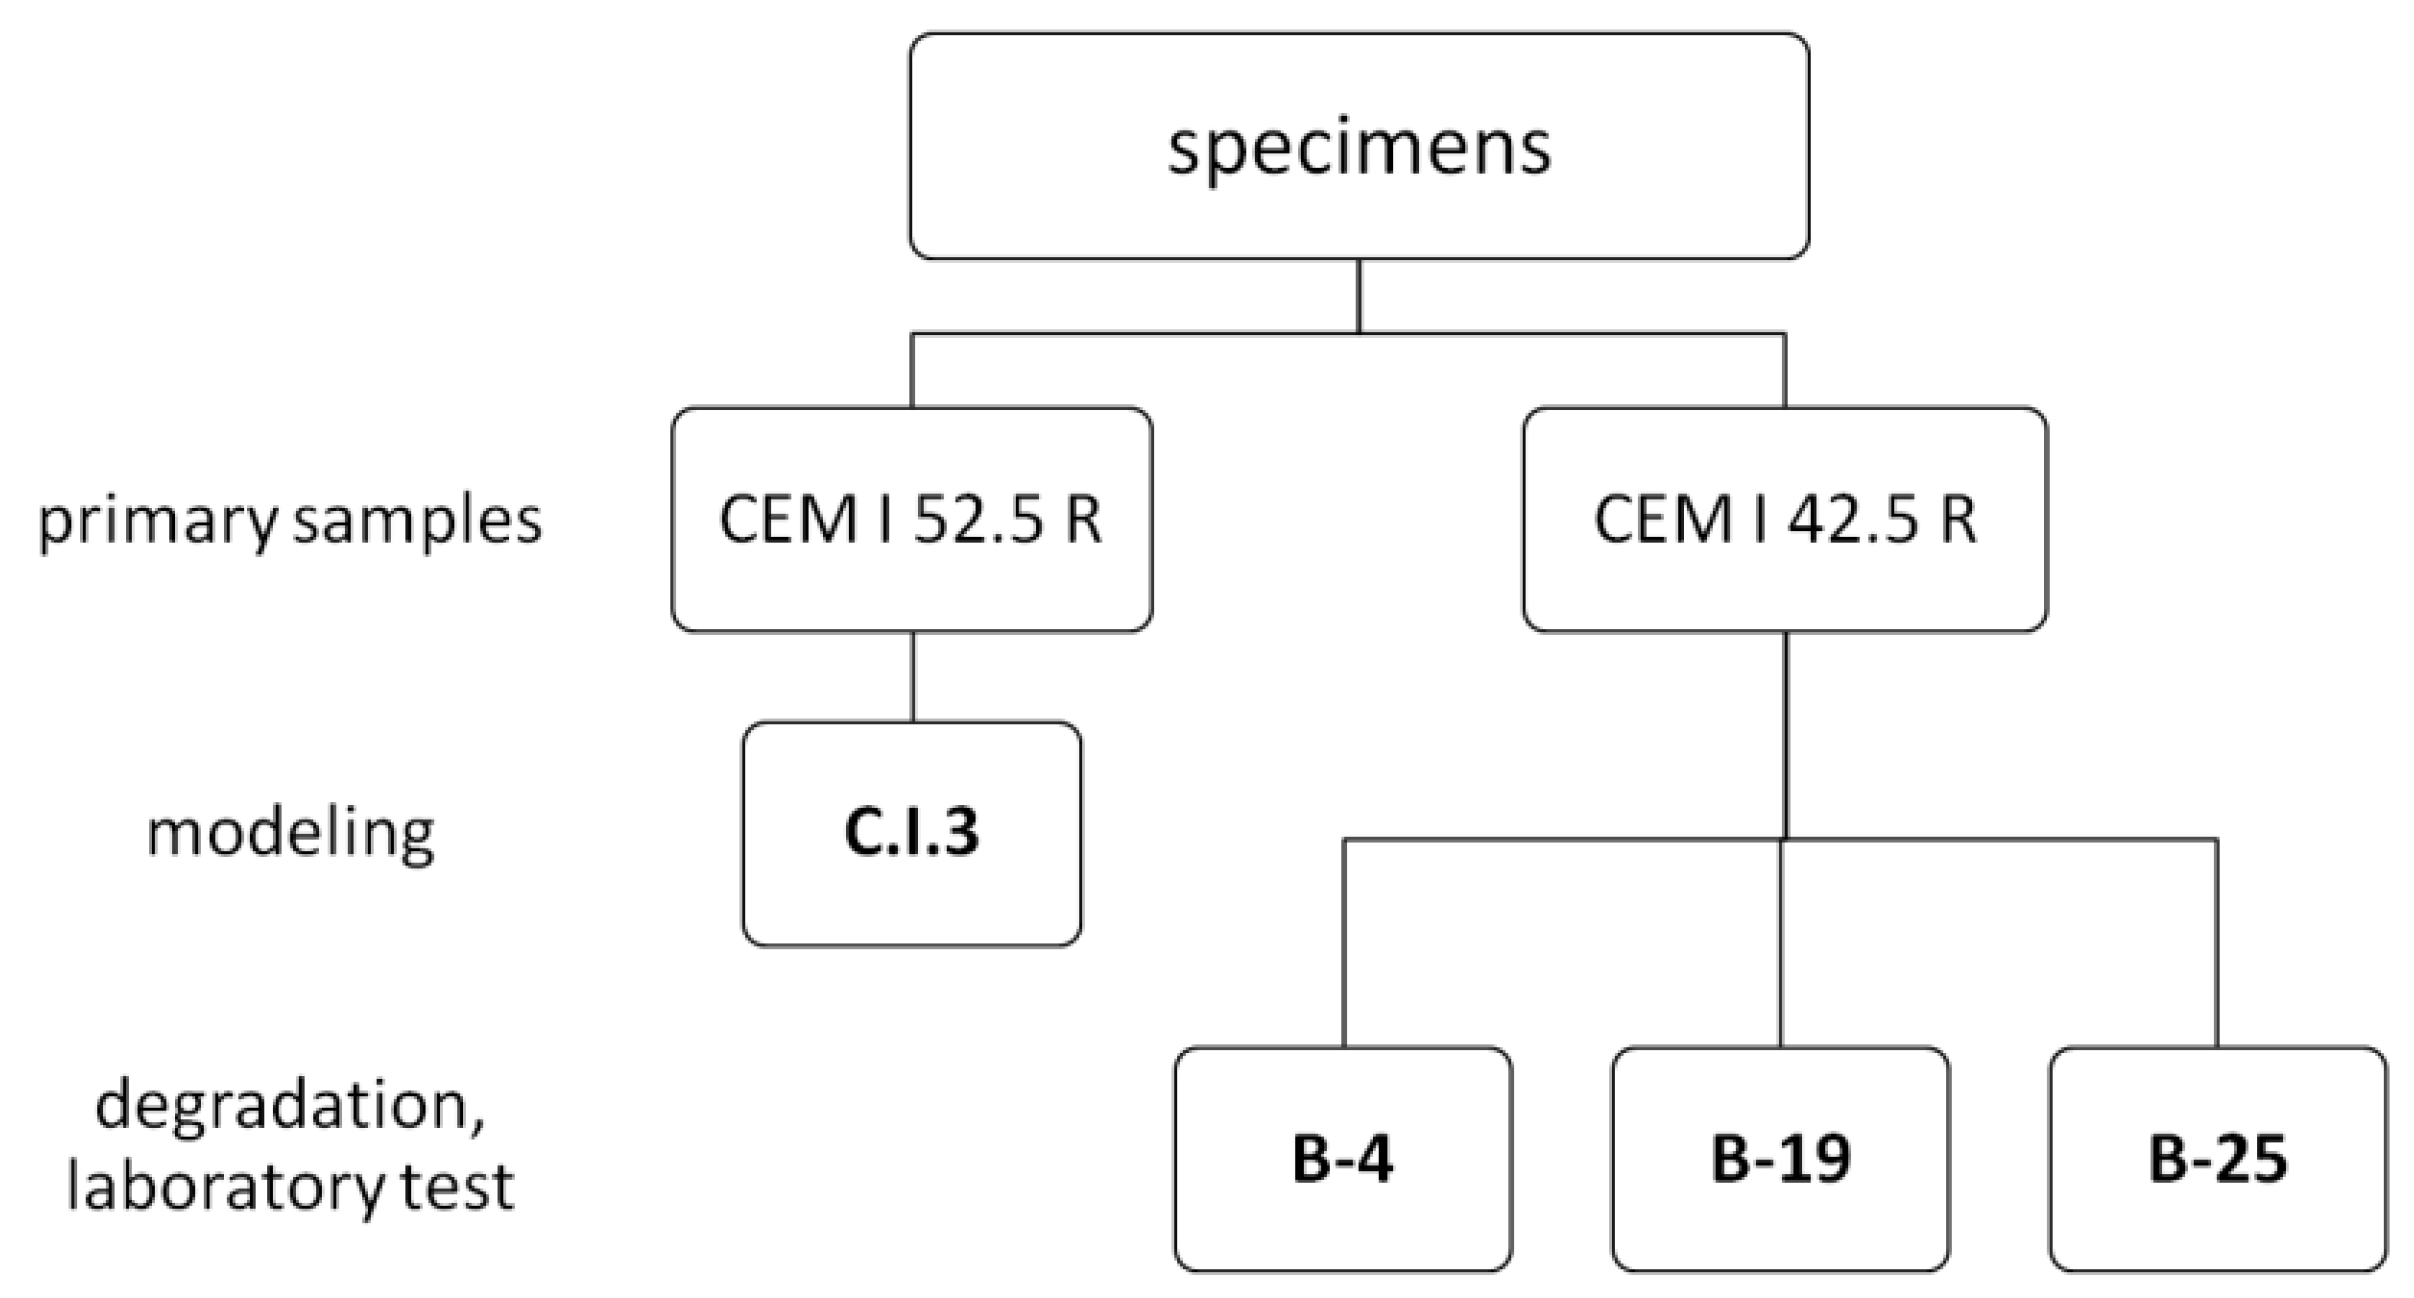
2. Materials and Methods
2.1. Laboratory Examination
2.1.1. Materials
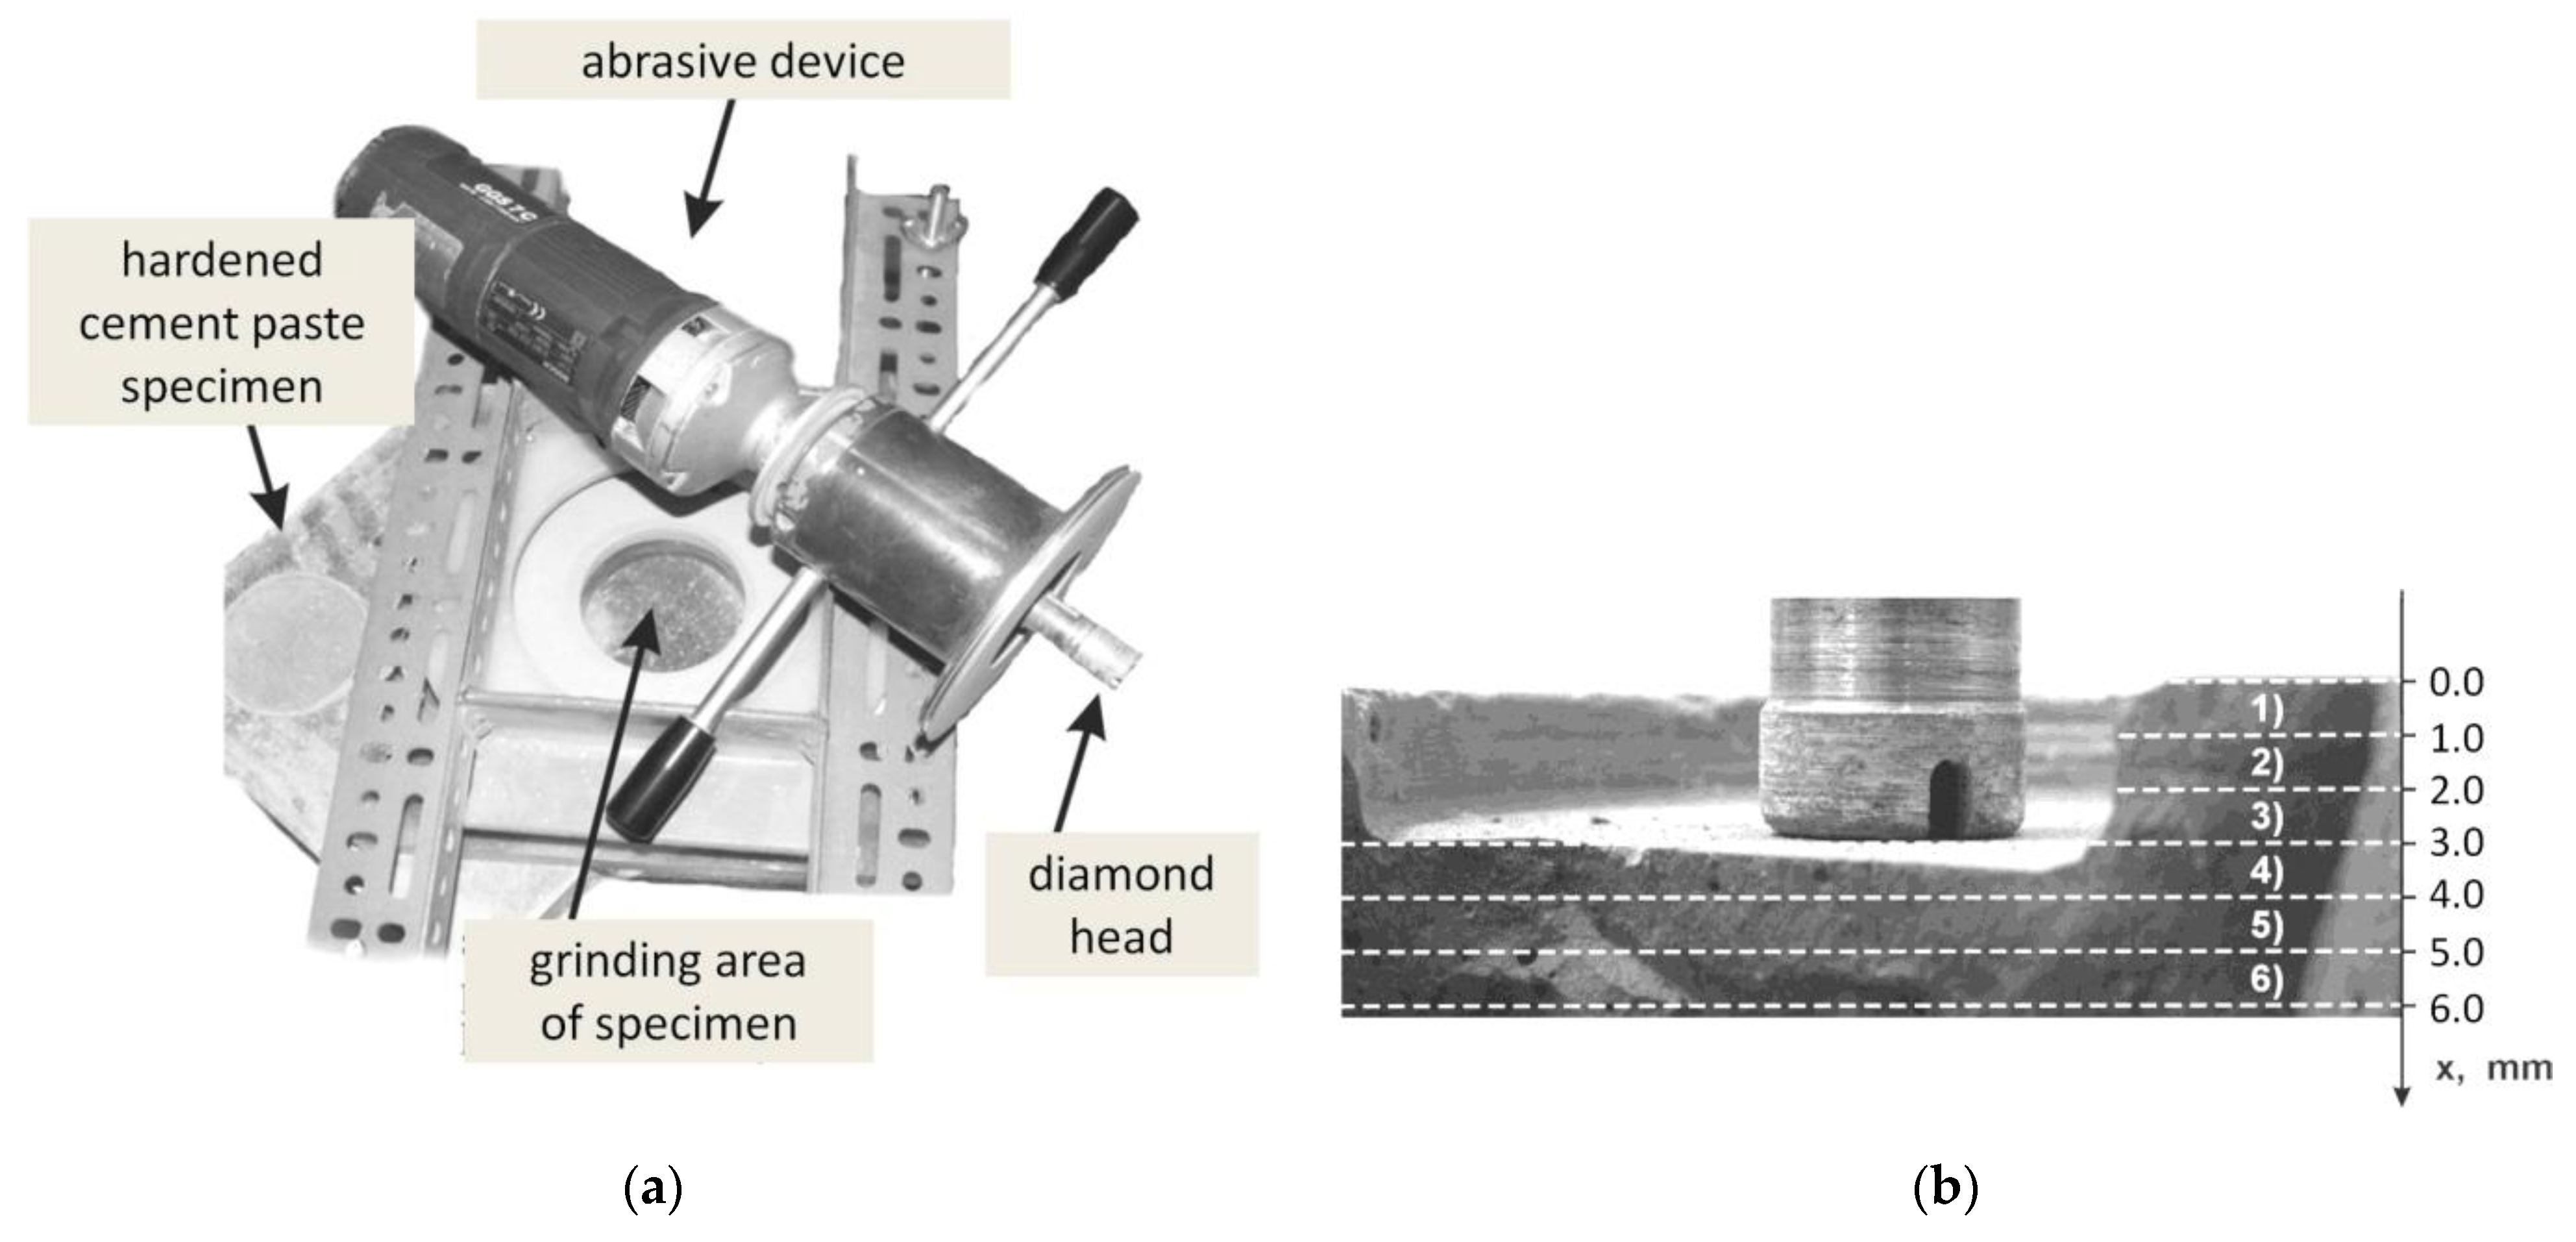
2.1.2. Methods
- Porosity examination of hardened cement paste
- Layers sampling
- Phases examination (XRD)
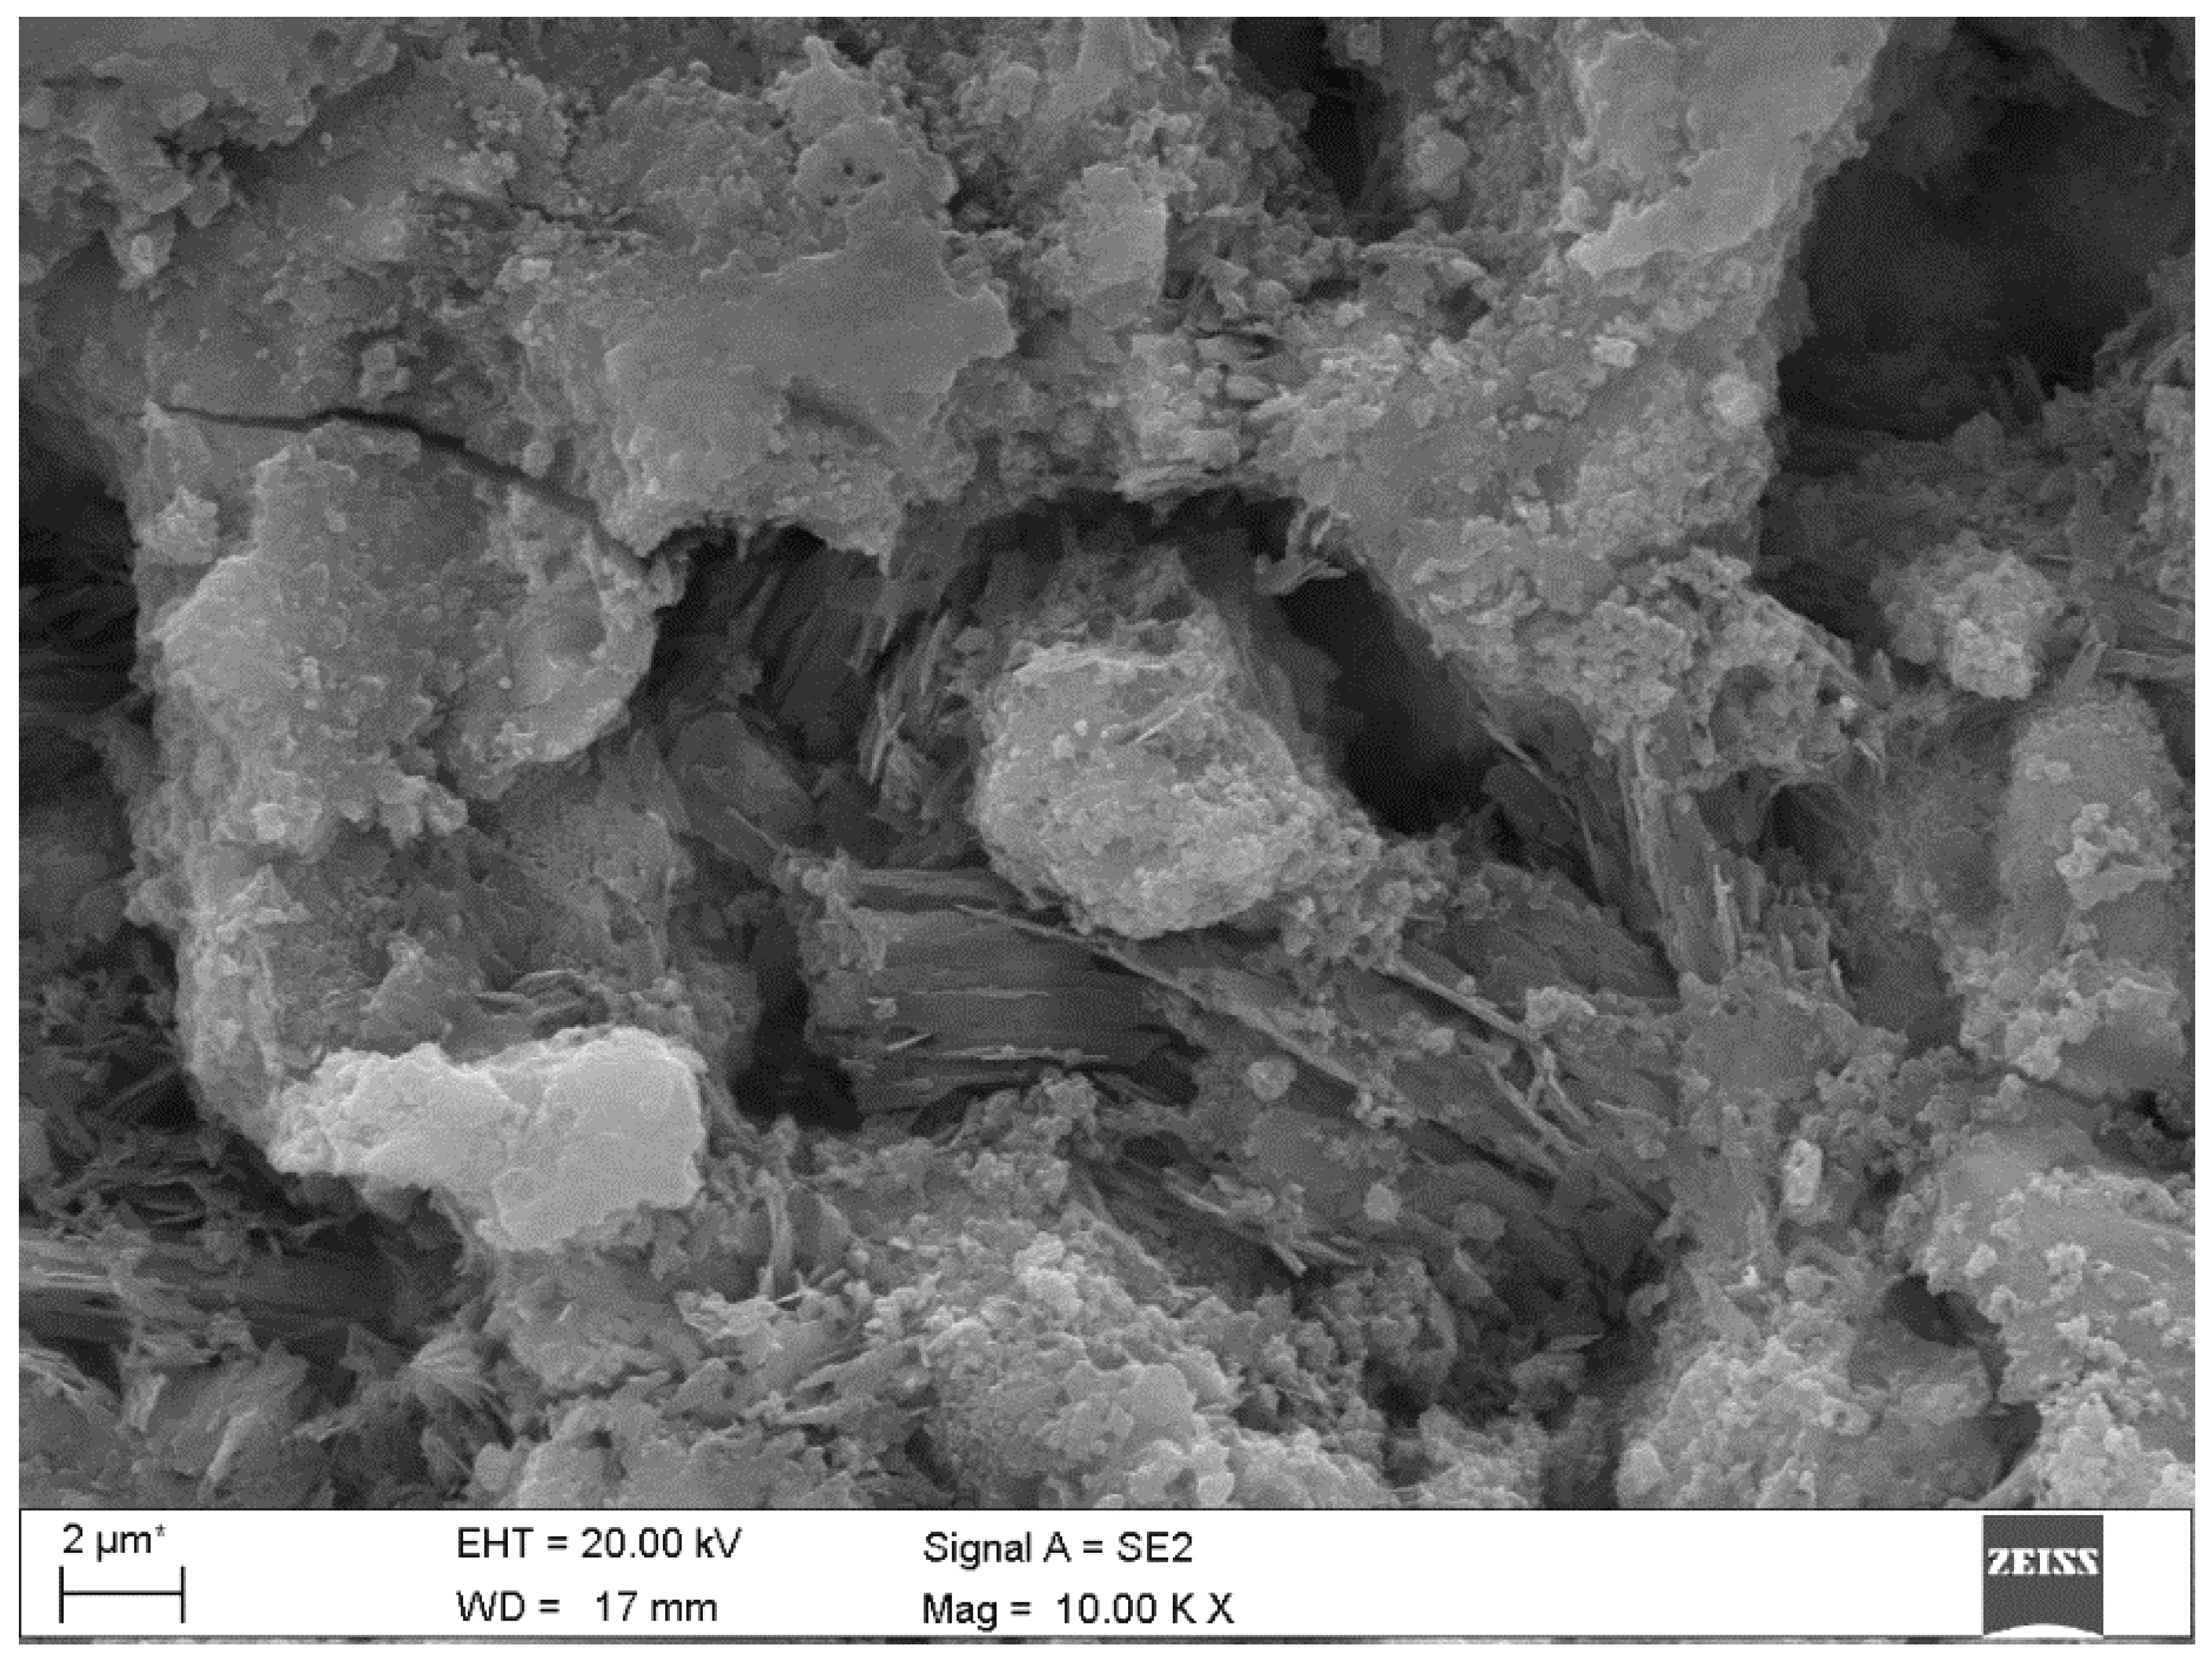
- SEM observations
2.2. Modeling
2.2.1. General Information on the Performed Geochemical Simulations
- Software and model used
- Input data
- -
- mineralogical composition of the cement sample, treated as a set of minerals that are reactants in kinetic reactions;
- -
- kinetic reaction rates and the specific surface areas of individual minerals;
- -
- chemical composition of pore waters;
- -
- sample porosity;
- -
- chemical composition of the solution saturated with NH4Cl).
- Reaction kinetics parameters
- Thermodynamic database
- Compositions of the pore solution and a saturated solution of NH4Cl
2.2.2. One-Dimensional Model of Transport and Reaction
- Model assumptions
- 1
- the cement sample is simulated in a cuboid domain, with dimensions of 50 by 10 mm by 10 mm, appropriate for tracing the phenomena occurring on a local scale. The domain consists of 25 identical cells, which allows a simulation of the transport and reactions taking place in the sample with sufficient precision; this also ensures optimal computational time. The transport of the solution is only related to its diffusion into the interior of the sample;
- 2
- physical properties of the simulated medium:diffusion coefficient—1·10−6 cm2/sporosity—19.84%thermal conductivity—4·10−3 cal/cm·s·°C (1.675 W/m·K)longitudinal dispersion—0.1 cm;
- 3
- 4
- The porosity of the system results from the ratio between the volume of the solution and the sum of the volume of the solution and the rock matrix;
- 5
- The experiment time is 40 days.
3. Results
3.1. Laboratory Examination
3.1.1. Examination of Not Degraded Hardened Cement Paste
- XRD of C.I.3
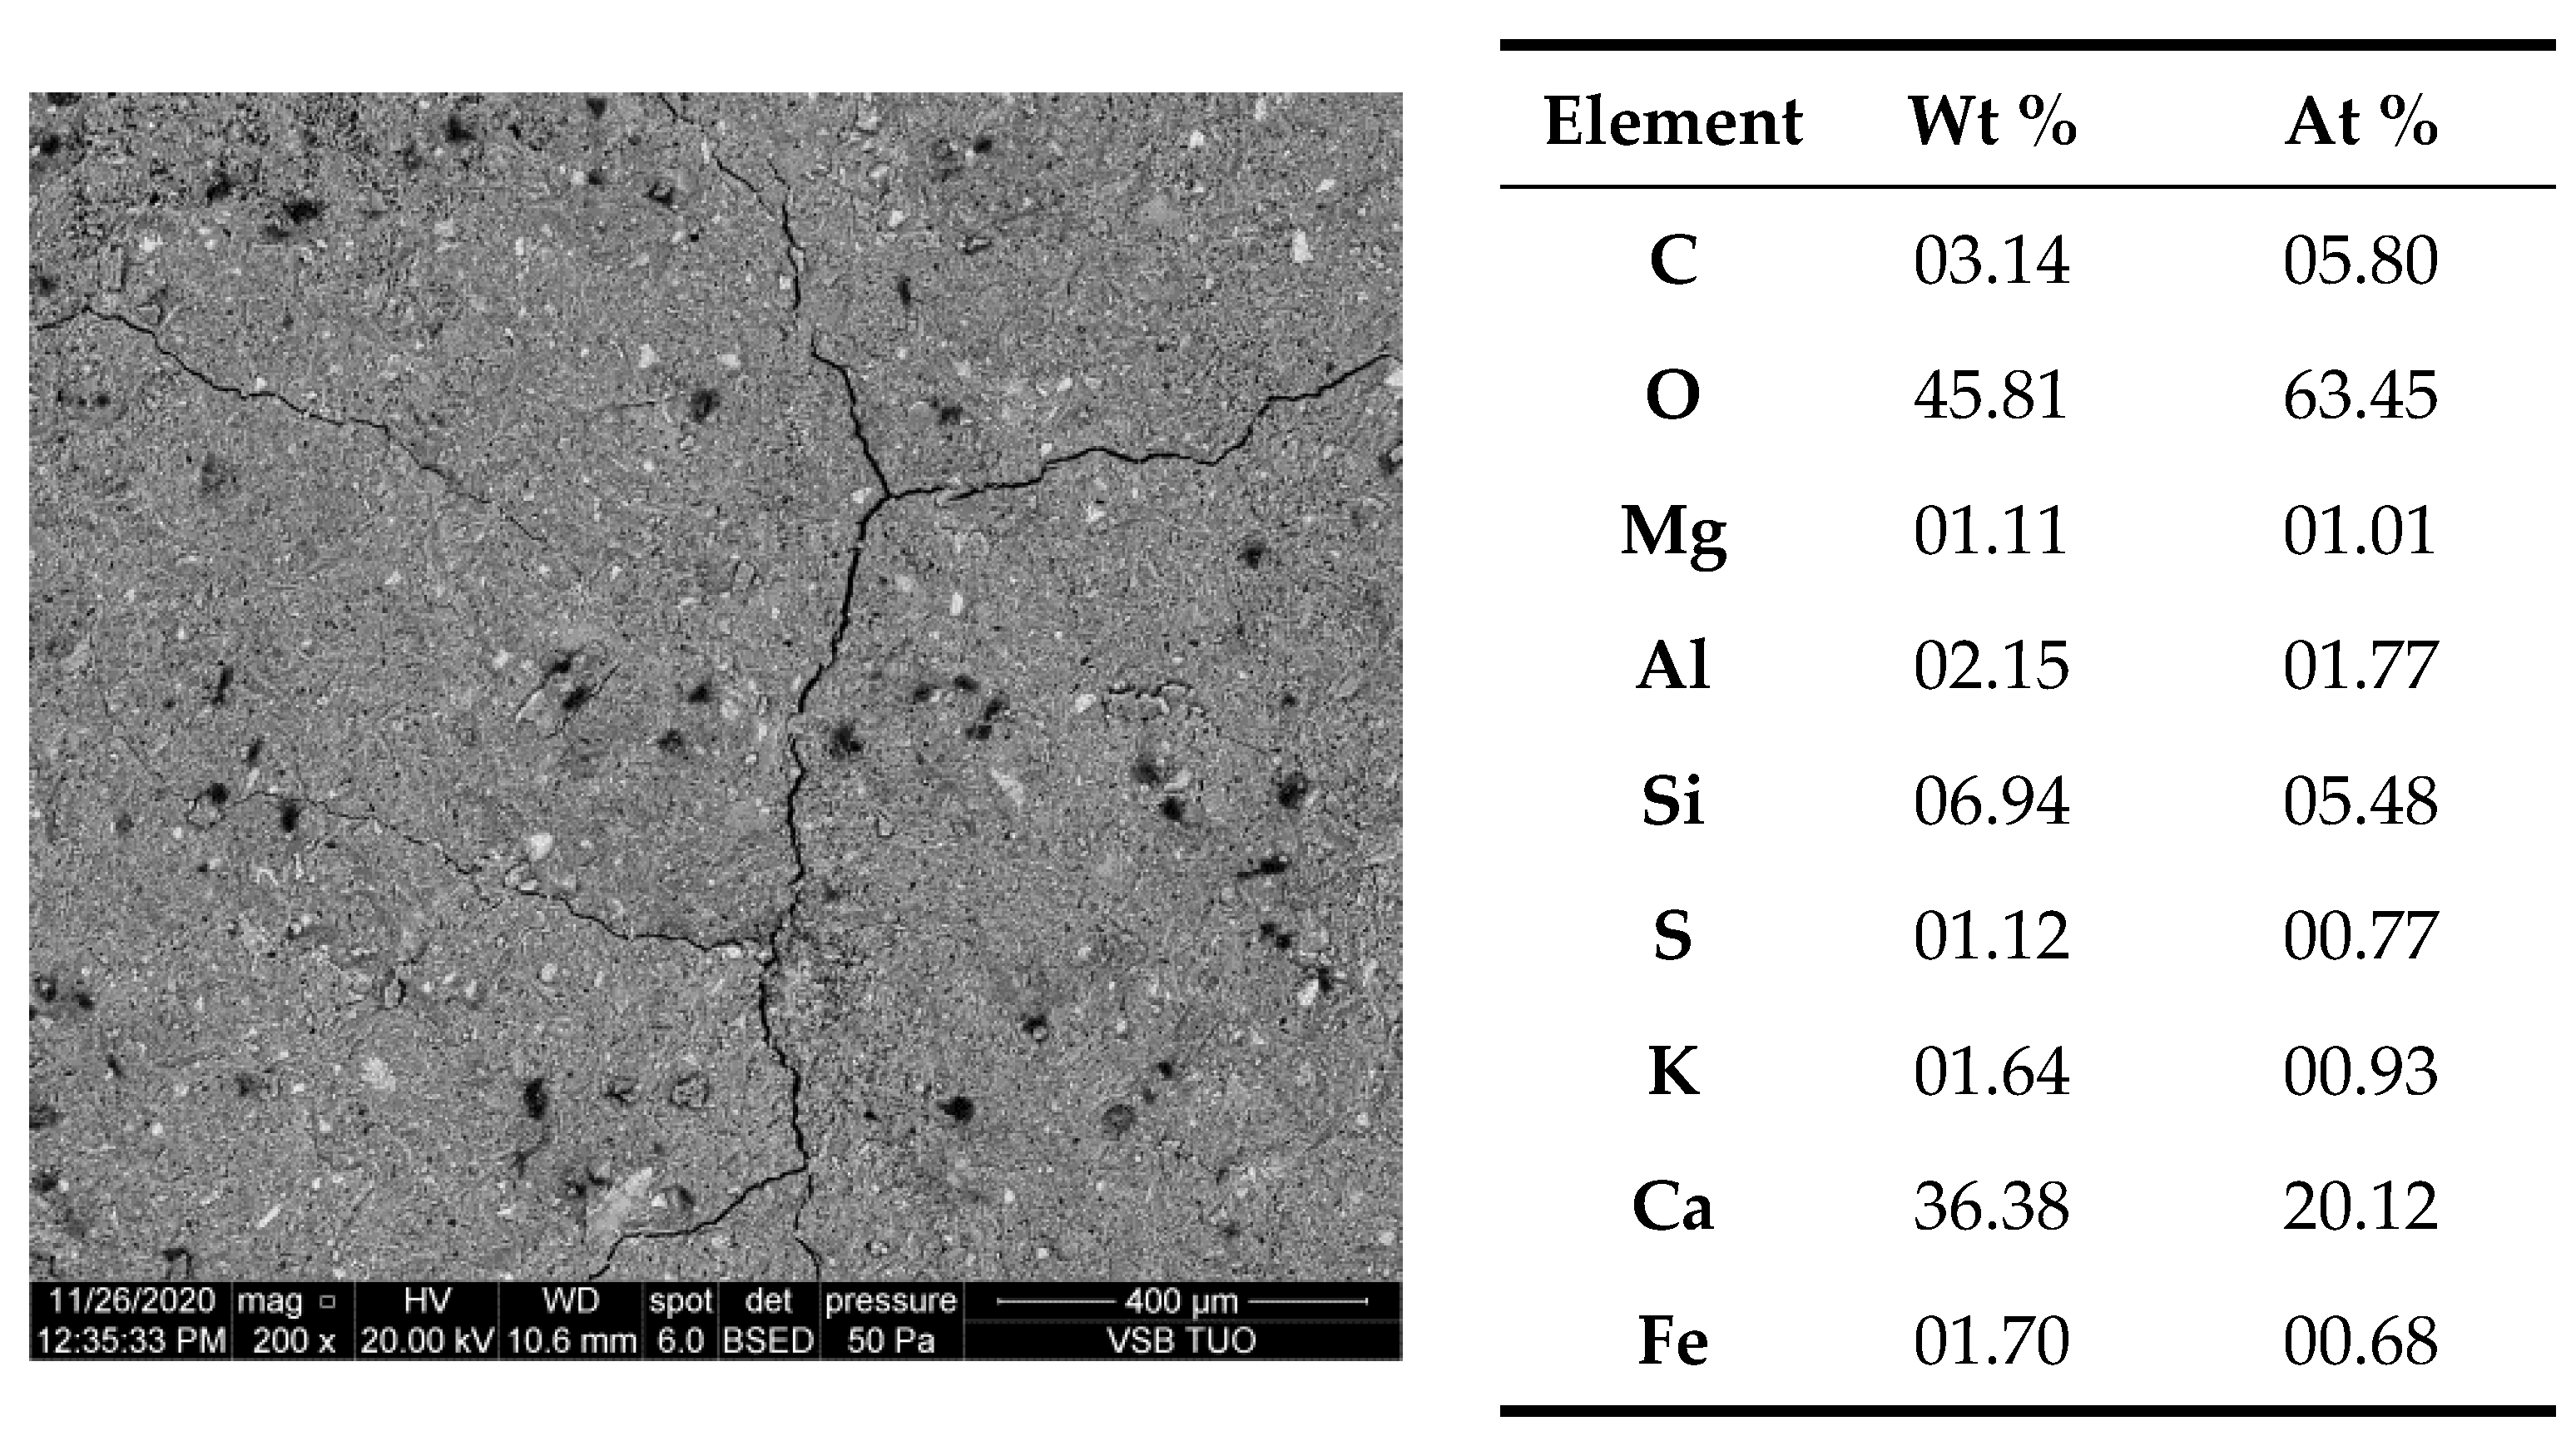
- Results of electron microscopy SEM and microanalyses EDS of the C.I.3 sample
- Porosity of hardened cement paste of C.I.3 before degradation
3.1.2. Examination of Degraded Hardened Cement Paste
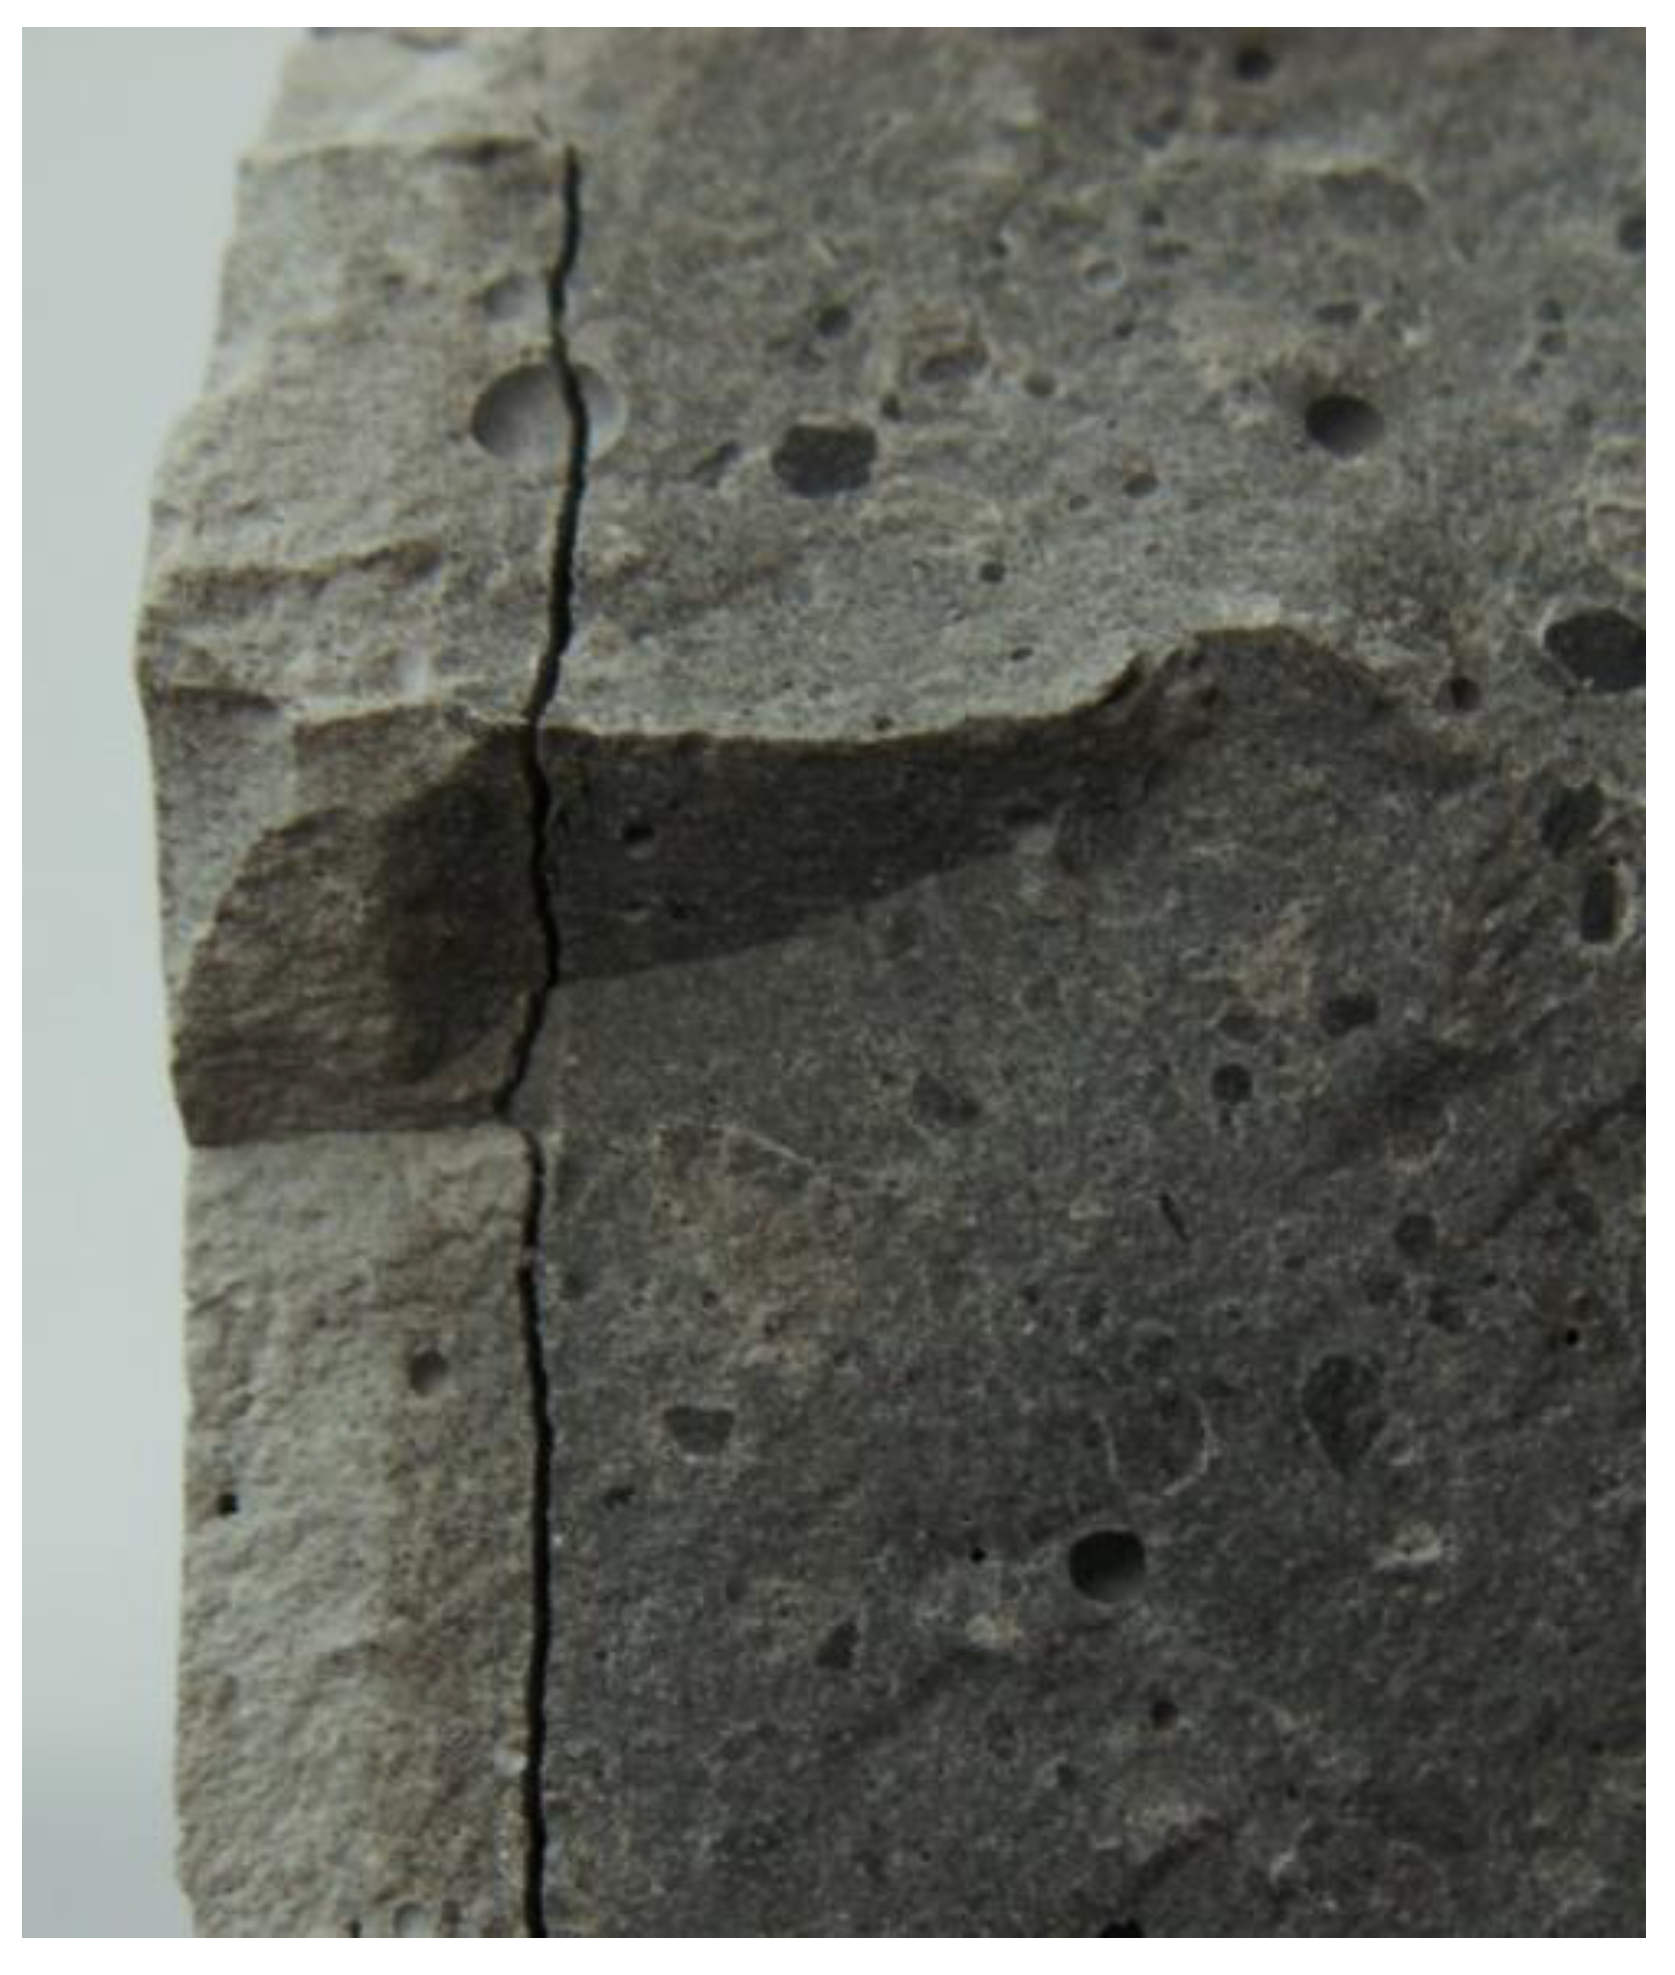
- Macroscopic observations
- Phases transformations
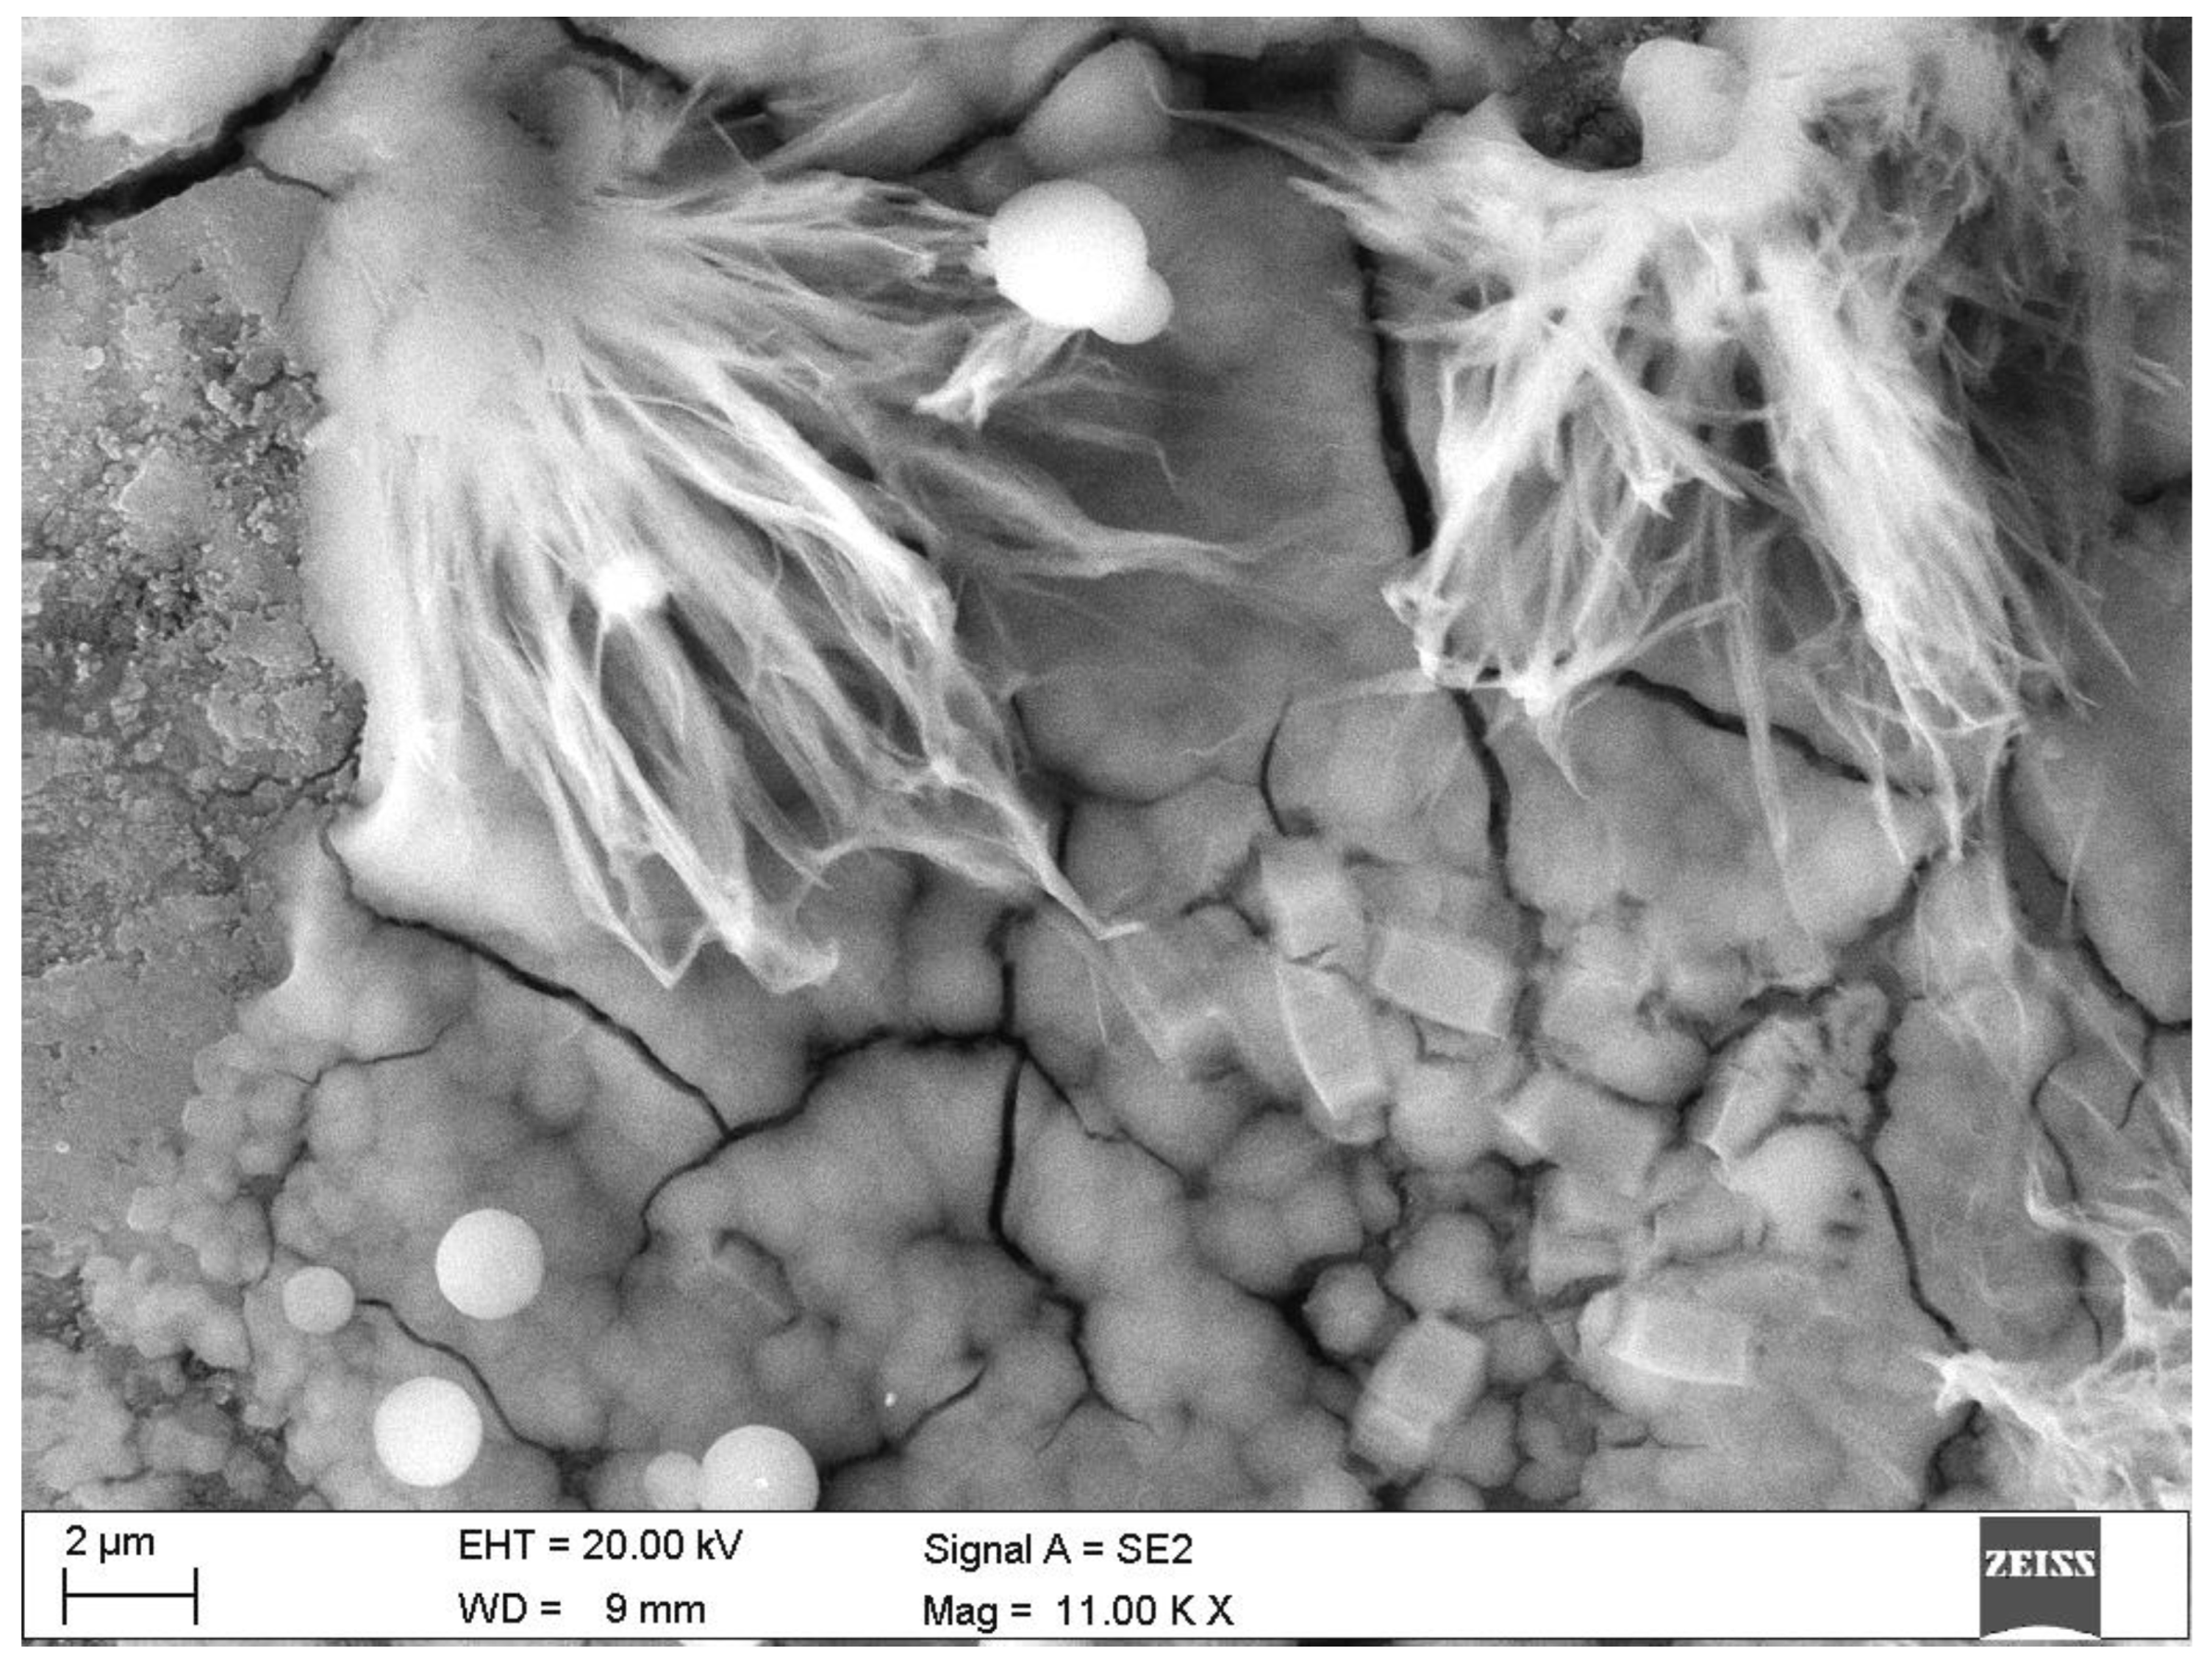
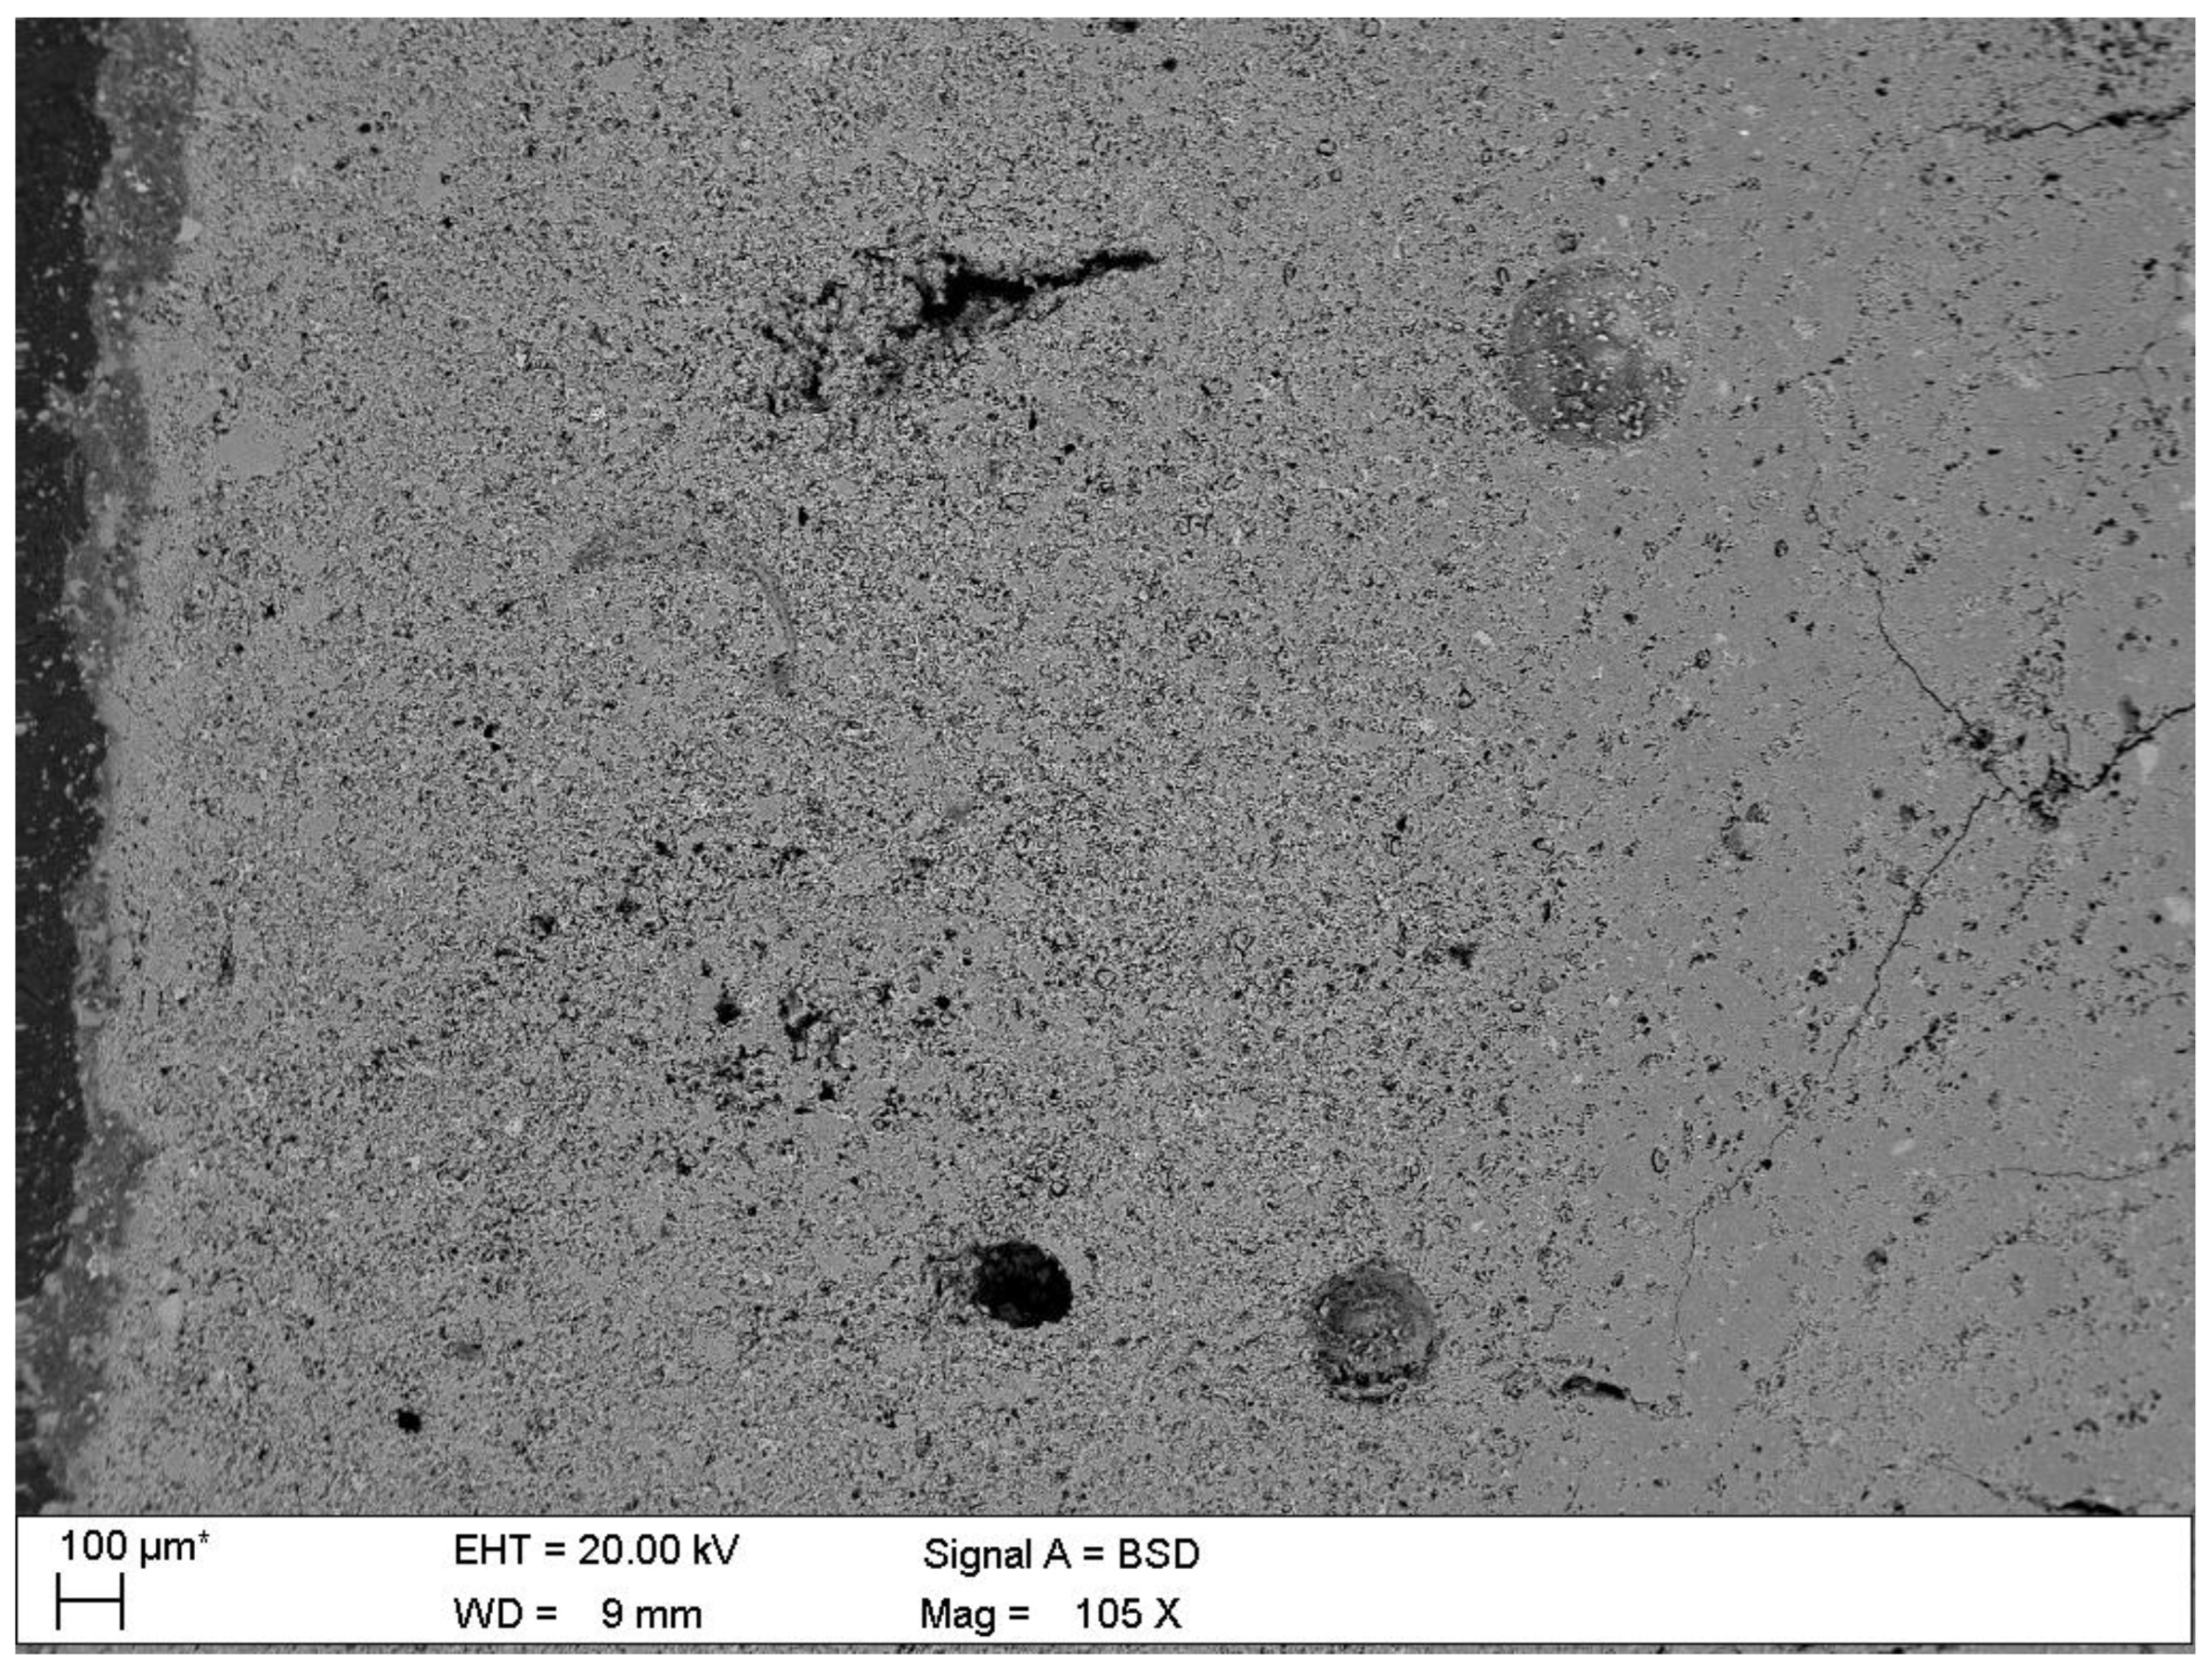
- Microscopic observations
- Porosity changes
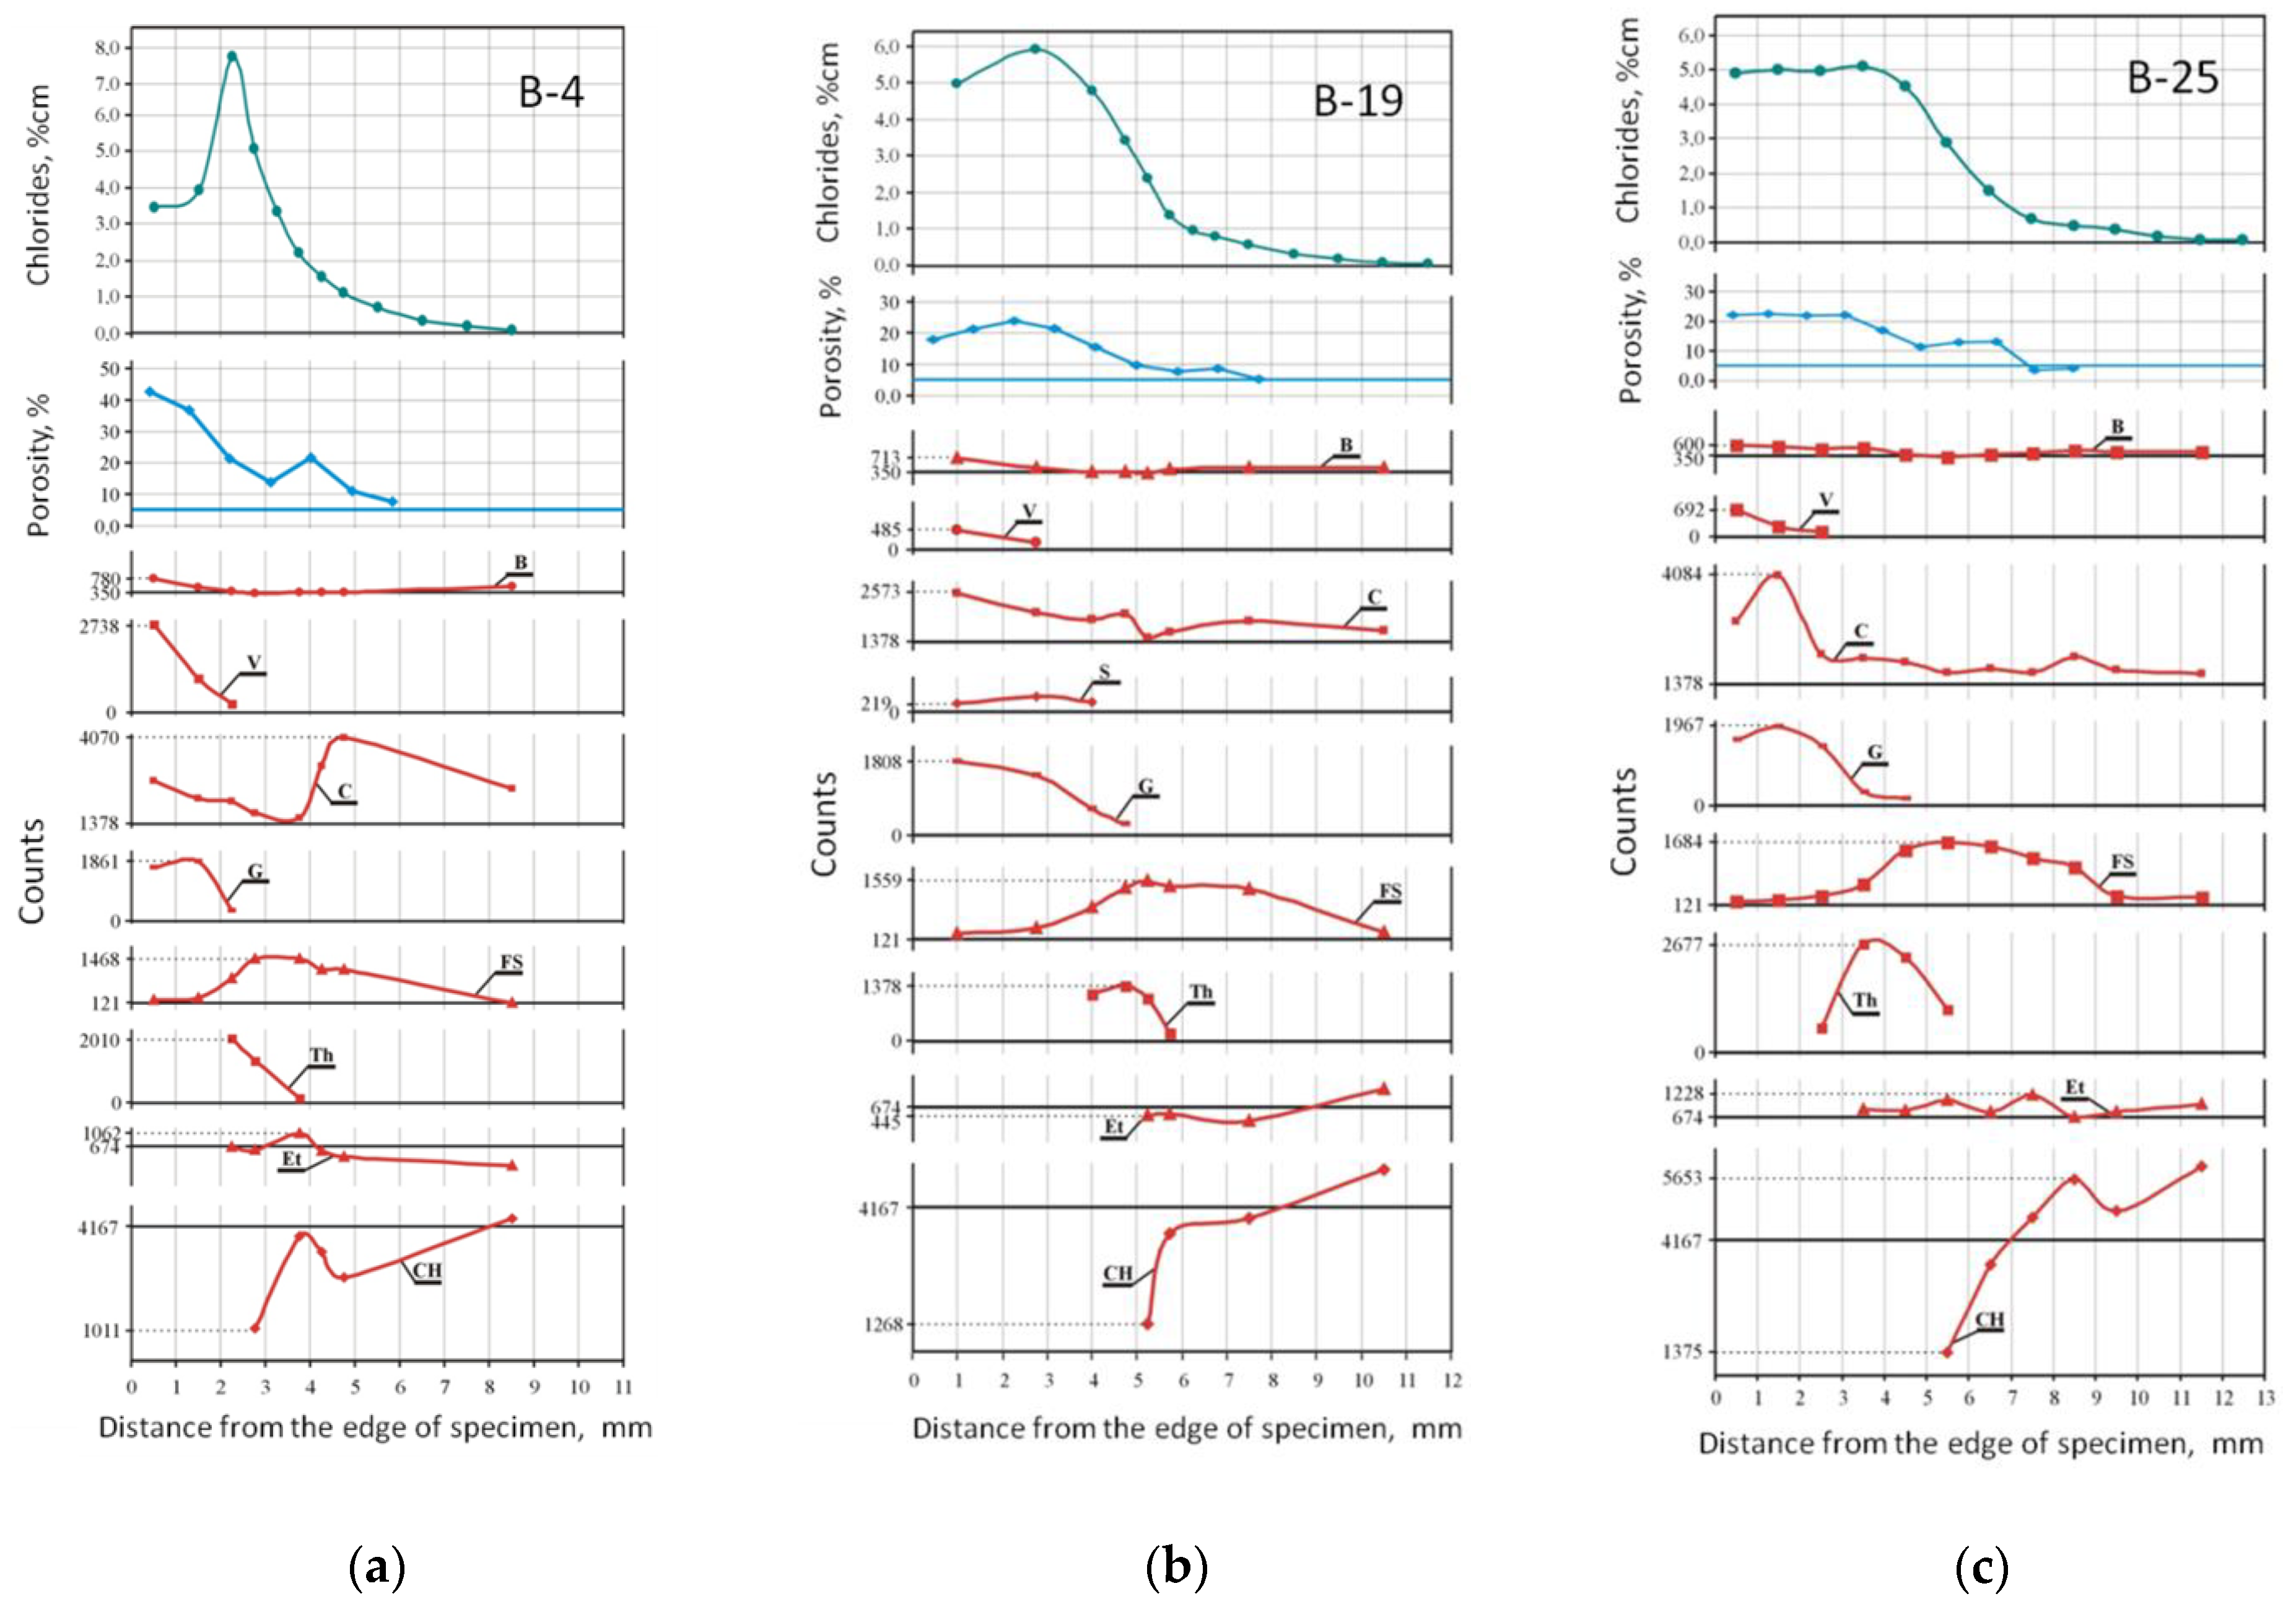
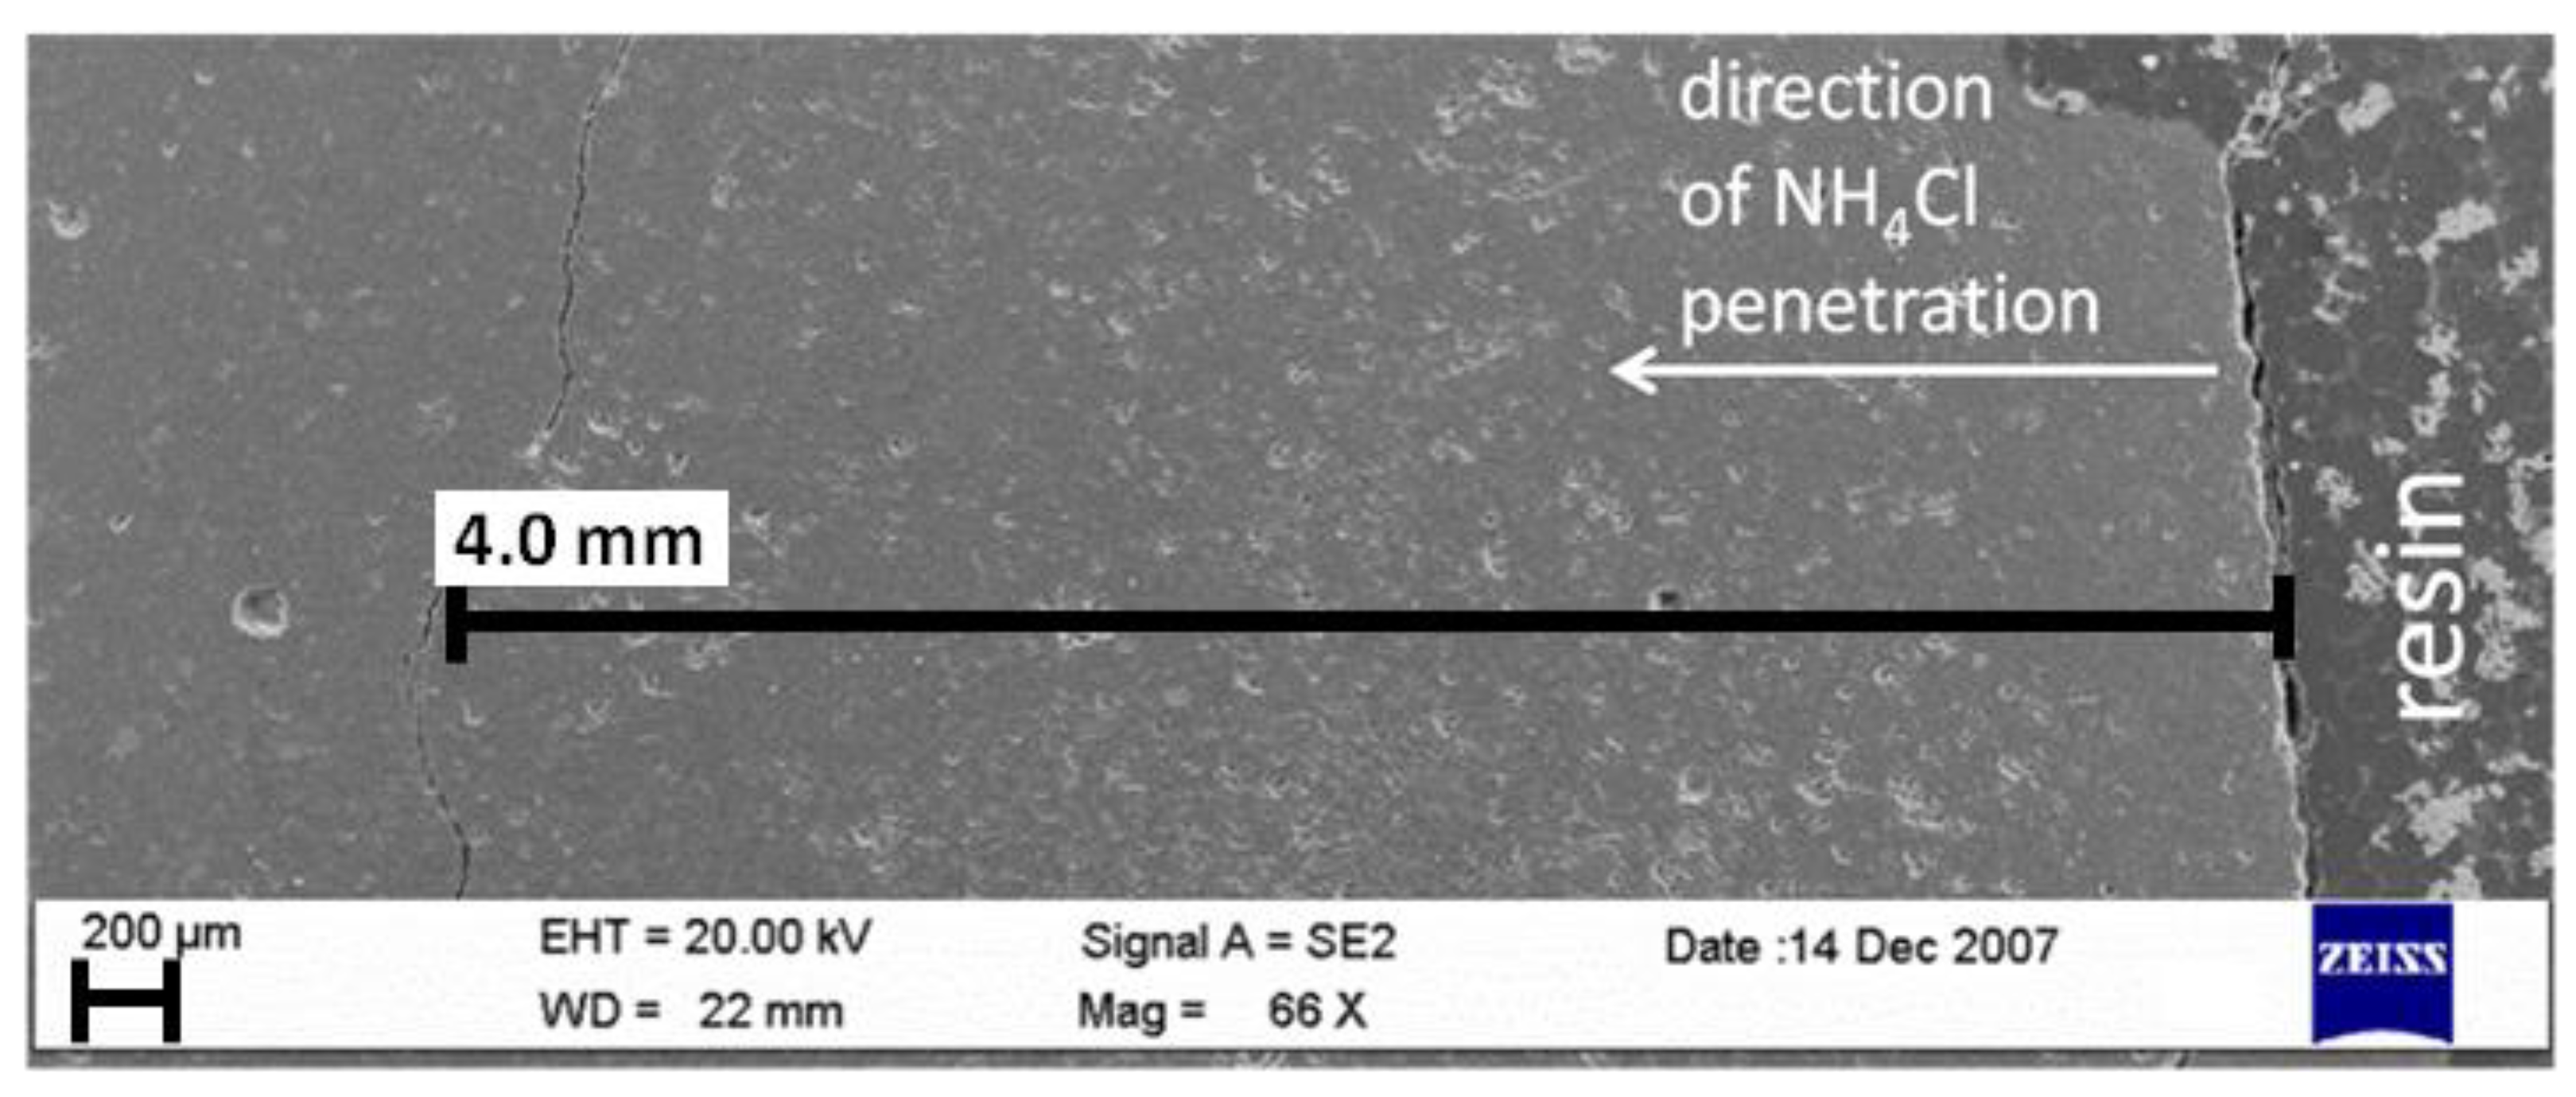
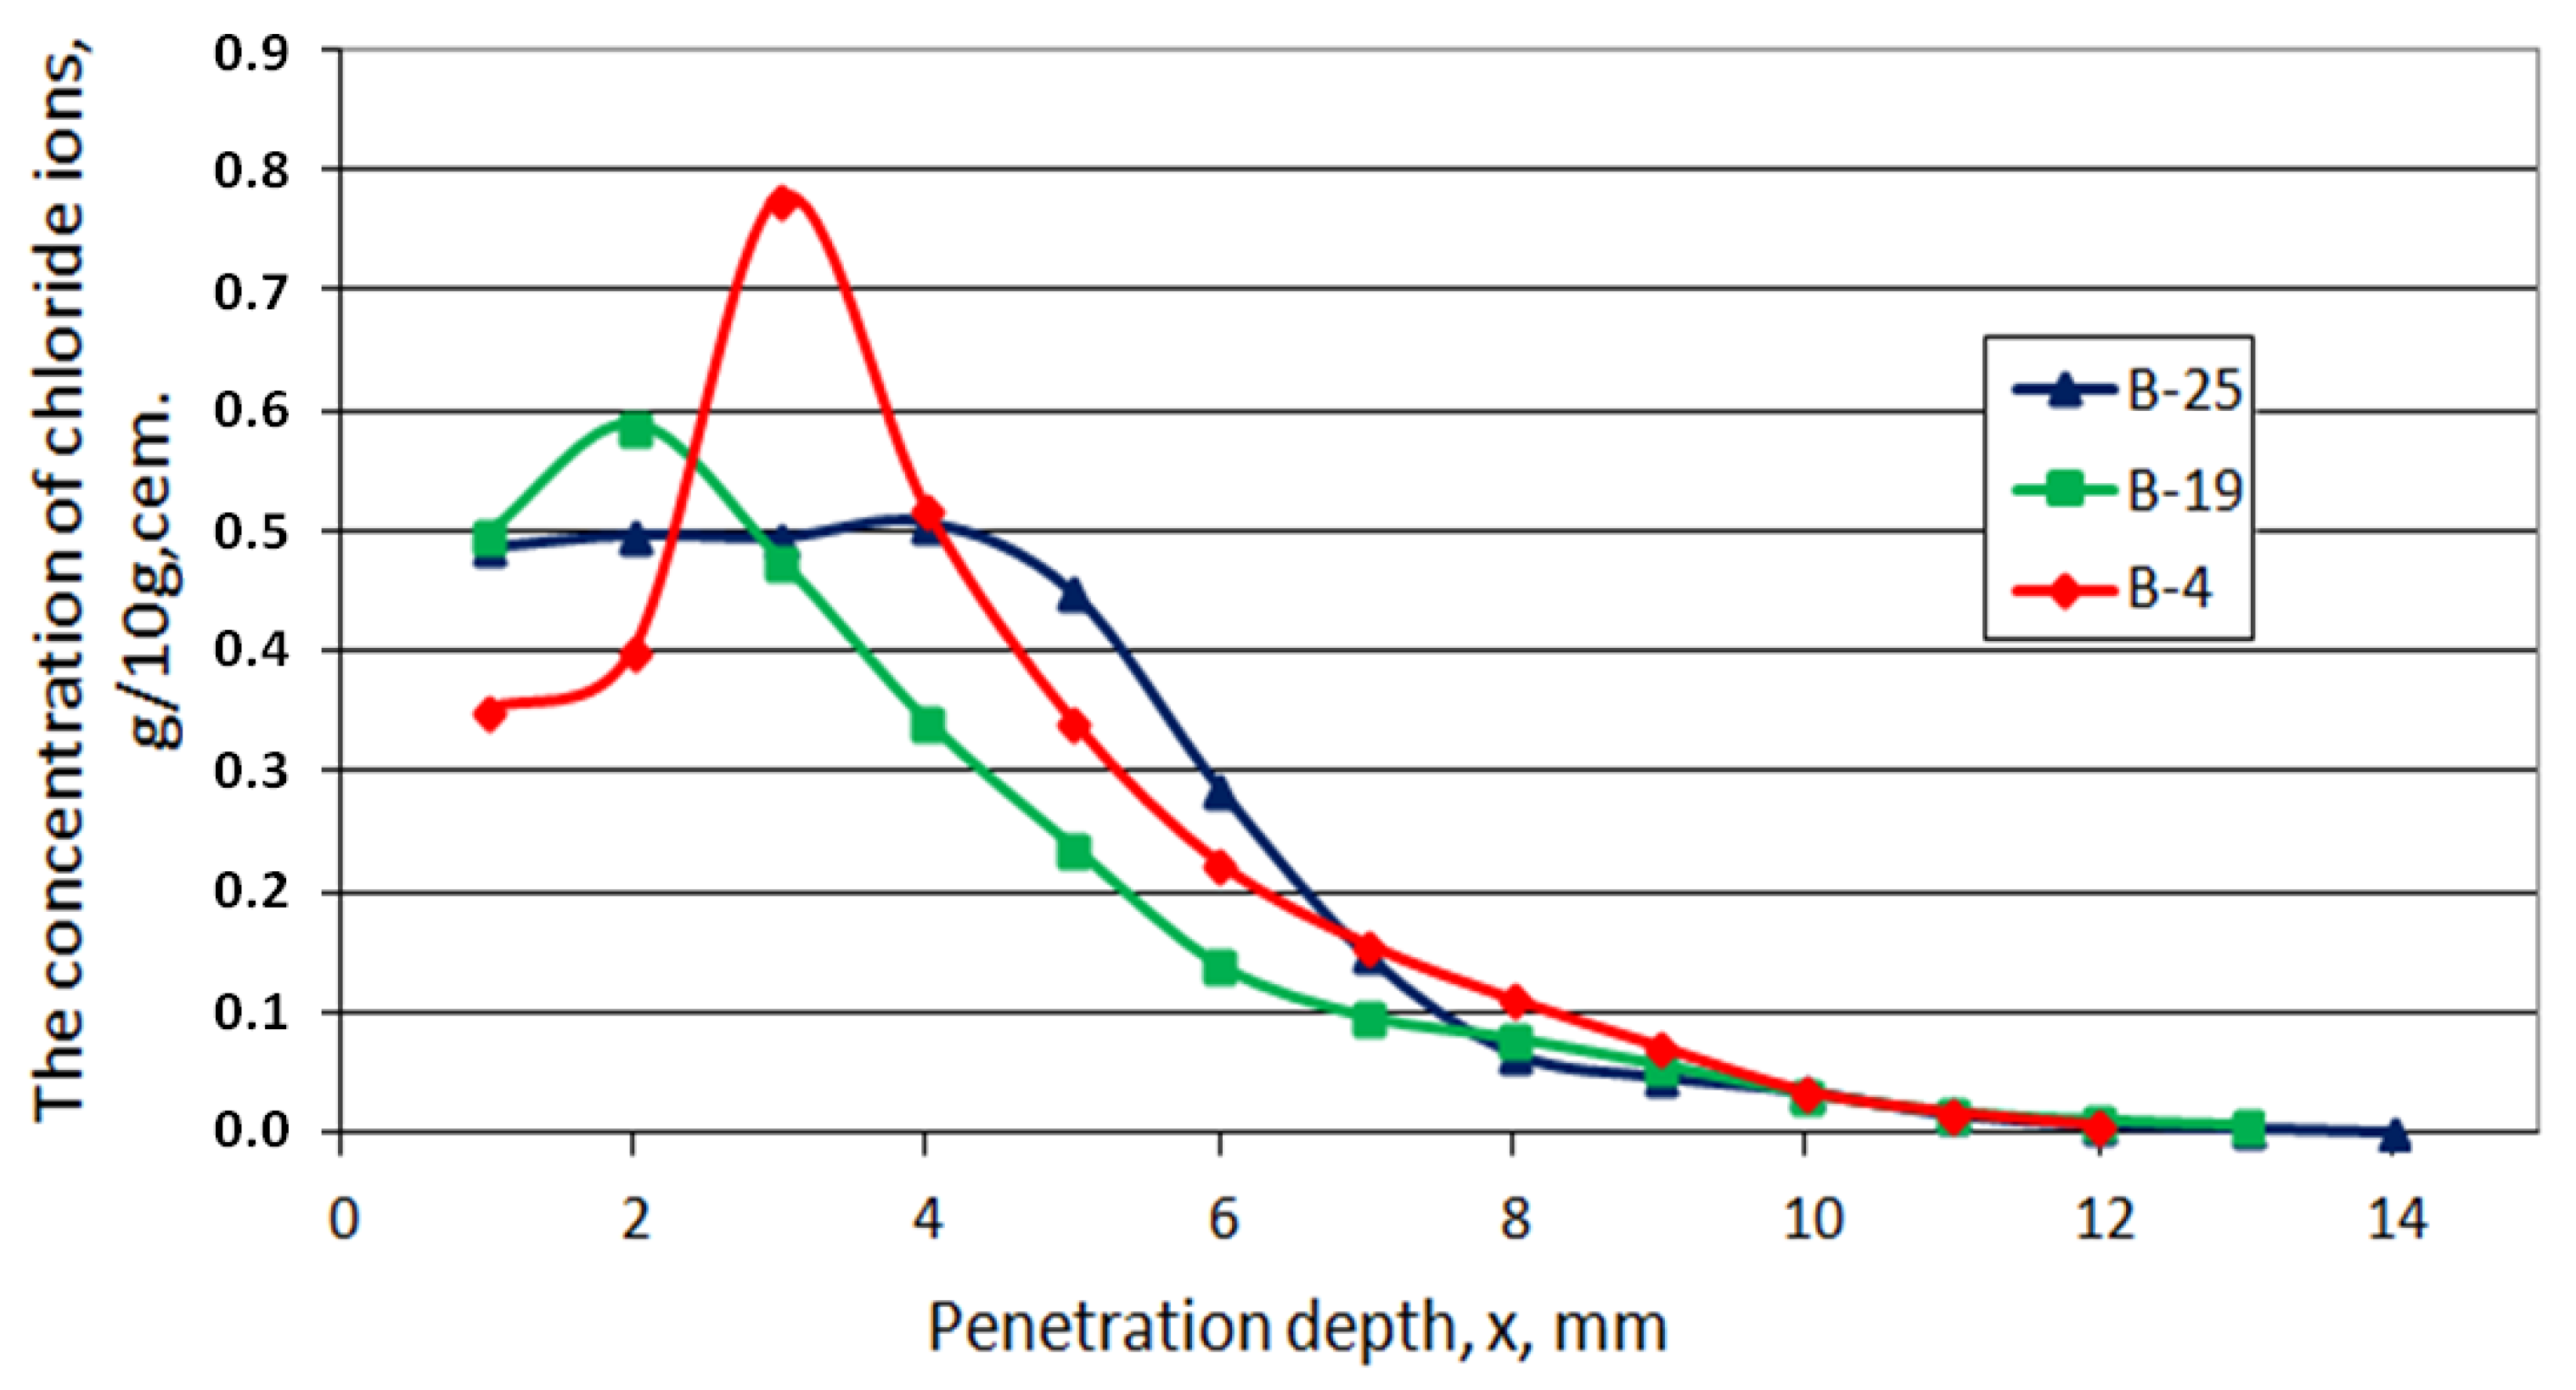
- Chlorides ingress
- Chlorides, porosity, phases—comparison
3.2. Modeling
- -
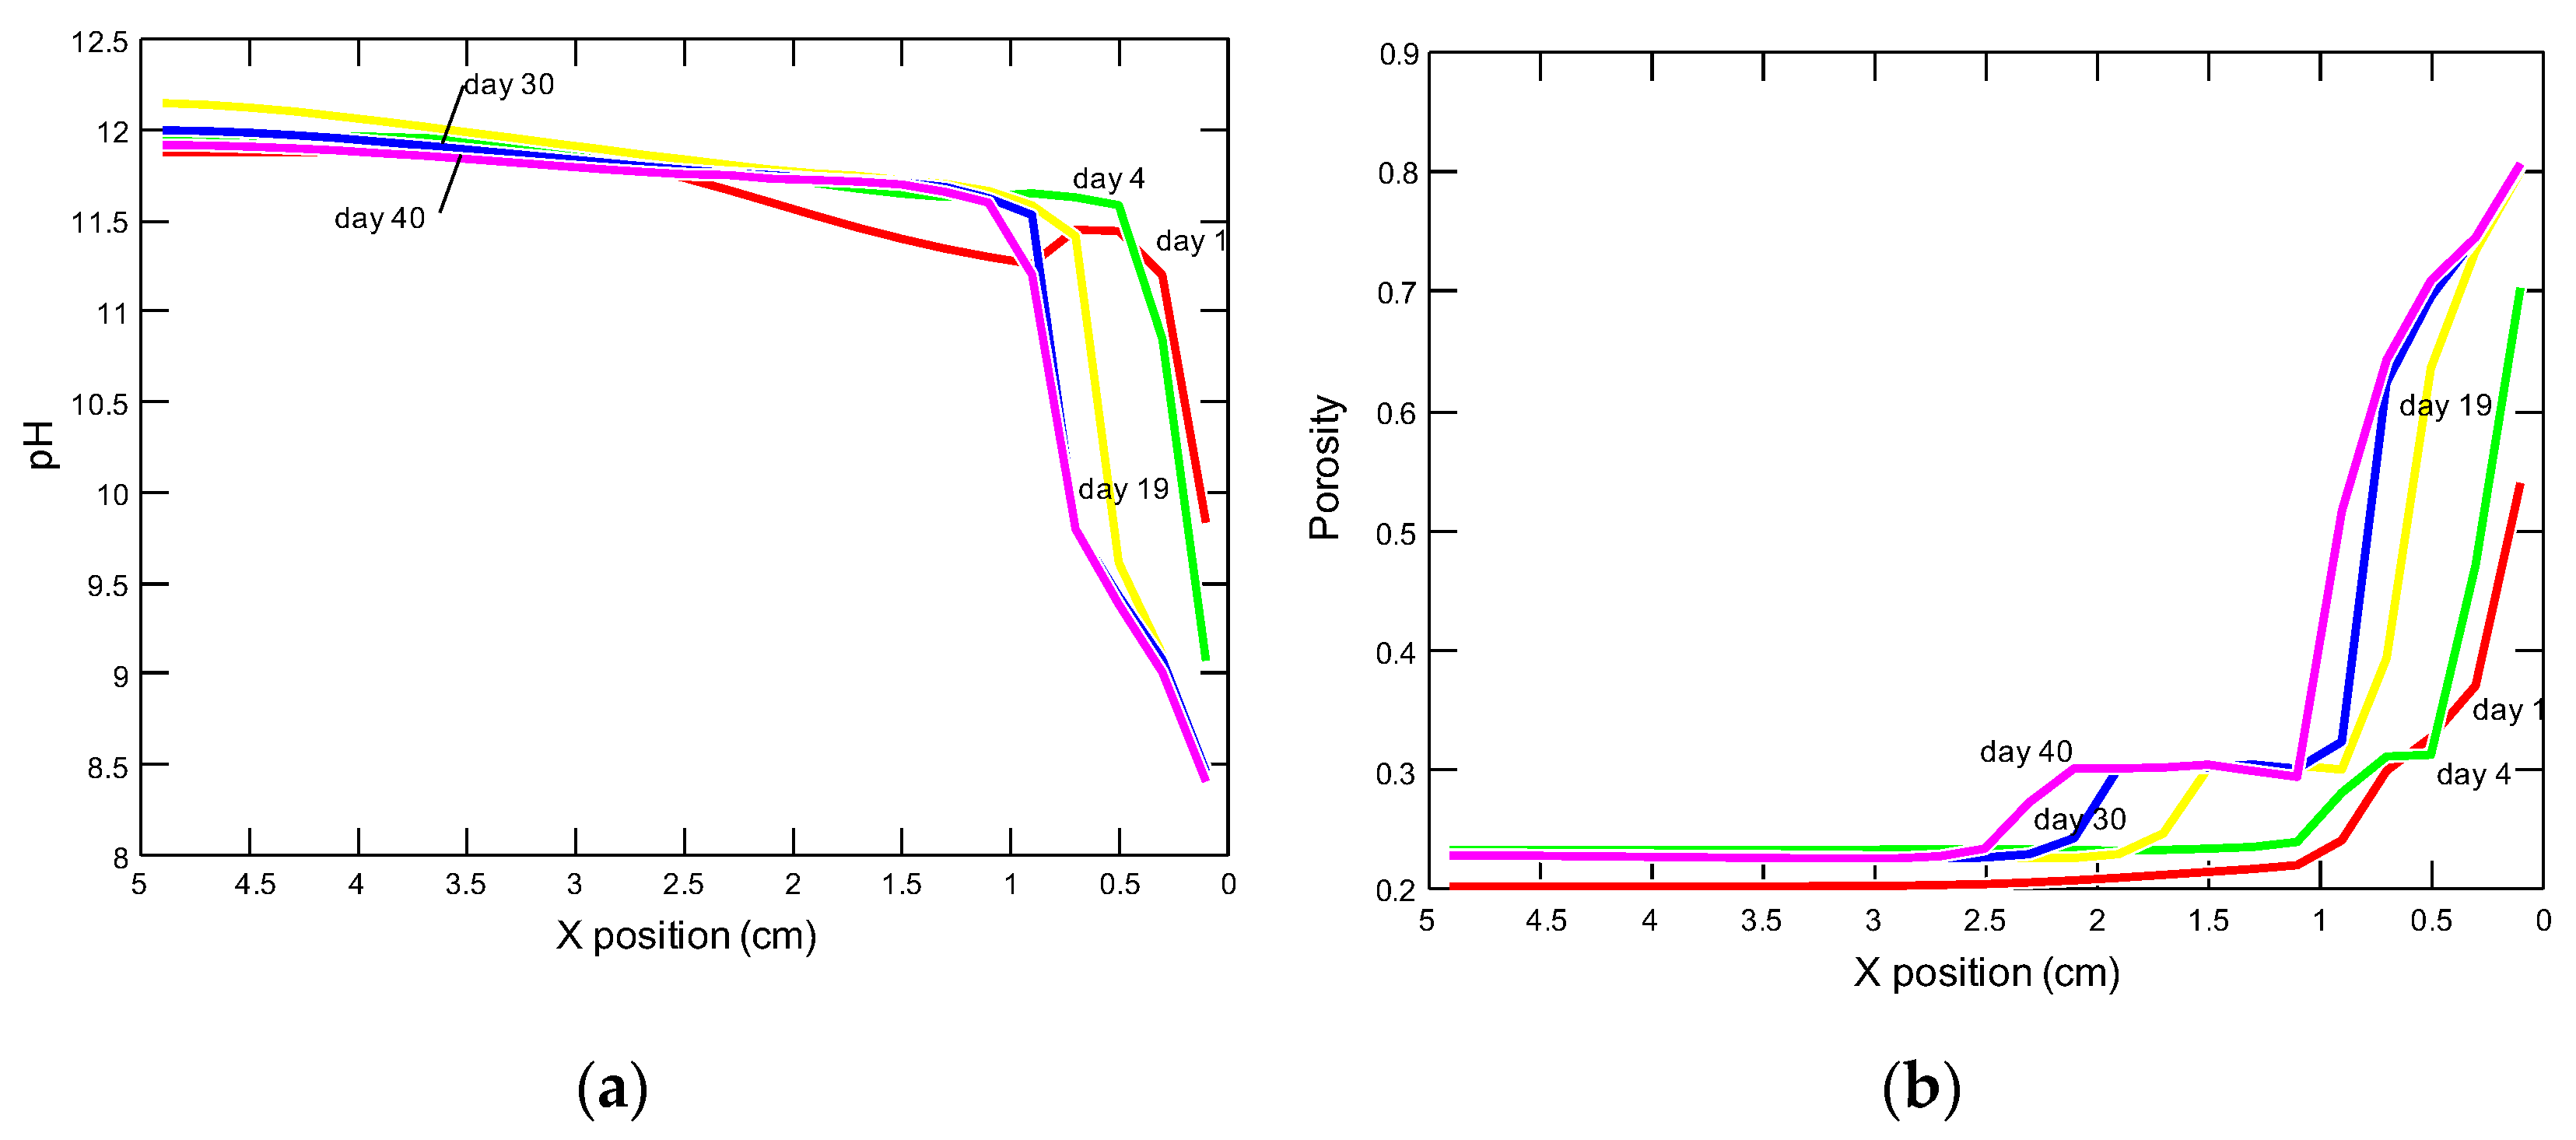
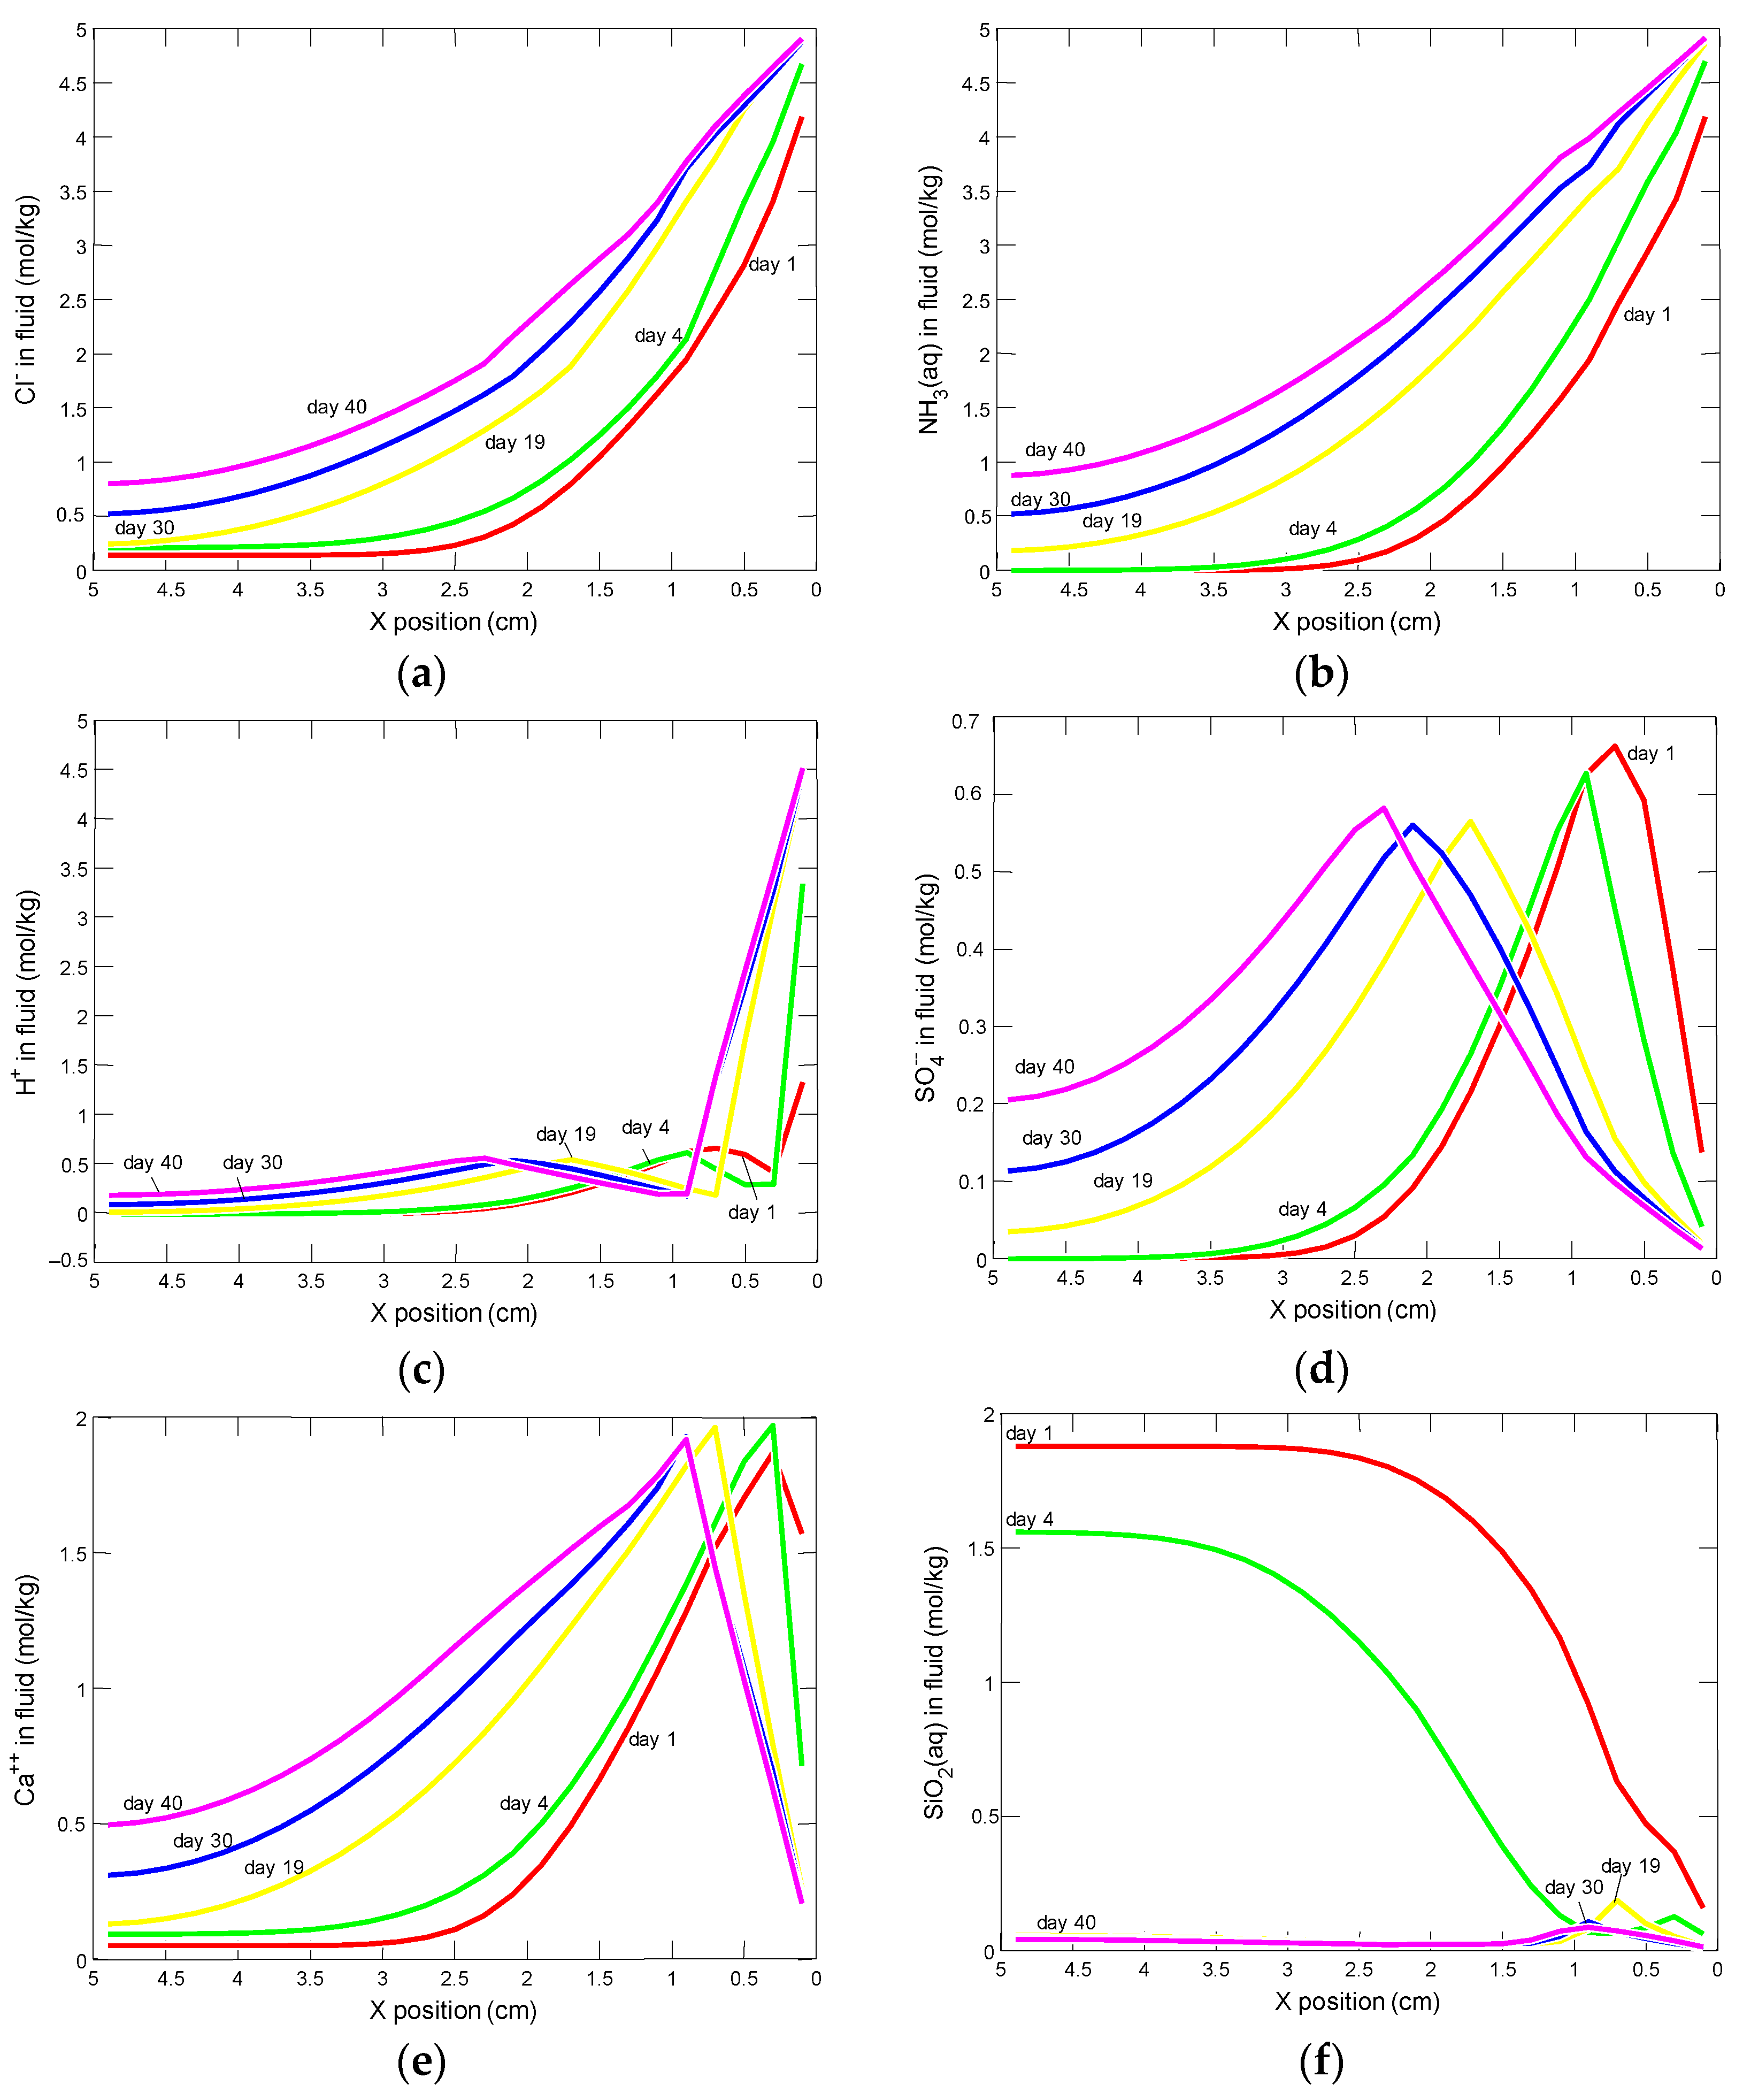
- changes in porosity, pH and concentrations of the pore solution components in the model domain after 1, 3, 5, 9, 30 and 40 days from the beginning of the experiment;
- -
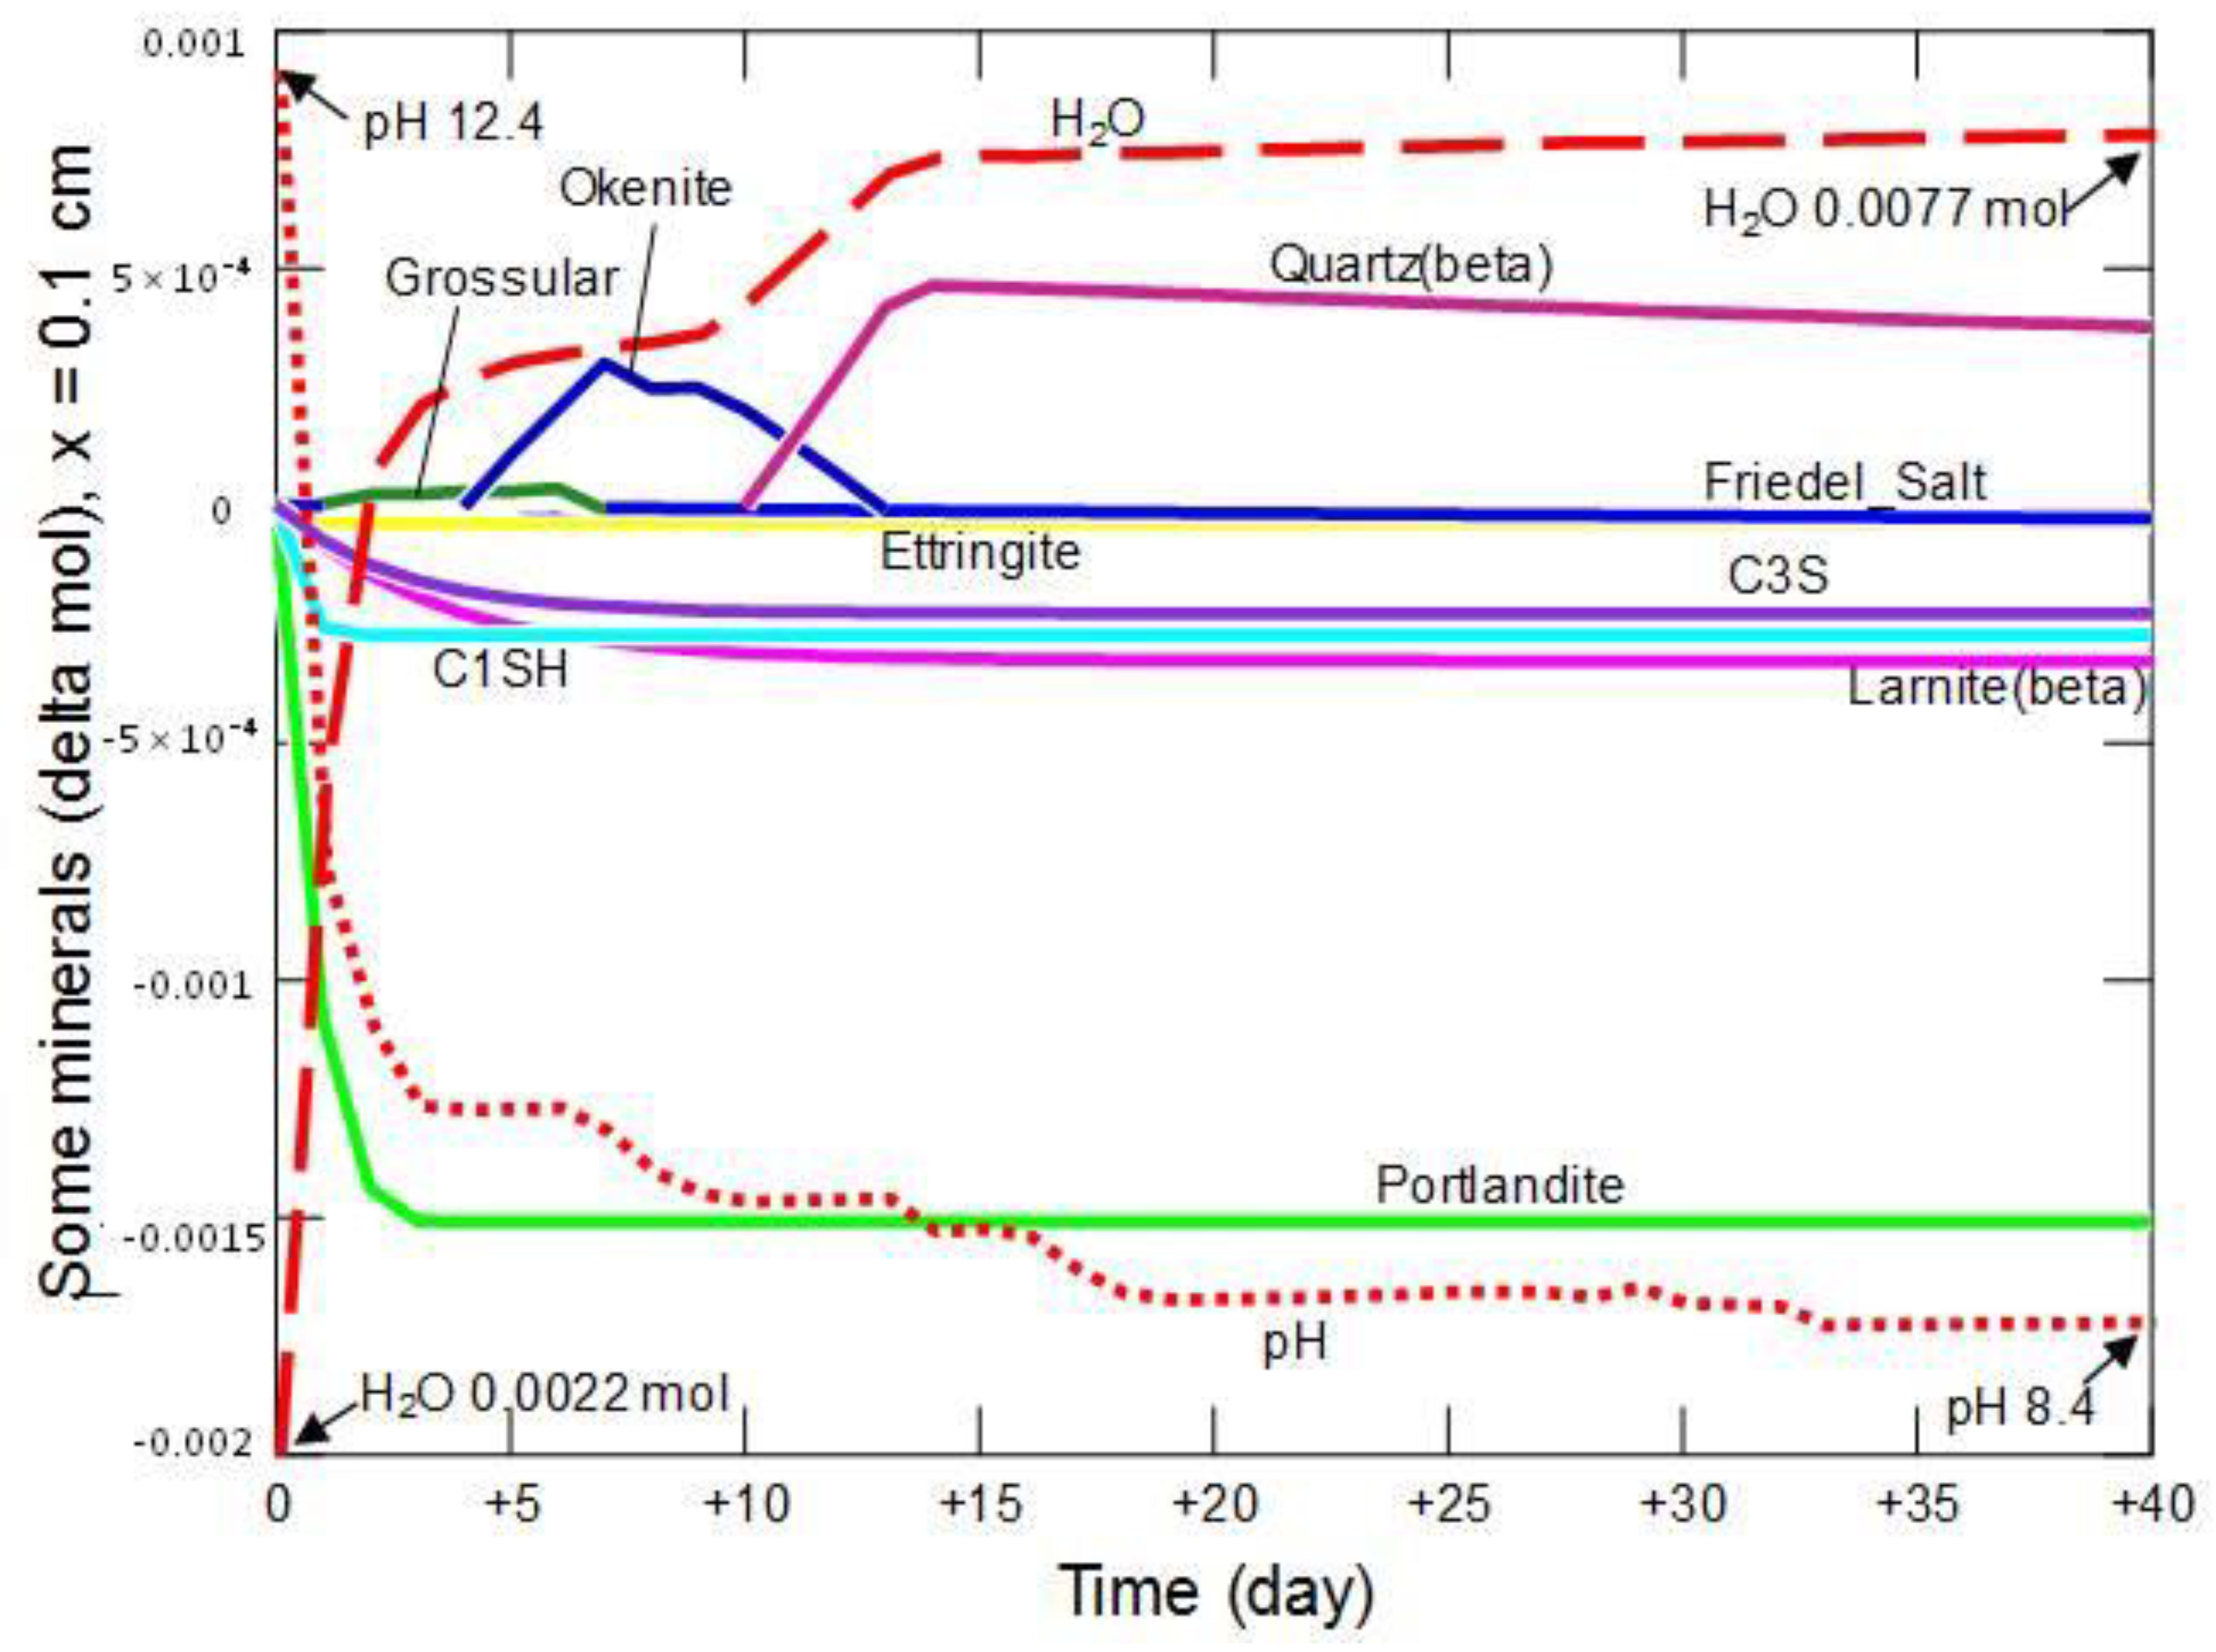
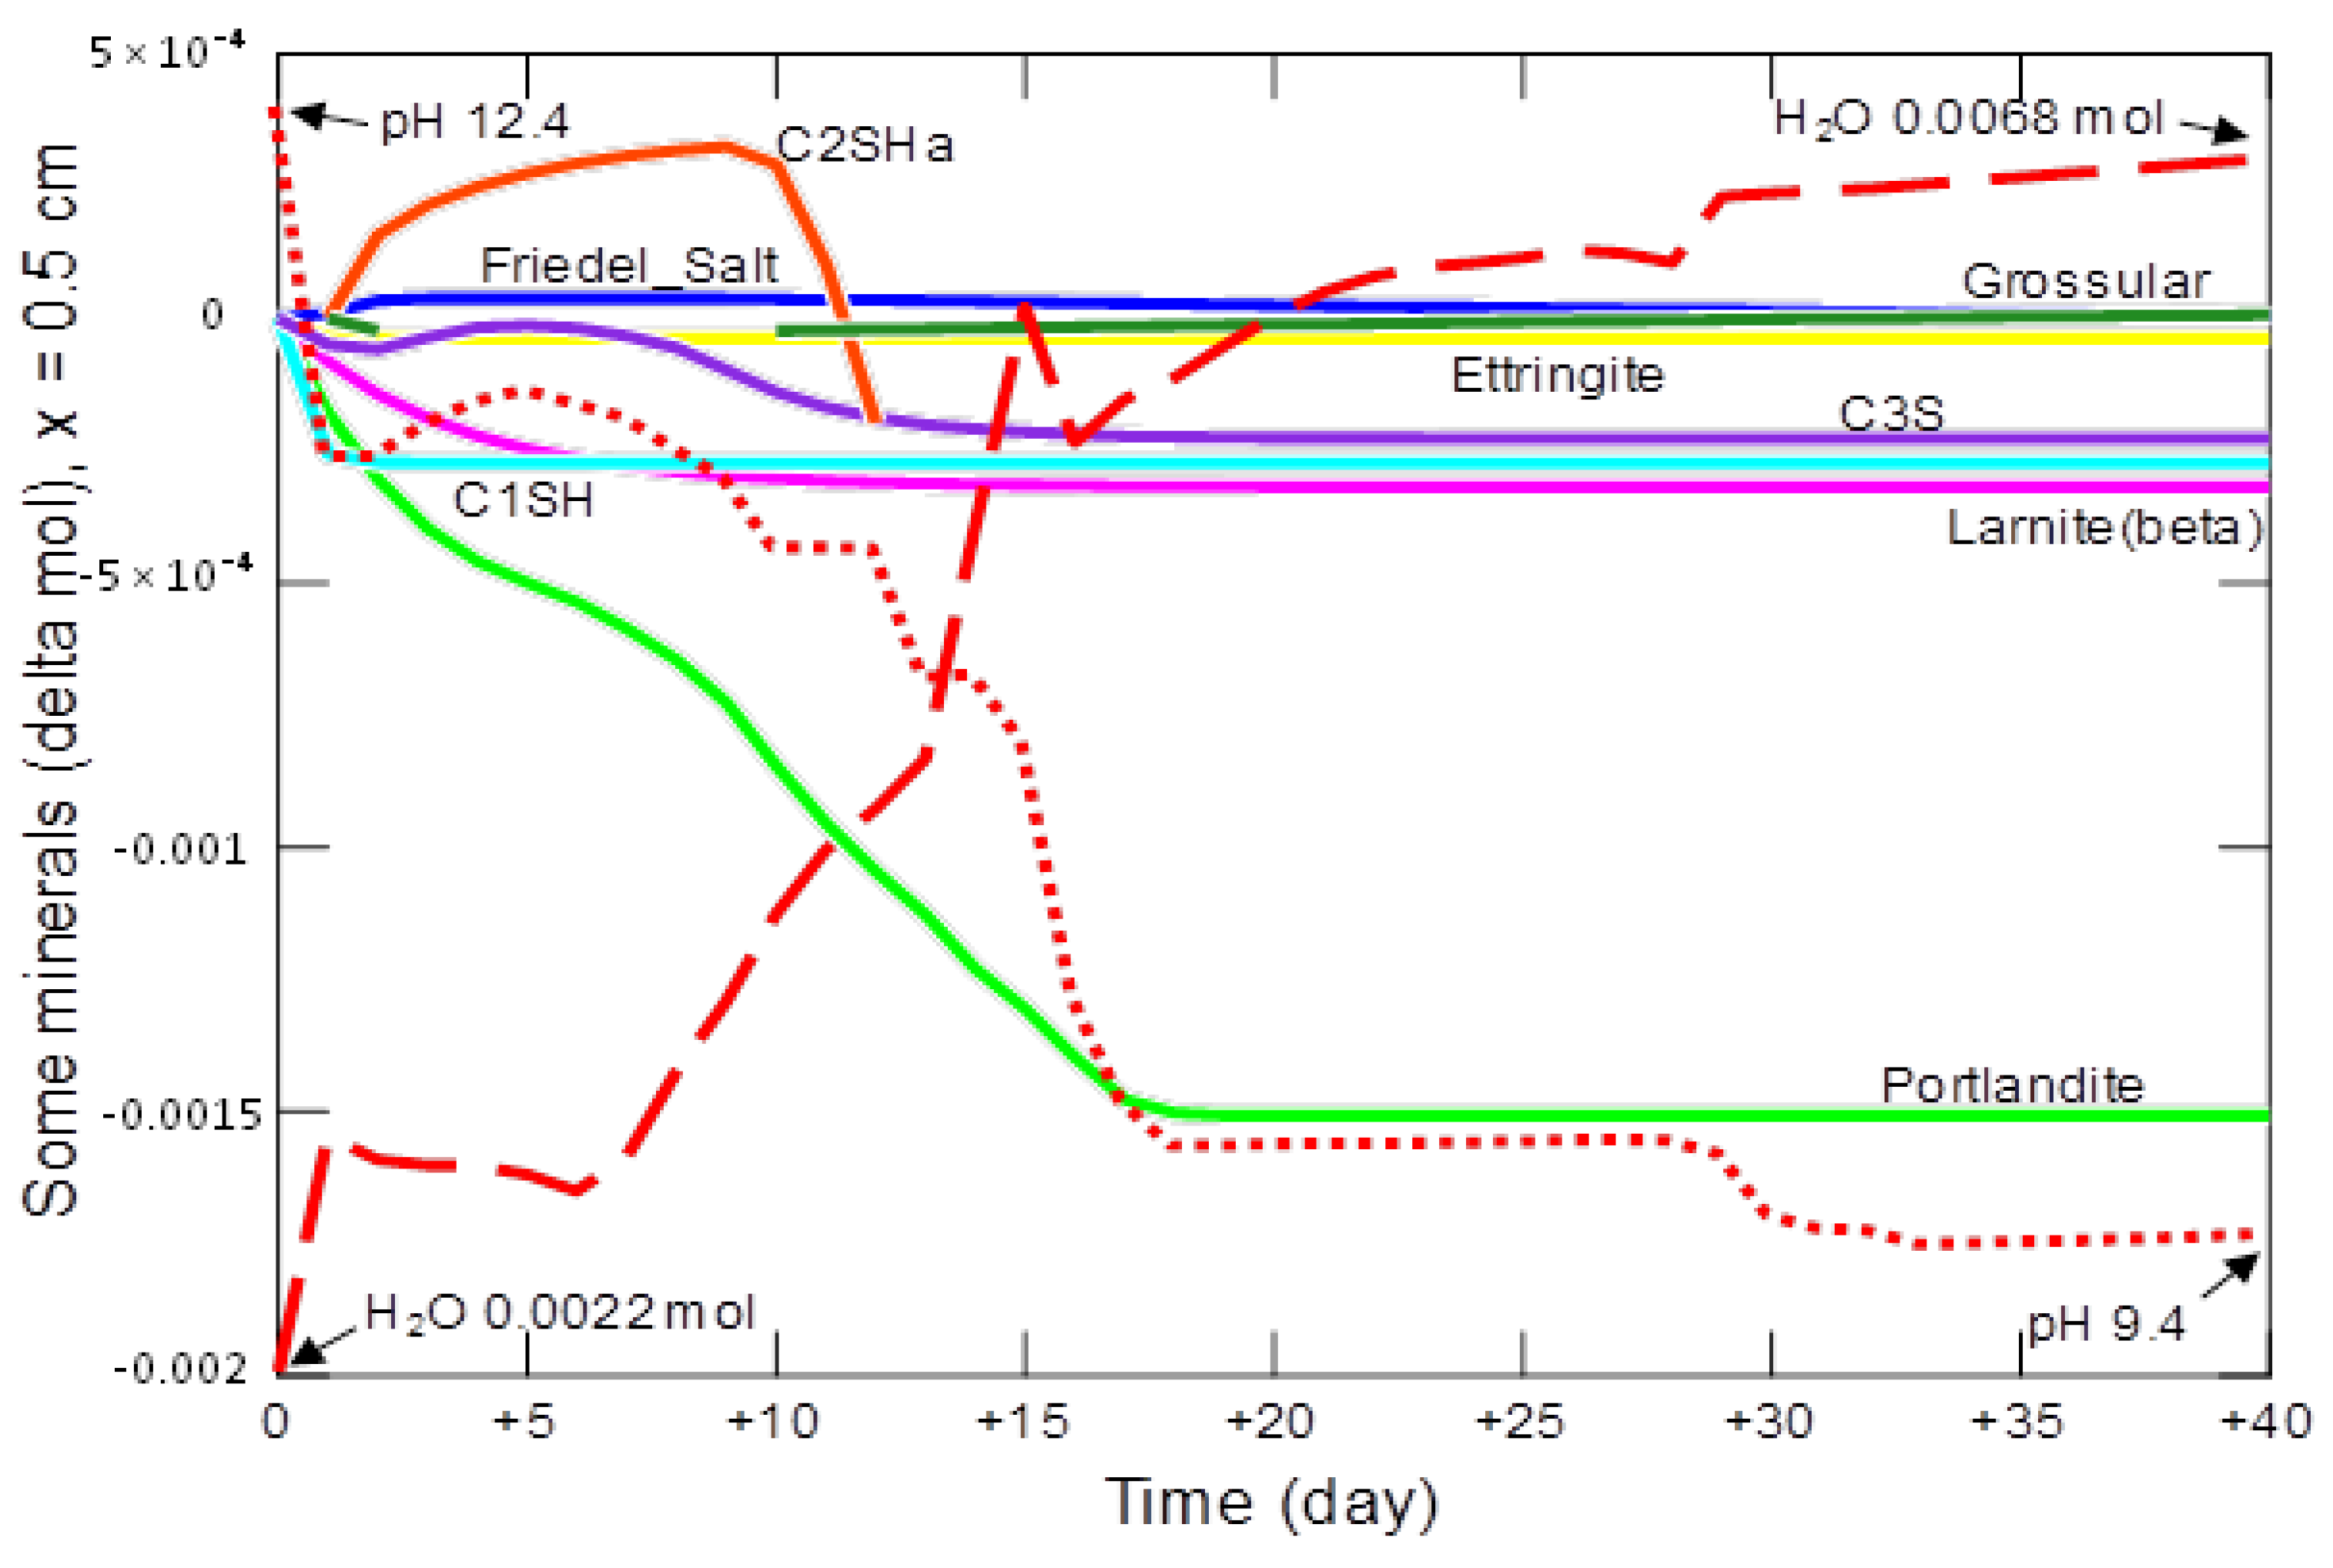
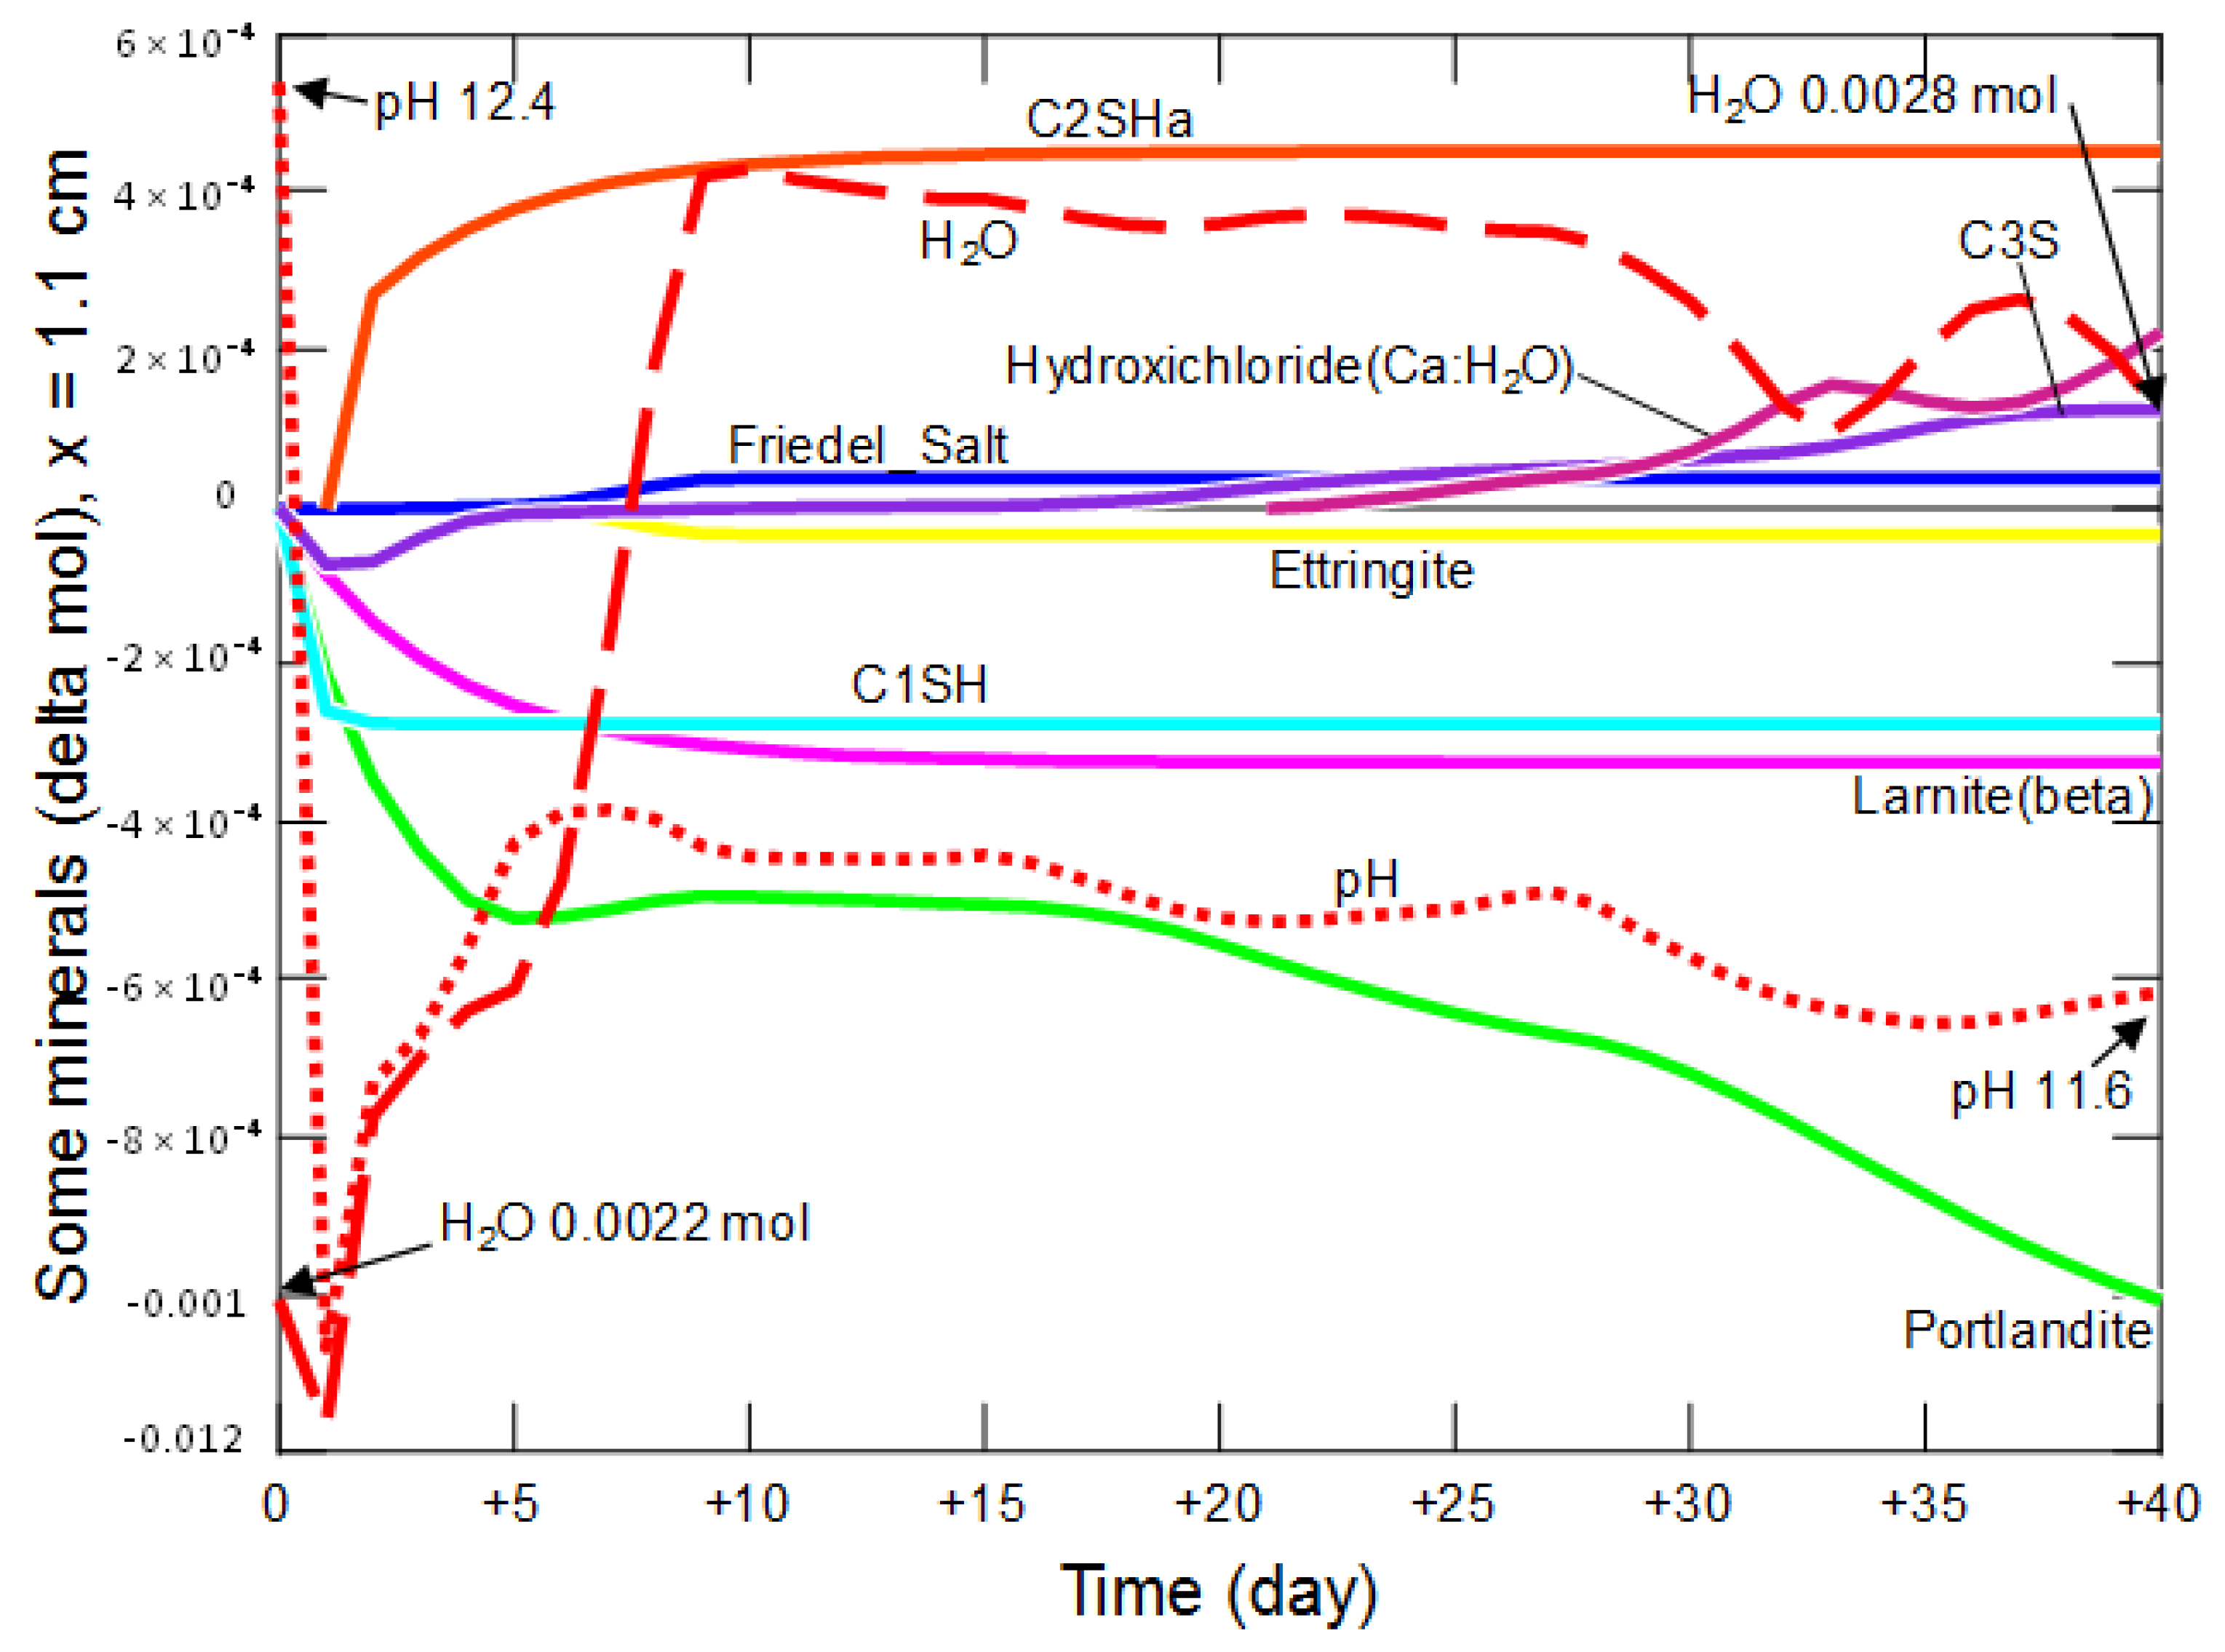
- changes in the amount of water, mineral phases and pH in the cement matrix, at points located at different distances (0.1 cm, 0.5 cm, 1.1 cm and 2.9 cm) from the beginning of the model domain for 40 days;
- -
- changes in the share of selected minerals in the model domain after 1, 3, 5, 9, 30 and 40 days from the beginning of the experiment.
3.2.1. Changes in Porosity, pH and Concentrations of the Pore Solution Components
3.2.2. Changes in the Amount of Water and Mineral Phases in the Cement Matrix
3.2.3. Changes in the Share of Selected Minerals
3.2.4. Summary of the Model Part
4. Discussion
5. Conclusions
Author Contributions
Funding
Institutional Review Board Statement
Informed Consent Statement
Data Availability Statement
Conflicts of Interest
Appendix A

| Phase | Chemical Formulae | Cement Notation | Abbreviation |
|---|---|---|---|
| Larnite (β) | Ca2SiO4 | C2S | |
| Belite | (CaO)3SiO2 | C3S | B |
| Brownmillerite | 4CaO(Al2O3, Fe2O3) | C4(A,F) | |
| Calcium aluminate | 3CaO·Al2O3 | C3A | |
| Katoite | 3CaO·Al2O3·6H2O | C3A H6 | |
| Calcite Aragonite Vaterite | CaCO3 | CĈ | C Ar V |
| Portlandite | Ca(OH)2 | CH | CH |
| Quartz (α) | SiO2 | S | |
| Quartz (β) | β—SiO2 | S | |
| Wollastonite | CaSiO3 | CS | |
| Grossular | Ca3Al2Si3O12 | C3AS3 | |
| Diopside | CaMg(SiO3)2 | CMS2 | |
| Tobermorite (14A) | Ca5Si6H21O27.5 | C5S6H10.5 | |
| Friedel’s Salt | Ca4Al2Cl2O6·10H2O | C4ACl2H10 | FS |
| Calcium aluminate | 4CaO·Al2O3·13H2O | C4AH13 | |
| Ettringite | Ca6Al2(SO4)3(OH)12· 26H2O | C6AS3H32 | Et |
| Thaumasite | CaSiO3CaSO4CaCO3· 15H2O | C3SŜĈH15 | Th |
| Gypsum | CaSO4·2H2O | CŜH2 | G |
| Bassanite | CaSO4·0.5H2O | CŜH0.5 | S |
| Gyrolite | Ca16Si24O60(OH)8· 17H2O | C16S24H21 | |
| Jennite | Ca9Si6H22O32 | C9S6H11 | |
| Okenite | CaSi2O4(OH)2·H2O | CS2H2 | |
| Heulandite (Ca) | Ca1.07Al2.14Si6.86O18·6. 17H2O | C4.5S27A4.5H26 | |
| Hydrated calcium silicates—a gel | Ca2Si2O6.6436H1.2872·1. 7542H2O | C1SH | C-S-H |
| Hydrated dicalcium silicate | Ca2(HSiO4)(OH) | C2SHa | |
| Calcium Hydroxichloride (Ca:H2O) | CaCl(OH)·2H2O | C(HCl)H2 | |
| Carboaluminate | CaAl2O4·CaCO3· 11H2O | C3A∙CĈ∙H11 | |
| Akermanite | Ca2MgSi2O7 | C2MS2 | A |
| Gismondine | CaAl2Si2O8·4(H2O) | CAS2H4 | |
| Thenardite | Na2SO4 | ŇŜ |
References
- Słomka-Słupik, B. The Analysis of Aggressive Agents Interaction with Concrete of Sewage Treatment Plants Tanks. Ph.D. Thesis, Silesian University of Technology, Gliwice, Poland, 5 December 2012. (In Polish). [Google Scholar]
- Słomka-Słupik, B.; Podwórny, J.; Trybalska, B. Korozja zaczynu z żużla wielkopiecowego w wodnym roztworze NH4Cl. Cem. Wap. Beton 2019, 24, 202–214, ISSN 1425–8129. Available online: http://cementwapnobeton.pl/pdf/2019/2019_3/2019_03_202_214_Slomka.pdf (accessed on 24 June 2019).
- Słomka-Słupik, B.; Podwórny, J.; Staszuk, M. Corrosion of cement pastes made of CEM I and CEM III/A caused by a saturated water solution of ammonium chloride after 4 and 25 days of aggressive immersion. Constr. Build. Mater. 2018, 170, 279–289, ISSN 0950-0618 (Print), ISSN 1879-0526 (Electronic). [Google Scholar] [CrossRef]
- Słomka-Słupik, B.; Podwórny, J.; Łukowiec, D. Corrosion of blast furnace slag paste in an aqueous solution of (NH4)2SO4. Cem. Wap. Beton 2016, 21, 379–388, ISSN 1425–8129. Available online: http://cementwapnobeton.pl/pdf/2016/2016_6/Slomka_6_2016.pdf (accessed on 15 December 2016).
- Słomka-Słupik, B.; Zybura, A. Corrosion of Portland cement pastes of CEM I 42,5R and CEM I 42,5R-HSR/NA in ammonium chloride solution. Cem. Wap. Beton 2012, 17, 144–148, ISSN 1425-8129. Available online: http://cementwapnobeton.pl/pdf/2012/2012_3/Slomka-03-2012.pdf (accessed on 8 May 2012).
- Słomka-Słupik, B.; Zybura, A. Changes in the microstructure of the decalcified cement paste. Cem. Wap. Beton 2010, 15, 333–339, ISSN 1425-8129. Available online: http://cementwapnobeton.pl/pdf/2010/2010_6/Slomka-06-10.pdf (accessed on 15 November 2010).
- Babu, S.; Ramaswamy, K.P.; Nazeer, M. A review on the deterioration of cement-based materials in ammonium salt solutions. In Proceedings of the 5th International Conference on Modeling and Simulation in Civil Engineering, Kerala, India, 11–13 December 2019; IOP Conference Series: Earth and Environmental Science. IOP Publishing: Bristol, UK, 2020; Volume 491, p. 012041. Available online: https://iopscience.iop.org/article/10.1088/1755-1315/491/1/012041 (accessed on 7 July 2020).
- Babu, S.; Sahad, M.; Vijeesh, K.P.; Syamjith, C.K.; Raneesh, M.; Ramaswamy, K.P.; Nazeer, M.; Thowsif, M. Durability studies on blended cement paste exposed to ammonium chloride environment. In Proceedings of the ERTSE 2020, Kerala, India, 11–13 December 2019; IOP Conference Series: Materials Science and Engineering. IOP Publishing: Bristol, UK, 2020; Volume 989, p. 012018. Available online: https://iopscience.iop.org/article/10.1088/1757-899X/989/1/012018 (accessed on 26 November 2020).
- Thomas, J.J.; Chen, J.J.; Allen, A.J.; Jennings, H.M. Effects of decalcification on the microstructure and surface area of cement and tricalcium silicate pastes. Cem. Concr. Res. 2004, 34, 2297–2307. [Google Scholar] [CrossRef]
- Kurdowski, W. Cement and Concrete Chemistry; PWN: Warsaw, Poland; SPC: Cracow, Poland, 2010. [Google Scholar]
- Biczók, I. Concrete corrosion and Concrete Protection; Akadémiai Kiadó: Budapest, Hungary, 1972. [Google Scholar]
- Jauberthie, R.; Rendell, F. Physicochemical study of the alteration surface of concrete exposed to ammonium salts. Cem. Concr. Res. 2003, 33, 85–91. [Google Scholar] [CrossRef]
- Lea, F.M. The action of ammonium salts on concrete. Mag Con Res 1965, 17, 115–116. [Google Scholar] [CrossRef]
- Rechenberg, W.; Sylla, H.-M. Die Wirkung von Ammonium auf Beton. Beton 1993, 1, 26–31. [Google Scholar]
- Jain, A.; Gencturk, B. Multiphysics and Multiscale Modeling of Coupled Transport of Chloride Ions in Concrete. Materials 2021, 14, 885. [Google Scholar] [CrossRef]
- Sahu, S.; Badger, S.; Thaulow, N. Mechanisms of thaumasite formation in concrete slabs on grade in Southern California. Cem. Concr. Compos. 2003, 25, 889–897, ISSN 0958-9465. [Google Scholar] [CrossRef]
- Garcia-Lodeiro, I.; Goracci, G.; Dolado, J.S.; Blanco-Varela, M.-T. Mineralogical and microstructural alterations in a portland cement paste after an accelerated decalcification process. Cem. Concr. Res. 2021, 40, 106312, ISSN 0008-8846. [Google Scholar] [CrossRef]
- Baldermann, C.; Baldermann, A.; Furat, O.; Krüger, M.; Nachtnebel, M.; Schroettner, H.; Juhart, J.; Schmidt, V.; Tritthart, J. Mineralogical and microstructural response of hydrated cement blends to leaching. Con. Build. Mat. 2019, 229, 116902, ISSN 0950-0618. [Google Scholar] [CrossRef]
- Glass, G.K.; Reddy, B.; Buenfeld, N.R. The participation of bound chloride in passive film breakdown on steel in concrete. Corr. Sci. 2000, 42, 2013–2021, ISSN 0010-938X. [Google Scholar] [CrossRef]
- Arya, C.; Xu, Y. Effect of cement type on chloride binding and corrosion of steel in concrete. Cem. Concr. Res. 1995, 25, 893–902, ISSN 0008-8846. [Google Scholar] [CrossRef]
- Angst, U.; Elsener, B.; Larsen, C.; Vennesland, Ø. Critical chloride content in reinforced concrete—A review. Cem. Concrt. Res. 2009, 39, 1122–1138, ISSN 0008-8846. [Google Scholar] [CrossRef]
- Balonis, M.; Lothenbach, B.; Le Saout, G.; Glasser, F.P. Impact of chloride on the mineralogy of hydrated Portland cement systems. Cem. Concrt. Res. 2010, 40, 1009–1022, ISSN 0008-8846. [Google Scholar] [CrossRef]
- Sugiyama, T.; Ritthichauy, W.; Tsuji, Y. Experimental investigation and numerical modeling of chloride penetration and calcium dissolution in saturated concrete. Cem. Concrt. Res. 2008, 38, 49–67, ISSN 0008-8846. [Google Scholar] [CrossRef]
- Cardé, C.; Francois, R.; Torrenti, J. Leaching of both calcium hydroxide and CSH from cement paste: Modelling the mechanical behavior. Cem. Concrt. Res. 1996, 26, 1257–1268. [Google Scholar] [CrossRef]
- Cardé, C.; Escadeillas, G.; Francois, R. Use of ammonium nitrate solution to simulate and accelerate the leaching of cement pastes due to deionised water. Mag. Concr. Res. 1997, 49, 295–301. [Google Scholar] [CrossRef]
- Schneider, U.; Chen, S.-W. Behavior of high-performance concrete under ammonium nitrate solution and sustained load. ACI Mater. J. 1999, 96, 47–51. Available online: https://www.concrete.org/publications/internationalconcreteabstractsportal/m/details/id/427 (accessed on 1 January 1999).
- Heukamp, F.H.; Ulm, F.; Germaine, J.T. Mechanical properties of calcium-leached cement pastes. Triaxial stress states and the influence of the pore pressures. Cem. Concrt. Res. 2001, 31, 767–774. [Google Scholar] [CrossRef]
- Bellego, L.; Pijaudier-Cabot, G.; Gérard, B.; Dubé, J.-F.; Molez, F. Coupled mechanical and chemical damage in calcium leached cementitious structures. J. Eng. Mech. 2003, 129, 333–341. [Google Scholar] [CrossRef] [Green Version]
- Segura, I.; Molero, M.; Aparicio, S.; Anaya, J.J.; Moragues, A. Decalcification of cement mortars: Characterisation and modeling. Cem. Concrt. Comp. 2013, 35, 136–150, ISSN 0958-9465. [Google Scholar] [CrossRef] [Green Version]
- Phung, Q.T.; Diederik, J.; Maes, N.; Schutter, G.D. Modeling the decalcification of cement paste in ammonium nitrate solution. In Proceedings of the 3rd Internatinal Conference on Service Life Design for Infrastructure, Zhuhai, China, 15–17 October 2014. [Google Scholar]
- Song, Z.; Jiang, L.; Chu, H. Impact of calcium leaching on chloride diffusion behavior of cement pastes exposed to ammonium chloride aqueous solution. Con. Build. Mat. 2017, 153, 211–215, ISSN 0950-0618. [Google Scholar] [CrossRef]
- Li, X.N.; Zuo, X.B.; Zou, Y.X. Modeling and simulation on coupled chloride and calcium diffusion in concrete. Con. Build. Mat. 2020, 271, 121557, ISSN 0950-0618. [Google Scholar] [CrossRef]
- Feng, P.; Miao, C.; Bullard, J.W. A model of phase stability, microstructure and properties during leaching of Portland cement binders. Cem. Con. Comp. 2014, 49, 9–19, ISSN 0958-9465. [Google Scholar] [CrossRef]
- Bethke, C.M. Geochemical and Biogeochemical Reaction Modeling, 2nd ed.; Cambridge University Press: New York, NY, USA, 2008; pp. 1–562. [Google Scholar] [CrossRef]
- Lasaga, A.C. Chemical kinetics of water—Rock interactions. J. Geoph. Res. 1984, 89, 25. [Google Scholar] [CrossRef]
- Labus, M.; Wertz, F. Identifying geochemical reactions on wellbore cement/caprock interface under sequestration conditions. Environ. Earth Sci. 2017, 76, 443. [Google Scholar] [CrossRef] [Green Version]
- Baur, I.; Keller, P.; Mavrocordatos, D.; Wehrli, B.; Johnson, C.A. Dissolution–precipitation behaviour of ettringite, monosulfate, and calcium silicate hydrate. Cem. Concrt. Res. 2004, 34, 341–348. [Google Scholar] [CrossRef]
- Palandri, J.L.; Kharaka, Y.K. A Compilation of Rate Parameters of Water–Mineral Interaction Kinetics for Application to Geochemical Modelling; Menlo Park, CA, U.S. Geological Survey Report; 2004; pp. 1–64. ISSN 2004–1068. Available online: https://pubs.usgs.gov/of/2004/1068/ (accessed on 31 March 2004).
- Galı, S.; Ayora, C.; Alfonso, P.; Tauler, E.; Labrador, M. Kinetics of dolomite–Portlandite reaction: Application to Portland cement concrete. Cem. Concrt. Res. 2001, 31, 933–939. [Google Scholar] [CrossRef]
- Marty, N.C.M.; Grangeon, S.; Lerouge, C.; Warmont, F.; Rozenbaum, O.; Conte, T.; Claret, F. Dissolution kinetics of hydrated calcium aluminates (AFm-Cl) as a function of pH and at room temperature. Min. Mag. 2017, 81, 1245–1259. [Google Scholar] [CrossRef] [Green Version]
- Brand, A.S.; Gorham, J.M.; Bullard, J.W. Dissolution rate spectra of β-dicalcium silicate in water of varying activity. Cem. Concrt. Res. 2019, 118, 69–83. [Google Scholar] [CrossRef]
- Schweizer, C.R. Calciumsilikathydrat-Mineralien. Lösungskinetik und ihr Einfluss auf das Auswaschverhalten von Substanzen aus einer Ablagerung mit Rückständen aus Müllverbrennungsanlagen. Ph.D. Thesis, Universität Basel Zürich und Dübendorf, Chem, Switzerland, 1999. [Google Scholar]
- Nicoleau, L.; Nonat, A.; Perrey, D. The di- and tricalcium silicate dissolutions. Cem. Concrt. Res. 2013, 47, 14–30. [Google Scholar] [CrossRef]


| Phase | Portlandite CH | Calcium Aluminate C3AH6 | Carboaluminate C3A·CĈ·H11 | Ettringite C6AŜ3·H32 | Calcite CĈ | Thaumasite C3SĈŜ·H15 | Gypsum CŜH2 |
|---|---|---|---|---|---|---|---|
| pH | 12.54 | 11.64 | 11.37 | 11.00 | 9.96 | 8.19 | 7.07 |
| Oxide Mass % | ||||||||
|---|---|---|---|---|---|---|---|---|
| CaO | SiO2 | Al2O3 | Fe2O3 | SO3 | K2O | Na2O | MgO | |
| CEM I 42.5 R | 62.63 | 19.03 | 5.60 | 2.89 | 3.14 | 0.98 | 0.16 | n.d. |
| CEM I 52.5 R | 63.26 | 19.65 | 5.30 | 2.85 | 3.14 | 0.96 | 0.21 | 1.55 |
| Mineral | Dissolution Rate—k25 | Specific Surface Area SSA—An | Source | ||
|---|---|---|---|---|---|
| Acid Mechanism | Neutral Mechanism | ||||
| (mol/m2·s−1) | (mol/m2·s−1) | In Model (cm2/g) | In Literature (m2/g) | ||
| Ettringite | 1.14 × 10⁻¹² * | 1.14 × 10⁻¹² * | 20,000 * | 2 * | (*) Labus, Wertz, 2017 [36] (after Baur et al., 2004) [37] |
| Calcite | 5.00 × 10⁻¹ * | 1.55 × 10⁻⁶ * | 260 | 0.026 ** | (*) Palandri, Kharaka, 2004; [38] (**) Labus, Wertz, 2017 [36] |
| Portlandite | 8.04 × 10⁻⁴ * | 2.18 × 10⁻⁸ * | 20,000 | 2 * | (*) Labus, Wertz, 2017 [36] (after Gali et al., 2001) [39] |
| Hydrocalumite Friedels Salt Ca4Al2Cl2O6:10H2O | 5.89 × 10⁻¹⁰ * | 5.89 × 10⁻¹⁰ * | 5000 | 6.1; 7.1; 9.4; 13.7, 35.4 * | (*) Marty et al., 2017 [40] |
| Quartz | 7.76 × 10⁻¹² * | 1.02 × 10⁻¹⁴ * | 157.3 | 0.01573 ** | (*) Palandri, Kharaka, 2004; [38] (**) Labus, Wertz, 2017 [36] |
| C2S-β Larnite | 1.0 × 10⁻⁶ * | 1.0 × 10⁻⁶ * | 20,000 | 2.93 ** | (*) Brand et al., 2019 [41] (**) Nicoleau et al., 2013 [43] |
| C1SH | 5.94 × 10⁻⁸ * | 1.60 × 10⁻¹⁸ * | 20,000 | 2 * | (*) Labus, Wertz, 2017 [36] (after Schweizer 1999) [42] |
| C3S | 5.94 × 10⁻⁸ * | 1.60 × 10⁻¹⁸ * | 20,000 * | - | (*) assumed as for C1SH |
| Parameter | Unit | Pore Solution | NH4Cl Solution |
|---|---|---|---|
| pH | [–] | 11.76 | 4.34 |
| Ca2+ | [mol/kg] | 6.7 × 10⁻³ | 1.0 × 10⁻⁵ |
| Mg | [mol/kg] | 1.0 × 10⁻⁶ | 1.0 × 10⁻⁴ |
| Cl− | [mol/kg] | 0.444 | 7.20 |
| NH4+ | [mol/kg] | 1.0 × 10⁻⁶ | 7.20 |
| K+ | [mol/kg] | 1.0 × 10⁻⁶ | 1.0 × 10⁻⁶ |
| Na+ | [mol/kg] | 0.426 | 1.0 × 10⁻³ |
| SO42− | [mol/kg] | 6.7 × 10⁻³ | 1.0 × 10⁻⁶ |
| HCO3− | [mol/kg] | 1.0 × 10⁻⁶ | 1.0 × 10⁻⁴ |
| H4SiO4(aq) | [mol/kg] | 1.0 × 10⁻⁶ | 1.0 × 10⁻⁶ |
| Al3+ | [mol/kg] | 1.0 × 10⁻⁶ | 1.0 × 10⁻⁶ |
| Fe | [mol/kg] | 1.0 × 10⁻⁶ | 1.0 × 10⁻⁶ |
| Phase | Content % mass ± 3σ | Rexp | Rwp | Content % vol |
|---|---|---|---|---|
| Ettringite | 15.71 ± 0.78 | 3.23 | 5.98 | 13.44 |
| Calcite | 0.70 ± 0.36 | 0.39 | ||
| Portlandite | 37.0 ± 1.60 | 24.96 | ||
| Hydrocalumite (Friedel’s salt) | 10.08 ± 0.67 | 7.50 | ||
| Silica | 0.91 ± 0.18 | 0.52 | ||
| Dicalcium silicate beta | 18.4 ± 1.10 | 8.33 | ||
| Tricalcium silicate monocl. | 17.2 ± 1.50 | 8.33 | ||
| Amorphous calcium silicate hydrate C1SH | approx. 20 | 16.67 |
| Symbol in XRD Set of Patterns | Specimen Phase | B-4 | B-19 | B-25 | B-P | ||||||||||||||||||||||||
|---|---|---|---|---|---|---|---|---|---|---|---|---|---|---|---|---|---|---|---|---|---|---|---|---|---|---|---|---|---|
| Layer [mm] | |||||||||||||||||||||||||||||
| 0.0–1.0 | 1.0–2.0 | 2.0–2.5 | 2.5–3.0 | 3.5–4.0 | 4.0–4.5 | 4.5–5.0 | 8.0–9.0 | 0.0–2.0 | 2.0–3.5 | 3.5–4.5 | 4.5–5.0 | 5.0–5.5 | 5.5–6.0 | 7.0–8.0 | 10.0–11.0 | 0.0–1.0 | 1.0–2.0 | 2.0–3.0 | 3.0–4.0 | 4.0–5.0 | 5.0–6.0 | 6.0–7.0 | 7.0–8.0 | 8.0–9.0 | 9.0–10.0 | 11.0–12.0 | |||
| 1 | Potlandite (CH) | + | + | + | + | + | + | + | + | + | + | + | + | + | + | + | + | ||||||||||||
| 2 | Friedel’s salt (FS) | * | * | + | + | + | + | + | + | * | + | + | + | + | + | + | + | + | + | + | + | + | + | + | / | * | * | ||
| 3 | Ettringite (Et) | * / | x | + | + | + | + | * / | + | + | + | + | * / | + | + | + | + | + | + | + | + | ||||||||
| 4 | Thaumasite (Th) | + | x | + | + | + | + | * | + | + | + | + | |||||||||||||||||
| 5 | Gypsum (G) | + | + | + | + | + | + | + | + | + | + | + | + | ||||||||||||||||
| 6 | Calcite (C) | + | + | + | + | + | + | + | + | + | + | + | + | + | + | + | + | + | + | + | + | + | + | + | + | + | + | + | + |
| 7 | Vaterite (V) | + | + | + | + | + | + | + | + | + | |||||||||||||||||||
| 8 | Bassanite (S) | + | + | + | |||||||||||||||||||||||||
| 9 | Carboaluminate | + | + | + | + | + | |||||||||||||||||||||||
| 11 | Belite (larnite) | + | + | + | + | + | + | + | + | + | + | + | + | + | + | + | + | + | + | + | + | + | + | ||||||
| 12 | Calcium aluminate | + | + | + | + | + | |||||||||||||||||||||||
| 13 | Brownmillerite (B) | + | + | + | + | + | + | + | + | + | + | + | + | + | + | + | + | + | + | + | + | + | + | + | + | + | + | + | + |
| - | Alite (hatrurit) | + | + | + | + | + | + | + | + | + | + | + | + | + | + | + | + | + | |||||||||||
| - | Calcium aluminate | + | + | + | + | + | |||||||||||||||||||||||
| - | Katoite | + | + | + | + | + | |||||||||||||||||||||||
| - | Gismondine | + | + | + | + | + | |||||||||||||||||||||||
| - | Thenardite | + | + | + | + | ||||||||||||||||||||||||
| The Day of Modeling Phase | Day 4 | Day 19 | Day 25 | ||||||||||||||||||||||
|---|---|---|---|---|---|---|---|---|---|---|---|---|---|---|---|---|---|---|---|---|---|---|---|---|---|
| Cell Position from the End of the Model Domain [mm] | |||||||||||||||||||||||||
| 1.0 | 3.0 | 5.0 | 7.0 | 9.0 | 11.0 | 13.0 | 29.0 | 1.0 | 3.0 | 5.0 | 7.0 | 9.0 | 11.0 | 13.0 | 29.0 | 1.0 | 3.0 | 5.0 | 7.0 | 9.0 | 11.0 | 13.0 | 29.0 | B-P | |
| Portlandite | + | + | + | + | + | + | + | + | + | + | + | + | + | + | + | + | + | + | |||||||
| Friedel’s Salt | + | + | + | + | + | + | + | + | + | + | + | + | + | + | + | + | + | + | + | + | + | + | + | + | + |
| Ettringite | + | + | + | + | + | + | + | + | |||||||||||||||||
| Calcite | + | + | + | + | + | + | + | + | + | + | + | + | + | + | + | + | + | + | + | + | + | + | + | ||
| Aragonite | + | ||||||||||||||||||||||||
| C1SH | + | ||||||||||||||||||||||||
| Larnite (β) | + | + | + | + | + | + | + | + | + | + | + | + | + | + | + | + | + | ||||||||
| C3S | + | + | + | + | + | + | + | + | + | + | + | + | + | + | + | + | + | + | + | + | + | ||||
| C2SHa | + | + | + | + | + | + | + | + | + | + | + | + | + | + | + | ||||||||||
| Quartz (α) | + | + | + | + | + | + | + | + | + | + | + | + | + | + | + | + | + | + | + | + | + | + | + | + | + |
| Quartz (β) | + | + | |||||||||||||||||||||||
| Grossular | + | + | + | + | + | + | + | + | |||||||||||||||||
| Jennite | + | + | |||||||||||||||||||||||
| Tobermorite | + | + | |||||||||||||||||||||||
| Diopside | + | + | + | ||||||||||||||||||||||
| Gyrolite | + | + | + | + | + | ||||||||||||||||||||
| Hydroxichloride | + | + | + | + | |||||||||||||||||||||
| Wollastonite | + | + | |||||||||||||||||||||||
| Okenite | + | ||||||||||||||||||||||||
| Heulandite | + | + | |||||||||||||||||||||||
Publisher’s Note: MDPI stays neutral with regard to jurisdictional claims in published maps and institutional affiliations. |
© 2022 by the authors. Licensee MDPI, Basel, Switzerland. This article is an open access article distributed under the terms and conditions of the Creative Commons Attribution (CC BY) license (https://creativecommons.org/licenses/by/4.0/).
Share and Cite
Słomka-Słupik, B.; Labus, K. Laboratory Test and Geochemical Modeling of Cement Paste Degradation, in Contact with Ammonium Chloride Solution. Materials 2022, 15, 2930. https://doi.org/10.3390/ma15082930
Słomka-Słupik B, Labus K. Laboratory Test and Geochemical Modeling of Cement Paste Degradation, in Contact with Ammonium Chloride Solution. Materials. 2022; 15(8):2930. https://doi.org/10.3390/ma15082930
Chicago/Turabian StyleSłomka-Słupik, Barbara, and Krzysztof Labus. 2022. "Laboratory Test and Geochemical Modeling of Cement Paste Degradation, in Contact with Ammonium Chloride Solution" Materials 15, no. 8: 2930. https://doi.org/10.3390/ma15082930
APA StyleSłomka-Słupik, B., & Labus, K. (2022). Laboratory Test and Geochemical Modeling of Cement Paste Degradation, in Contact with Ammonium Chloride Solution. Materials, 15(8), 2930. https://doi.org/10.3390/ma15082930