
Study on Influencing Factors of Phase Transition Hysteresis in the Phase Change Energy Storage

Abstract
:1. Introduction
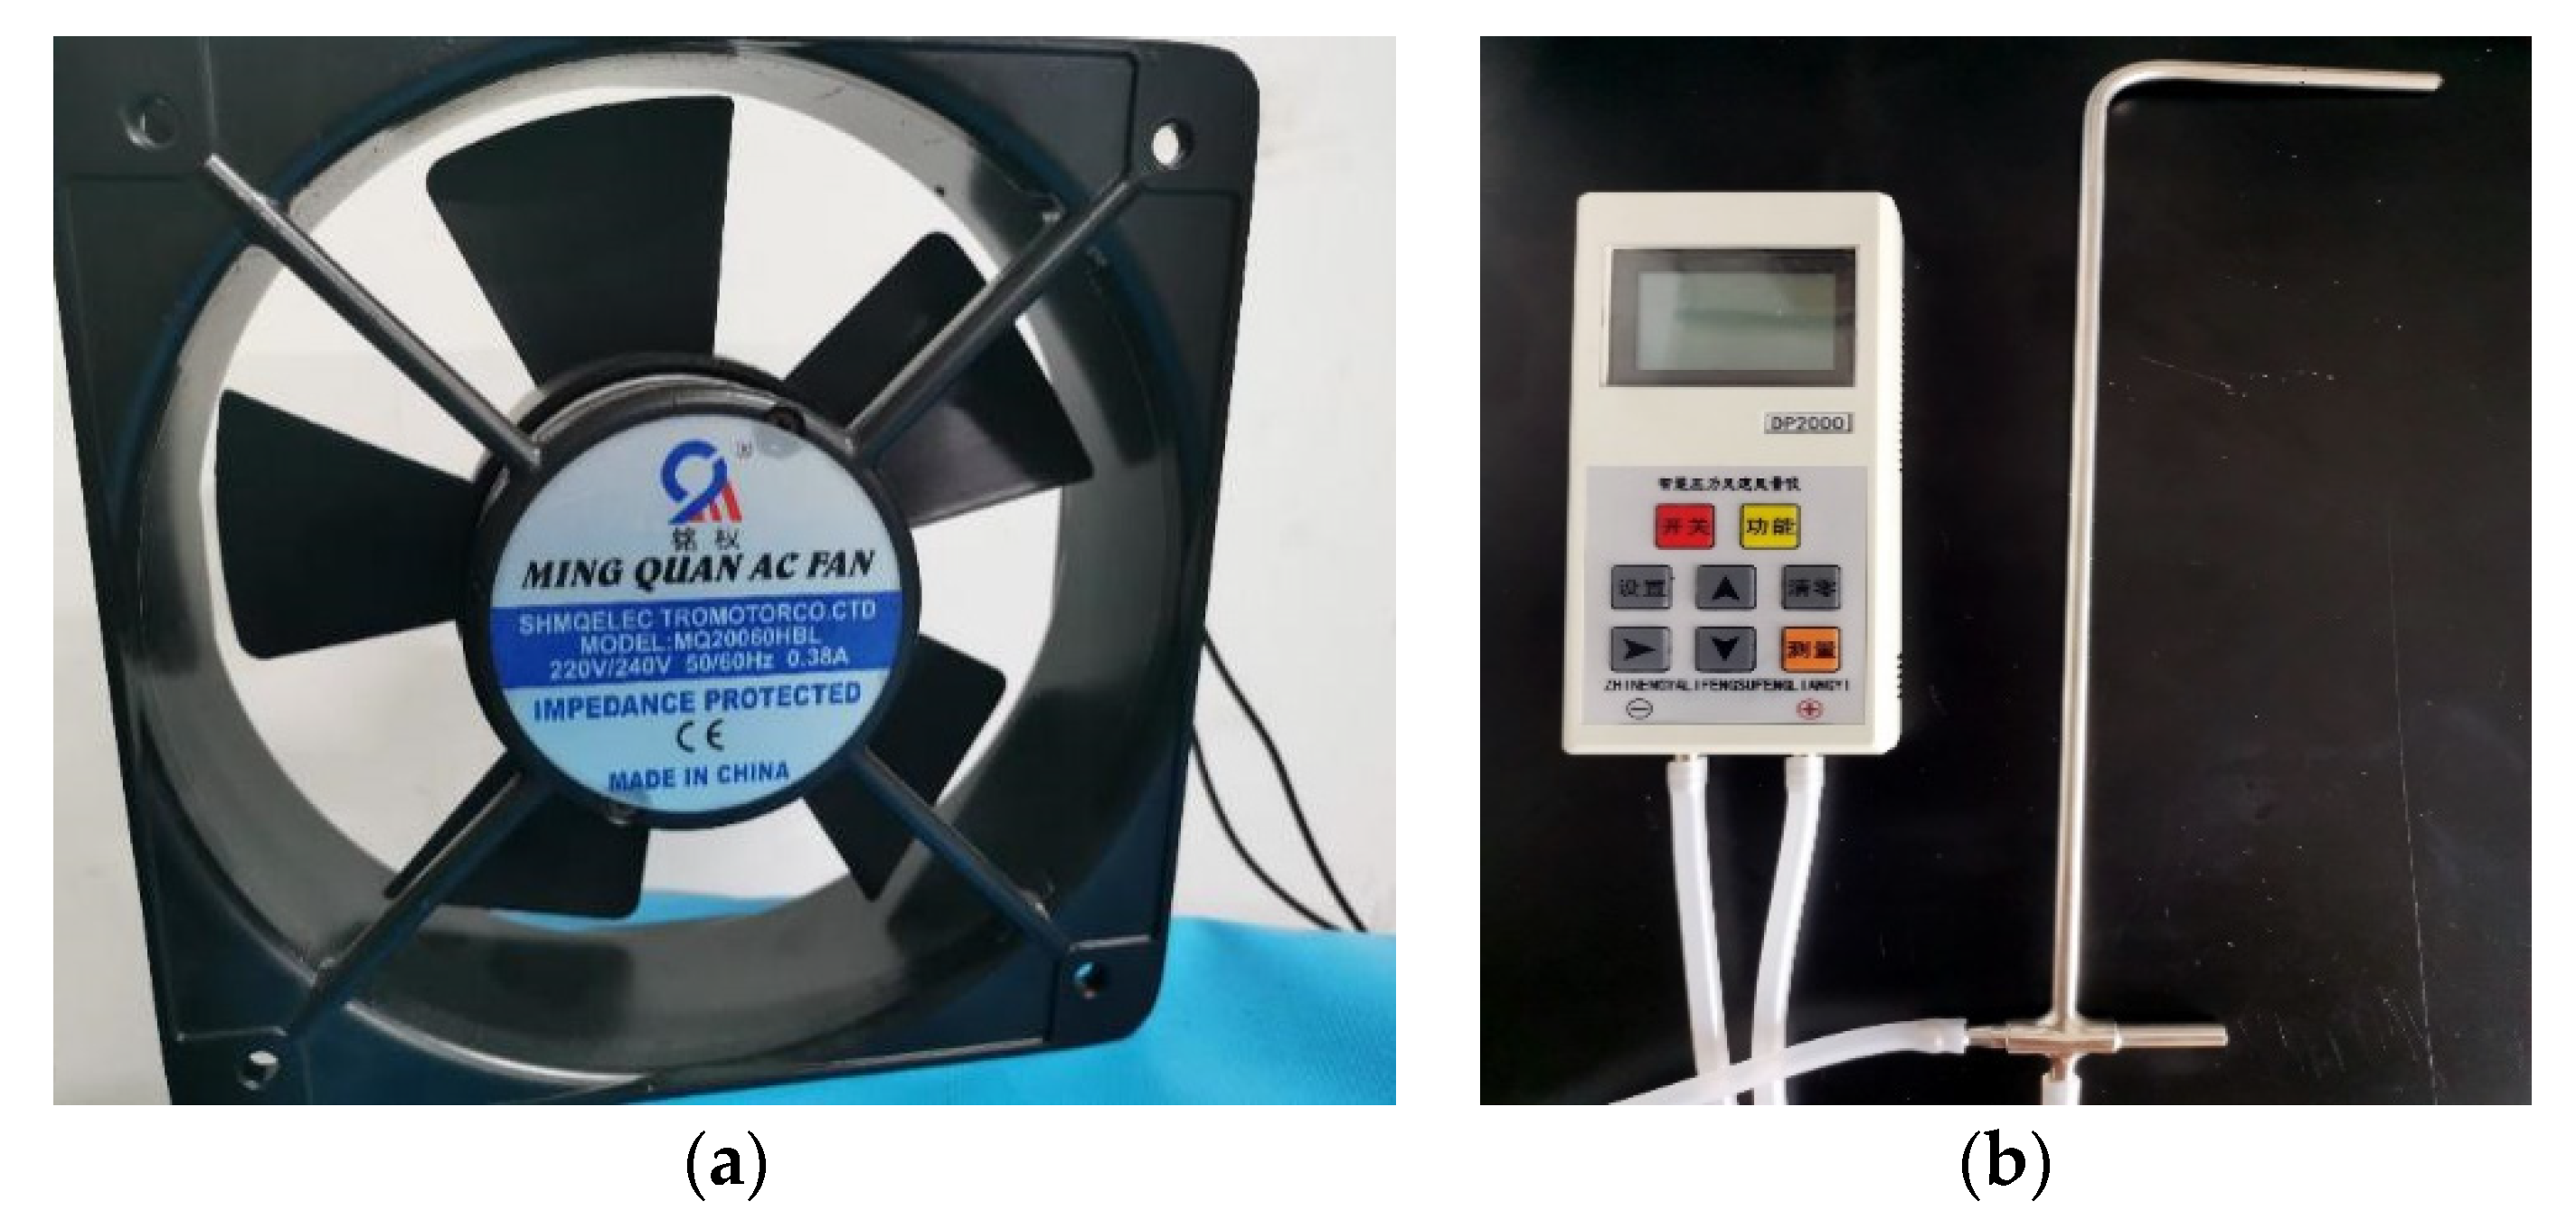
2. Experimental Materials and Equipment
3. Study on Influencing Factors of Phase Transition Hysteresis
3.1. Effect of Heat Storage Temperature on Hysteresis Characteristics of Phase Transition
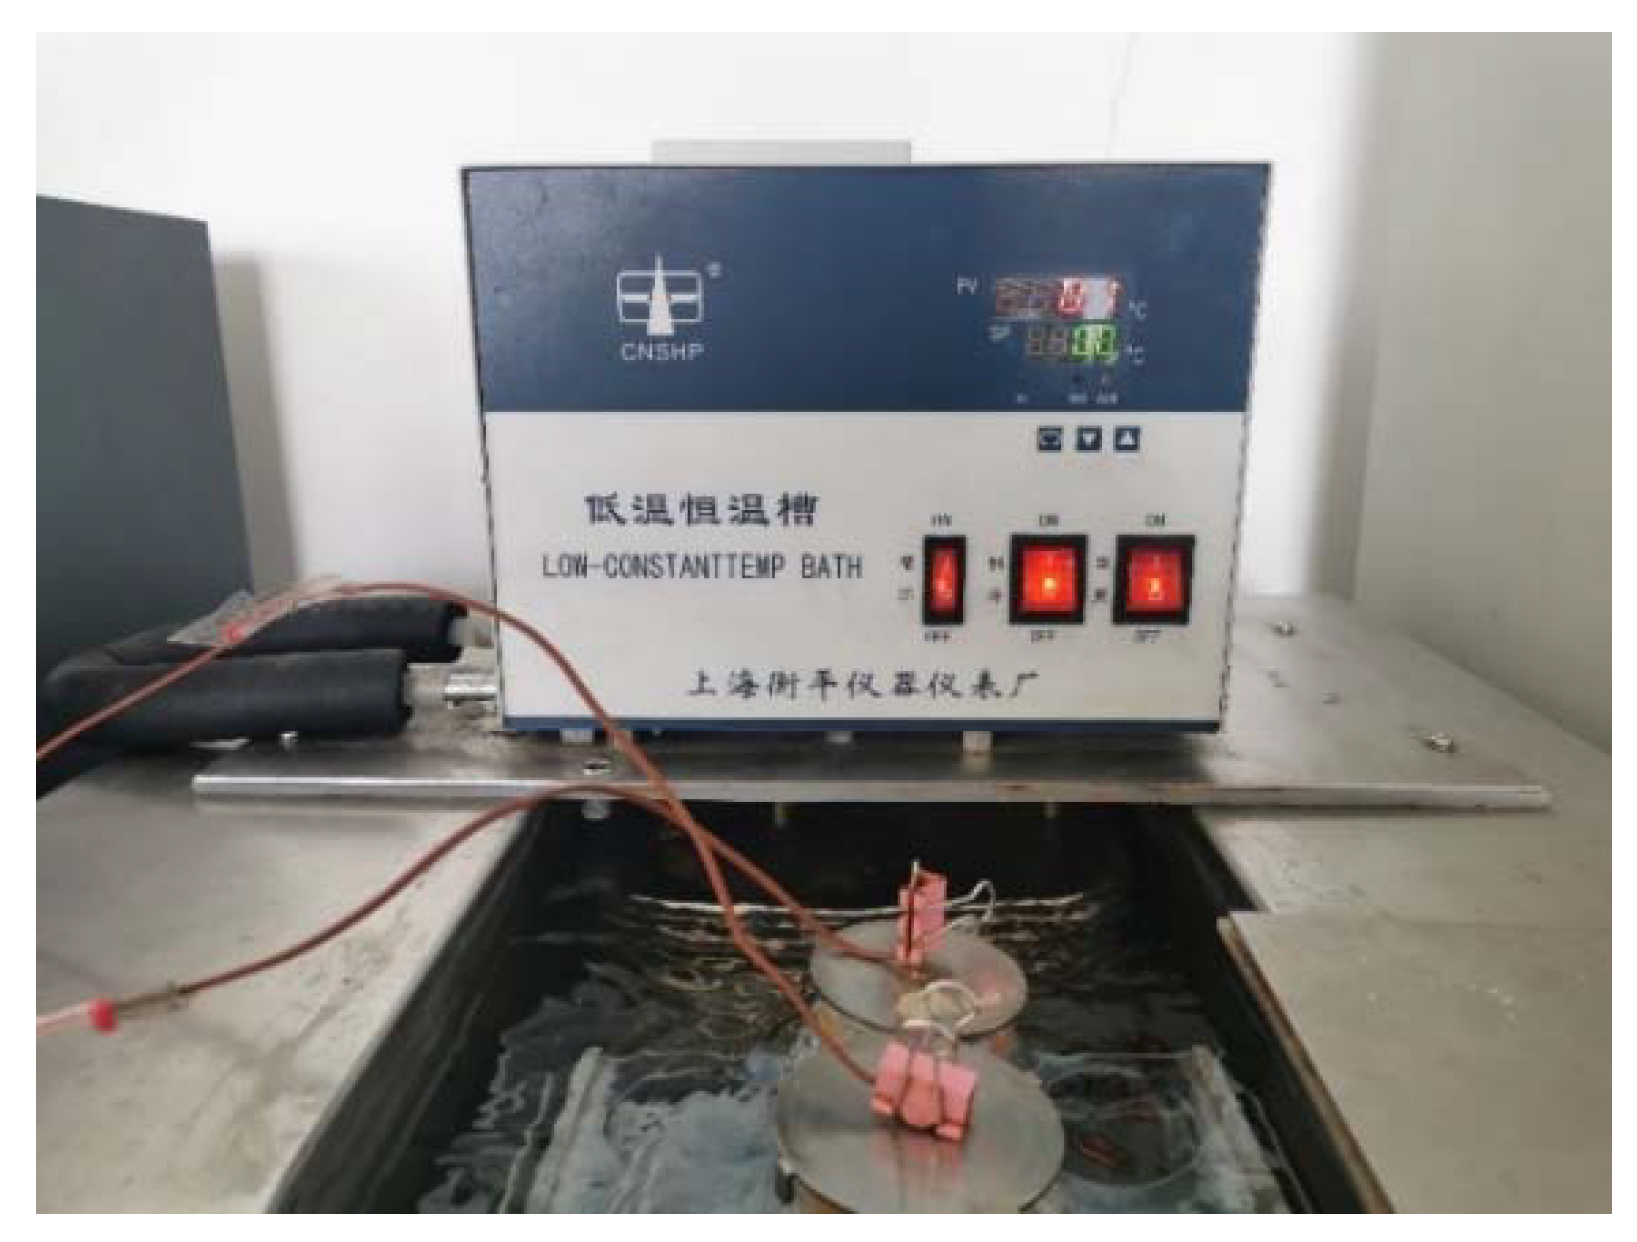
3.1.1. The Experimental Operation
3.1.2. Analysis of Experimental Results
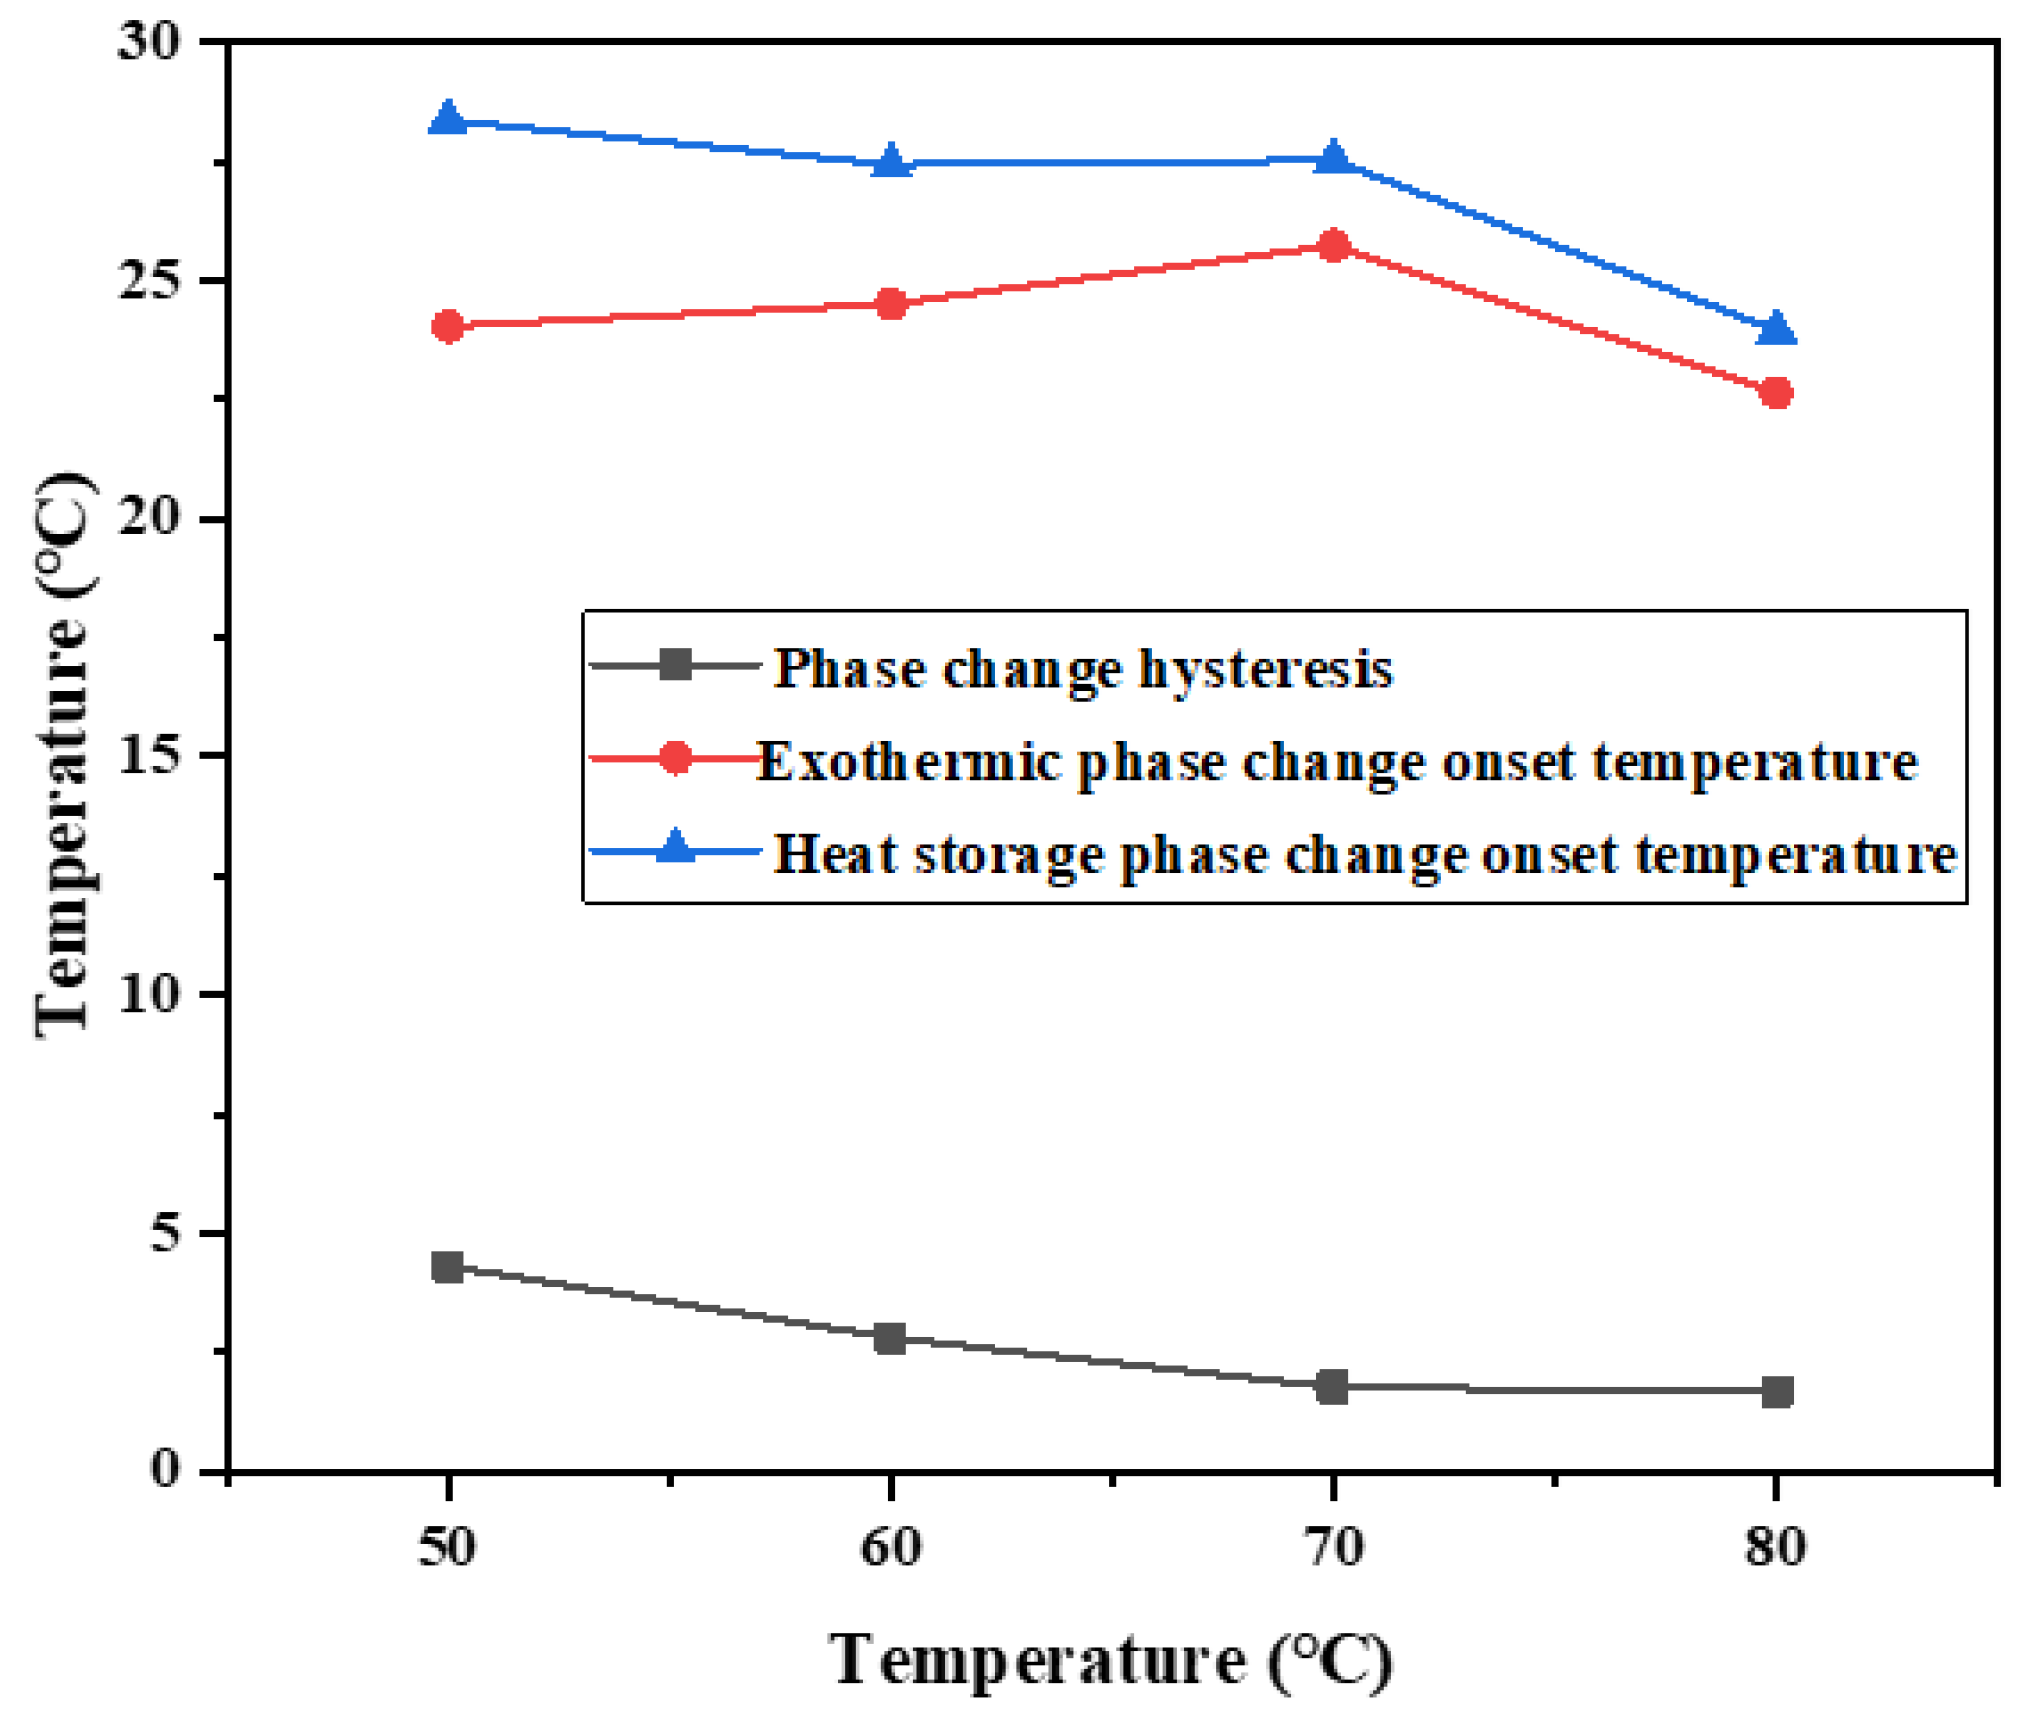
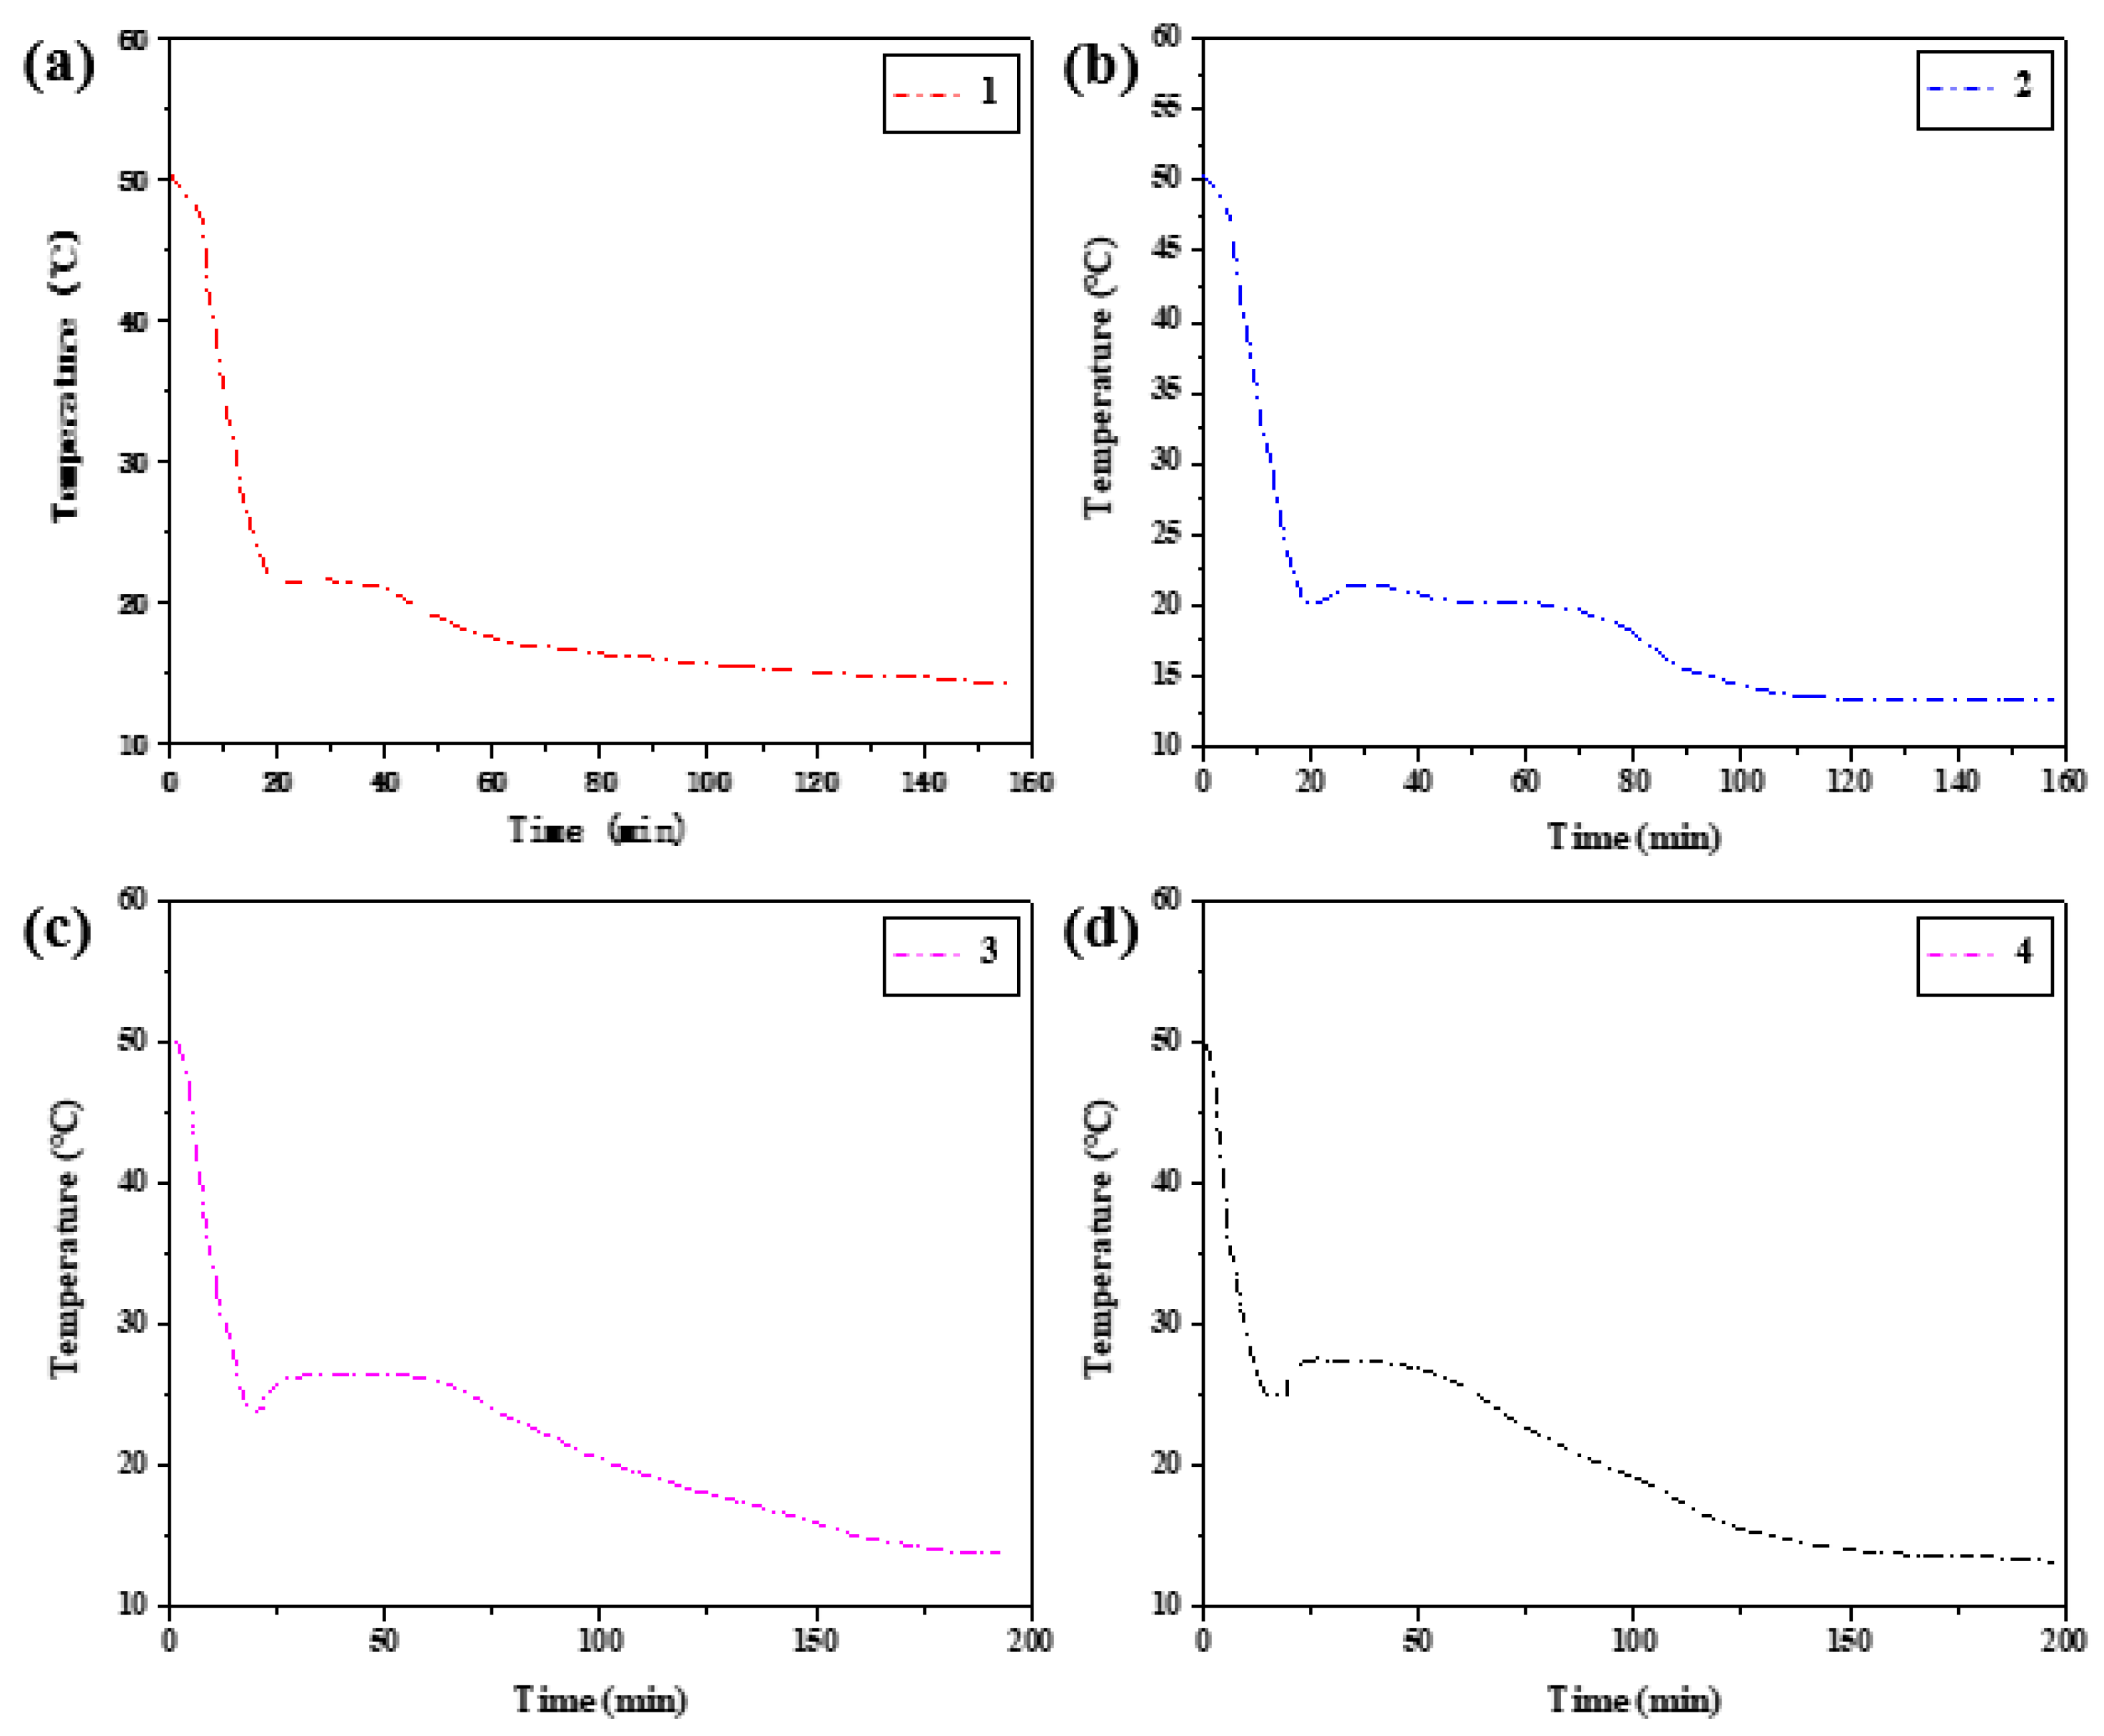
Cooling Curve Analysis
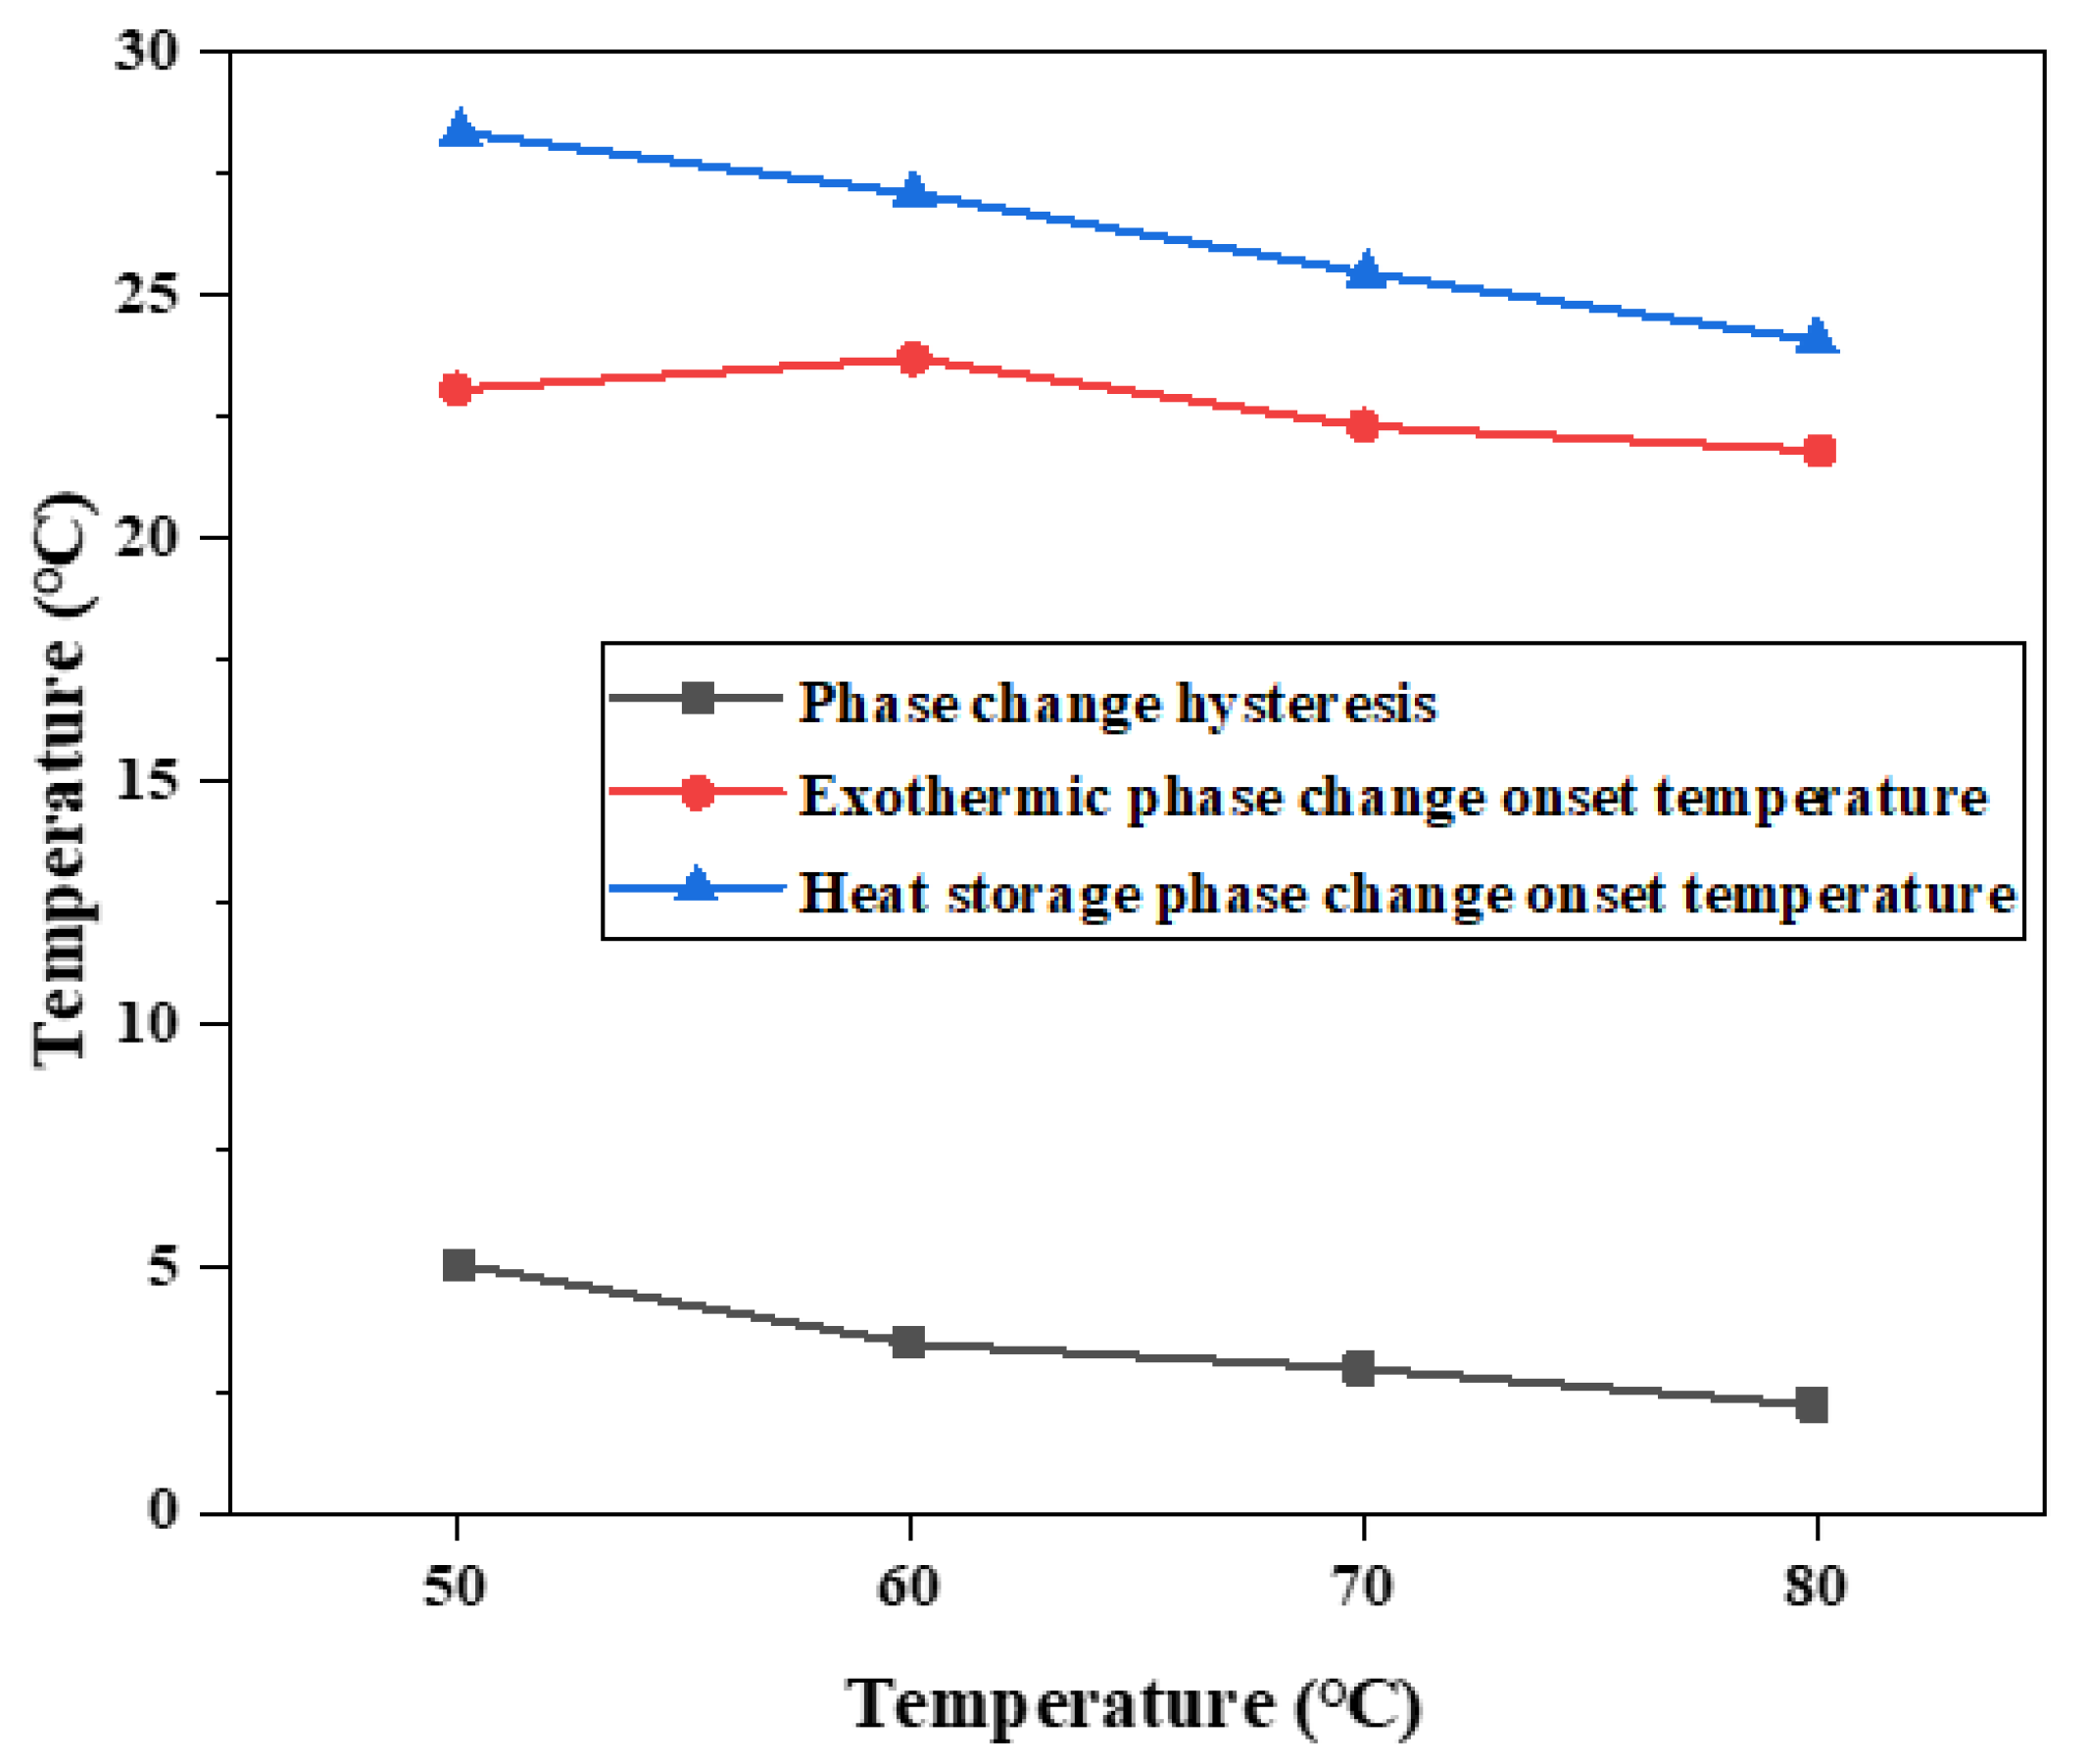
DSC Curve Analysis
3.2. Effect of Cooling Temperature on Hysteresis Characteristics of Phase Transition
3.2.1. The Experimental Operation
3.2.2. Analysis of Experimental Results
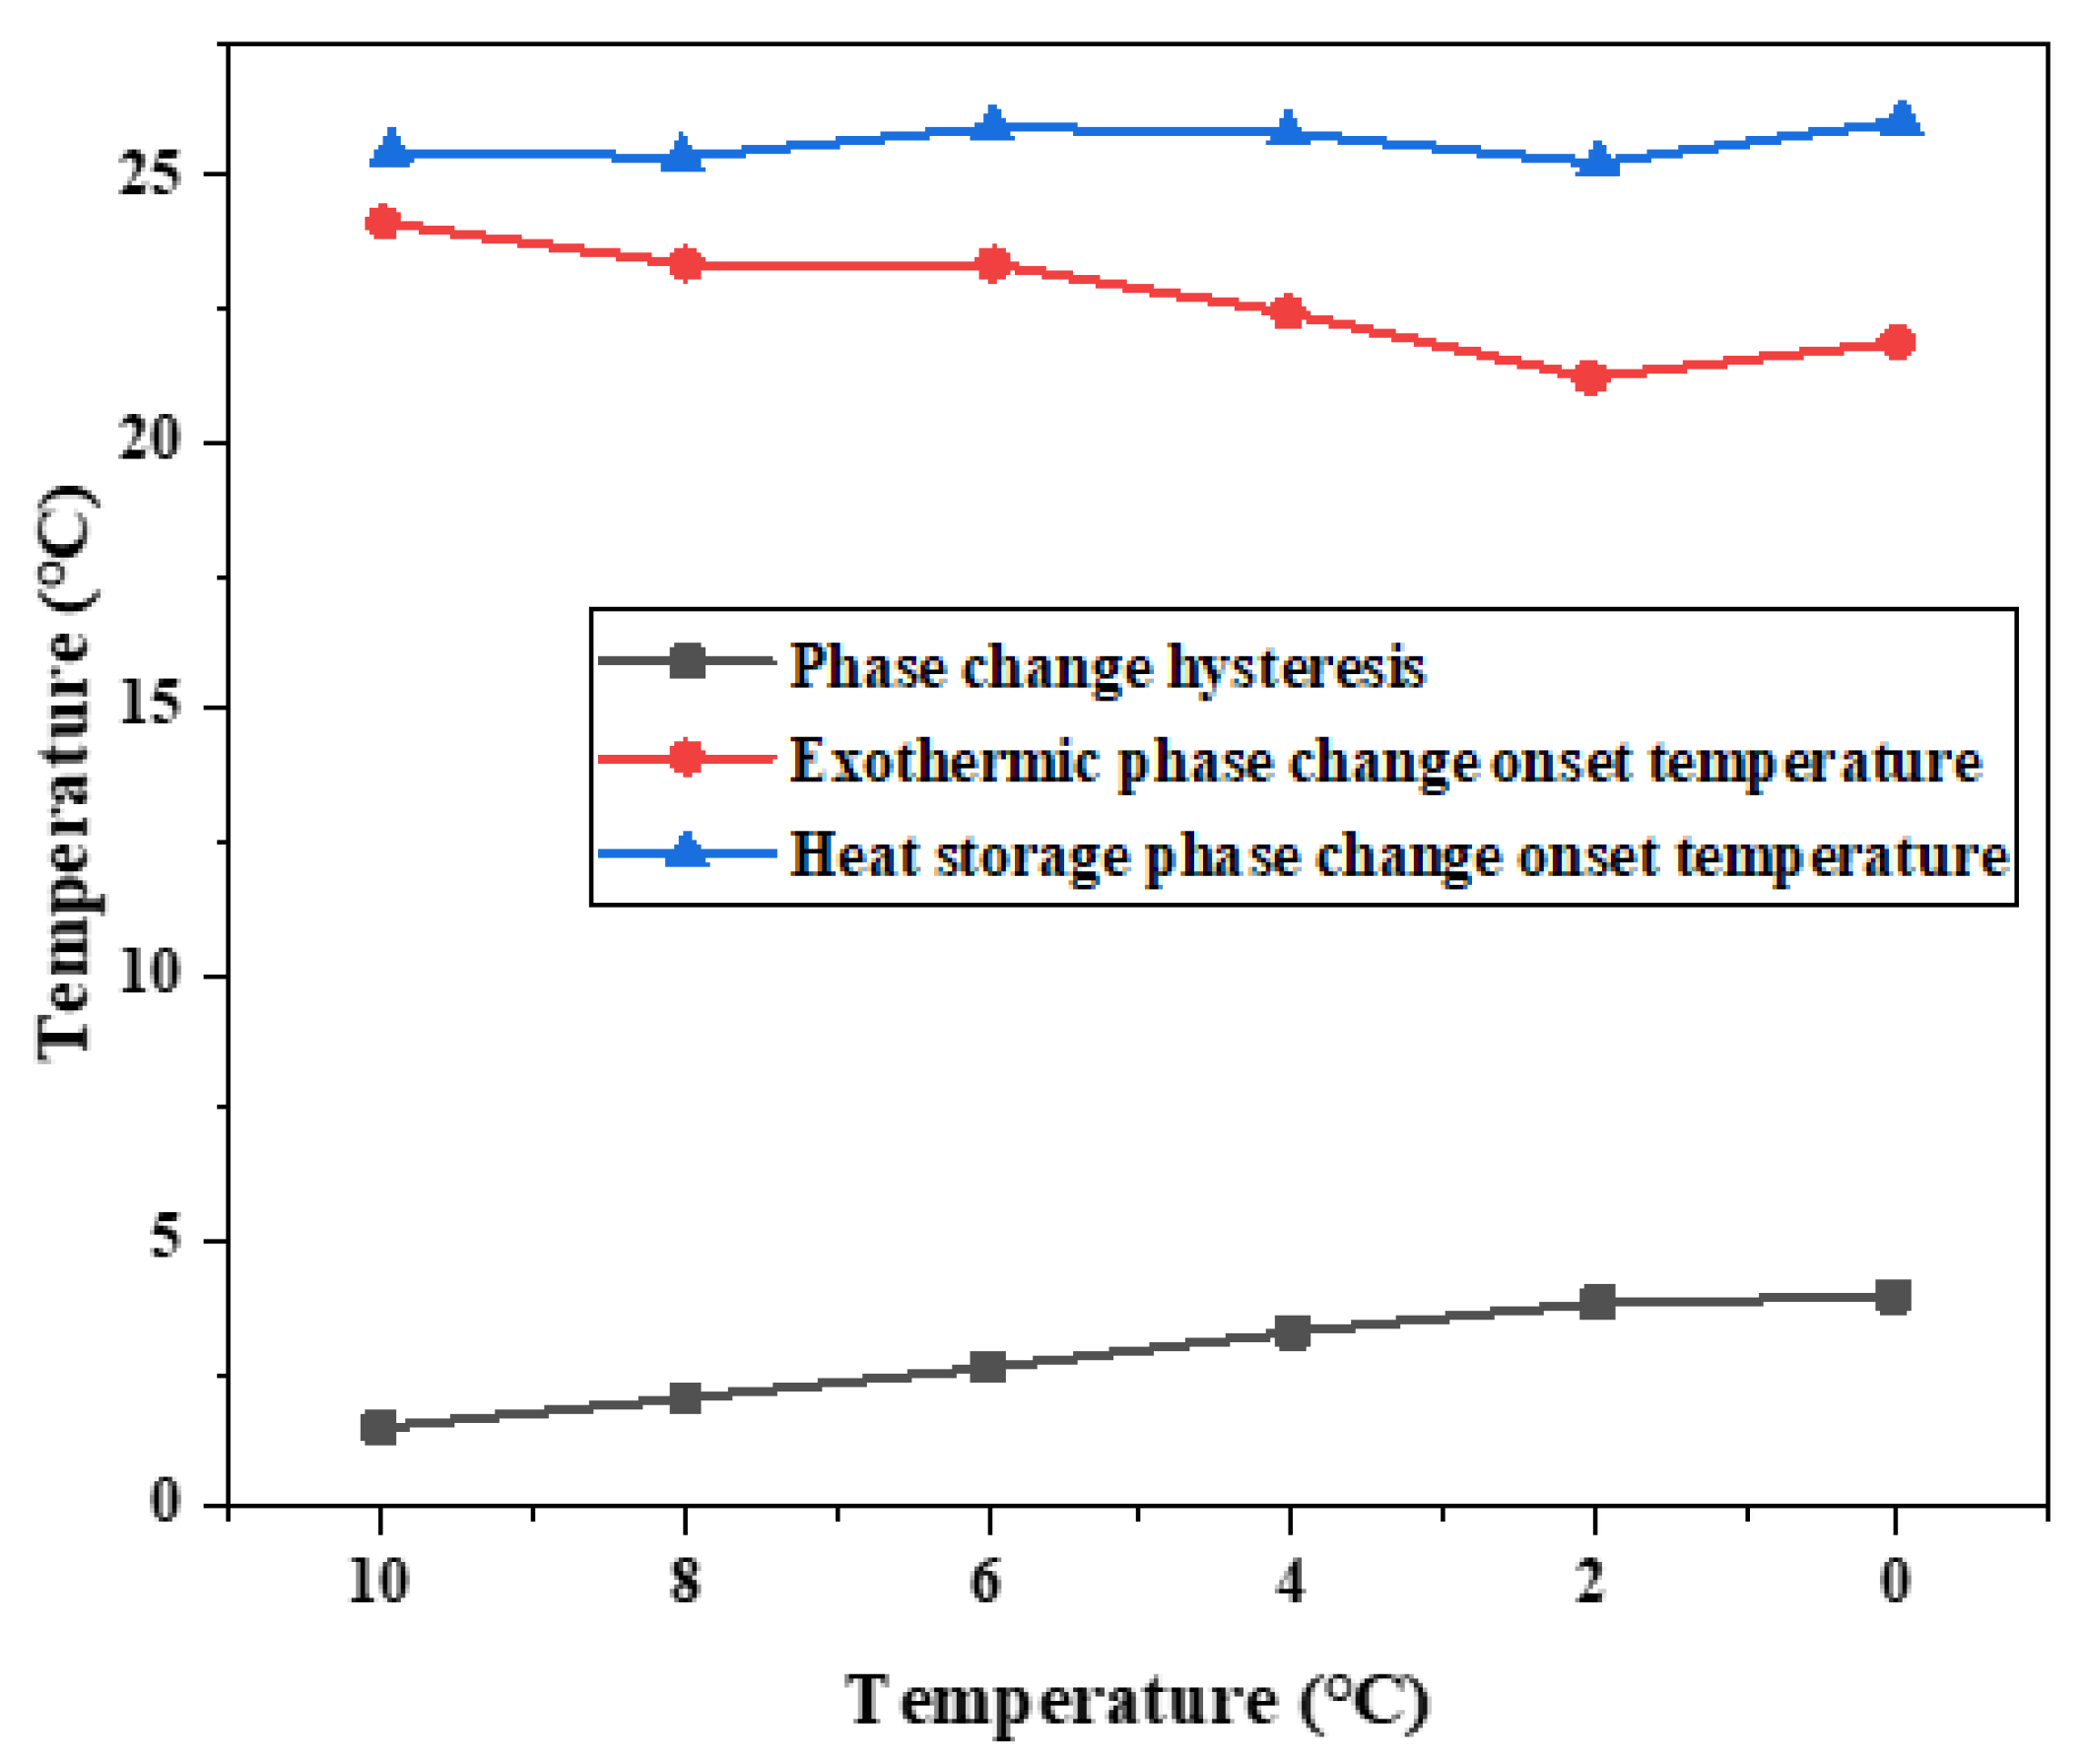
Cooling Curve Analysis
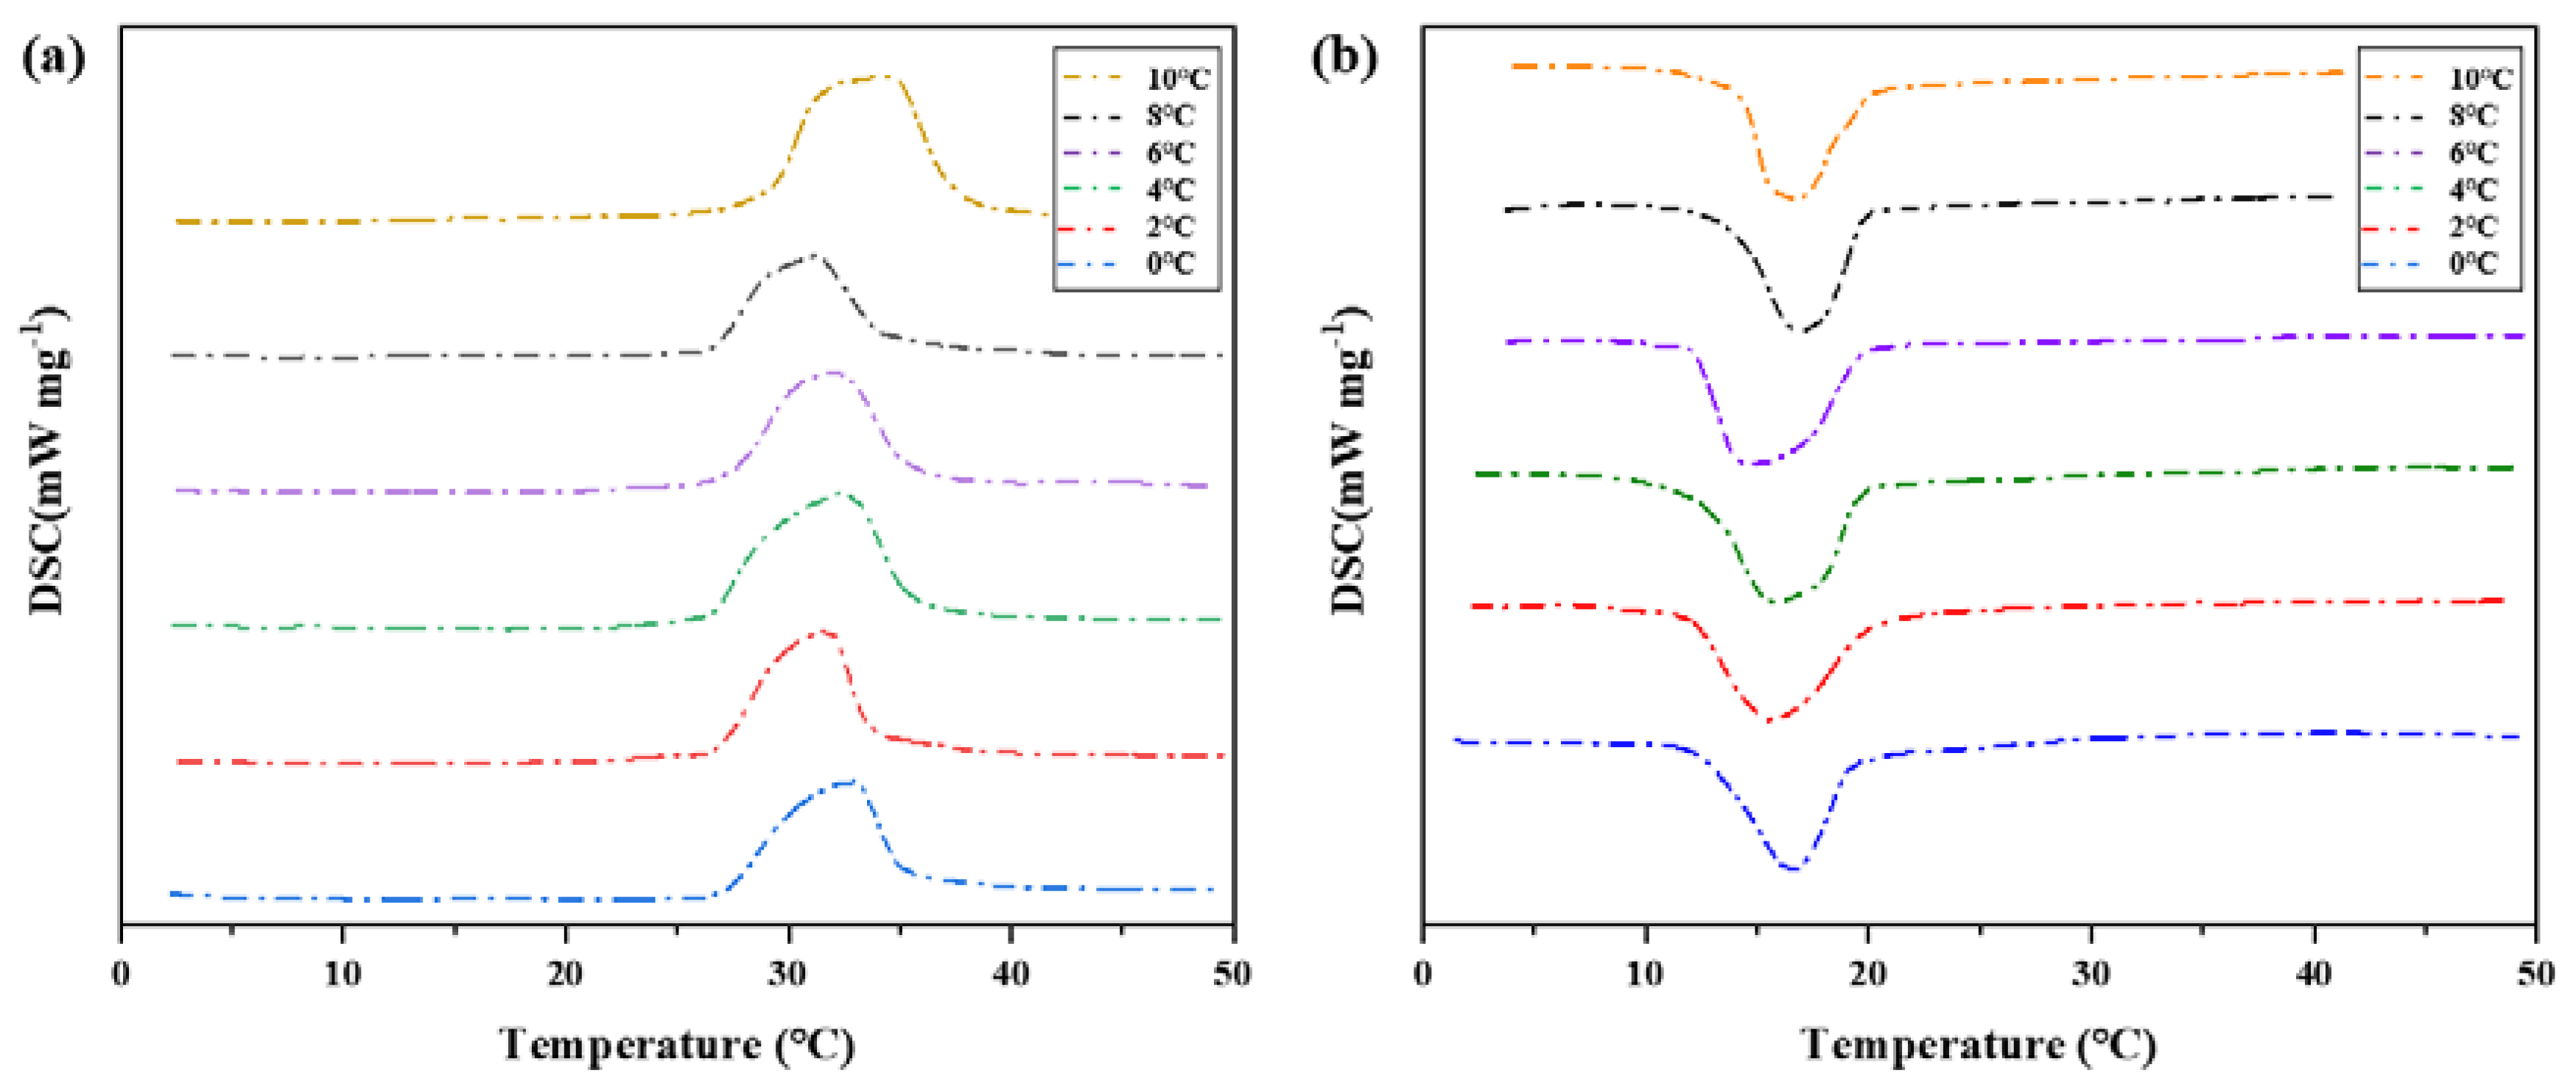
DSC Curve Analysis
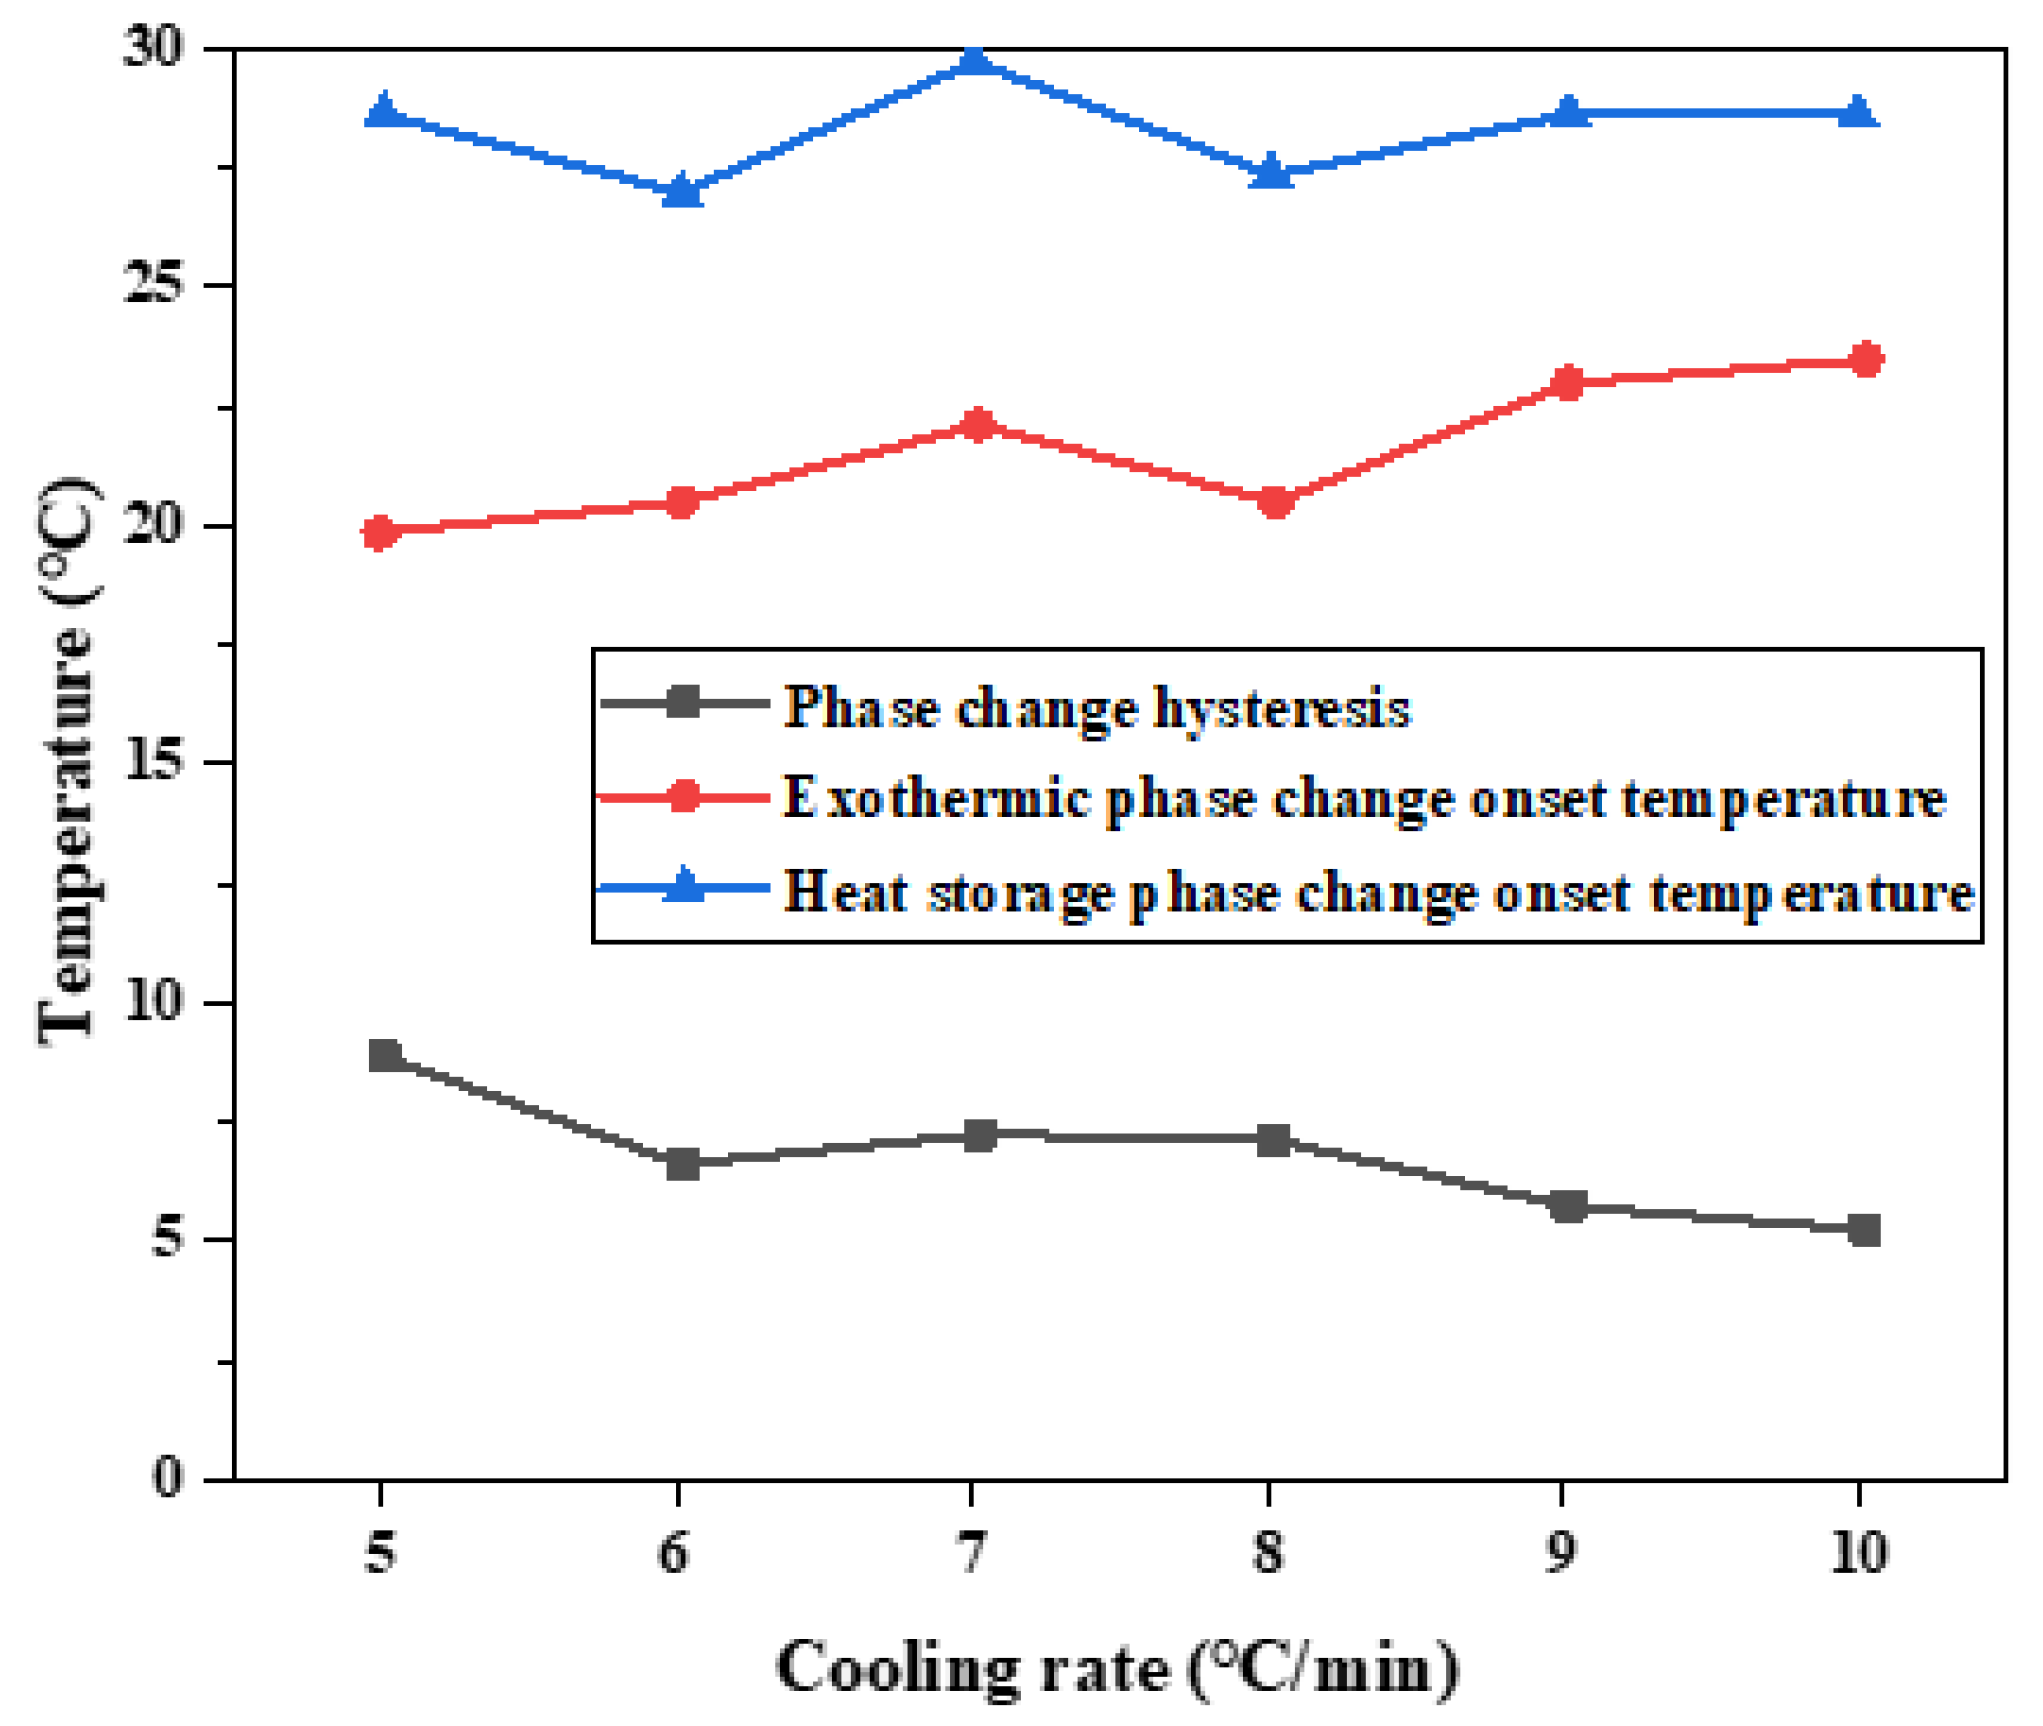
3.3. Effect of Cooling Rate on Hysteresis Characteristics of Phase Transition
3.3.1. The Experimental Operation
3.3.2. Analysis of Experimental Results
Cooling Curve Analysis
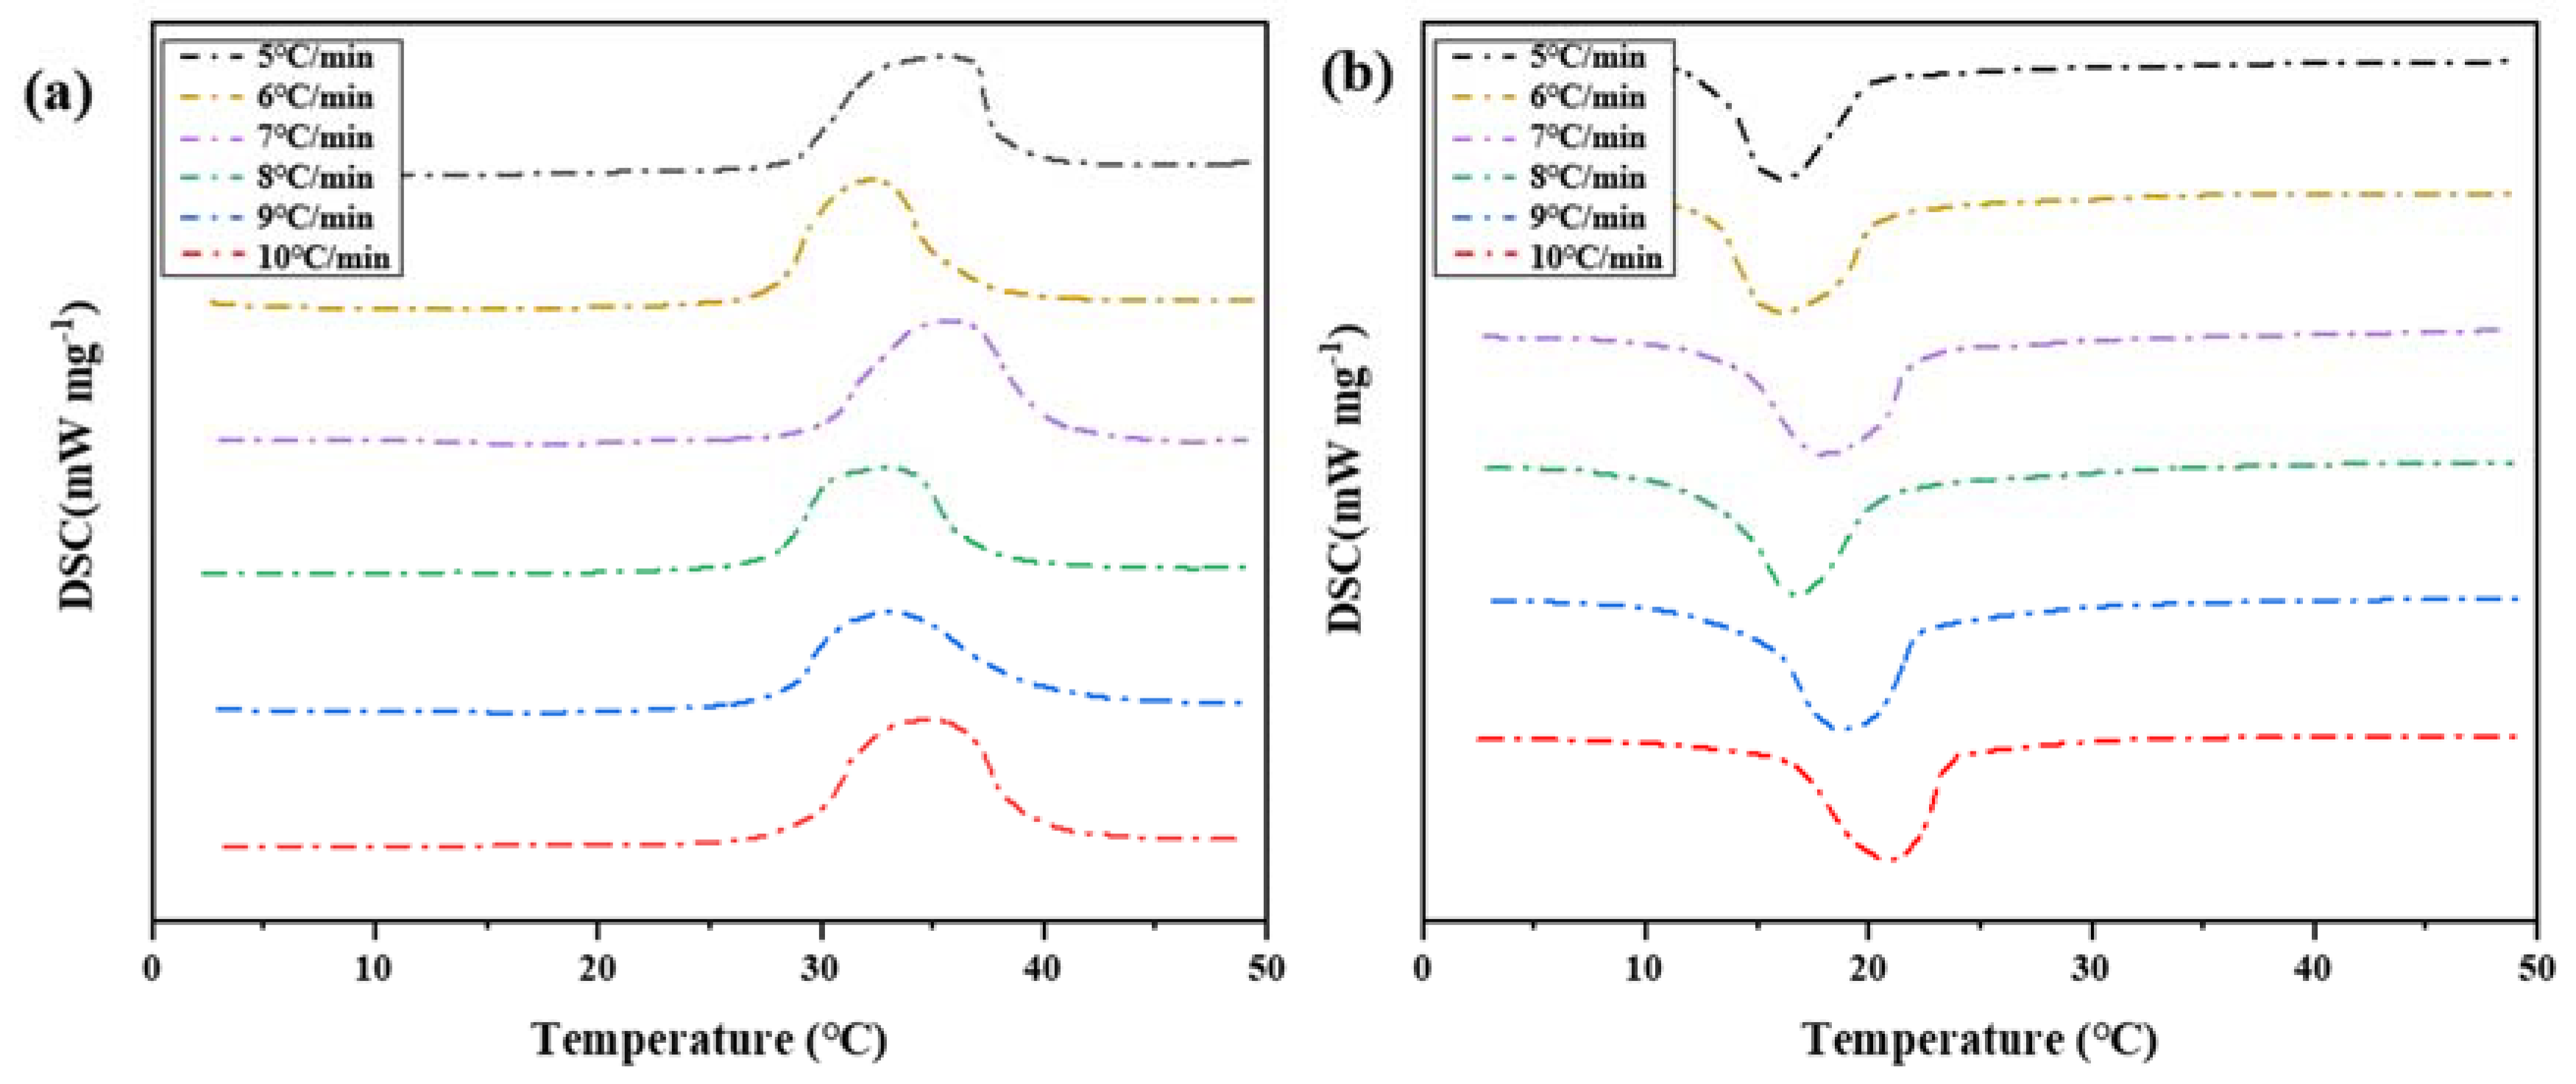
DSC Curve Analysis
4. Conclusions
- (1)
- Heat storage temperature is an influential factor affecting the hysteresis of phase transition of energy storage materials, and the hysteresis degree of phase transition of energy storage materials will change with the change of heat storage temperature. Through the step cooling experiment and differential scanning calorimeter test, the same results are obtained: within the allowed heating range, the higher the heat storage temperature is set, the smaller the difference of phase transition hysteresis temperature of the energy storage material is, and the smaller the phase transition hysteresis degree of the energy storage material is;
- (2)
- The final cooling temperature is a factor that affects the hysteresis of phase transformation of energy storage materials. The hysteresis of phase transformation of energy storage materials will be changed by changing the terminal temperature of the cooling process. The step cooling curve obtained by the temperature collector is consistent with the DSC curve obtained by the differential scanning calorimeter: the lower the cooling end temperature is set, the greater the temperature lag difference of the energy storage material is, and the greater the phase transition lag degree of the energy storage material is. The cooling rate during the cooling process is an important factor affecting the hysteresis of phase transformation of energy storage materials. Cooling curves which are obtained by temperature acquisition instrument, and obtained by differential scanning calorimeter DSC curve of the conclusion, the conclusion is the same: as the cooling rate drop, the temperature difference of energy storage materials varies with the cooling rate, set a lower cooling rate, the temperature of the energy storage material lags behind the difference, the greater the higher the degree of transformation hysteresis;
- (3)
- The homogeneous heat transfer of phase change materials greatly affects the hysteresis of phase change. The slow heating and cooling of phase change materials can complete the phase change process well and avoid the phenomenon of phase change hysteresis. Factors affecting the heat transfer process of phase change materials will affect the phenomena after phase change, which is also a future research direction.
Author Contributions
Funding
Institutional Review Board Statement
Informed Consent Statement
Data Availability Statement
Acknowledgments
Conflicts of Interest
References
- Tian, S.M.; Luan, W.P.; Zhang, D.X.; Yaojie, S. Energy Internet technology forms and key technologies. Proc. CSEE 2015, 35, 3482–3494. [Google Scholar]
- Yang, X.P.; Yang, X.X.; Ding, J.; Qin, G.F.; Jiang, R.H. Thermal Performance Analysis of High Temperature Phase Change Heat Storage System. J. Eng. Thermophys. 2013, 34, 513–516. [Google Scholar]
- Liu, L.; Ye, H.W. Development of heat storage materials at home and abroad. Lanhua Technol. 1998, 16, 168–171. [Google Scholar]
- Kim, K.B.; Choi, K.W.; Kim, Y.J.; Lee, K.H.; Lee, K.S. Feasibility Study on a Novel Cooling Technique Using a Phase Change Material in an Automotive Engine. Energy 2010, 35, 478–484. [Google Scholar] [CrossRef]
- Hasan, A.; McCormack, S.; Huang, M.J.; Norton, B. Evaluation of phase change materials for thermal regulation enhancement of building integrated photovoltaics. Sol. Energy 2010, 84, 1601–1612. [Google Scholar] [CrossRef] [Green Version]
- Huang, Z.; Luo, Z.; Gao, X.; Fang, X.; Fang, Y.; Zhang, Z. Investigations on the Thermal Stability, Long-Term Reliability of LiNO3/KCl–Expanded Graphite Composite as Industrial Waste Heat Storage Material and Its Corrosion Properties with Metals. Appl. Energy 2017, 188, 521–528. [Google Scholar] [CrossRef]
- Ping, P.; Peng, R.; Kong, D.; Chen, G.; Wen, J. Investigation on thermal management performance of PCM-fin structure for Li-ion battery module in high-temperature environment. Energy Convers. Manag. 2018, 176, 131–146. [Google Scholar] [CrossRef]
- Cozzolino, R.; Daniele, C.; Gino, B. Experimental Characterisation of a Novel Thermal Energy Storage Based on Open-Cell Copper Foams Immersed in Organic Phase Change Material. Energy Convers. Manag. 2019, 200, 112101. [Google Scholar] [CrossRef]
- Su, Y.; Zhu, W.; Tian, M.; Wang, Y.; Zhang, X.; Li, J. Intelligent Bidirectional Thermal Regulation of Phase Change Material Incorporated in Thermal Protective Clothing. Appl. Therm. Eng. 2020, 174, 115340. [Google Scholar] [CrossRef]
- Liu, L.; Zhang, X.L.; Xu, X.F.; Zhao, Y.; Zhang, S.H. The research progress on phase change hysteresis affecting the thermal characteristics of PCMs: A review. J. Mol. Liq. 2020, 317, 113760. [Google Scholar] [CrossRef]
- Hussein, A.; Payam, N.; Muhd, Z.A.; Wahid, M.A.; Jomehzadeh, F.; Famileh, I.Z.; Calautit, J.K.; Hughes, B.R.; Zaki, S.A. A review on phase change material (PCM) for sustainable passive cooling in building envelopes. Renew. Sustain. Energy Rev. 2016, 60, 1470–1497. [Google Scholar]
- Aiki, T.; Minchev, E.; Okazaki, T. Mathematical models for phase change problems with hysteresis effect. Nonlinear Anal. 2005, 63, 1185–1198. [Google Scholar] [CrossRef]
- Ziskind, G. Modelling of Heat Transfer in Phase Change Materials (Pcms) for Thermal Energy Storage Systems. In Advances in Thermal Energy Storage Systems; Woodhead Publishing: Sawston, UK, 2015; pp. 307–324. [Google Scholar]
- Zahir, M.H.; Mohamed, S.A.; Saidur, R.; Al-Sulaiman, F.A. Supercooling of phase-change materials and the techniques used to mitigate the phenomenon. Appl. Energy 2019, 240, 793–817. [Google Scholar] [CrossRef]
- Beaupere, N.; Soupremanien, U.; Zalewski, L. Nucleation triggering methods in supercooled phase change materials (PCM), a review. Thermochim. Acta 2018, 670, 184–201. [Google Scholar] [CrossRef]
- Peng, S.Q.; Huang, J.; Wang, T.Y.; Zhu, P. Effect of fumed silica additive on supercooling, thermal reliability and thermal stability of Na2HPO4·12H2O as inorganic PCM. Thermochim. Acta 2019, 675, 1–8. [Google Scholar] [CrossRef]
- Zhou, G.B.; Zhu, M.C.; Xiang, Y.T. Effect of percussion vibration on solidification of supercooled salt hydrate PCM in thermal storage unit. Renew. Energy 2018, 126, 537–544. [Google Scholar] [CrossRef]
- Zhou, G.B.; Xiang, Y.T. Experimental investigations on stable supercooling performance of sodium acetate trihydrate PCM for thermal storage. Sol. Energy 2017, 155, 1261–1272. [Google Scholar] [CrossRef]
- Zhou, G.B.; Han, Y.W. Numerical simulation on thermal characteristics of supercooled salt hydrate PCM for energy storage: Multiphase model. Appl. Therm. Eng. 2017, 125, 145–152. [Google Scholar] [CrossRef]
- Liu, Y.D.; Li, X.; Hu, P.F.; Hu, G. Study on the supercooling degree and nucleation behavior of water-based graphene oxide nanofluids PCM. Int. J. Refrig. 2015, 50, 80–86. [Google Scholar] [CrossRef]
- Saleh, N.A.; Zhai, Z.Q. Modeling phase change materials embedded in building enclosure: A review. Renew. Sustain. Energy Rev. 2013, 21, 659–673. [Google Scholar]
- Maha, A.; André, B.; Hébert, S.; Quenard, D. Experimental investigation and computer simulation of thermal behaviour of wallboards containing a phase change material. Energy Build. 2005, 38, 357–366. [Google Scholar]
- Paulo, C.T.; Craig, C.; Marcus, B. Verification and validation of EnergyPlus phase change material model for opaque wall assemblies. Build. Environ. 2012, 54, 186–196. [Google Scholar]
- Giuseppina, B.; Gianluca, S.; Ylenia, C. Enthalpy-temperature Evaluation of Slurry Phase Change Materials with T-history Method. Energy Procedia 2015, 78, 1877–1882. [Google Scholar]
- Kuznik, F.; Virgone, J. Experimental investigation of wallboard containing phase change material: Data for validation of numerical modeling. Energy Build. 2008, 41, 561–570. [Google Scholar] [CrossRef]
- Sandy, K.; Chantal, M.; Khalil, E.K.; Flavia, K. Examination and optimization of the design parameters for the thermal hysteresis phenomenon of the phase change material. In Proceedings of the 2021 IEEE 3rd International Multidisciplinary Conference on Engineering Technology (IMCET) 2021, Beirut, Lebanon, 8–10 December 2021; pp. 167–172. [Google Scholar]
- Moreles, E.; Huelsz, G.; Barrios, G. Hysteresis Effects on the Thermal Performance of Building Envelope Pcm-Walls. Build. Simul. 2018, 11, 519–531. [Google Scholar] [CrossRef]
- Zálešák, M.; Pavel, C.; Lubomír, K. Identification of the Effective Heat Capacity–Temperature Relationship and the Phase Change Hysteresis in Pcms by Means of an Inverse Heat Transfer Problem Solved with Metaheuristic Methods. Appl. Therm. Eng. 2021, 197, 117392. [Google Scholar] [CrossRef]
- Delcroix, B.; Kummert, M.; Daoud, A.; Bouchard, J. Influence of experimental conditions on measured thermal properties used to model phase change materials. Build. Simul. 2015, 8, 637–650. [Google Scholar] [CrossRef]
- Hsu, T.H.; Chung, C.H.; Chung, F.J.; Chang, C.C.; Lu, M.C.; Chueh, Y.L. Thermal hysteresis in phase-change materials: Encapsulated metal alloy core-shell microparticles. Nano Energy 2018, 51, 563–570. [Google Scholar] [CrossRef]
- Ali, A.; Miroslava, K. Application and sensitivity analysis of the phase change material hysteresis method in Energy Plus: A case study. Appl. Therm. Eng. 2019, 162, 114222. [Google Scholar]
- Karthikeyan, K.; An, J.L.; Yang, J.L.; Yang, E.H. Novel Cfd-Based Numerical Schemes for Conduction Dominant Encapsulated Phase Change Materials (Epcm) with Temperature Hysteresis for Thermal Energy Storage Applications. Energy 2017, 132, 31–40. [Google Scholar]


| Equipment | Model | Precision |
|---|---|---|
| Precision electronic balance | MSl05DU | ±0.01 mg |
| Electronic balance | FA2004 | ±0.1 mg |
| Differential scanning calorimeter | DSC200F3 | <0.1 °C |
| Agilent data acquisition instrument | 34972A | ±0.01 °C |
| High and low temperature thermostatic water tank | DC-6515 | ±0.01 °C |
| Alternating high and low temperature impact chamber | YSGJW-100C | ±0.5 °C |
| Scanning electron microscope | KYKY-EM6000 | — |
| Low temperature drying oven | DECD-80 | ±0.1 °C |
| Magnetic stirrer | 90–2 | — |
| T-thermocouple | — | ±0.05 °C |
| Thermal conductivity tester | TPS 2500s | ±3% |
| Thermocouple spot welder | — | — |
| Beaker, dropper, test tube, etc. | — | — |
| Fourier infrared spectrometer | TENSOR37 | 8000–350 |
| X-ray diffractometer | DX-2700 | ≤0.001° |
| Electric blast drying oven | DHG-9140A | ±0.1 °C |
| Ultrasonic breaker | WM-1000 |
| Serial Number | Melting Process | Crystallization Process | |||
|---|---|---|---|---|---|
| Initial Temperature (°C) | Melting Enthalpy (J/g) | Initial Temperature of Solidification (°C) | Crystallization Enthalpy (J/g) | Temperature Difference (°C) | |
| 1 (Heating to 50 °C) | 28.01 | 173.40 | 23.08 | 145.20 | 4.92 |
| 2 (Heating to 60 °C) | 27.50 | 169.30 | 23.86 | 144.10 | 3.64 |
| 3 (Heating to 70 °C) | 25.60 | 173.50 | 22.47 | 128.60 | 3.13 |
| 4 (Heating to 80 °C) | 23.80 | 175.20 | 21.86 | 136.90 | 1.94 |
| Different Cooling Temperature (°C) | 10 | 8 | 6 | 4 | 2 | 0 |
|---|---|---|---|---|---|---|
| Initial temperature of melting phase transition (°C) | 25.43 | 25.44 | 25.97 | 25.85 | 25.07 | 26.04 |
| Initial temperature of solidification phase transition (°C) | 23.99 | 23.25 | 23.29 | 22.48 | 21.21 | 21.91 |
| Temperature lag difference (°C) | 1.44 | 2.20 | 2.68 | 3.37 | 3.86 | 4.13 |
| Serial Number | Melting Process | Crystallization Process | Temperature Difference (°C) | ||
|---|---|---|---|---|---|
| Initial Temperature (°C) | Melting Enthalpy (J/g) | Initial Temperature of Solidification (°C) | Crystallization Enthalpy (J/g) | ||
| 1 (Cooling to 10 °C) | 26.50 | 151.90 | 21.60 | 158.20 | 4.90 |
| 2 (Cooling to 8 °C) | 26.20 | 172.60 | 20.10 | 167.10 | 6.10 |
| 3 (Cooling to 6 °C) | 26.30 | 164.80 | 19.50 | 140.20 | 6.80 |
| 4 (Cooling to 4 °C) | 26.40 | 154.60 | 19.60 | 131.70 | 6.80 |
| 5 (Cooling to 2 °C) | 26.90 | 167.40 | 20.60 | 146.30 | 6.30 |
| 6 (Cooling to 0 °C) | 27.30 | 170.80 | 20.10 | 153.40 | 7.20 |
| Different Wind Speed | 1/2.5 m/s | 2/3.5 m/s | 3/4.5 m/s | 4/5.5 m/s |
|---|---|---|---|---|
| Initial melting temperature (°C) | 28.30 | 27.80 | 28.90 | 28.30 |
| Crystallization initiation temperature (°C) | 22.04 | 22.03 | 26.85 | 27.81 |
| Temperature lag difference (°C) | 6.26 | 5.77 | 1.45 | 0.49 |
| Serial Number | Melting Process | Crystallization Process | |||
|---|---|---|---|---|---|
| Initial Temperature (°C) | Melting Enthalpy (J/g) | Initial Temperature of Solidification (°C) | Crystallization Enthalpy (J/g) | Temperature Difference (°C) | |
| 1 (5 °C/min) | 28.70 | 116.80 | 19.84 | 102.90 | 8.86 |
| 2 (6 °C/min) | 27.00 | 126.00 | 20.40 | 104.10 | 6.59 |
| 3 (7 °C/min) | 29.80 | 143.40 | 22.14 | 104.60 | 7.26 |
| 4 (8 °C/min) | 27.40 | 131.10 | 20.41 | 106.20 | 6.99 |
| 5 (9 °C/min) | 28.50 | 142.10 | 22.91 | 107.90 | 5.59 |
| 6 (10 °C/min) | 28.57 | 172.40 | 23.45 | 143.00 | 5.12 |
Publisher’s Note: MDPI stays neutral with regard to jurisdictional claims in published maps and institutional affiliations. |
© 2022 by the authors. Licensee MDPI, Basel, Switzerland. This article is an open access article distributed under the terms and conditions of the Creative Commons Attribution (CC BY) license (https://creativecommons.org/licenses/by/4.0/).
Share and Cite
Lu, D.; Xu, X.; Zhang, X.; Xie, W.; Gao, Y. Study on Influencing Factors of Phase Transition Hysteresis in the Phase Change Energy Storage. Materials 2022, 15, 2775. https://doi.org/10.3390/ma15082775
Lu D, Xu X, Zhang X, Xie W, Gao Y. Study on Influencing Factors of Phase Transition Hysteresis in the Phase Change Energy Storage. Materials. 2022; 15(8):2775. https://doi.org/10.3390/ma15082775
Chicago/Turabian StyleLu, Dingyu, Xiaofeng Xu, Xuelai Zhang, Wenhao Xie, and Yintao Gao. 2022. "Study on Influencing Factors of Phase Transition Hysteresis in the Phase Change Energy Storage" Materials 15, no. 8: 2775. https://doi.org/10.3390/ma15082775
APA StyleLu, D., Xu, X., Zhang, X., Xie, W., & Gao, Y. (2022). Study on Influencing Factors of Phase Transition Hysteresis in the Phase Change Energy Storage. Materials, 15(8), 2775. https://doi.org/10.3390/ma15082775