
Investigation of the Difference in the Pulse Current in the Double Pulsed Gas Metal Arc Welding of Aluminum Alloys

Abstract
:1. Introduction
2. Materials and Methods
2.1. Methods
- , , ;
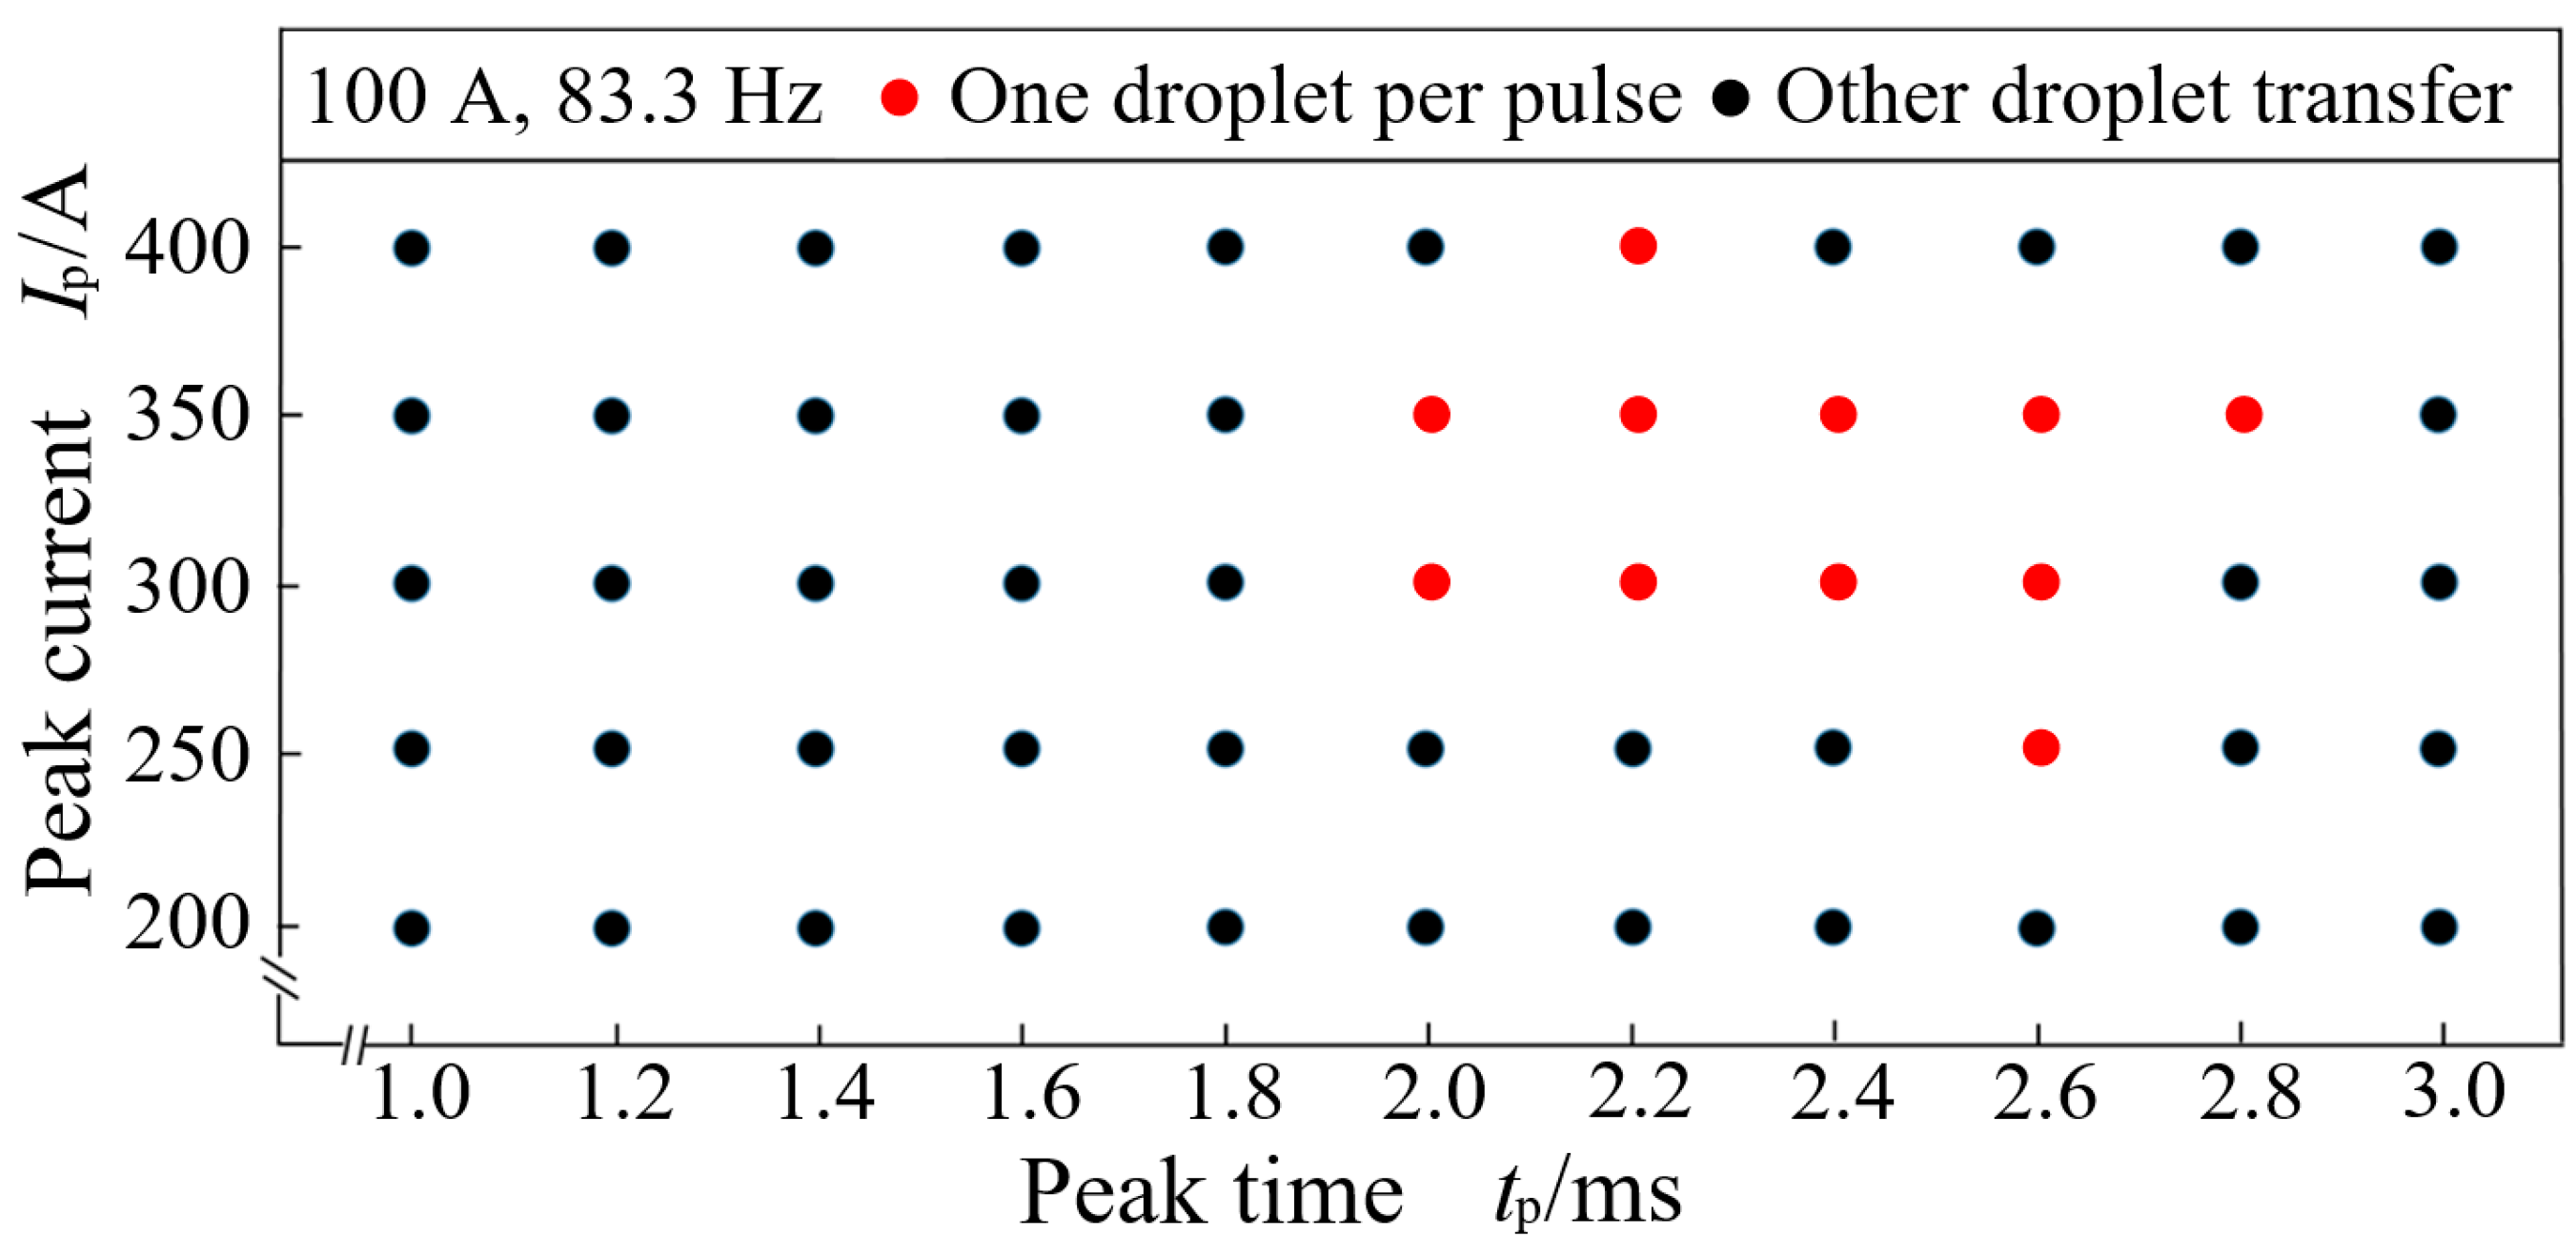
- The point (, ) and the point (, ) are located in the droplet transfer zone of one droplet per pulse;
- The pulse base current is mainly used to maintain the arc combustion, and the pulse peak current is mainly used to melt the filler wire.
2.2. Experiment Conditions
3. Results and Discussion
3.1. The Analysis of Electrical Signals and Weld Bead Shapes
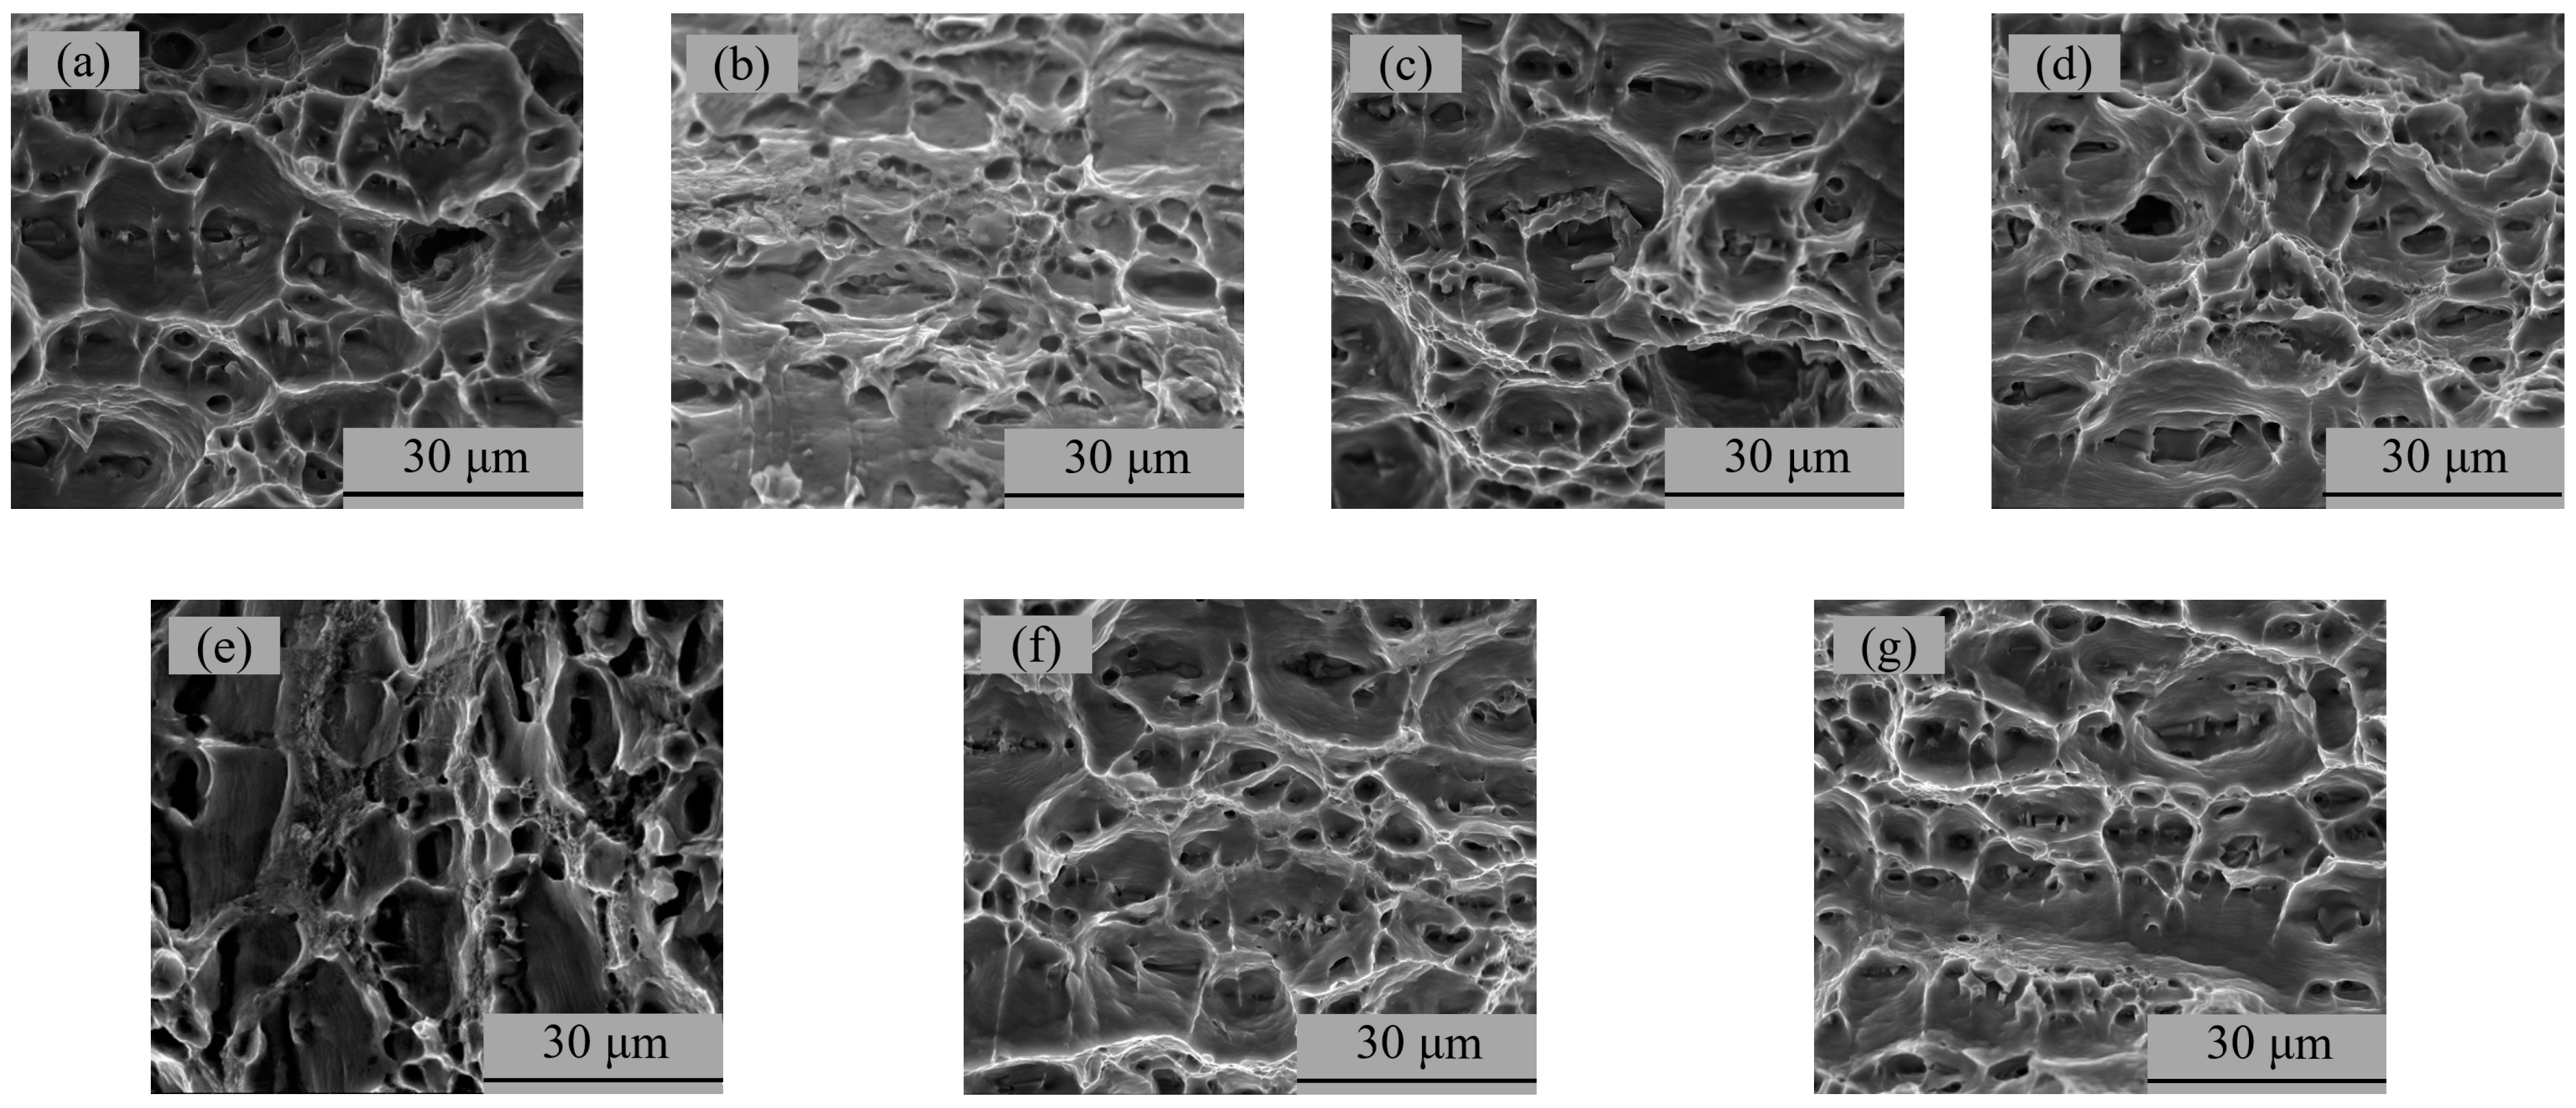
3.2. Properties of the Metallographic Samples
3.3. Mechanical Properties
4. Conclusions
- (1)
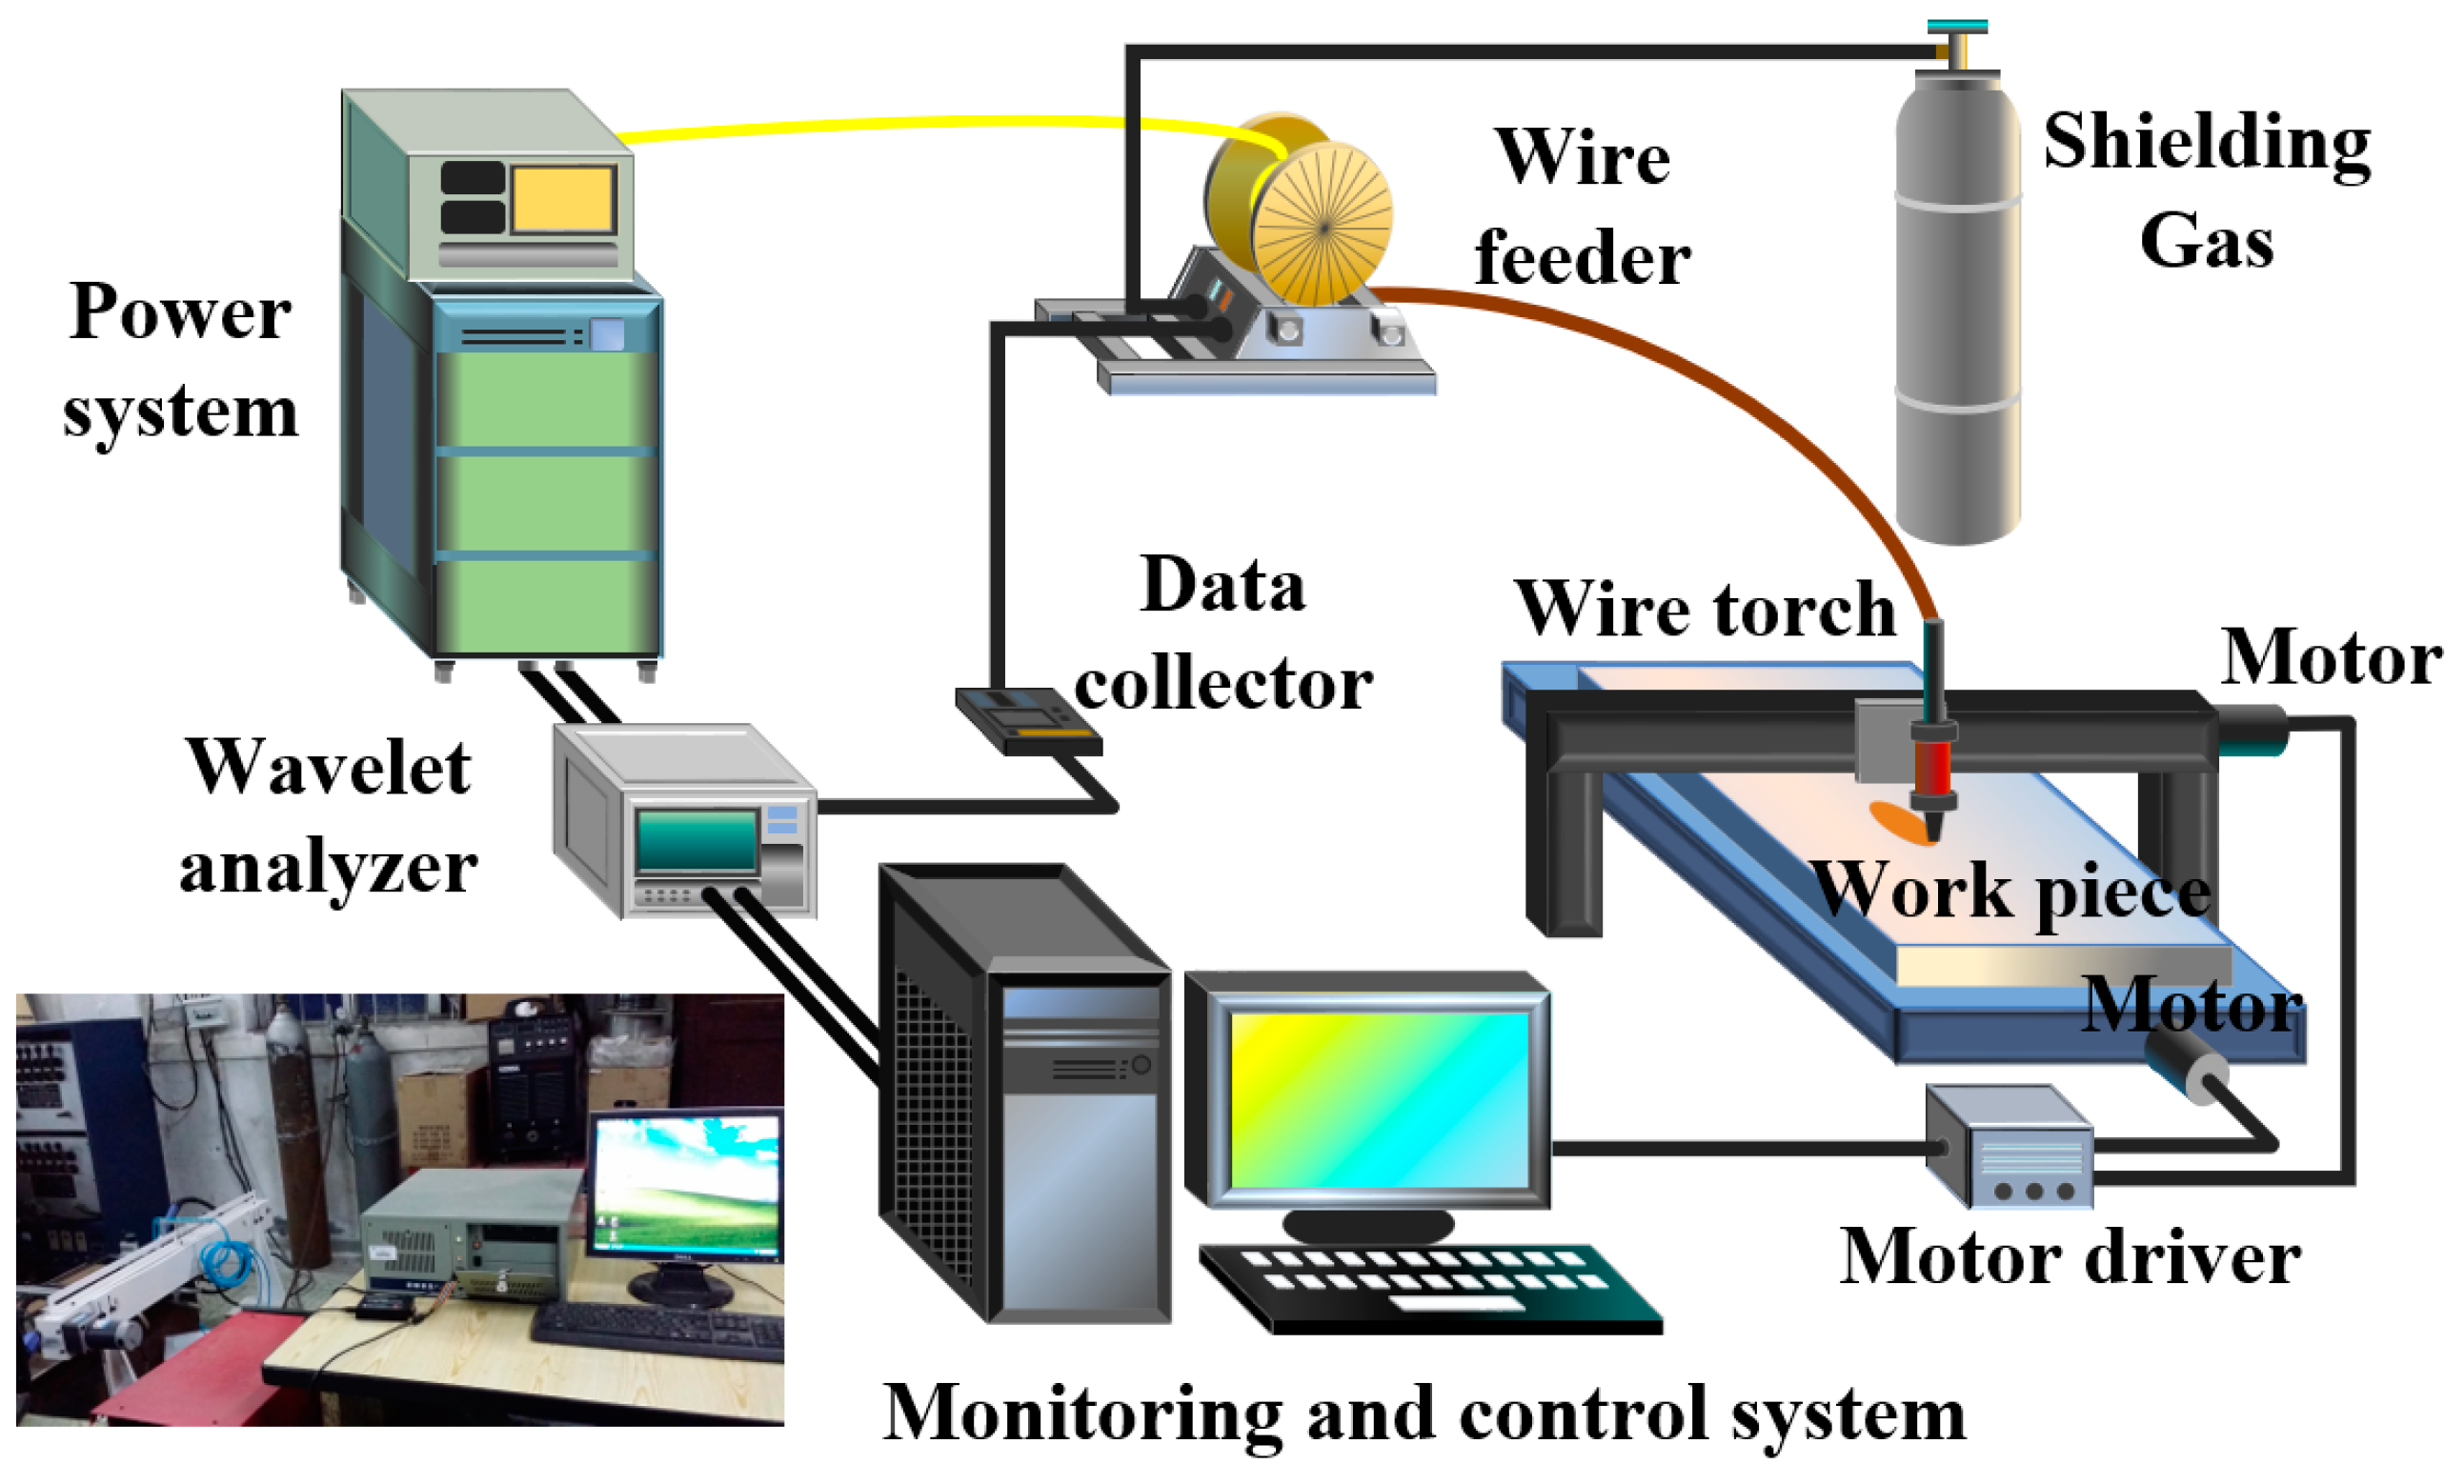
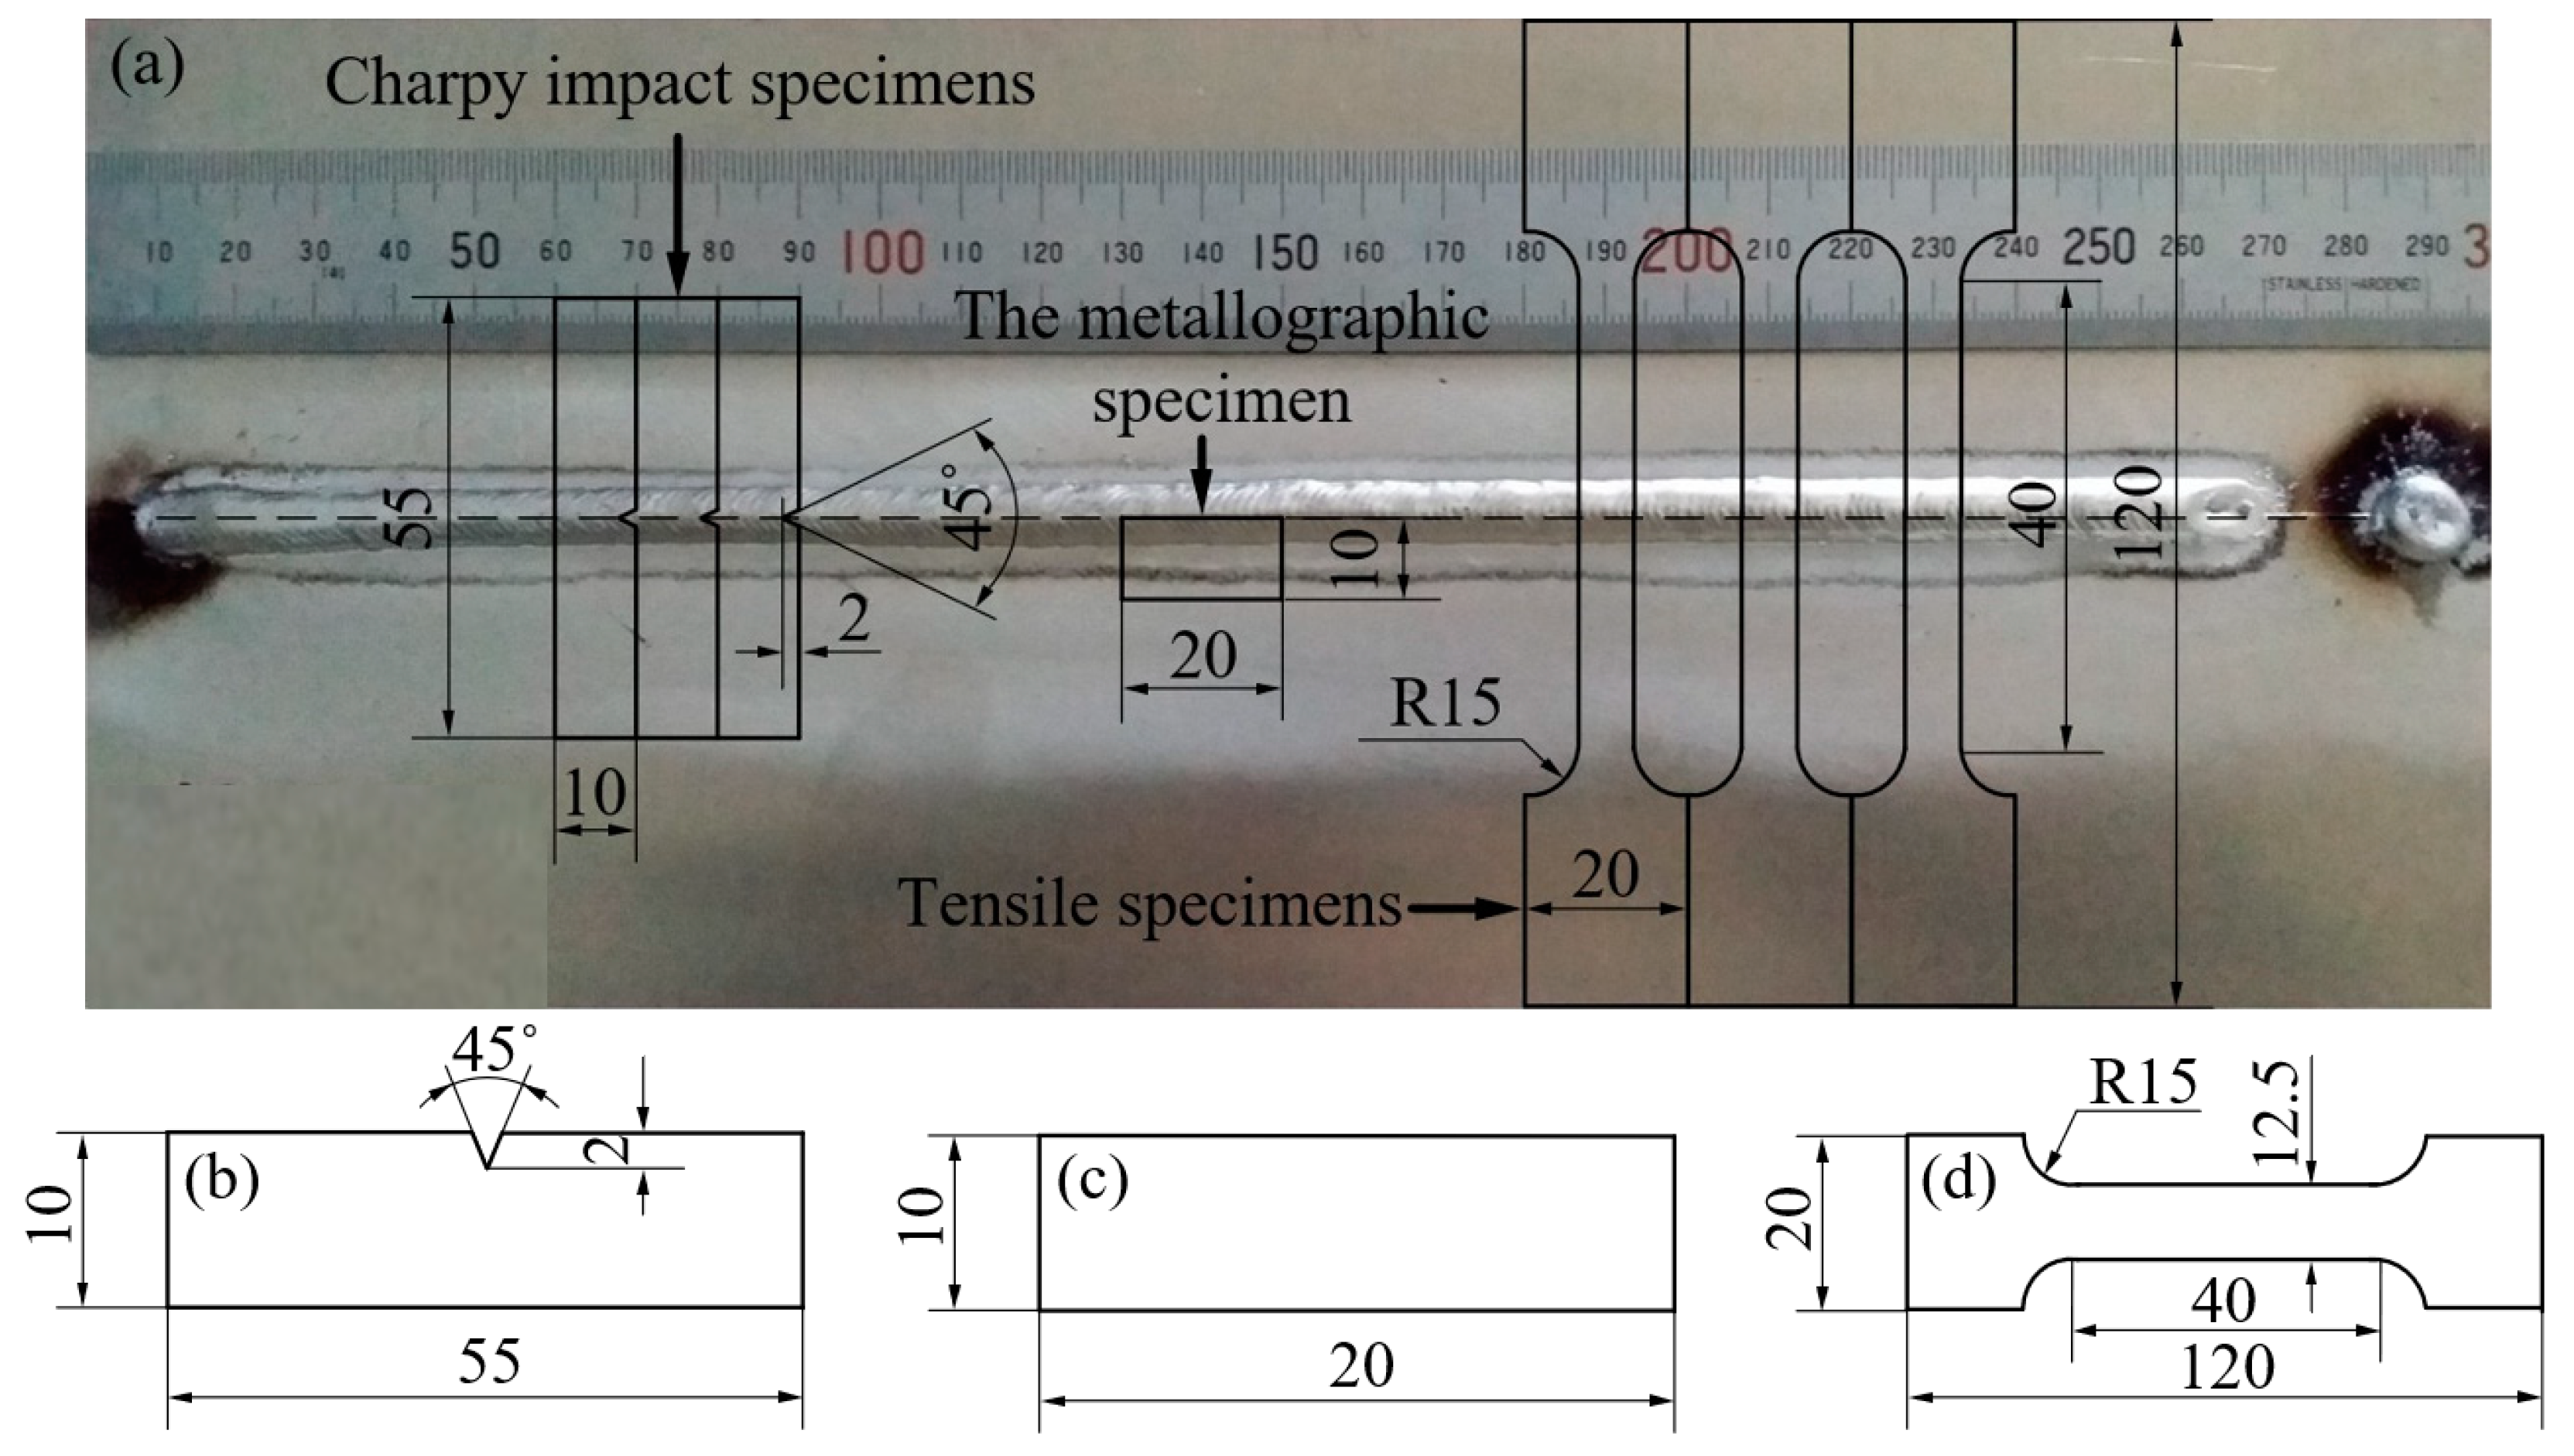
- When the average current, the thermal frequency and welding speed were equal and the point (, ) was located in the zone of one droplet per pulse, the DP-GMAW experiments were carried out for specimens A01–A07 and specimens B01–B07. The electrical signals of DP-GMAW were collected by the wavelet analyzer. By comparing the results of their electrical signals, it was observed that the welding process of specimens A01–A07 was more stable than that of specimens B01–B07.
- (2)
- The weld bead shape is significantly influenced by the basic welding parameters of DP-GMAW. Specimens A01–A07 had different values of and their weld formations were wonderful, showing beautiful fish scale ripples. Specimens B01–B07 had different values of , while their weld formations were much worse with many welding defects, such as spatters, infusions, large drops and discontinuity of the weld.
- (3)
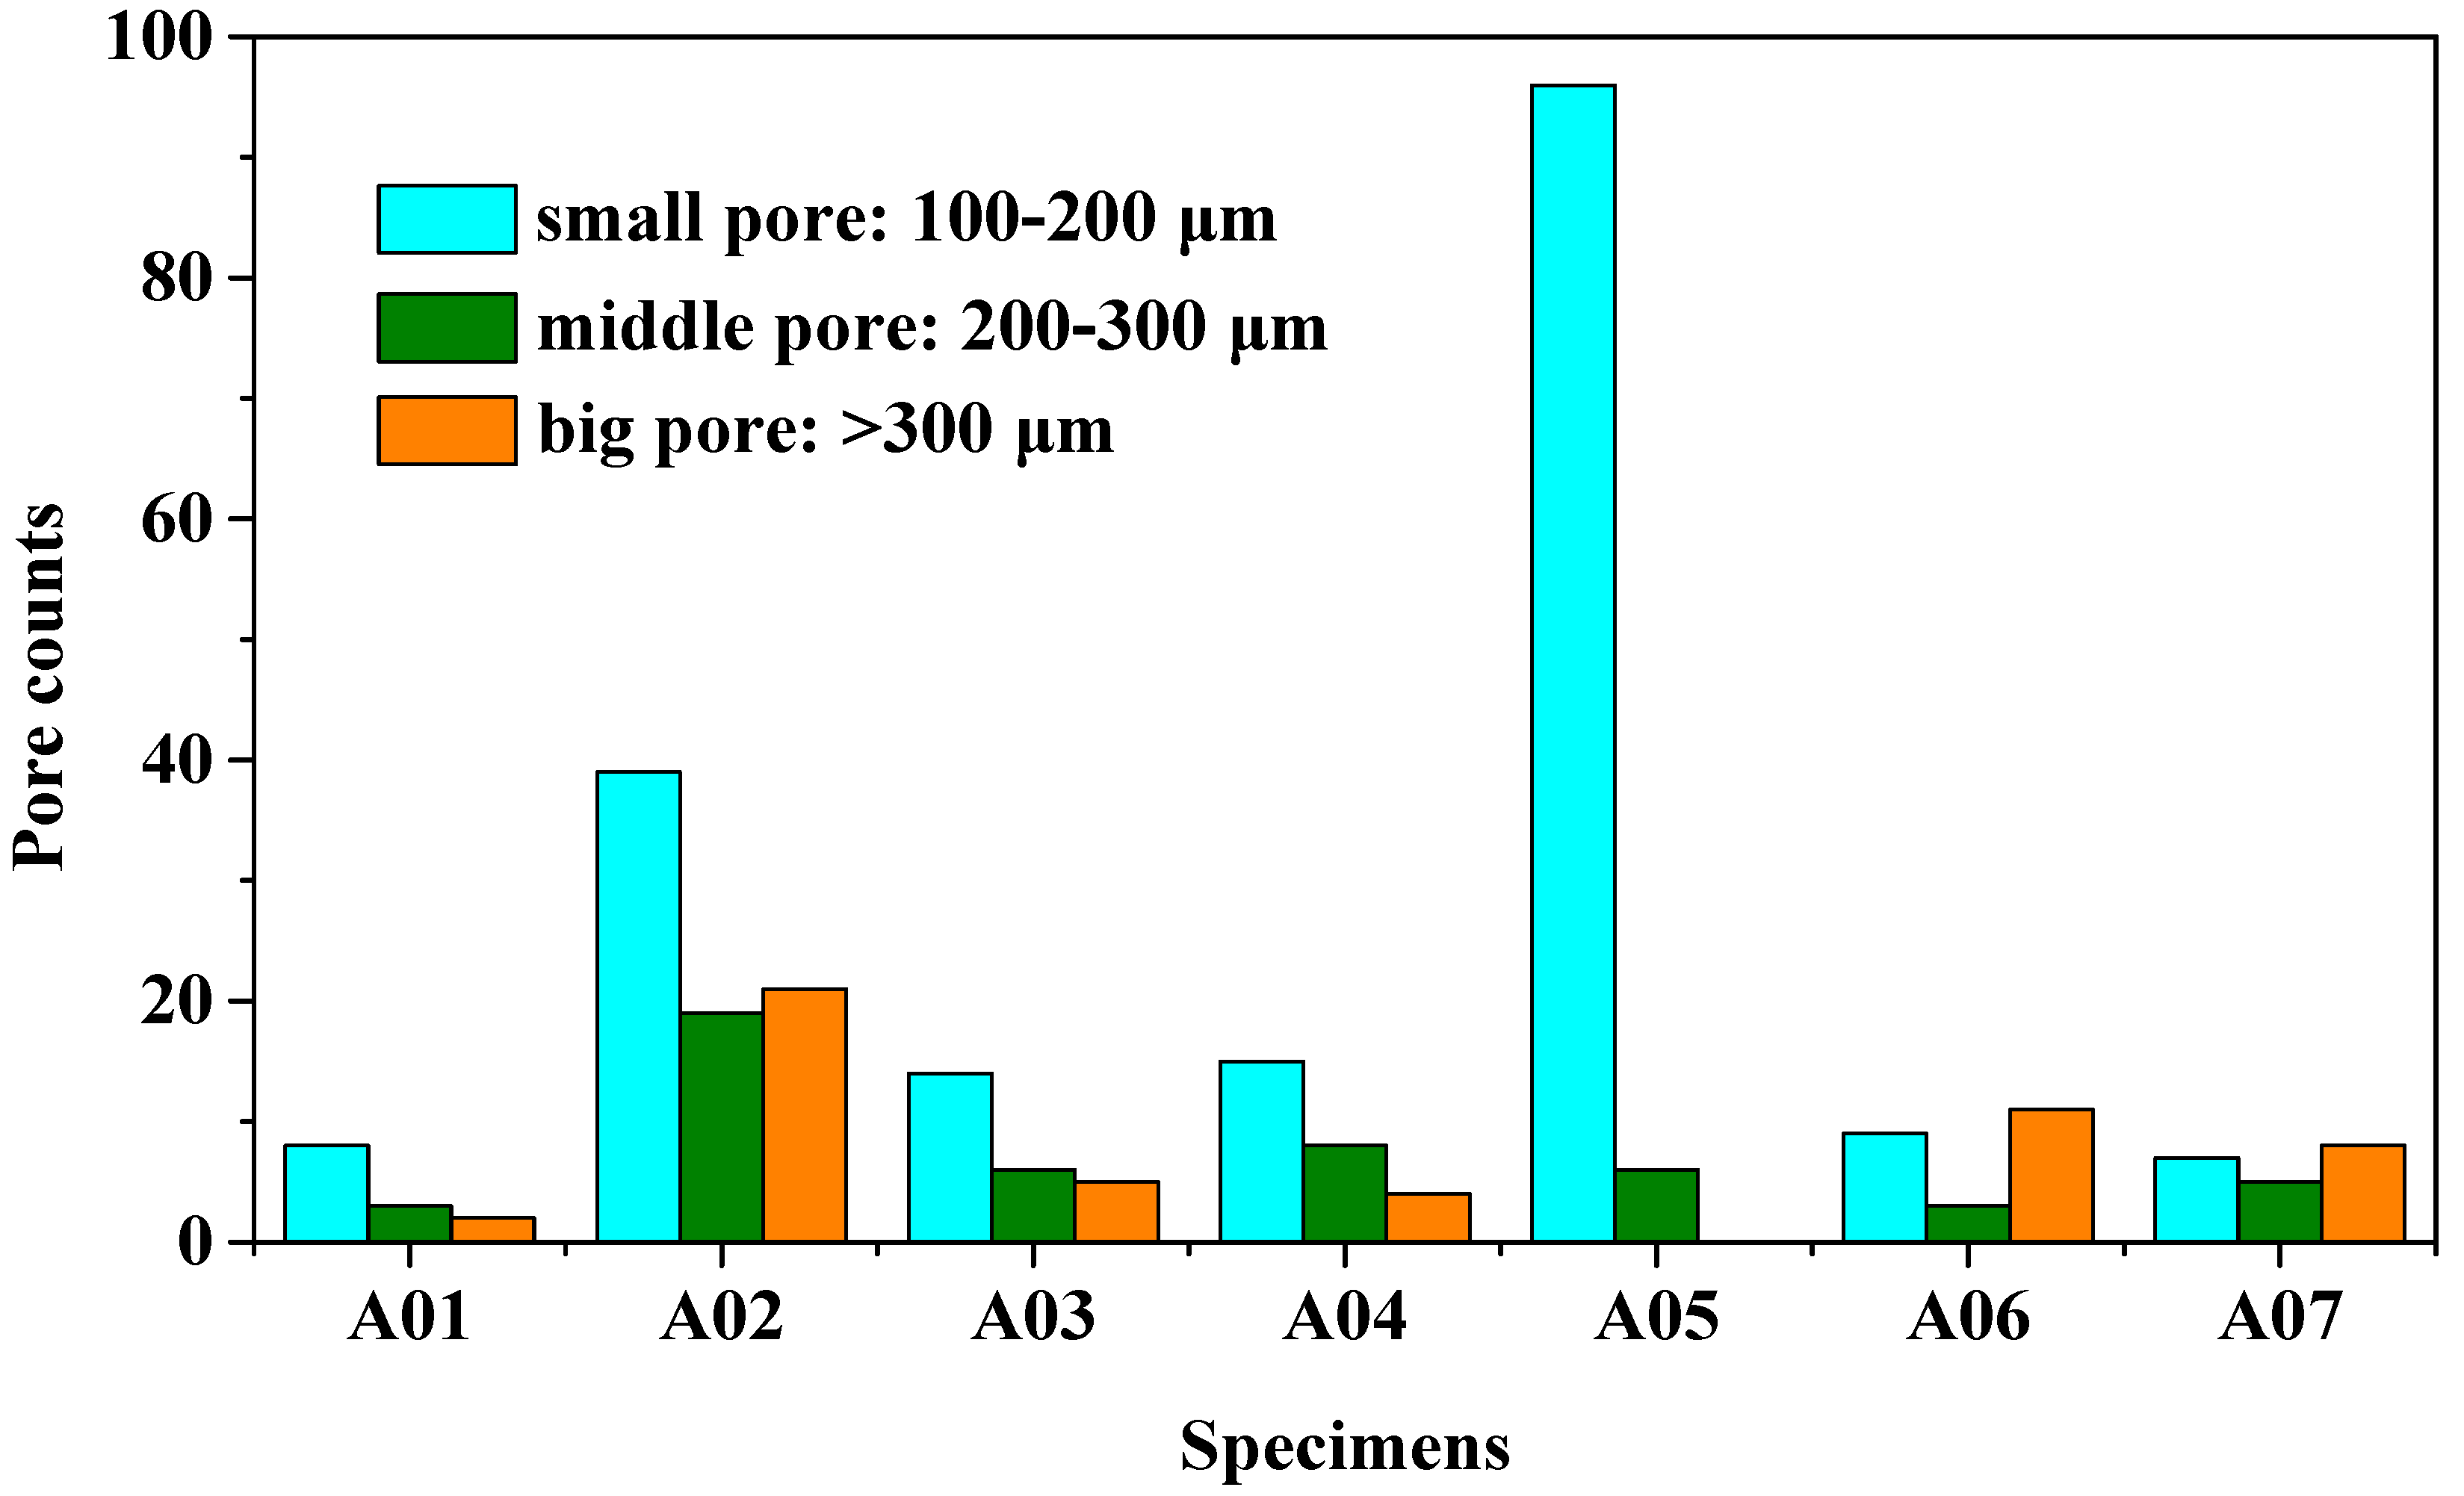
- There were some differential pores in specimens A01–A07. When was 20 A, the weld joint had the most middle pores and big pores among specimens A01–A07. The impact performance of specimen A02 was the worst, at only 28.7% of the base metal. Meanwhile, specimen A02 had the weakest tensile properties among specimens A01–A07: its tensile strength, yield strength and elongation were only 58.1%, 50% and 35.5% of the base metal.
- (4)
- When was 10 A, 20 A, 30 A, 40 A, 50 A, 60 A and 70 A, the weld formation was beautiful and the absorbed energy, the yield strength, tensile strength and elongation of the welded joints were relatively close. The average absorbed work, maximum tensile strength, yield strength and elongation of specimens A01–A07 were 31.1%, 60.2%, 52.9% and 37.9% of the base metal, respectively.
- (5)
- Changing can easily lead to welding instability, which is not suitable for constructing the DP-GMAW expert database of aluminum alloy. Moreover, changing can obtain beautiful weld formations and excellent joint performances, which are suitable for constructing the DP-GMAW expert database of aluminum alloys.
Author Contributions
Funding
Institutional Review Board Statement
Informed Consent Statement
Data Availability Statement
Conflicts of Interest
References
- Wang, L.; Wei, H.; Xue, J.; DebRoy, T. Special features of double pulsed gas metal arc welding. J. Mater. Process. Technol. 2018, 251, 369. [Google Scholar] [CrossRef]
- Wang, L.; Wei, H.; Xue, J.; DebRoy, T. A pathway to microstructural refinement through double pulsed gas metal arc welding. Scr. Mater. 2017, 134, 61. [Google Scholar] [CrossRef]
- Cao, X.; Yi, Z.; Xu, C.; Luo, Z.; Duan, J. Study on laser/DP-MIG hybrid welding-brazing of aluminum to Al-Si coated boron steel. J. Manuf. Process. 2021, 64, 333. [Google Scholar] [CrossRef]
- Yao, P.; Zhou, K.; Tang, H. Effects of operational parameters on the characteristics of ripples in double-pulsed GMAW process. Materials 2019, 12, 2767. [Google Scholar] [CrossRef] [PubMed] [Green Version]
- Liu, G.; Han, S.; Tang, X.; Cui, H. Effects of torch configuration on arc interaction behaviors and weld defect formation mechanism in tandem pulsed GMAW. J. Manuf. Process. 2021, 62, 729. [Google Scholar] [CrossRef]
- Rosli, N.A.; Alkahari, M.R.; Abdollah, M.F.; Maidin, S.; Ramli, F.R.; Herawan, S.G. Review on effect of heat input for wire arc additive manufacturing process. J. Mater. Res. Technol. 2021, 11, 2127. [Google Scholar] [CrossRef]
- Sathishkumar, M.; Bhakat, Y.J.; Kumar, K.G.; Giribaskar, S.; Oyyaravelu, R.; Arivazhagan, N.; Manikandan, M. Investigation of double-pulsed gas metal arc welding technique to preclude carbide precipitates in aerospace grade hastelloy X. J. Mater. Eng. Perform. 2021, 30, 661. [Google Scholar] [CrossRef]
- Pattanayak, S.; Sahoo, S.K. Gas metal arc welding based additive manufacturing—A review. CIRP J. Manuf. Sci. Technol. 2021, 33, 398. [Google Scholar] [CrossRef]
- Liu, A.; Tang, X.; Lu, F. Study on welding process and prosperities of AA5754 Al-alloy welded by double pulsed gas metal arc welding. Mater. Design. 2013, 50, 149. [Google Scholar] [CrossRef]
- Liu, A.; Tang, X.; Lu, F. Weld pool profile characteristics of Al alloy in double-pulsed GMAW. Int. J. Adv. Manuf. Technol. 2013, 68, 2015. [Google Scholar] [CrossRef]
- Jin, L.; Xu, M.; Xue, J.; Zhou, Y. Effect of line energy on properties of aluminum alloy joints in double pulsed MIG welding. Trans. China Weld. Inst. 2018, 39, 089. [Google Scholar]
- Sen, M.; Mukherjee, M.; Pal, T.K. Evaluation of correlations between DP-GMAW process parameters andbead geometry. Weld. J. 2015, 94, 265. [Google Scholar]
- Wu, K.; Ding, N.; Yin, T.; Zeng, M.; Liang, Z. Effects of single and double pulses on microstructure and mechanical properties of weld joints during high-power double-wire GMAW. J. Manuf. Process. 2018, 35, 728. [Google Scholar] [CrossRef]
- Wu, K.; Xie, P.; Zhan, J.; Zeng, M.; Liang, Z. Analysis of current phase influence on weld seam formation in double-wire DP-GMAW. J. Manuf. Process. 2019, 103, 4825. [Google Scholar] [CrossRef]
- Wu, K.; Zhan, J.; Cao, X.; Hong, X. Dynamic metal transfer behavior in double-wire DP-GMAW of aluminum alloy under different pulse phases. J. Manuf. Sci. Eng. 2021, 143, 041002. [Google Scholar] [CrossRef]
- Soltani, B.; Farnia, A.; Anijdan, S.H.M. The effect of thermal frequency and current amplitude on weldability, microstructural evolution and mechanical properties of AA7075 alloy joint in DP-GMAW process. Int. J. Adv. Manuf. Technol. 2021, 113, 1415. [Google Scholar] [CrossRef]
- Liu, X.; Yu, X.; Xue, J. Effect of double-pulse characteristics on weld bead formation and mechanical properties in metal inert gas welding. Metals 2021, 11, 995. [Google Scholar] [CrossRef]
- Yao, P.; Zhou, K.; Lin, H.; Xu, Z.; Yue, S. Exploration of weld bead forming rule during double-pulsed GMAW process based on grey relational analysis. Materials 2019, 12, 3662. [Google Scholar] [CrossRef] [PubMed] [Green Version]
- Mvola, B.; Kah, P.; Layus, P. Review of current waveform control effects on weld geometry in gas metal arc welding process. Int. J. Adv. Manuf. Technol. 2018, 96, 4243. [Google Scholar] [CrossRef]
- Wu, W.; Xue, J.; Jin, L.; Zhang, Z. Effect of modulating frequency in changing pulse numbers on aluminum alloy double pulsed welding. Trans. China Weld. Inst. 2019, 40, 126. [Google Scholar]
- Wu, C.; Chen, M.; Li, S. Analysis of excited droplet oscillation and detachment in active control of metal transfer. Comp. Mater. Sci. 2004, 31, 147. [Google Scholar] [CrossRef]
- Ghosh, P.K.; Dorn, L.; Hübner, M.; Goyal, V.K. Arc characteristics and behaviour of metal transfer in pulsed current GMA welding of aluminium alloy. J. Mater. Process. Technol. 2007, 194, 163. [Google Scholar] [CrossRef]
- Wu, K.; Zeng, Y.; Zhang, M.; Hong, X.; Xie, P. Effect of high-frequency phase shift on metal transfer and weld formation in aluminum alloy double-wire DP-GMAW. J. Manuf. Process. 2022, 75, 301. [Google Scholar] [CrossRef]
- Zhao, Y.; Chung, H. Influence of power source dynamics on metal and heat transfer behaviors in pulsed gas metal arc welding. Int. J. Heat Mass Tran. 2018, 121, 887. [Google Scholar] [CrossRef]
- Zhao, Y.; Lee, P.; Chung, H. Effect of pulsing parameters on drop transfer dynamics and heat transfer behavior in pulsed gas metal arc welding. Int. J. Heat Mass Tran. 2019, 129, 1110. [Google Scholar] [CrossRef]
- Ikram, A.; Chung, H. Numerical simulation of arc, metal transfer and its impingement on weld pool in variable polarity gas metal arc welding. J. Manuf. Process. 2021, 64, 1529. [Google Scholar] [CrossRef]
- Chen, H.; Xue, J.; Heng, G. A novel sine wave modulation method of pulse current during double wire MIG welding. Int. J. Adv. Manuf. Technol. 2017, 90, 3025. [Google Scholar] [CrossRef]
- Melakhsou, A.A.; Batton-Hubert, M. Welding monitoring and defect detection using probability density distribution and functional nonparametric kernel classifier. J. Intell. Manuf. 2021. [Google Scholar] [CrossRef]
- Zhang, W.; Hua, X.; Liao, W.; Wang, M. Behavior of the plasma characteristic and droplet transfer in CO2 laser–GMAW-P hybrid welding. Int. J. Adv. Manuf. Technol. 2014, 72, 935. [Google Scholar] [CrossRef]
- Li, J.; Li, H.; Wei, H.; Gao, Y. Effect of torch position and angle on welding quality and welding process stability in Pulse on Pulse MIG welding–brazing of aluminum alloy to stainless steel. Int. J. Adv. Manuf. Technol. 2016, 84, 705. [Google Scholar] [CrossRef]
- Thekkuden, D.T.; Santhakumari, A.; Sumesh, A.; Mourad, A.-H.I.; Rameshkumar, K. Instant detection of porosity in gas metal arc welding by using probability density distribution and control chart. Int. J. Adv. Manuf. Technol. 2018, 95, 4583. [Google Scholar] [CrossRef]
- Chen, G.; Xia, F.; Hu, Y.; Xiao, J. Relationship between the dendritic length and width of fusion zone in ZL114A casting alloy welding joints by laser-MIG hybrid welding. J. Mater. Eng. 2011, 11, 53. [Google Scholar]


| Materials /Elements | Si | Fe | Cu | Mn | Ti | Mg | Al |
|---|---|---|---|---|---|---|---|
| AA6061-T6 | 0.52 | 0.25 | 0.01 | 0.96 | 0.01 | 1.0 | Bal. |
| ER4043 | 6.0 | <0.60 | <0.30 | <0.15 | <0.15 | <0.20 | Bal. |
| No. | I (A) | Ips (A)/tps (ms) | Ibs (A)/tbs (ms) | N1 | Ipw (A)/tpw (ms) | Ibw (A)/tbw (ms) | N2 | ΔIb/A | ΔIp/A |
|---|---|---|---|---|---|---|---|---|---|
| A01 | 100 | 288/2.6 | 53/9.4 | 8 | 288/2.6 | 43/9.4 | 8 | 10 | 0 |
| A02 | 100 | 288/2.6 | 58/9.4 | 8 | 288/2.6 | 38/9.4 | 8 | 20 | 0 |
| A03 | 100 | 288/2.6 | 63/9.4 | 8 | 288/2.6 | 33/9.4 | 8 | 30 | 0 |
| A04 | 100 | 288/2.6 | 68/9.4 | 8 | 288/2.6 | 28/9.4 | 8 | 40 | 0 |
| A05 | 100 | 288/2.6 | 73/9.4 | 8 | 288/2.6 | 23/9.4 | 8 | 50 | 0 |
| A06 | 100 | 288/2.6 | 78/9.4 | 8 | 288/2.6 | 18/9.4 | 8 | 60 | 0 |
| A07 | 100 | 288/2.6 | 83/9.4 | 8 | 288/2.6 | 13/9.4 | 8 | 70 | 0 |
| B01 | 100 | 305/2.6 | 44.6/9.4 | 8 | 295/2.6 | 44.6/9.4 | 8 | 0 | 10 |
| B02 | 100 | 310/2.6 | 44.6/9.4 | 8 | 290/2.6 | 44.6/9.4 | 8 | 0 | 20 |
| B03 | 100 | 315/2.6 | 44.6/9.4 | 8 | 285/2.6 | 44.6/9.4 | 8 | 0 | 30 |
| B04 | 100 | 320/2.6 | 44.6/9.4 | 8 | 280/2.6 | 44.6/9.4 | 8 | 0 | 40 |
| B05 | 100 | 325/2.6 | 44.6/9.4 | 8 | 275/2.6 | 44.6/9.4 | 8 | 0 | 50 |
| B06 | 100 | 330/2.6 | 44.6/9.4 | 8 | 270/2.6 | 44.6/9.4 | 8 | 0 | 60 |
| B07 | 100 | 335/2.6 | 44.6/9.4 | 8 | 265/2.6 | 44.6/9.4 | 8 | 0 | 70 |
| No. | Weld Appearance | No. | Weld Appearance |
|---|---|---|---|
| A01 | 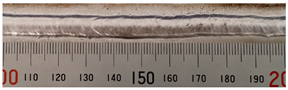 | B01 | 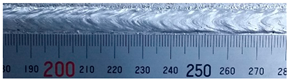 |
| A02 | 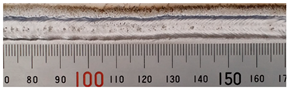 | B02 | 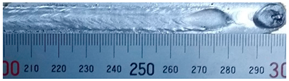 |
| A03 |  | B03 | 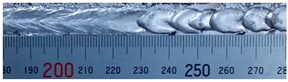 |
| A04 | 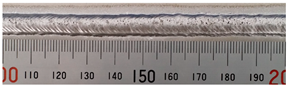 | B04 |  |
| A05 | 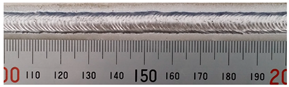 | B05 | 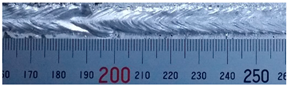 |
| A06 |  | B06 |  |
| A07 | 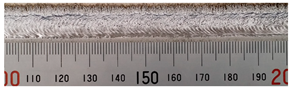 | B07 | 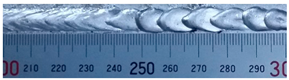 |
| No. | The Pore Distribution in the Weld Bead Center |
|---|---|
| A01 | 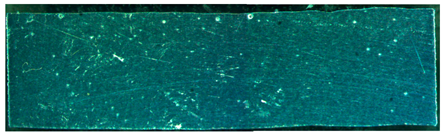 |
| A02 | 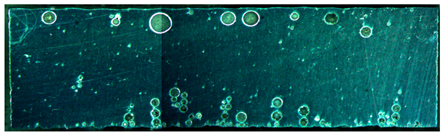 |
| A03 | 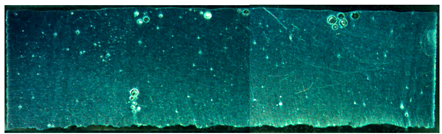 |
| A04 |  |
| A05 | 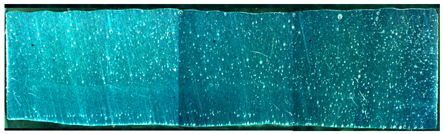 |
| A06 | 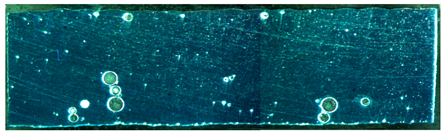 |
| A07 |  |
| No. | Absorded Energy, Akv (J) | ||||
|---|---|---|---|---|---|
| 1 | 2 | 3 | Average Value | Standard Deviation | |
| BM | 7.25 | 7.00 | 7.00 | 7.08 | 0.12 |
| A01 | 2.18 | 2.25 | 2.20 | 2.21 | 0.03 |
| A02 | 2.06 | 1.97 | 2.05 | 2.03 | 0.04 |
| A03 | 2.23 | 2.29 | 2.21 | 2.24 | 0.03 |
| A04 | 2.42 | 2.03 | 2.25 | 2.23 | 0.16 |
| A05 | 2.13 | 2.29 | 2.23 | 2.22 | 0.07 |
| A06 | 2.16 | 2.32 | 2.30 | 2.26 | 0.07 |
| A07 | 2.45 | 2.00 | 2.22 | 2.22 | 0.18 |
Publisher’s Note: MDPI stays neutral with regard to jurisdictional claims in published maps and institutional affiliations. |
© 2022 by the authors. Licensee MDPI, Basel, Switzerland. This article is an open access article distributed under the terms and conditions of the Creative Commons Attribution (CC BY) license (https://creativecommons.org/licenses/by/4.0/).
Share and Cite
Jin, L.; Yang, Y.; Yao, P.; Chen, W.; Qian, Z.; Xue, J. Investigation of the Difference in the Pulse Current in the Double Pulsed Gas Metal Arc Welding of Aluminum Alloys. Materials 2022, 15, 2513. https://doi.org/10.3390/ma15072513
Jin L, Yang Y, Yao P, Chen W, Qian Z, Xue J. Investigation of the Difference in the Pulse Current in the Double Pulsed Gas Metal Arc Welding of Aluminum Alloys. Materials. 2022; 15(7):2513. https://doi.org/10.3390/ma15072513
Chicago/Turabian StyleJin, Li, Yuqing Yang, Ping Yao, Wenshi Chen, Zhiqiu Qian, and Jiaxiang Xue. 2022. "Investigation of the Difference in the Pulse Current in the Double Pulsed Gas Metal Arc Welding of Aluminum Alloys" Materials 15, no. 7: 2513. https://doi.org/10.3390/ma15072513
APA StyleJin, L., Yang, Y., Yao, P., Chen, W., Qian, Z., & Xue, J. (2022). Investigation of the Difference in the Pulse Current in the Double Pulsed Gas Metal Arc Welding of Aluminum Alloys. Materials, 15(7), 2513. https://doi.org/10.3390/ma15072513