
Tests and Numerical Study of Single-Lap Thermoplastic Composite Joints Bolted by Countersunk


Abstract
:1. Introduction
2. Test
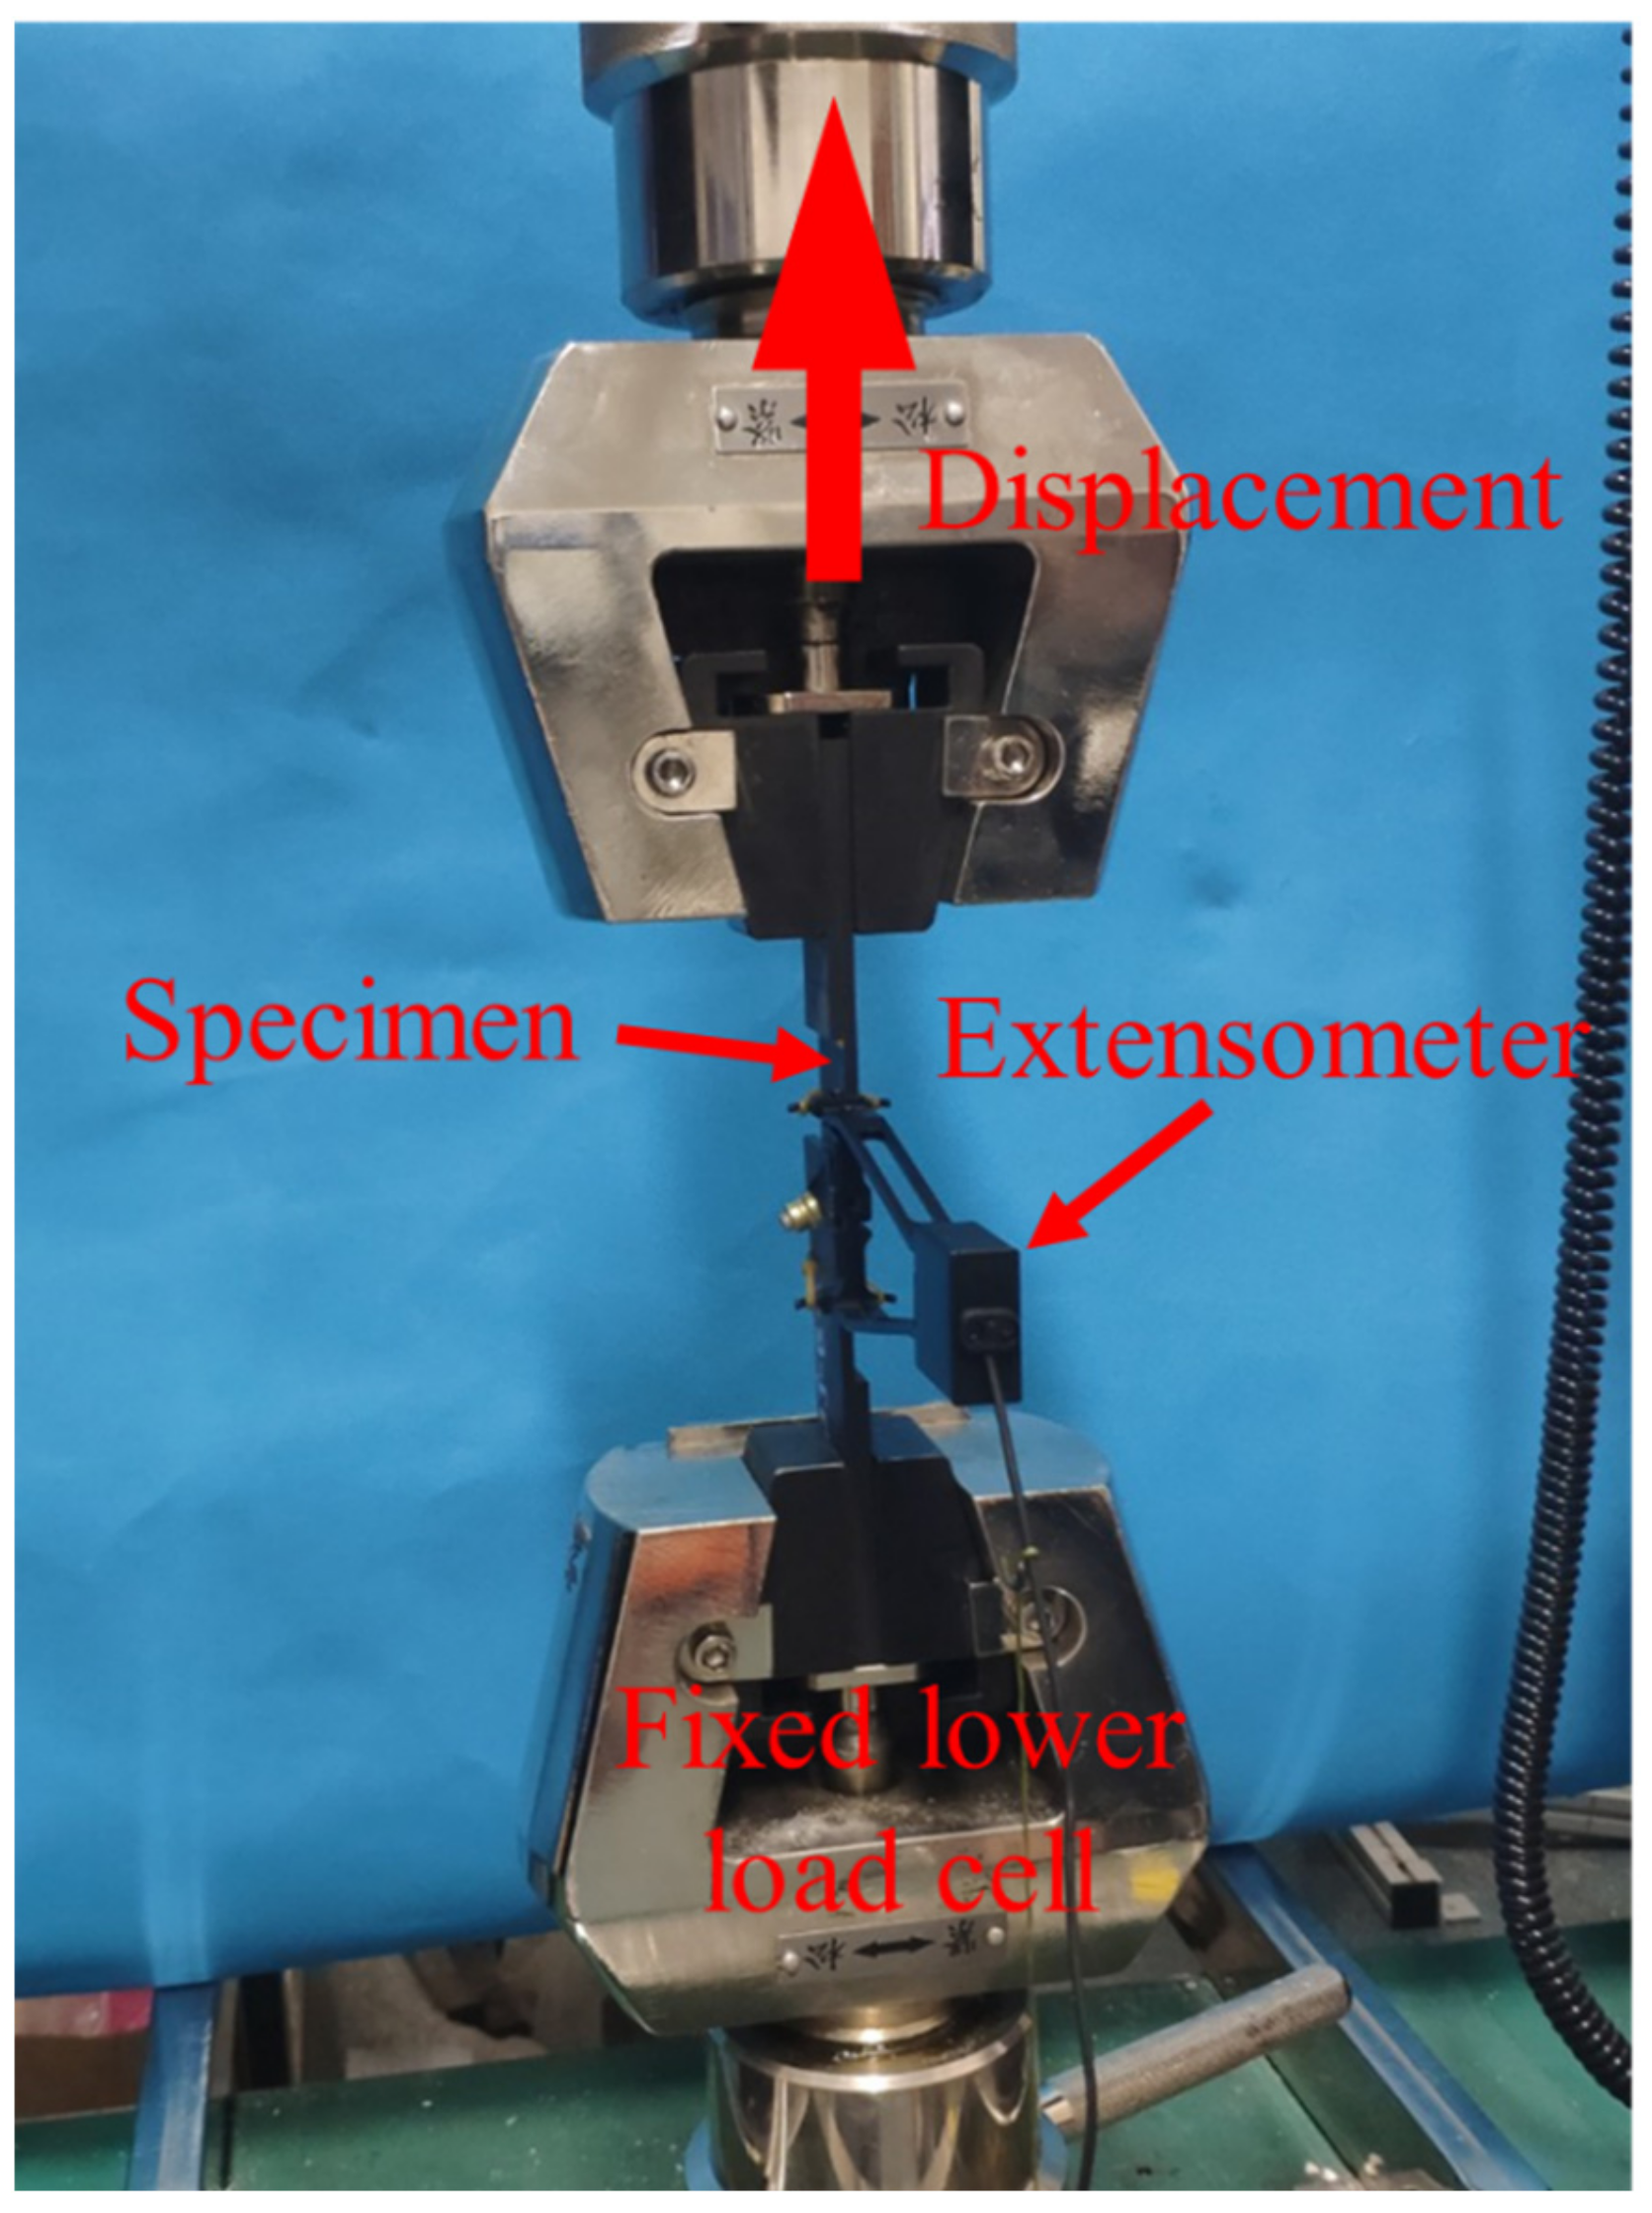
2.1. Test Setup
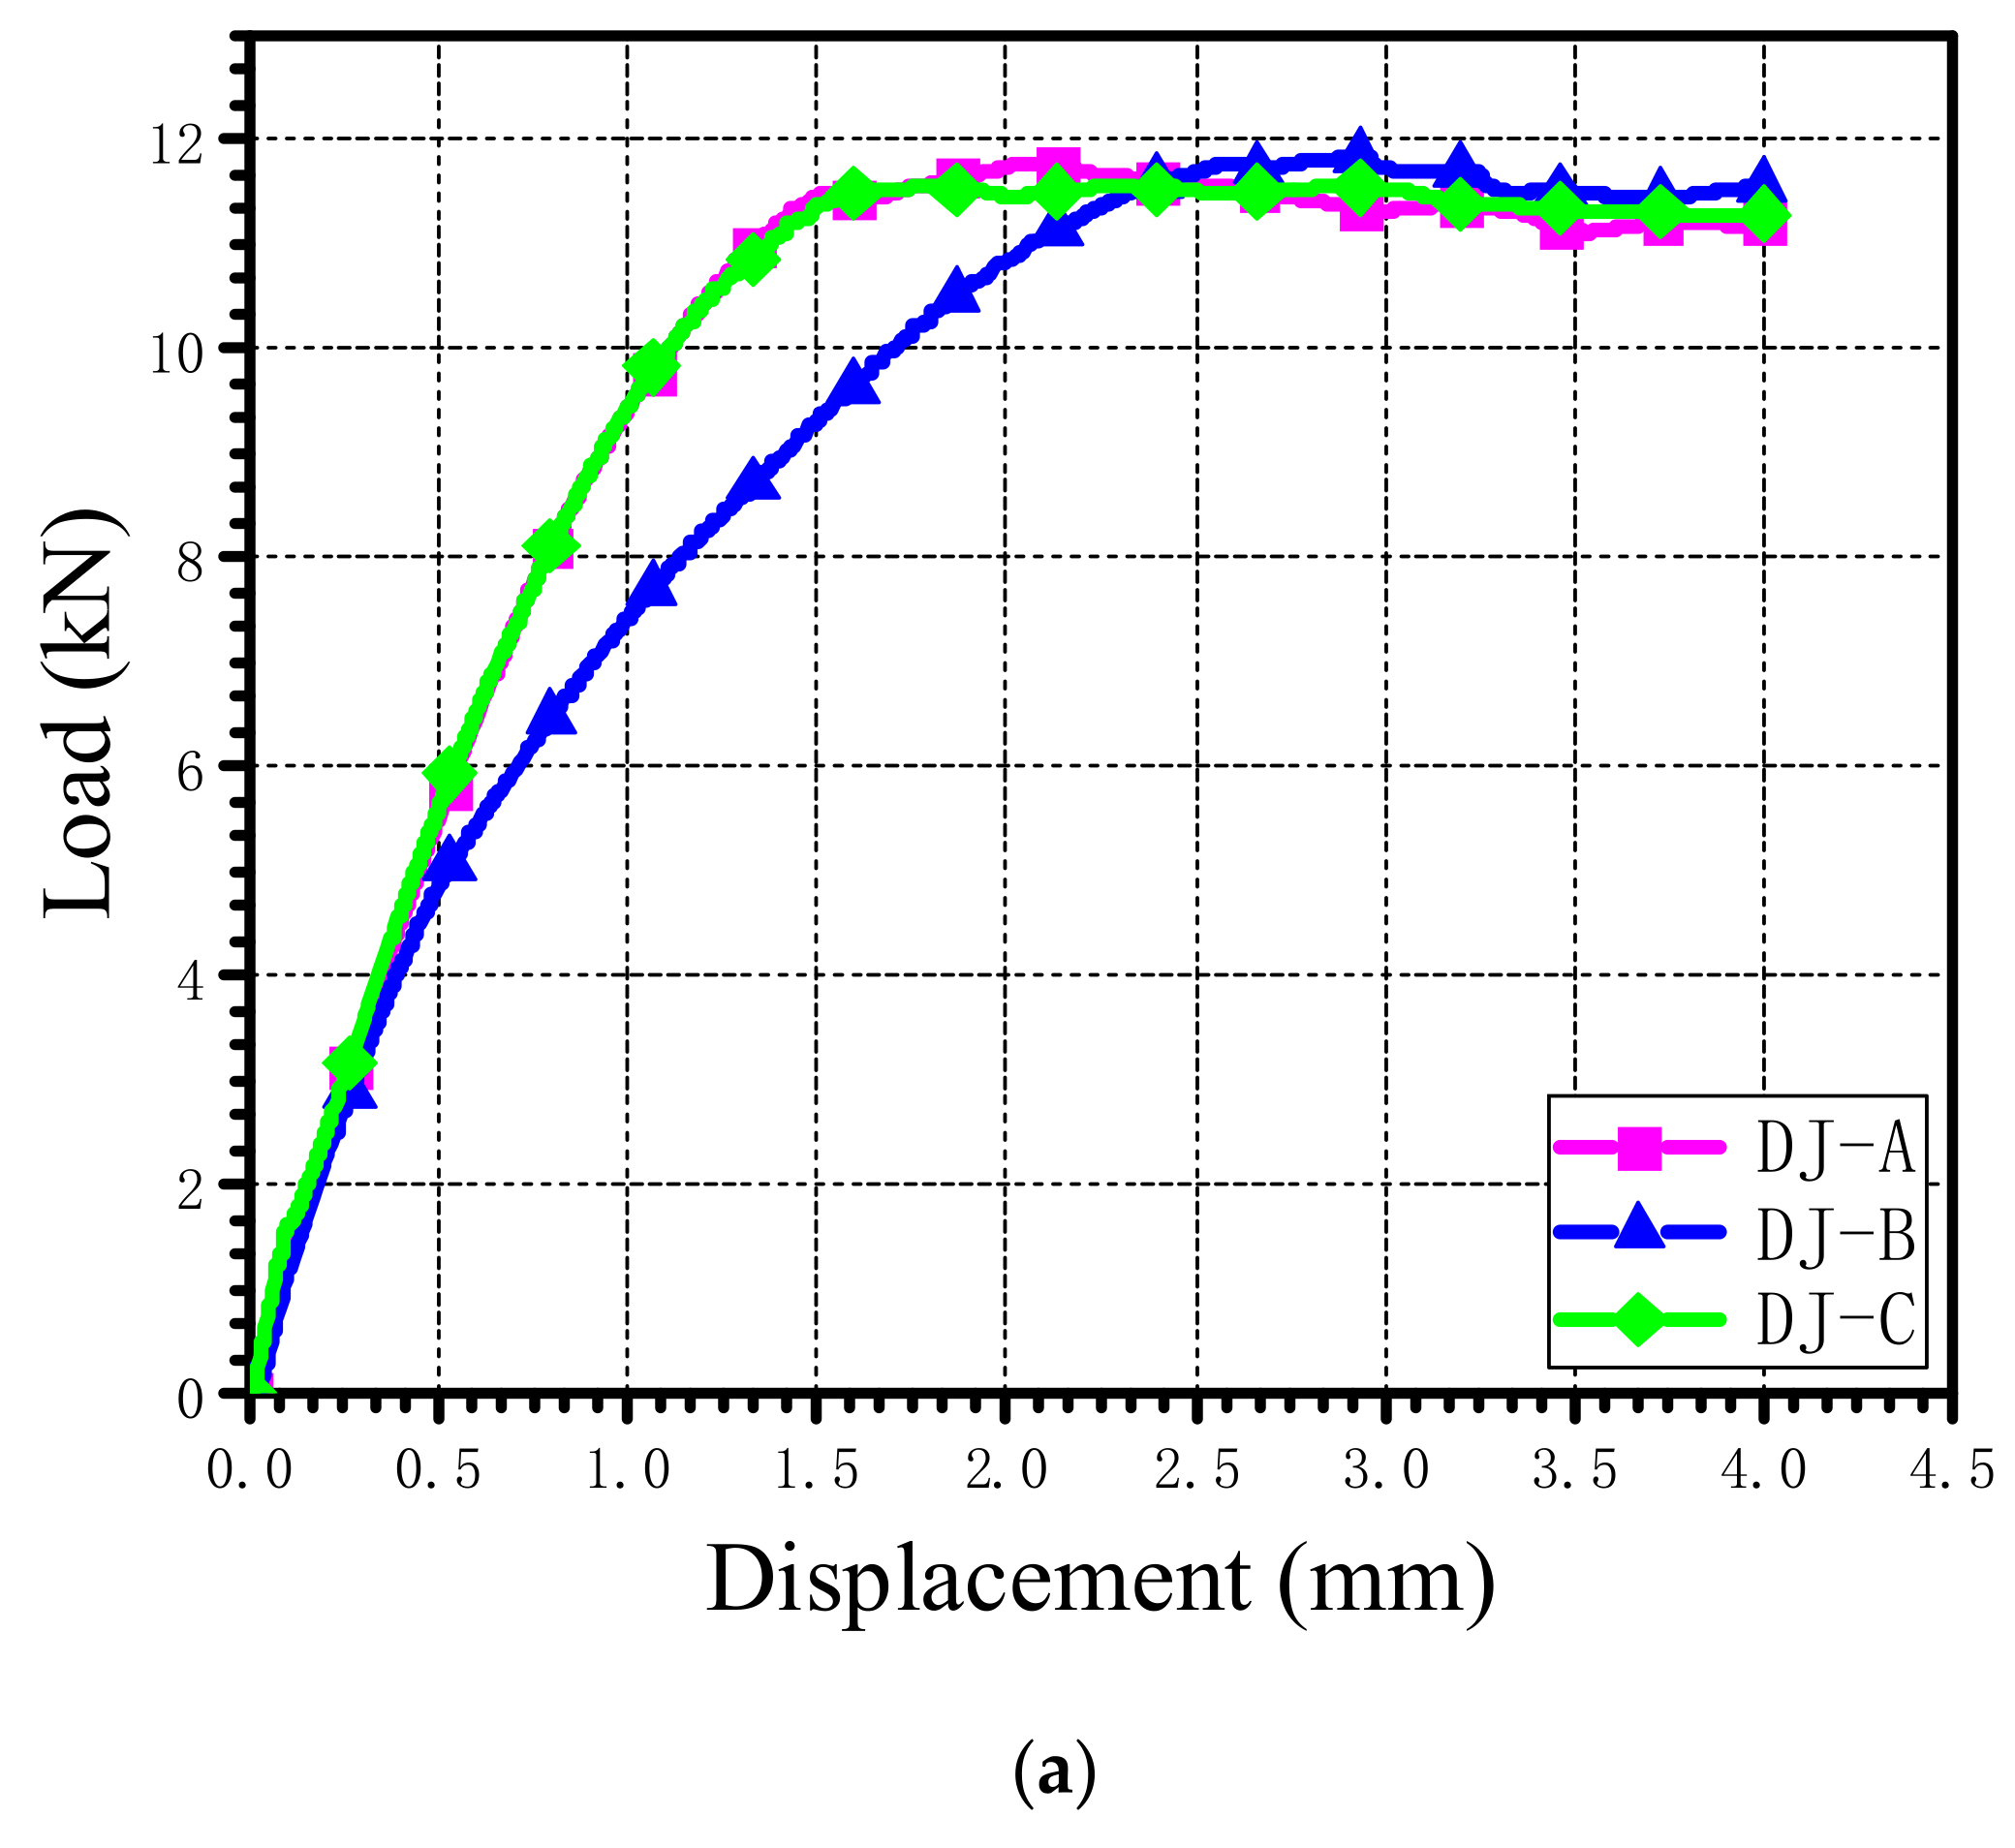
2.2. Test Results
3. Numerical Model
3.1. Constitutive Relationship
3.1.1. Elastic Model
3.1.2. Plastic Model
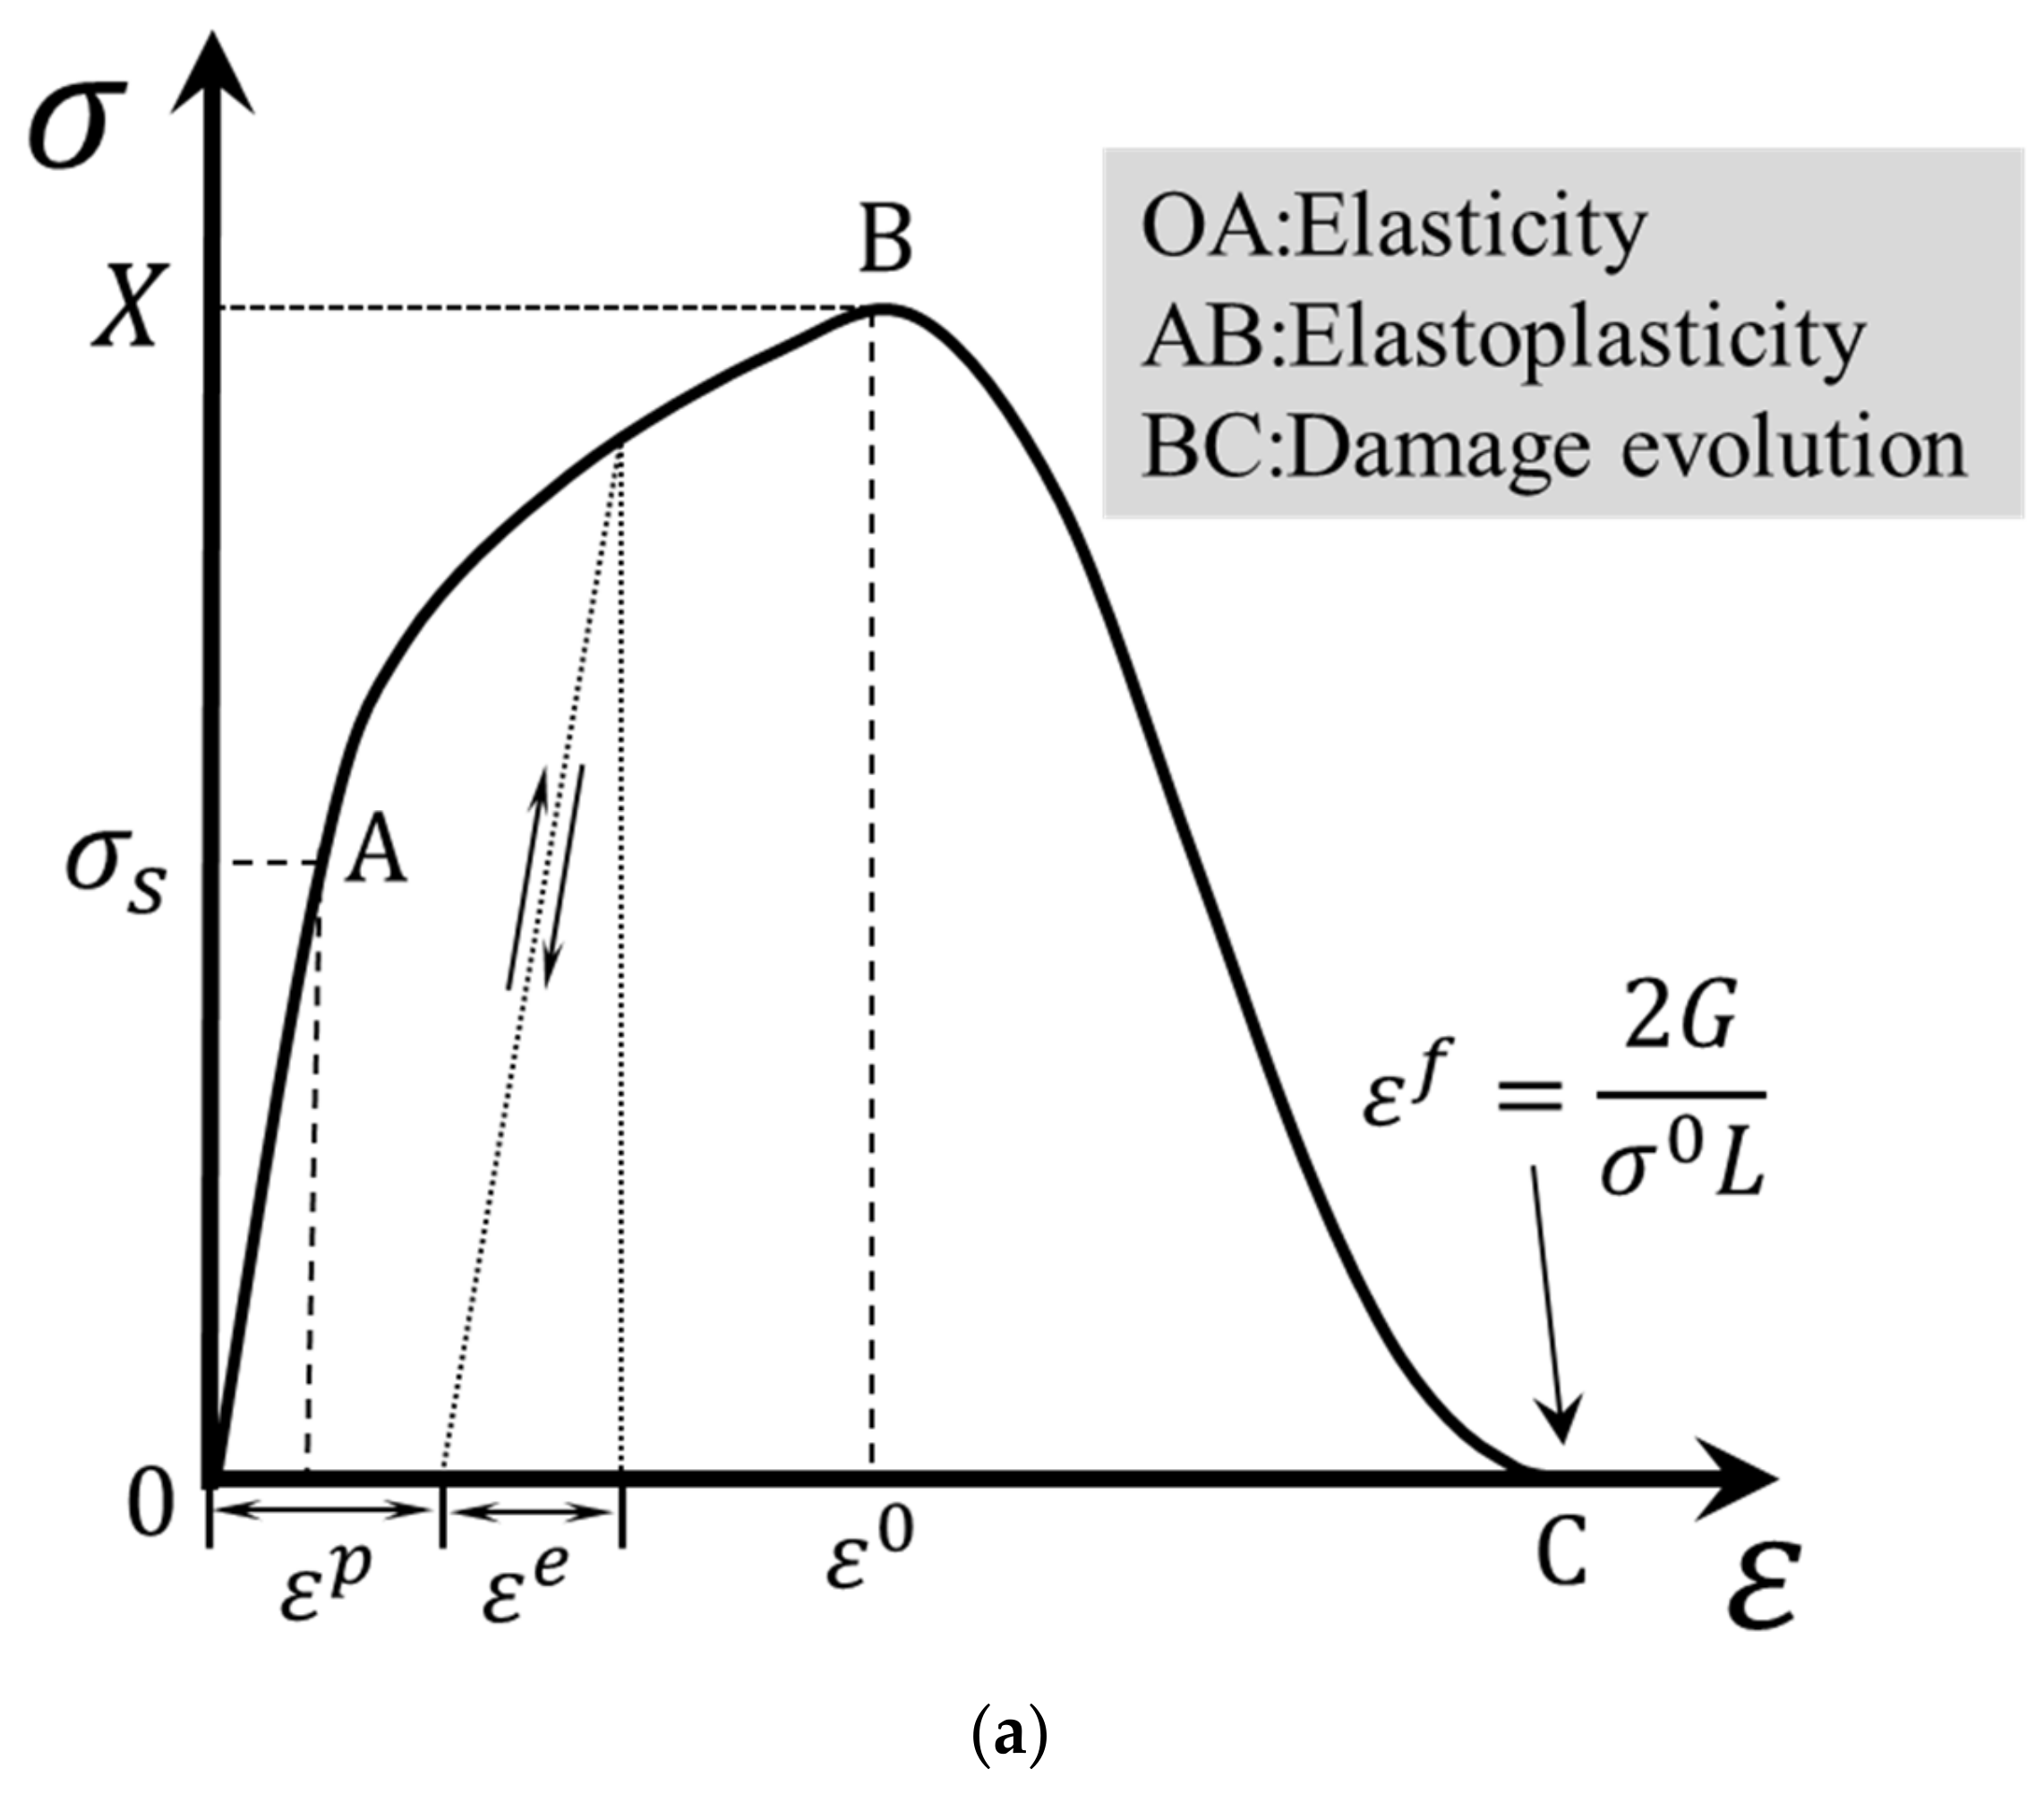
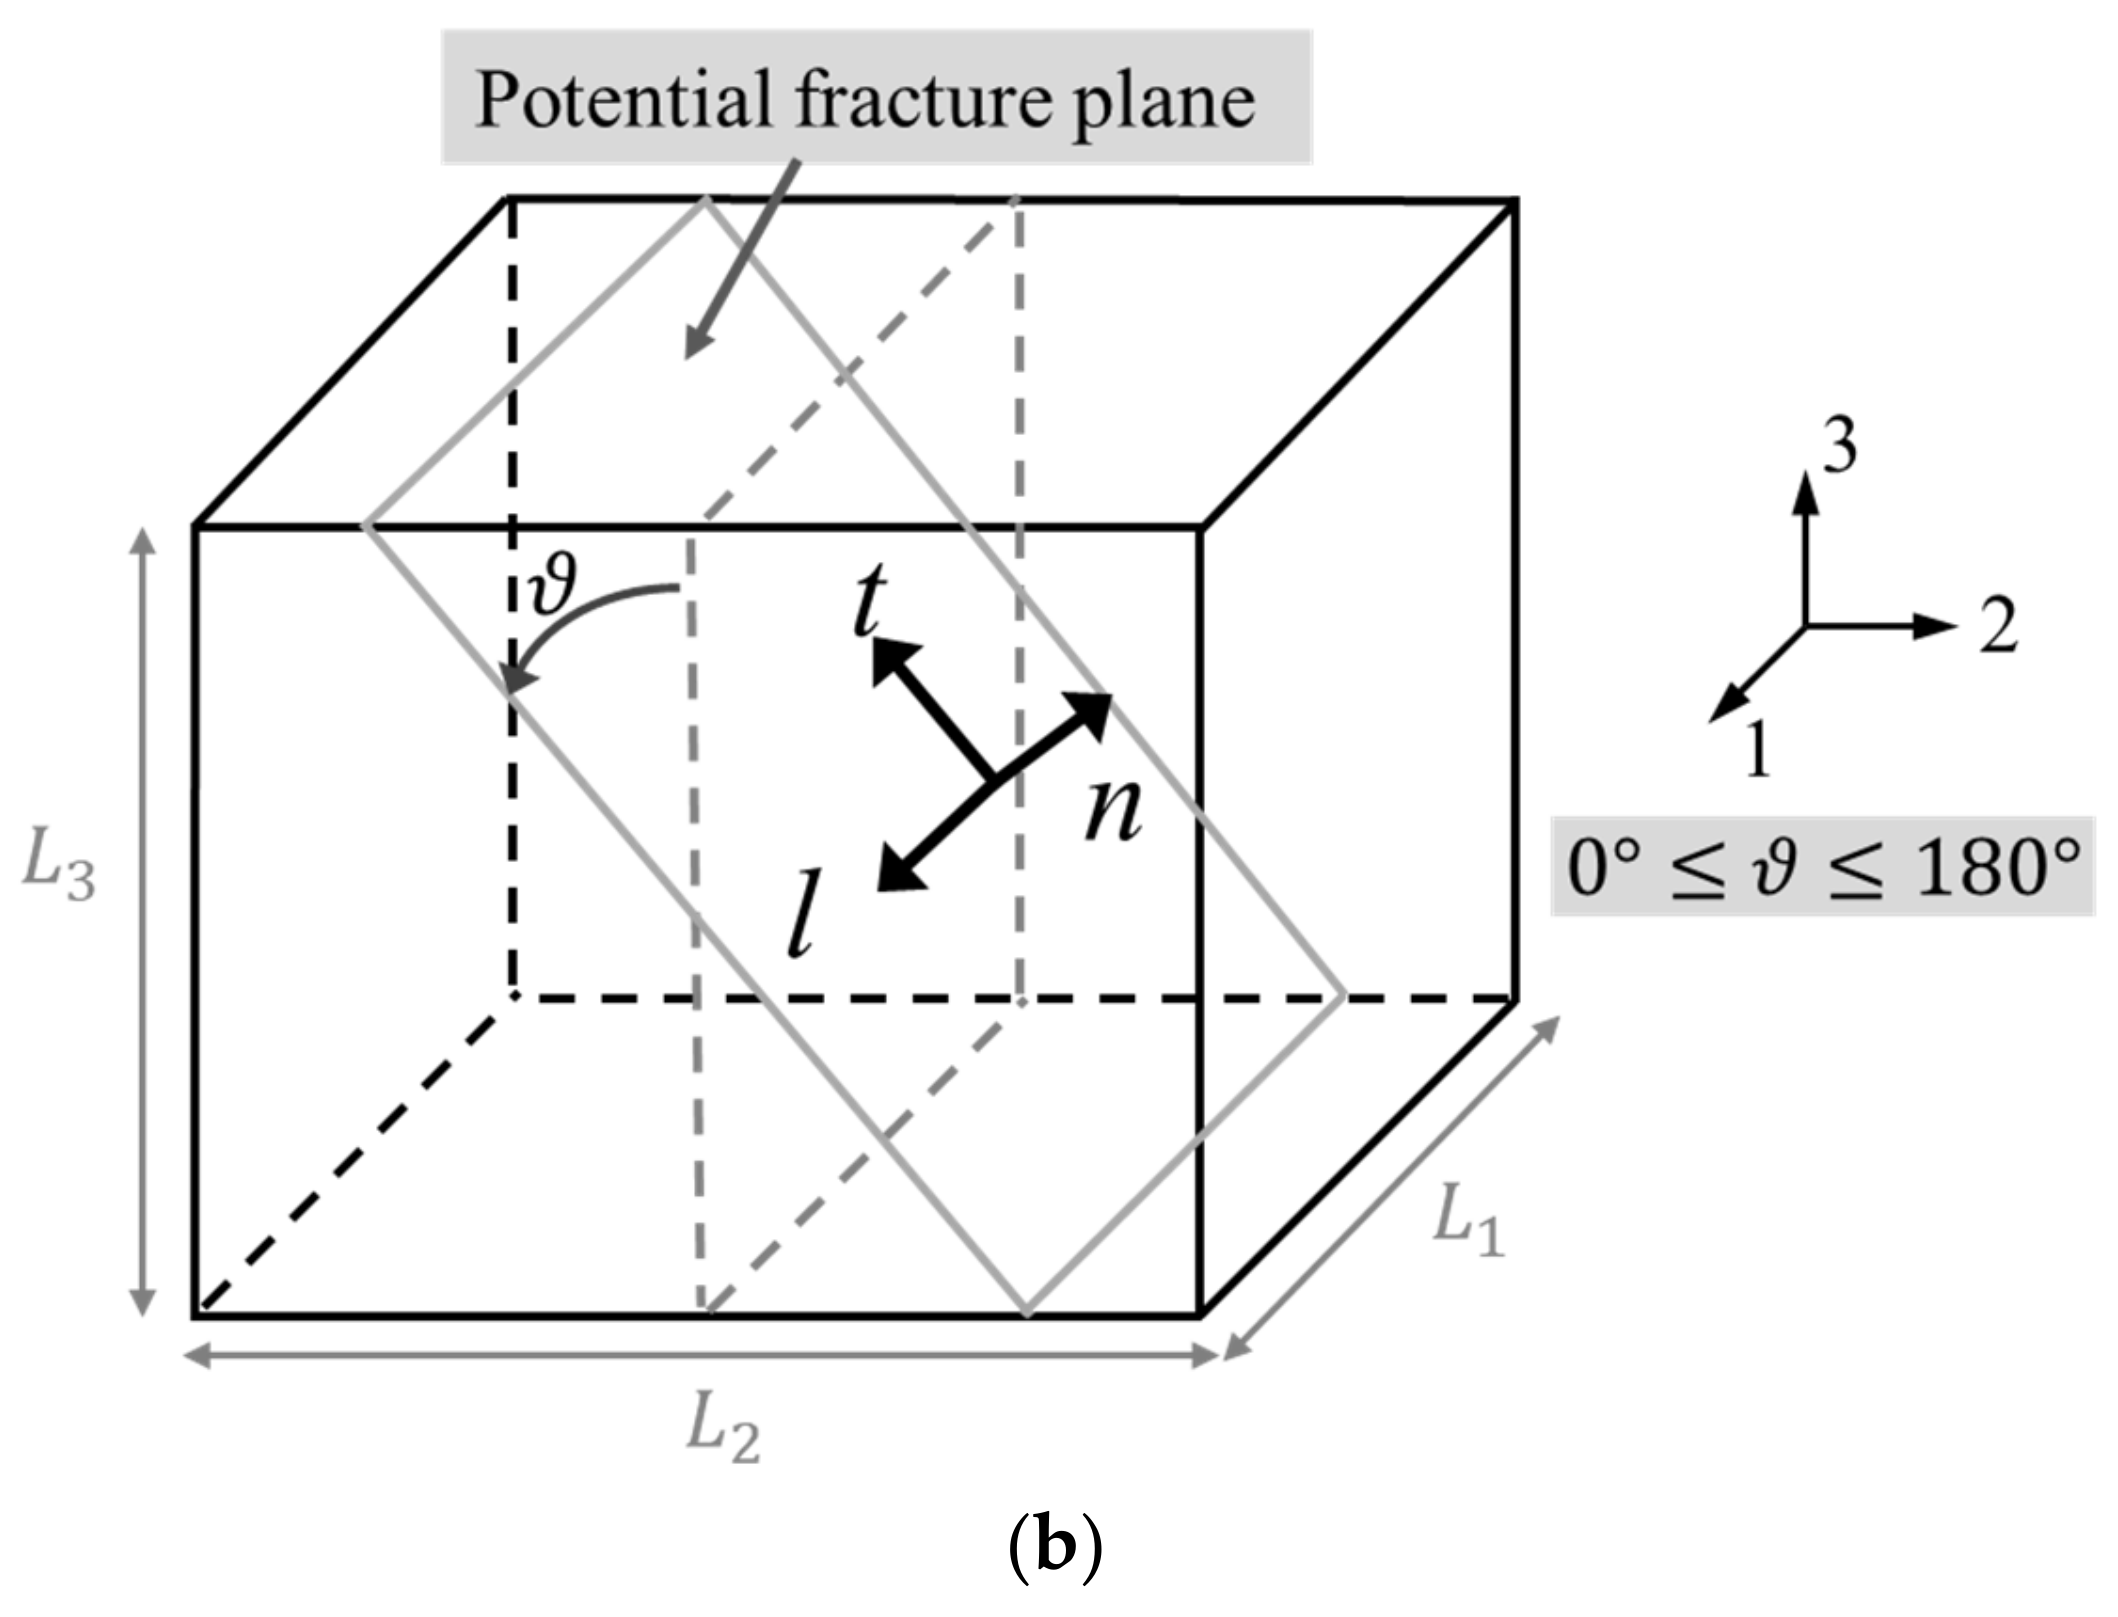
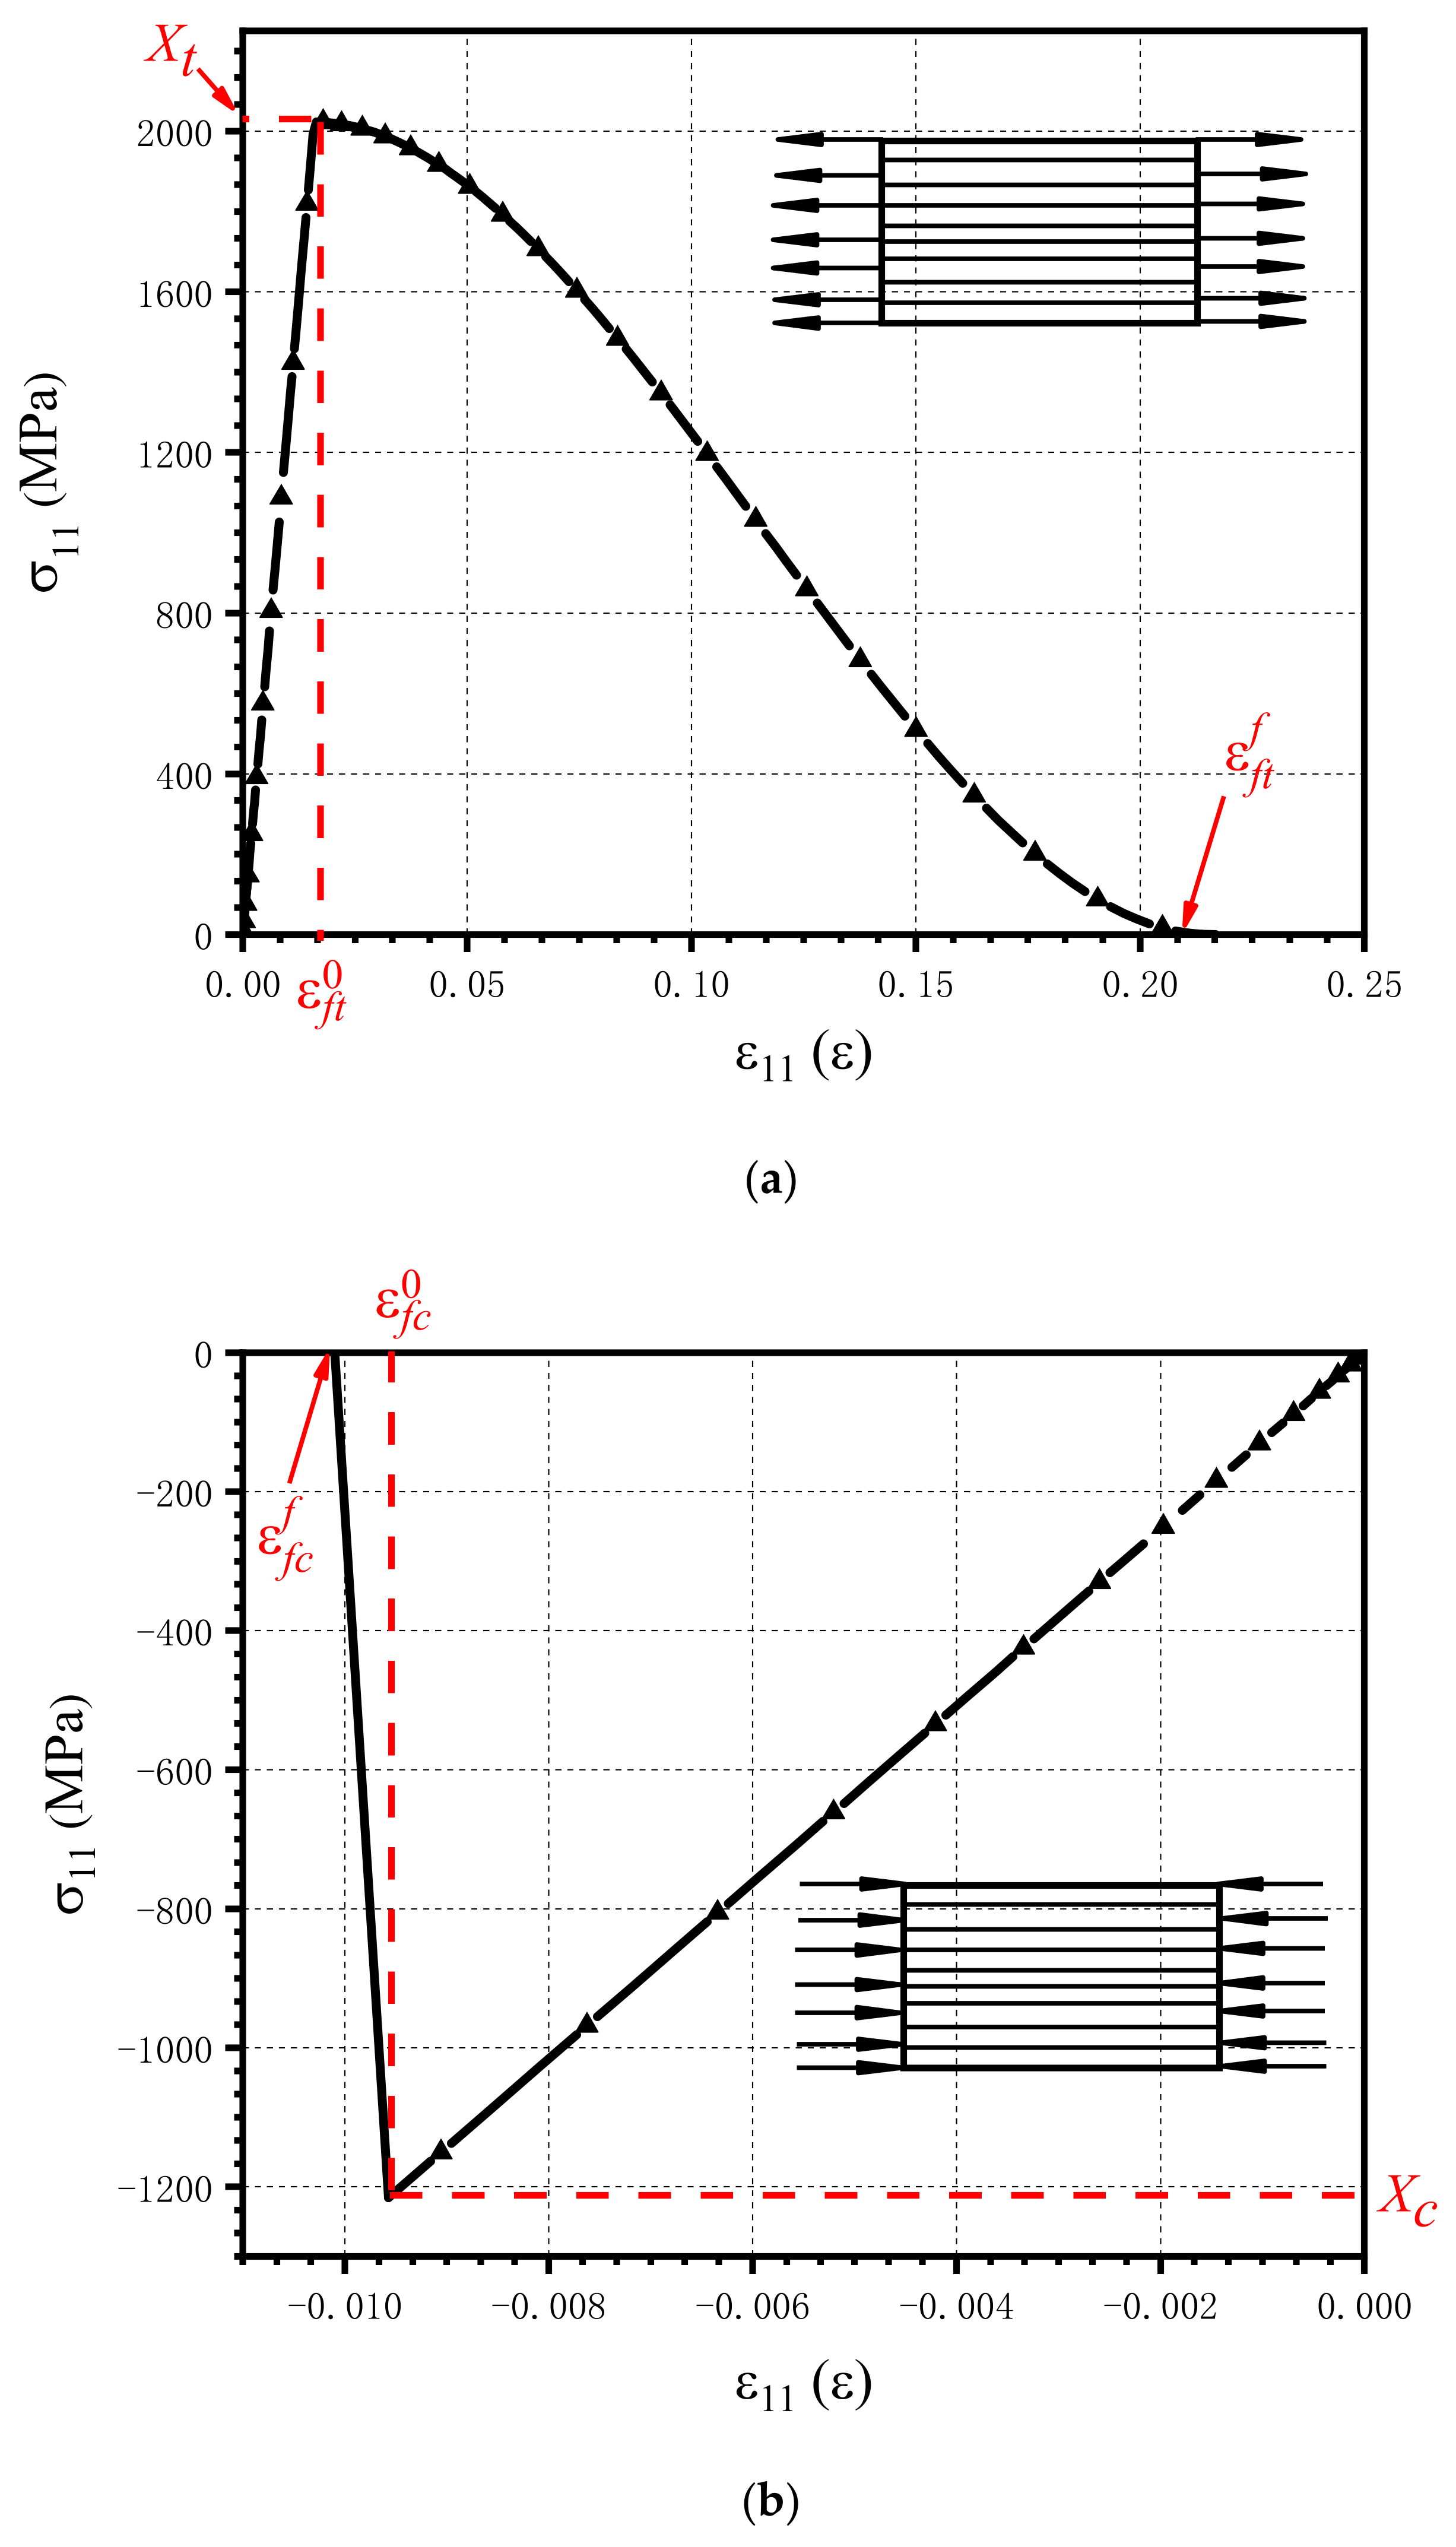
3.1.3. Damage Initiation and Evolution Model
3.2. Calculation Procedure
- (1)
- Initial conditions:
- (2)
- Assuming that the plastic strain tensor and the equivalent plastic strain of the current step are consistent with those of the previous step, the trial stress in the current step is calculated by:
- (3)
- Check the yield criterion:
- (4)
- Calculate the plastic strain and the update stress:
- (a)
- Calculate the scale factor increment:
- (b)
- Update the plastic strain tensor and the equivalent plastic strain:
- (c)
- Update the stress tensor:
- (5)
- Judge whether damage has been initiated and calculate the damage variable.
- (a)
- Judge the positive and negative values of , and judge whether fiber damage has been initiated according to different fiber damage initiation criteria. If fiber damage occurs, the corresponding fiber damage variable is calculated. Otherwise, .
- (b)
- The stress is rotated to the fracture surface to determine whether the tractions on the fracture surface satisfy the damage initial criteria of the matrix. If matrix damage occurs, the corresponding matrix damage variable is calculated. Otherwise, .
- (6)
- Update the stress according to the calculated fiber damage variable and the matrix damage variable and skip to the next step.
3.3. Finite Element Model

| 127,000 | 10,300 | 10,300 | 6000 | 6000 | 3450 |
| 0.32 | 0.32 | 0.49 | 1.50 | 292.67 | 0.135 |
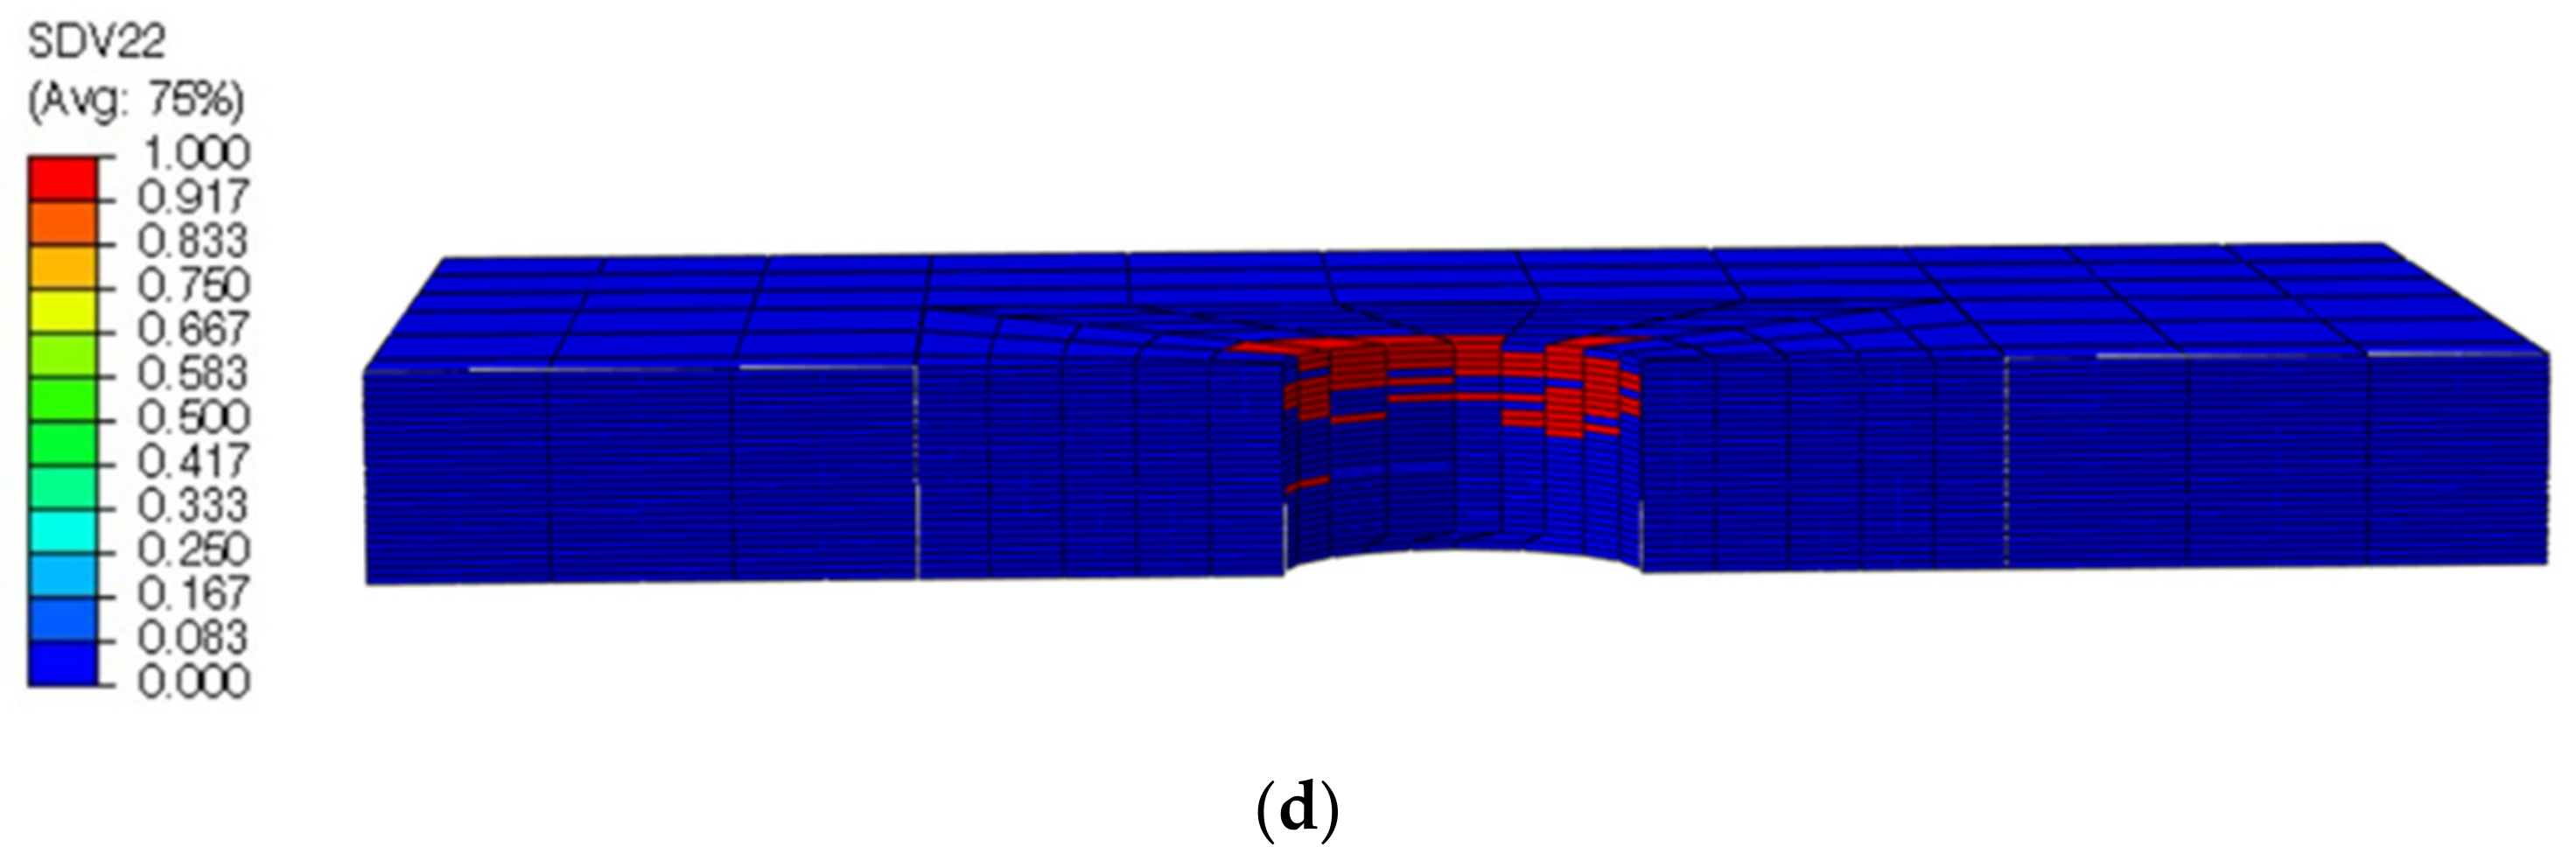
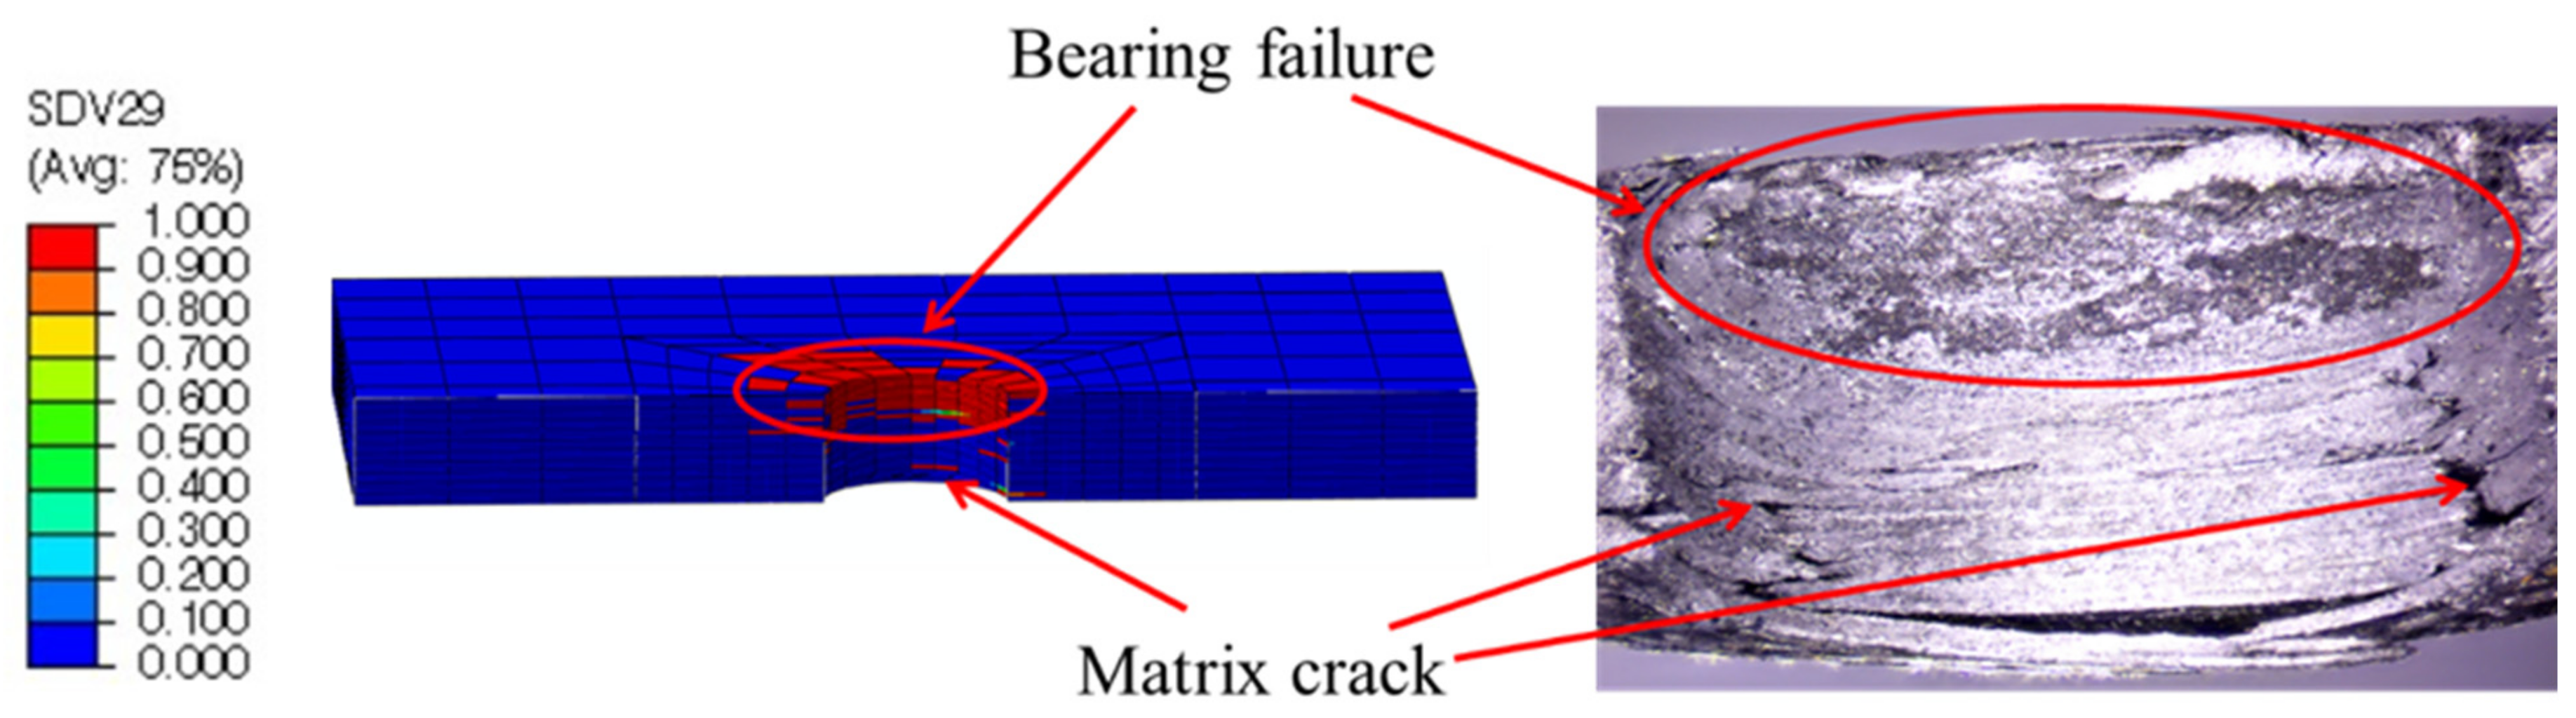
4. Numerical Simulation Results
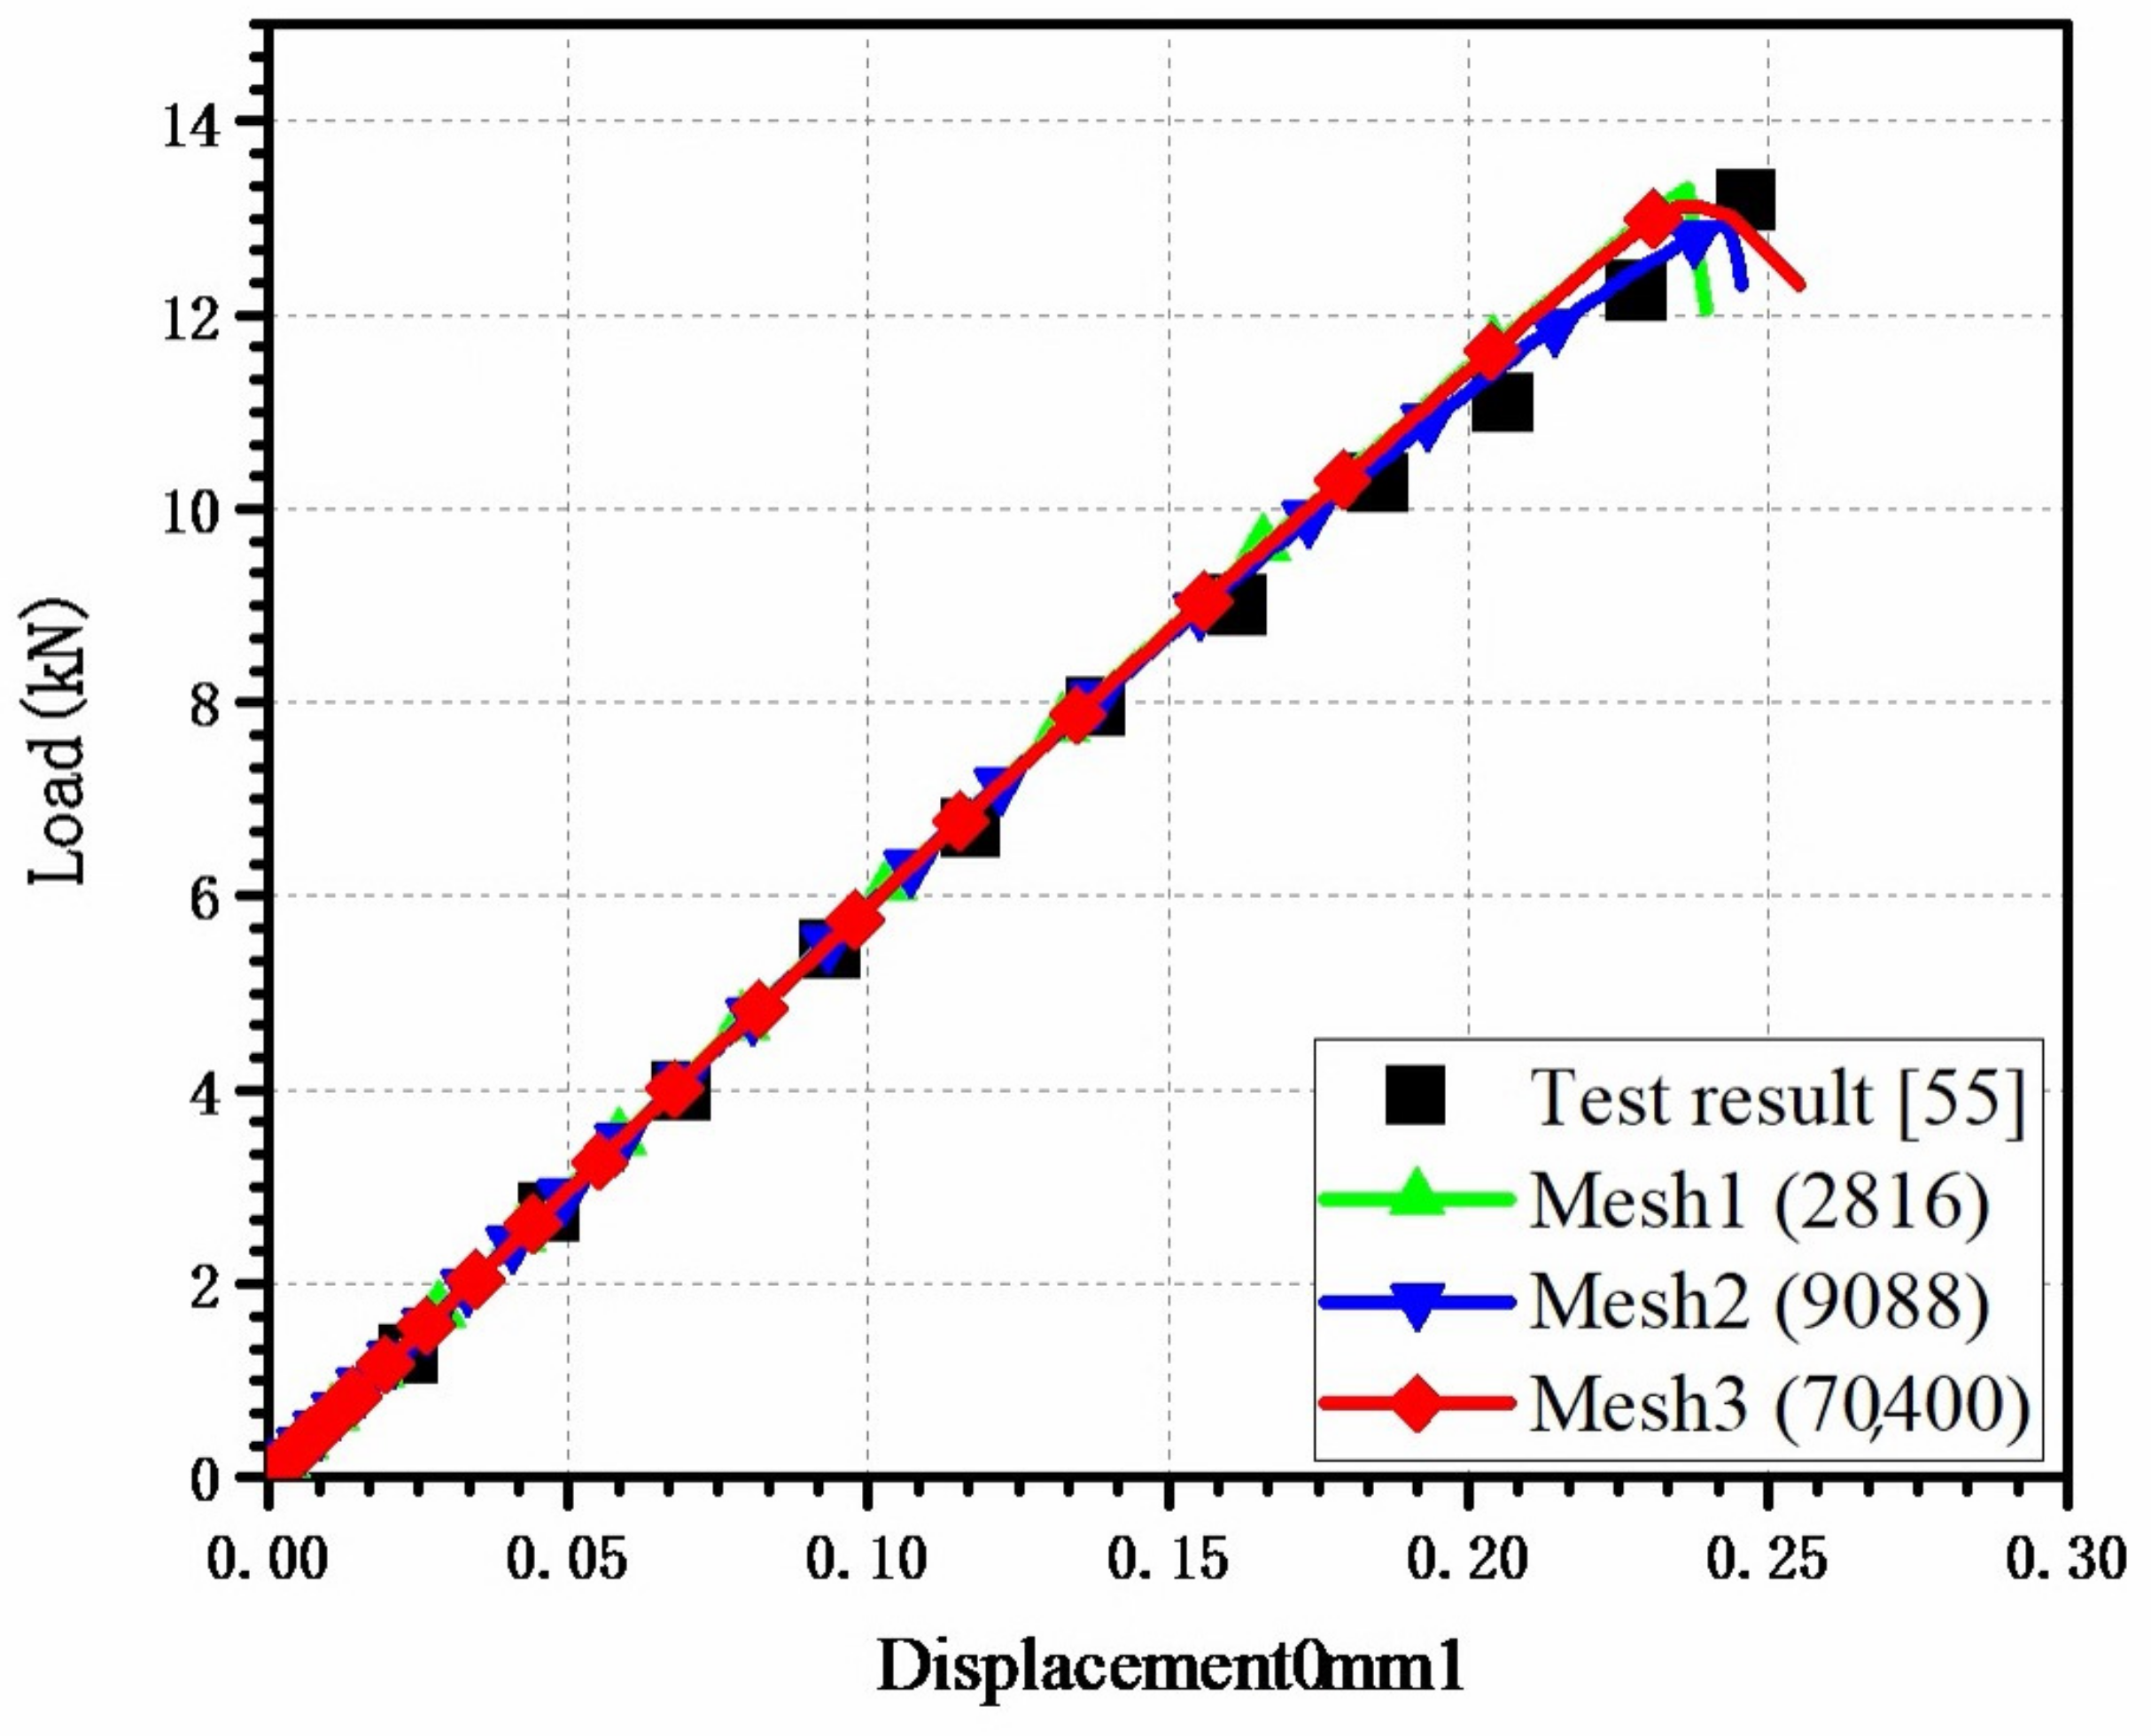
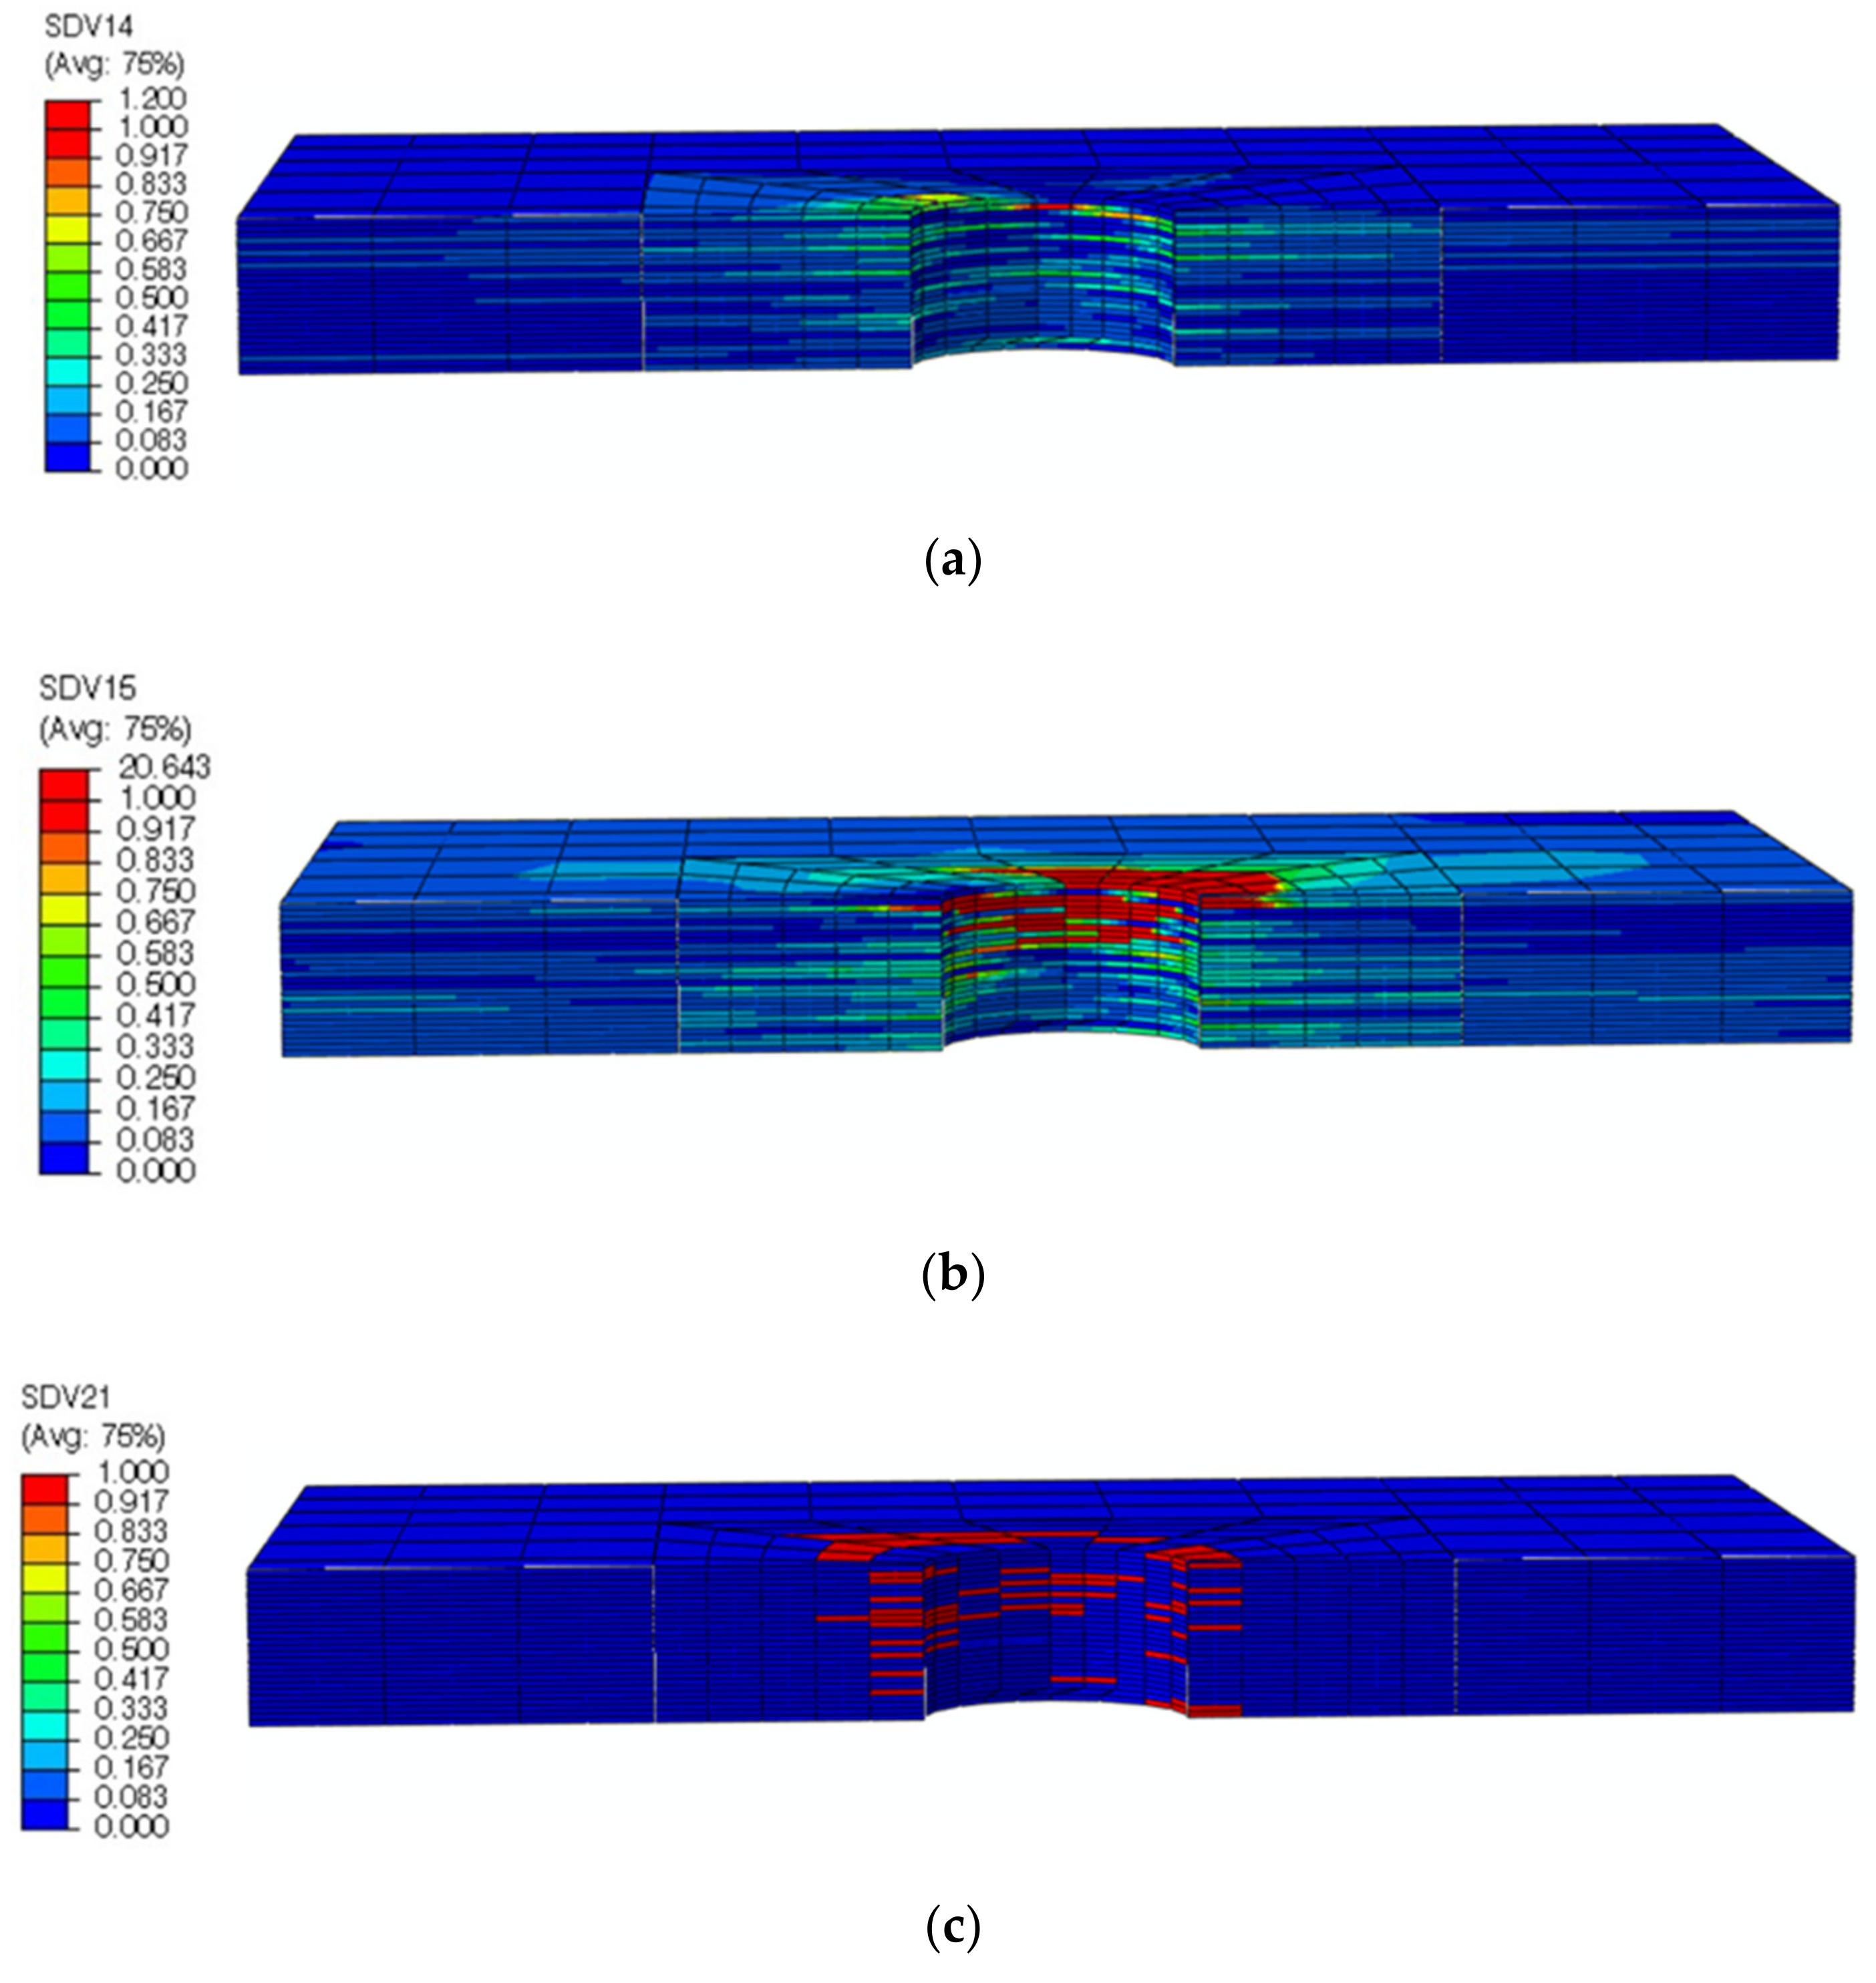
4.1. Model Verification
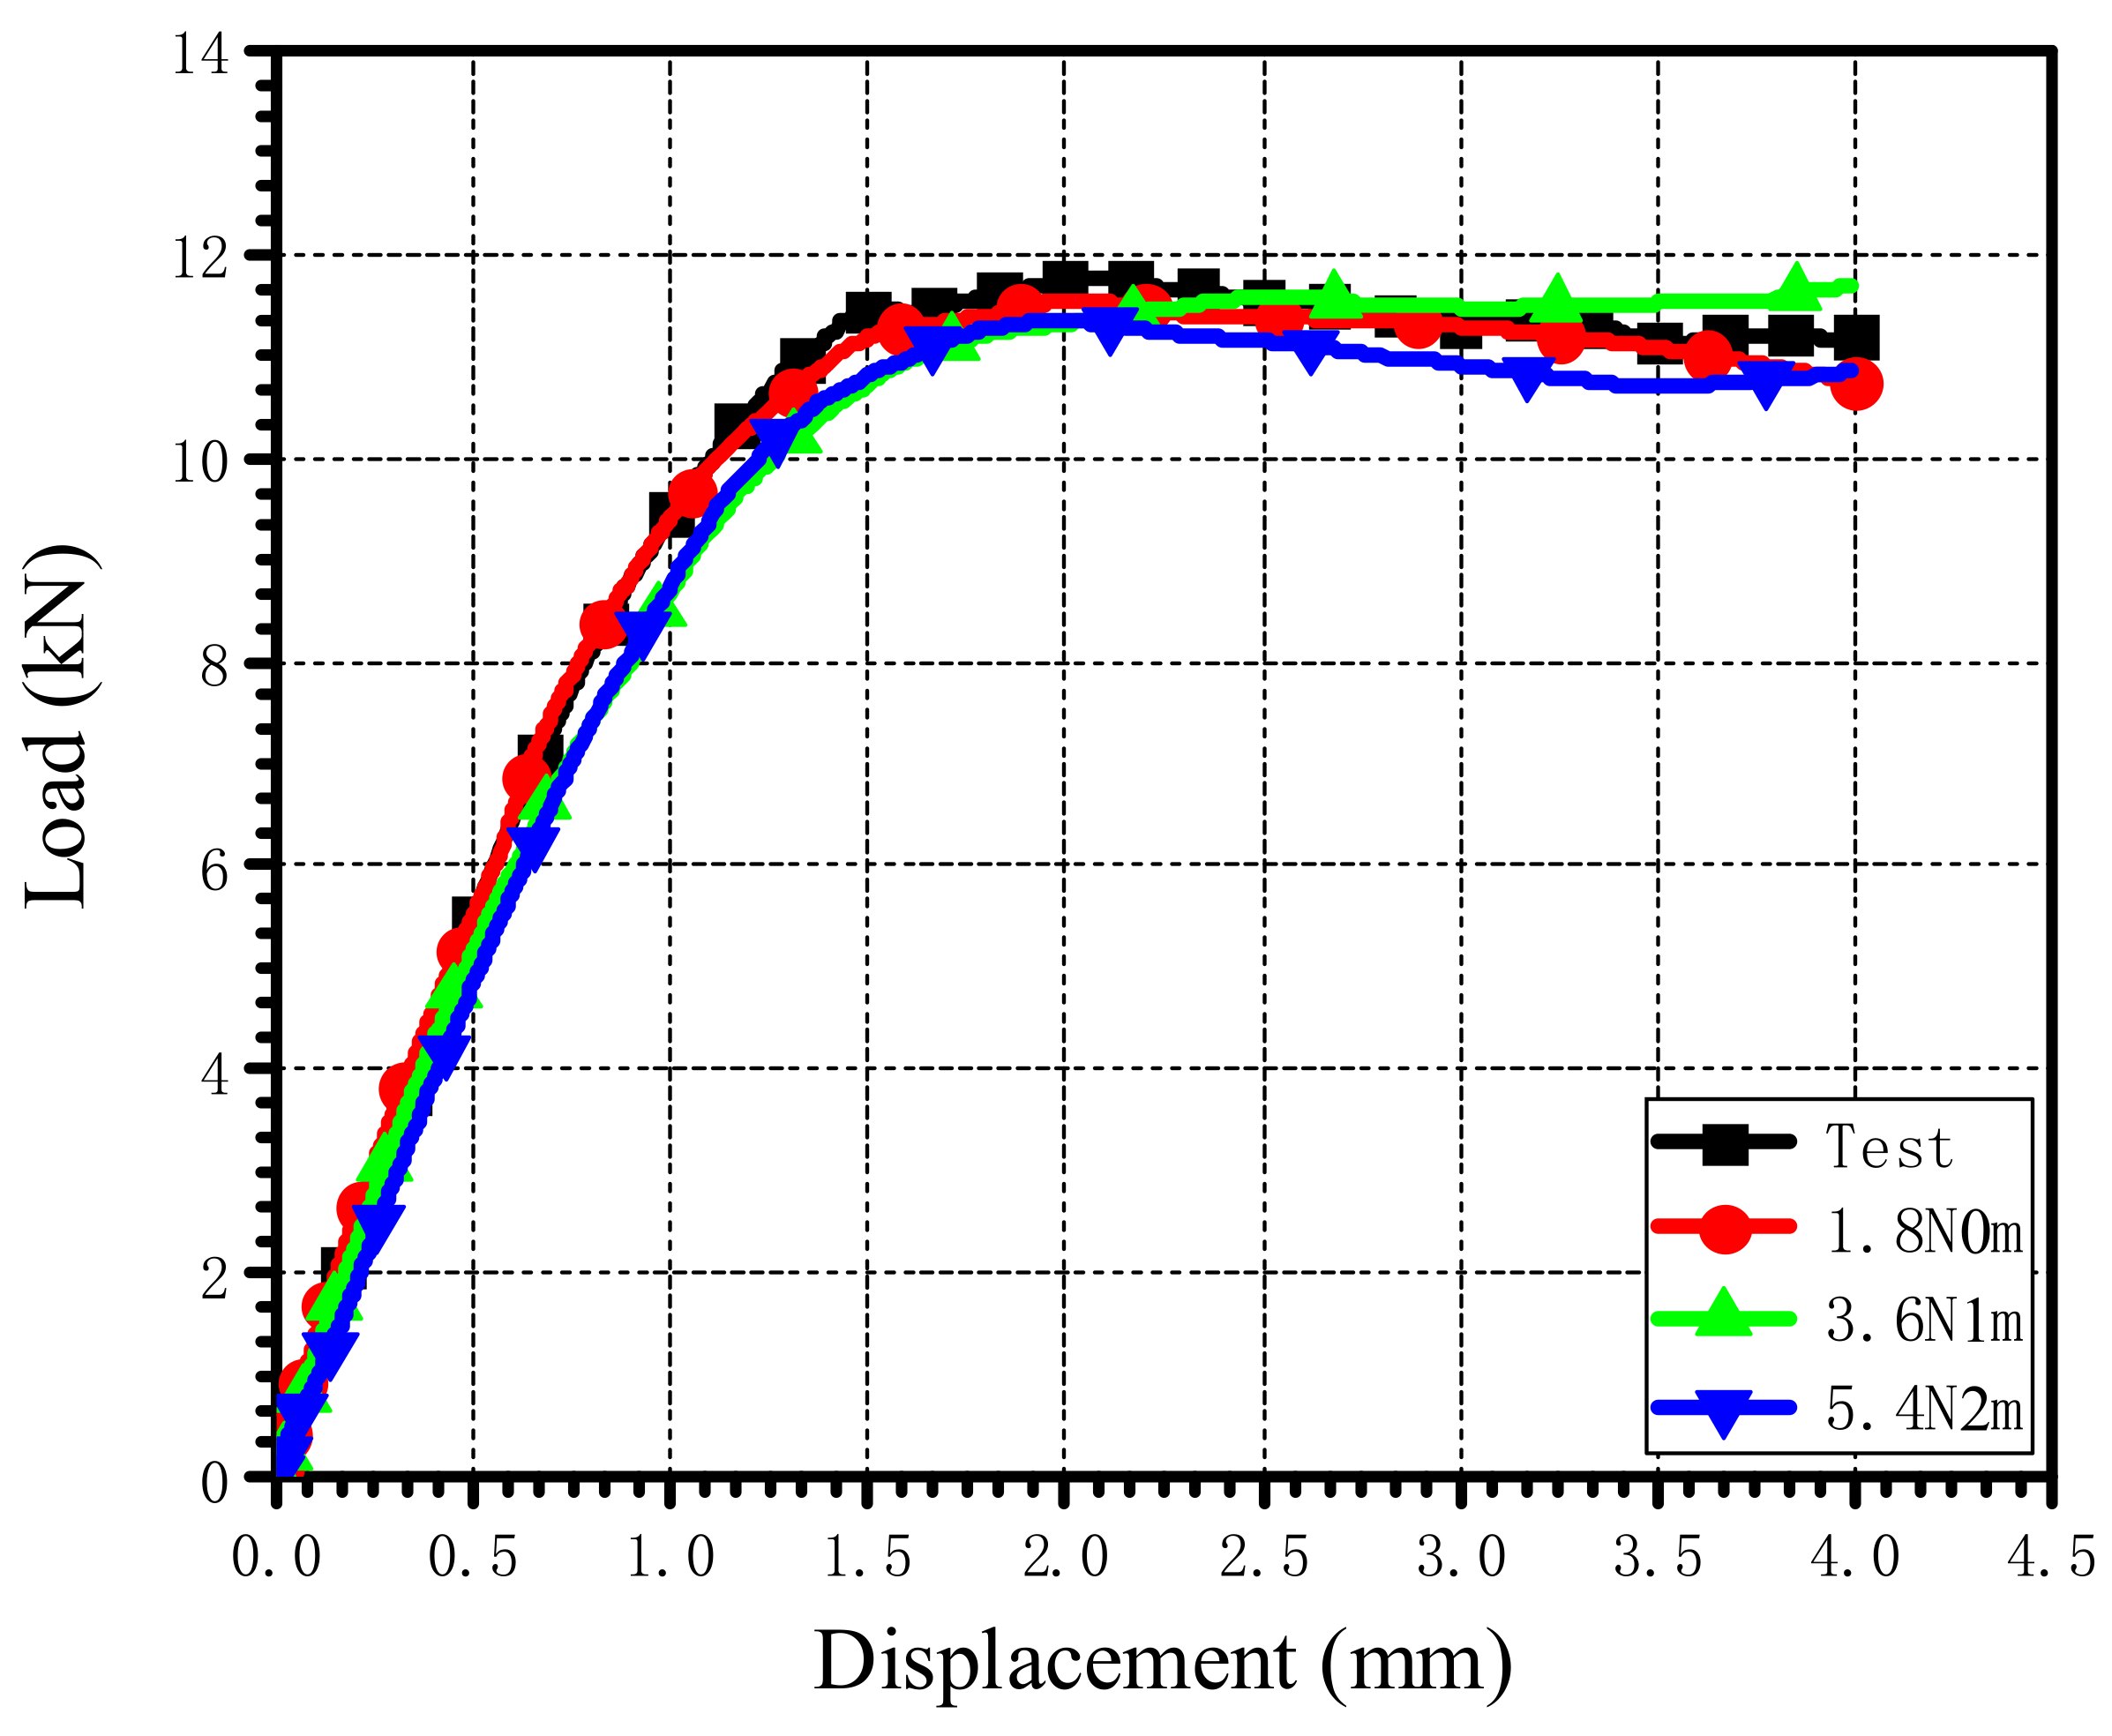
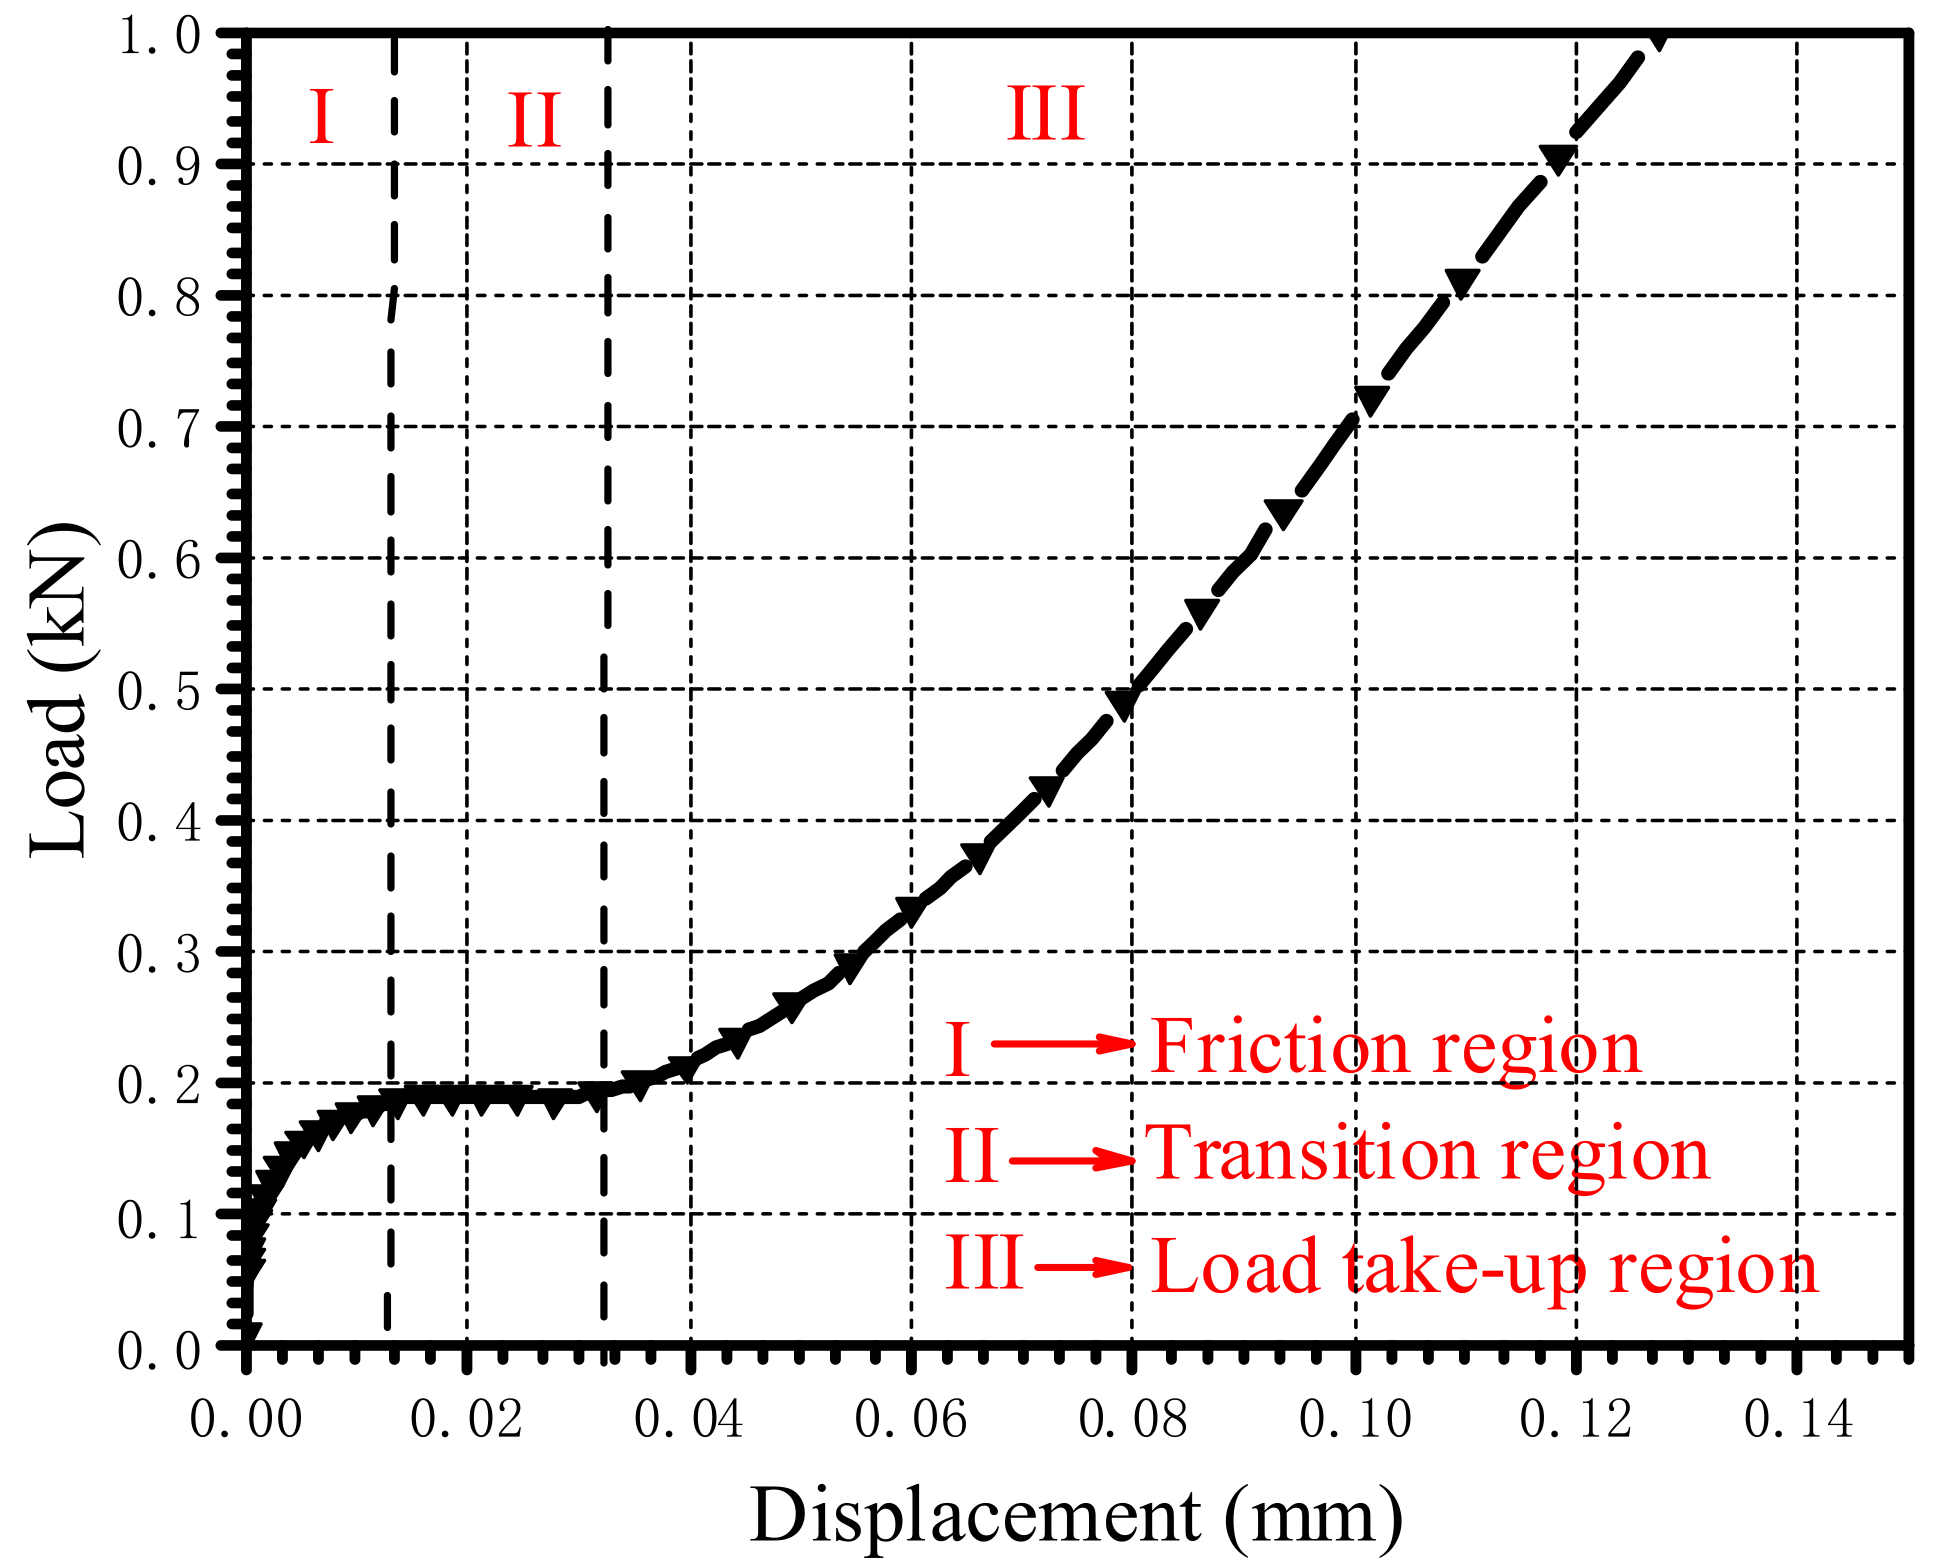
4.2. Influence of Bolt-Tightening Torque
4.3. Influence of Clearance
5. Conclusions
Author Contributions
Funding
Institutional Review Board Statement
Informed Consent Statement
Data Availability Statement
Acknowledgments
Conflicts of Interest
References
- Hron, R.; Kadlec, M.; Růžek, R. Effect of the test procedure and thermoplastic composite resin type on the curved beam strength. Materials 2021, 14, 352. [Google Scholar] [CrossRef] [PubMed]
- Lambiase, F.; Scipioni, S.I.; Lee, C.-J.; Ko, D.-C.; Liu, F. A state-of-the-art review on advanced joining processes for metal-composite and metal-polymer hybrid structures. Materials 2021, 14, 1890. [Google Scholar] [CrossRef] [PubMed]
- Yao, S.-S.; Jin, F.-L.; Rhee, K.Y.; Hui, D.; Park, S.-J. Recent advances in carbon-fiber-reinforced thermoplastic composites: A review. Compos. Part B Eng. 2018, 142, 241–250. [Google Scholar] [CrossRef]
- Yao, C.; Qi, Z.; Chen, W.; Zhang, C. Experimental study on CF/PEEK thermoplastic fastener: Effects of fastener matrix crystallinity and fibre content on the strength of single-lap joint. Compos. Part B Eng. 2021, 213, 108737. [Google Scholar] [CrossRef]
- Zou, H.; Yin, W.; Cai, C.; Wang, B.; Liu, A.; Yang, Z.; Li, Y.; He, X. The out-of-plane compression behavior of cross-ply AS4/PEEK thermoplastic composite laminates at high strain rates. Materials 2018, 11, 2312. [Google Scholar] [CrossRef] [Green Version]
- Wang, Y.; Li, Y.; Huan, D.; Li, L.; Liu, L.; Cheng, Y.; Liu, H. Experimental study and finite element analysis on the joining performance of GF/PP rivets. J. Thermoplast. Compos. Mater. 2020, 0892705720939142. [Google Scholar] [CrossRef]
- Yýlmaz, T.; Sýnmazçelik, T. Investigation of load bearing performances of pin connected carbon/polyphenylene sulphide composites under static loading conditions. Mater. Des. 2007, 28, 520–527. [Google Scholar] [CrossRef]
- Thoppul, S.D.; Finegan, J.; Gibson, R.F. Mechanics of mechanically fastened joints in polymer–matrix composite structures—A review. Compos. Sci. Technol. 2009, 69, 301–329. [Google Scholar] [CrossRef]
- Quinn, W.; Matthews, F. The effect of stacking sequence on the pin-bearing strength in glass fibre reinforced plastic. J. Compos. Mater. 1977, 11, 139–145. [Google Scholar] [CrossRef]
- Wang, H.-S.; Hung, C.-L.; Chang, F.-K. Bearing failure of bolted composite joints. Part I: Experimental characterization. J. Compos. Mater. 1996, 30, 1284–1313. [Google Scholar] [CrossRef]
- Park, H.-J. Effects of stacking sequence and clamping force on the bearing strengths of mechanically fastened joints in composite laminates. Compos. Struct. 2001, 53, 213–221. [Google Scholar] [CrossRef]
- McCarthy, M.; Lawlor, V.; Stanley, W.; McCarthy, C. Bolt-hole clearance effects and strength criteria in single-bolt, single-lap, composite bolted joints. Compos. Sci. Technol. 2002, 62, 1415–1431. [Google Scholar] [CrossRef]
- McCarthy, C.T.; McCarthy, M. Three-dimensional finite element analysis of single-bolt, single-lap composite bolted joints: Part II—Effects of bolt-hole clearance. Compos. Struct. 2005, 71, 159–175. [Google Scholar] [CrossRef]
- McCarthy, C.; Gray, P. An analytical model for the prediction of load distribution in highly torqued multi-bolt composite joints. Compos. Struct. 2011, 93, 287–298. [Google Scholar] [CrossRef]
- Khashaba, U.; Sallam, H.; Al-Shorbagy, A.; Seif, M. Effect of washer size and tightening torque on the performance of bolted joints in composite structures. Compos. Struct. 2006, 73, 310–317. [Google Scholar] [CrossRef]
- Khashaba, U.; Sebaey, T.; Alnefaie, K. Failure and reliability analysis of pinned-joint composite laminates: Effects of pin–hole clearance. J. Compos. Mater. 2013, 47, 2287–2298. [Google Scholar] [CrossRef]
- Khashaba, U.; Sebaey, T.; Alnefaie, K. Failure and reliability analysis of pinned-joints composite laminates: Effects of stacking sequences. Compos. Part B Eng. 2013, 45, 1694–1703. [Google Scholar] [CrossRef]
- Hassan, J.; O’Higgins, R.M.; Feser, T.; Waimer, M.; McCarthy, C.T.; Toso, N.; McCarthy, M.A. Influence of layup, stacking sequence and loading rate on energy absorption of tension-absorber joints. Compos. Struct. 2021, 261, 113327. [Google Scholar] [CrossRef]
- Giannopoulos, I.K.; Doroni-Dawes, D.; Kourousis, K.I.; Yasaee, M. Effects of bolt torque tightening on the strength and fatigue life of airframe FRP laminate bolted joints. Compos. Part B Eng. 2017, 125, 19–26. [Google Scholar] [CrossRef] [Green Version]
- Mandal, B.; Chakrabarti, A. Numerical failure assessment of multi-bolt FRP composite joints with varying sizes and preloads of bolts. Compos. Struct. 2018, 187, 169–178. [Google Scholar] [CrossRef]
- Kelly, G.; Hallström, S. Bearing strength of carbon fibre/epoxy laminates: Effects of bolt-hole clearance. Compos. Part B Eng. 2004, 35, 331–343. [Google Scholar] [CrossRef]
- Liu, F.; Yao, W.; Zhao, L.; Wu, H.; Zhang, X.; Zhang, J. An improved 2D finite element model for bolt load distribution analysis of composite multi-bolt single-lap joints. Compos. Struct. 2020, 253, 112770. [Google Scholar] [CrossRef]
- Belardi, V.G.; Fanelli, P.; Vivio, F. A novel composite bolted joint element: Application to a single-bolted joint. Procedia Struct. Integr. 2018, 12, 281–295. [Google Scholar] [CrossRef]
- Gray, P.; McCarthy, C. A highly efficient user-defined finite element for load distribution analysis of large-scale bolted composite structures. Compos. Sci. Technol. 2011, 71, 1517–1527. [Google Scholar] [CrossRef] [Green Version]
- Liu, F.; Zhang, J.; Zhao, L.; Xin, A.; Zhou, L. An analytical joint stiffness model for load transfer analysis in highly torqued multi-bolt composite joints with clearances. Compos. Struct. 2015, 131, 625–636. [Google Scholar] [CrossRef]
- Gay, A.; Lefebvre, F.; Bergamo, S.; Valiorgue, F.; Chalandon, P.; Michel, P.; Bertrand, P. Fatigue performance of a self-piercing rivet joint between aluminum and glass fiber reinforced thermoplastic composite. Int. J. Fatigue 2016, 83, 127–134. [Google Scholar] [CrossRef]
- Gay, A.; Roche, J.-M.; Lapeyronnie, P.; Valiorgue, F.; Bertrand, P. Non-destructive inspection of initial defects of PA6.6-GF50/aluminum self-piercing riveted joints and damage monitoring under mechanical static loading. Int. J. Damage Mech. 2017, 26, 1127–1146. [Google Scholar] [CrossRef]
- Yao, C.; Qi, Z.; Chen, W.; Zhang, C. Effect of CF/PEEK plasticity behavior on the mechanical performance of interference-fit joint. Polym. Compos. 2021, 42, 2574–2588. [Google Scholar] [CrossRef]
- Vieille, B.; Aucher, J.; Taleb, L. Influence of temperature on the behavior of carbon fiber fabrics reinforced PPS laminates. Mater. Sci. Eng. A 2009, 517, 51–60. [Google Scholar] [CrossRef]
- Vieille, B.; Aucher, J.; Taleb, L. Woven ply thermoplastic laminates under severe conditions: Notched laminates and bolted joints. Compos. Part B Eng. 2011, 42, 341–349. [Google Scholar] [CrossRef]
- Vieille, B.; Aucher, J.; Taleb, L. Comparative study on the behavior of woven-ply reinforced thermoplastic or thermosetting laminates under severe environmental conditions. Mater. Des. 2012, 35, 707–719. [Google Scholar] [CrossRef]
- Vieille, B.; Albouy, W.; Taleb, L. Influence of stamping on the compressive behavior and the damage mechanisms of C/PEEK laminates bolted joints under severe conditions. Compos. Part B Eng. 2015, 79, 631–638. [Google Scholar] [CrossRef]
- Sun, C.; Chen, J. A simple flow rule for characterizing nonlinear behavior of fiber composites. J. Compos. Mater. 1989, 23, 1009–1020. [Google Scholar] [CrossRef]
- Pinho, S.; Darvizeh, R.; Robinson, P.; Schuecker, C.; Camanho, P. Material and structural response of polymer-matrix fibre-reinforced composites. J. Compos. Mater. 2012, 46, 2313–2341. [Google Scholar] [CrossRef]
- Bažant, Z.P.; Oh, B.H. Crack band theory for fracture of concrete. Mater. Struct. 1983, 16, 155–177. [Google Scholar] [CrossRef] [Green Version]
- ASTM International. ASTM D5961-17 Standard Test Method for Bearing Response of Polymer Matrix Composite Laminates; ASTM International: West Conshohocken, PA, USA, 2017. [Google Scholar]
- Cao, Y.; Cao, Z.; Zhao, Y.; Zuo, D.; Tay, T. Damage progression and failure of single-lap thin-ply laminated composite bolted joints under quasi-static loading. Int. J. Mech. Sci. 2020, 170, 105360. [Google Scholar] [CrossRef]
- Chen, J.; Morozov, E.; Shankar, K. A combined elastoplastic damage model for progressive failure analysis of composite materials and structures. Compos. Struct. 2012, 94, 3478–3489. [Google Scholar] [CrossRef]
- Weeks, C.; Sun, C. Modeling non-linear rate-dependent behavior in fiber-reinforced composites. Compos. Sci. Technol. 1998, 58, 603–611. [Google Scholar] [CrossRef]
- Wang, J.; Xiao, Y. Some improvements on Sun–Chen’s one-parameter plasticity model for fibrous composites–part I: Constitutive modelling for tension–compression asymmetry response. J. Compos. Mater. 2017, 51, 405–418. [Google Scholar] [CrossRef]
- Jang, J.; Jeon, S.-Y.; Choi, J.-H.; Shim, W.; Cho, J.-M.; Yoon, S.-J.; Choi, C.-H.; Yu, W.-R. Mechanical analysis of fiber-reinforced plastics using an elastoplastic-damage constitutive equation considering asymmetric material behavior. Compos. Struct. 2021, 272, 114268. [Google Scholar] [CrossRef]
- Yoon, K.; Sun, C. Characterization of elastic-viscoplastic properties of an AS4/PEEK thermoplastic composite. J. Compos. Mater. 1991, 25, 1277–1296. [Google Scholar] [CrossRef]
- Sun, C.; Yoon, K. Elastic-plastic analysis of AS4/PEEK composite laminate using a one-parameter plasticity model. J. Compos. Mater. 1992, 26, 293–308. [Google Scholar] [CrossRef]
- Ding, S.; Tong, J.; Shen, M.; Huo, Y. Three-dimensional elastic-plastic analysis of the interlaminar stresses for the AS4/PEEK composite laminate with a circular hole. Mech. Adv. Mater. Struct. 2010, 17, 406–418. [Google Scholar] [CrossRef]
- Liu, H.; Liu, J.; Ding, Y.; Hall, Z.E.; Kong, X.; Zhou, J.; Blackman, B.R.; Kinloch, A.J.; Dear, J.P. A three-dimensional elastic-plastic damage model for predicting the impact behaviour of fibre-reinforced polymer-matrix composites. Compos. Part B Eng. 2020, 201, 108389. [Google Scholar] [CrossRef]
- Wang, X.; Guan, Z.; Du, S.; Han, G.; Li, Z. An accurate and easy to implement method for predicting matrix crack and plasticity of composites with an efficient search algorithm for LaRC05 criterion. Compos. Part A Appl. Sci. Manuf. 2020, 131, 105808. [Google Scholar] [CrossRef]
- Pinho, S.; Iannucci, L.; Robinson, P. Physically-based failure models and criteria for laminated fibre-reinforced composites with emphasis on fibre kinking: Part I: Development. Compos. Part A Appl. Sci. Manuf. 2006, 37, 63–73. [Google Scholar] [CrossRef] [Green Version]
- Egan, B. Finite element modelling and high speed testing of countersunk composite aircraft joints. Ph.D. Thesis, University of Limerick, Limerick, Ireland, 2014. [Google Scholar]
- Donadon, M.V.; De Almeida, S.F.M.; Arbelo, M.A.; de Faria, A.R. A three-dimensional ply failure model for composite structures. Int. J. Aerosp. Eng. 2009, 2009, 486063. [Google Scholar] [CrossRef] [Green Version]
- Matzenmiller, A.; Lubliner, J.; Taylor, R.L. A constitutive model for anisotropic damage in fiber-composites. Mech. Mater. 1995, 20, 125–152. [Google Scholar] [CrossRef]
- Ren, R.; Le, G.; Zhong, J.; Ma, D.; He, Q. Numerical research on elasto-plastic behaviors of fiber-reinforced polymer based composite laminates. Compos. Struct. 2019, 207, 364–372. [Google Scholar] [CrossRef]
- Simo, J.C.; Hughes, T.J. Computational Inelasticity; Springer Science & Business Media: New York, NY, USA, 2006; p. 33. ISBN 978-0-387-97520-7. [Google Scholar]
- Liu, H.; Liu, J.; Kaboglu, C.; Chai, H.; Kong, X.; Blackman, B.R.; Kinloch, A.J.; Dear, J.P. Experimental and numerical studies on the behaviour of fibre-reinforced composites subjected to soft impact loading. Procedia Struct. Integr. 2019, 17, 992–1001. [Google Scholar] [CrossRef]
- Turon, A.; Camanho, P.P.; Costa, J.; Dávila, C. A damage model for the simulation of delamination in advanced composites under variable-mode loading. Mech. Mater. 2006, 38, 1072–1089. [Google Scholar] [CrossRef] [Green Version]
- Maa, R.-H.; Cheng, J.-H. A CDM-based failure model for predicting strength of notched composite laminates. Compos. Part B Eng. 2002, 33, 479–489. [Google Scholar] [CrossRef]
- Yoon, D.; Kim, S.; Kim, J.; Doh, Y. Study on bearing strength and failure mode of a carbon-epoxy composite laminate for designing bolted joint structures. Compos. Struct. 2020, 239, 112023. [Google Scholar] [CrossRef]
- Abaqus-Inc. Abaqus User Manual, Version 2019. Available online: https://help.3ds.com/2019/english/dssimulia_established/si.macaegsarefmap/simagsa-m-quasi-sb.htm?contextscope=all (accessed on 20 January 2022).
- Egan, B.; McCarthy, M.; Frizzell, R.; Gray, P.; McCarthy, C. Modelling bearing failure in countersunk composite joints under quasi-static loading using 3D explicit finite element analysis. Compos. Struct. 2014, 108, 963–977. [Google Scholar] [CrossRef]
- Egan, B.; McCarthy, C.T.; McCarthy, M.A.; Frizzell, R. Stress analysis of single-bolt, single-lap, countersunk composite joints with variable bolt-hole clearance. Compos. Struct. 2012, 94, 1038–1051. [Google Scholar] [CrossRef] [Green Version]
- Zhai, Y.; Li, X.; Wang, L.; Li, D. Three-dimensional layer-by-layer stress analysis of single-lap, countersunk composite joints with varying joining interface conditions. Compos. Struct. 2018, 202, 1021–1031. [Google Scholar] [CrossRef]

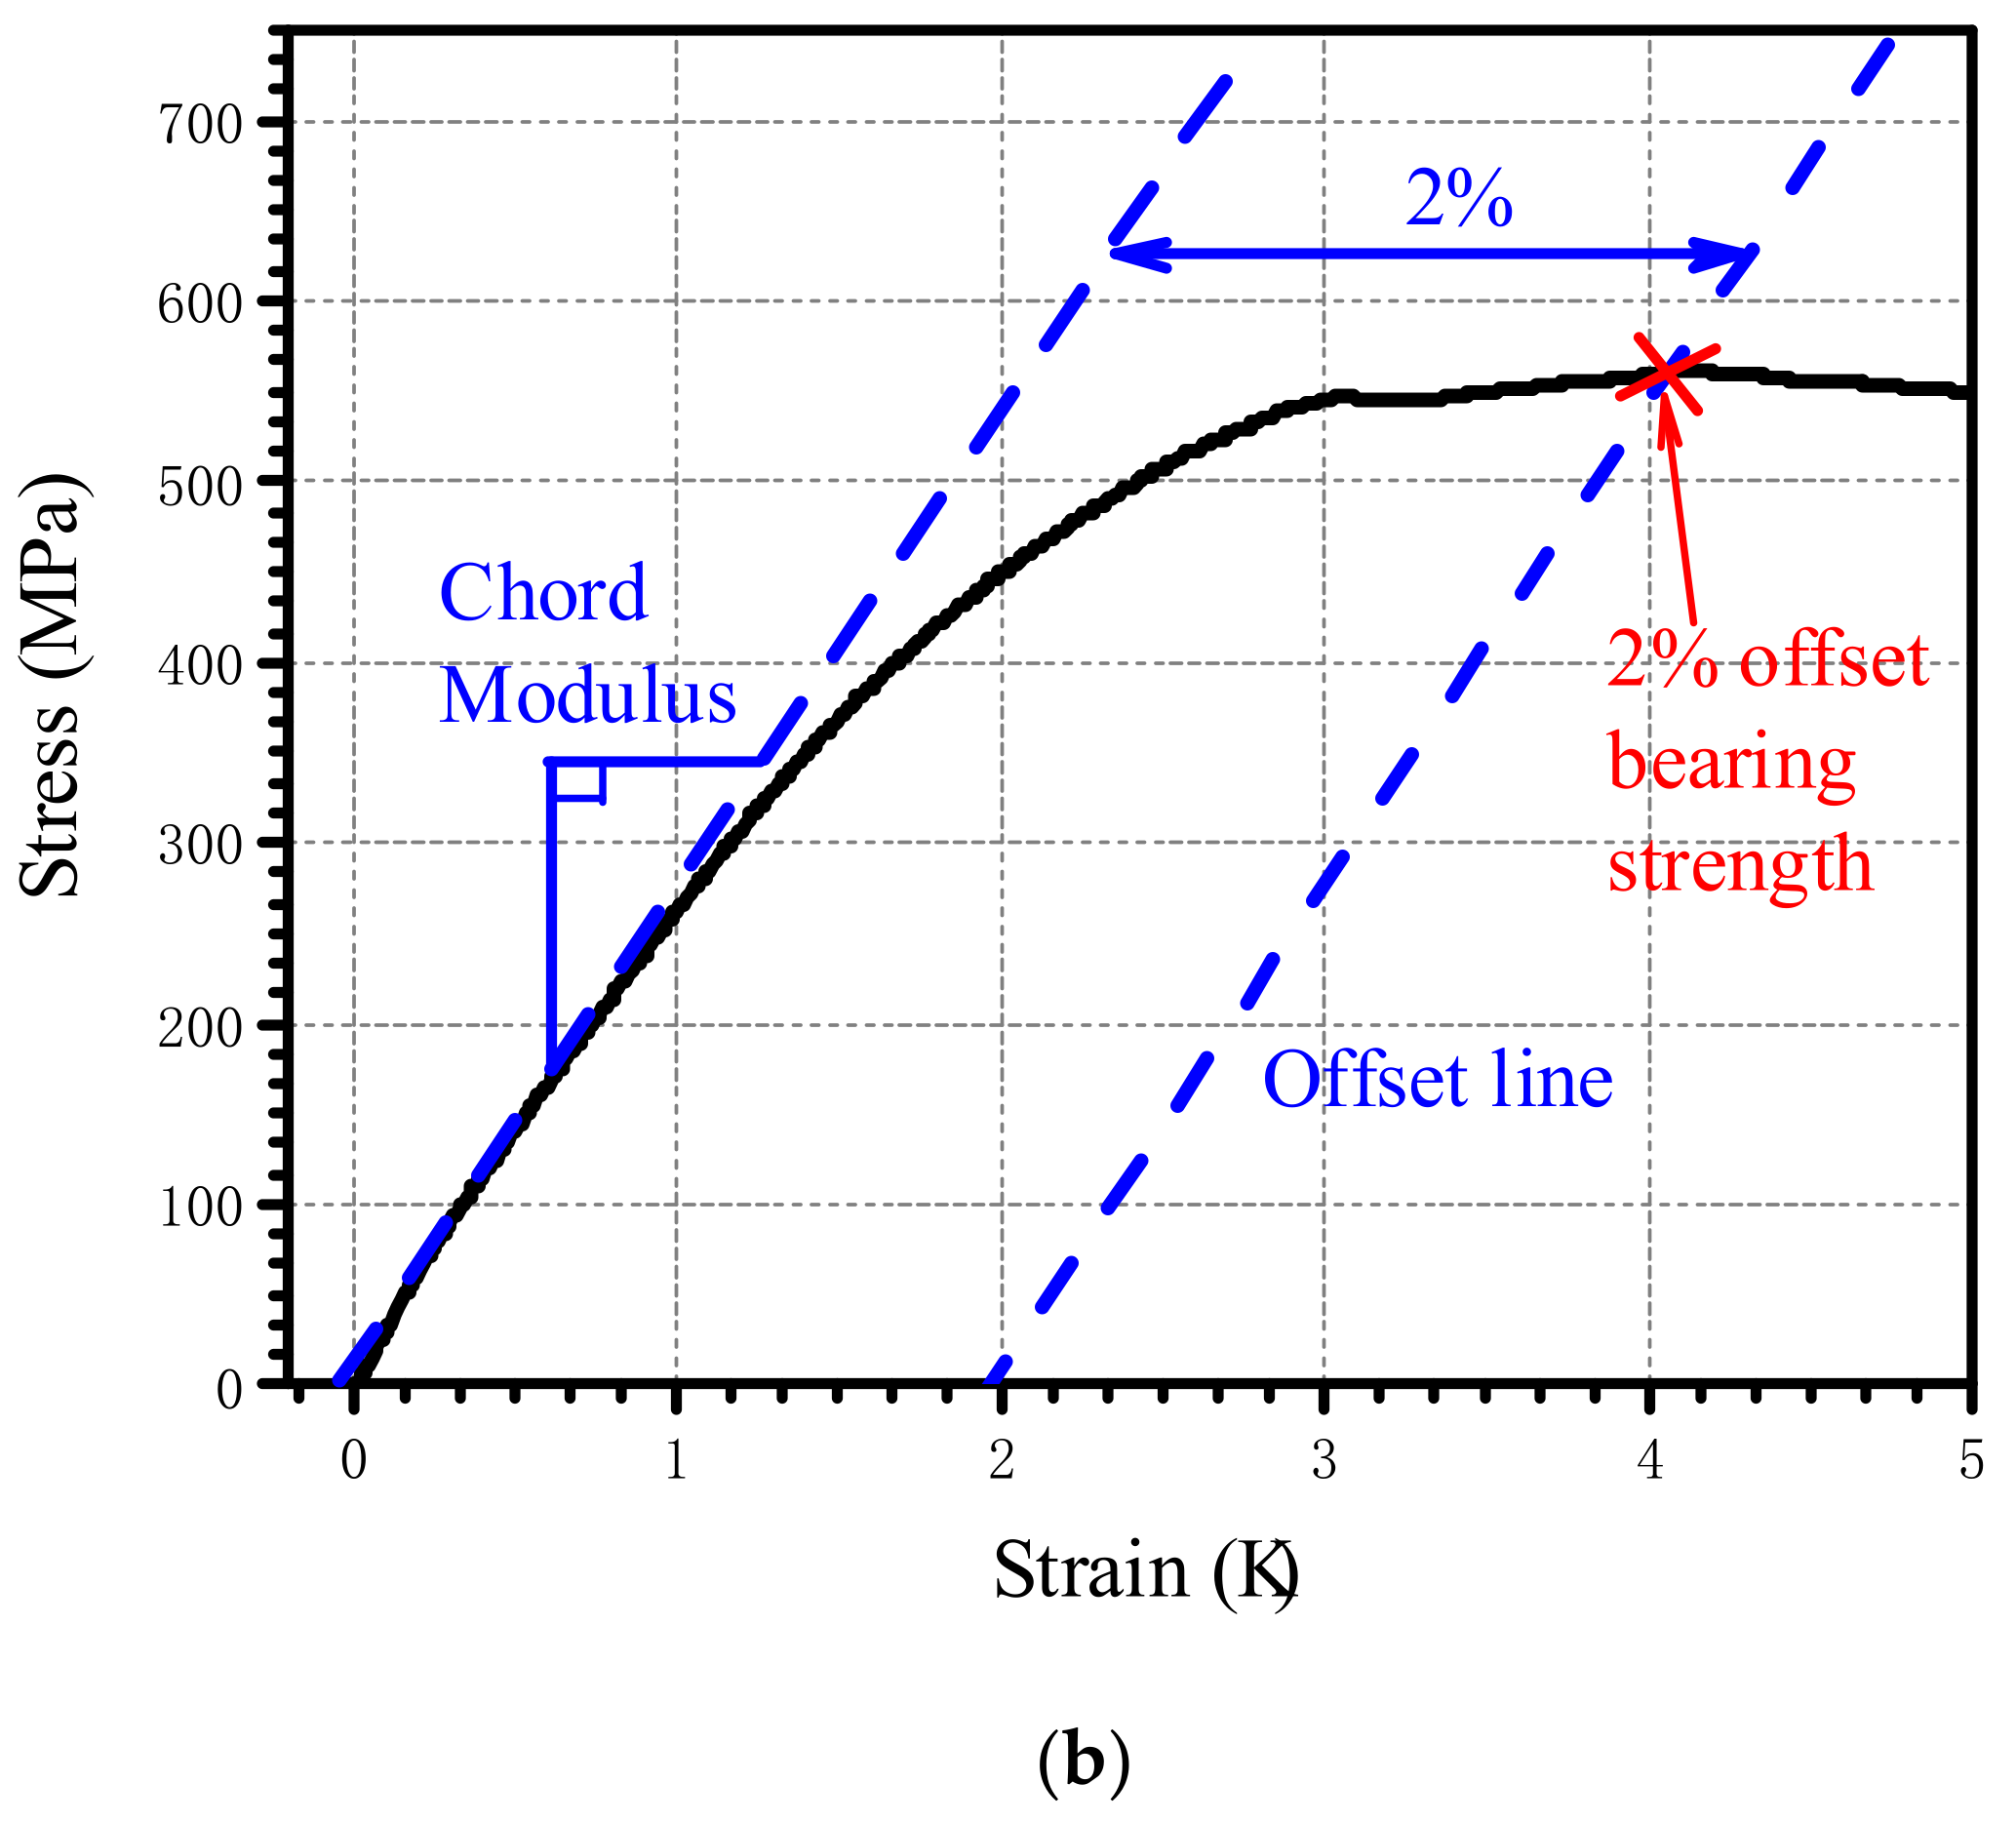


| Ultimate Bearing Strength (MPa) | 2% Offset Bearing Strength (MPa) | |
|---|---|---|
| DJ-A | 560.50 | 542.20 |
| DJ-B | 562.36 | 534.33 |
| DJ-C | 564.40 | 561.40 |
| 2023 | 1234 | 92.7 | 176 | 82.6 | 1.7 |
| 2.0 | 218 | 104 |
| Ultimate Bearing Strength (MPa) | 2% Offset Bearing Strength (MPa) | |||||
|---|---|---|---|---|---|---|
| Test | Simulation | Error * | Test | Simulation | Error * | |
| DJ-A | 560.50 | 578.94 | −3.29% | 542.20 | 570.58 | −5.23% |
| DJ-B | 562.36 | 546.83 | 2.76% | 534.33 | 542.29 | −1.49% |
| DJ-C | 564.40 | 557.93 | 1.15% | 561.40 | 557.67 | 0.66% |
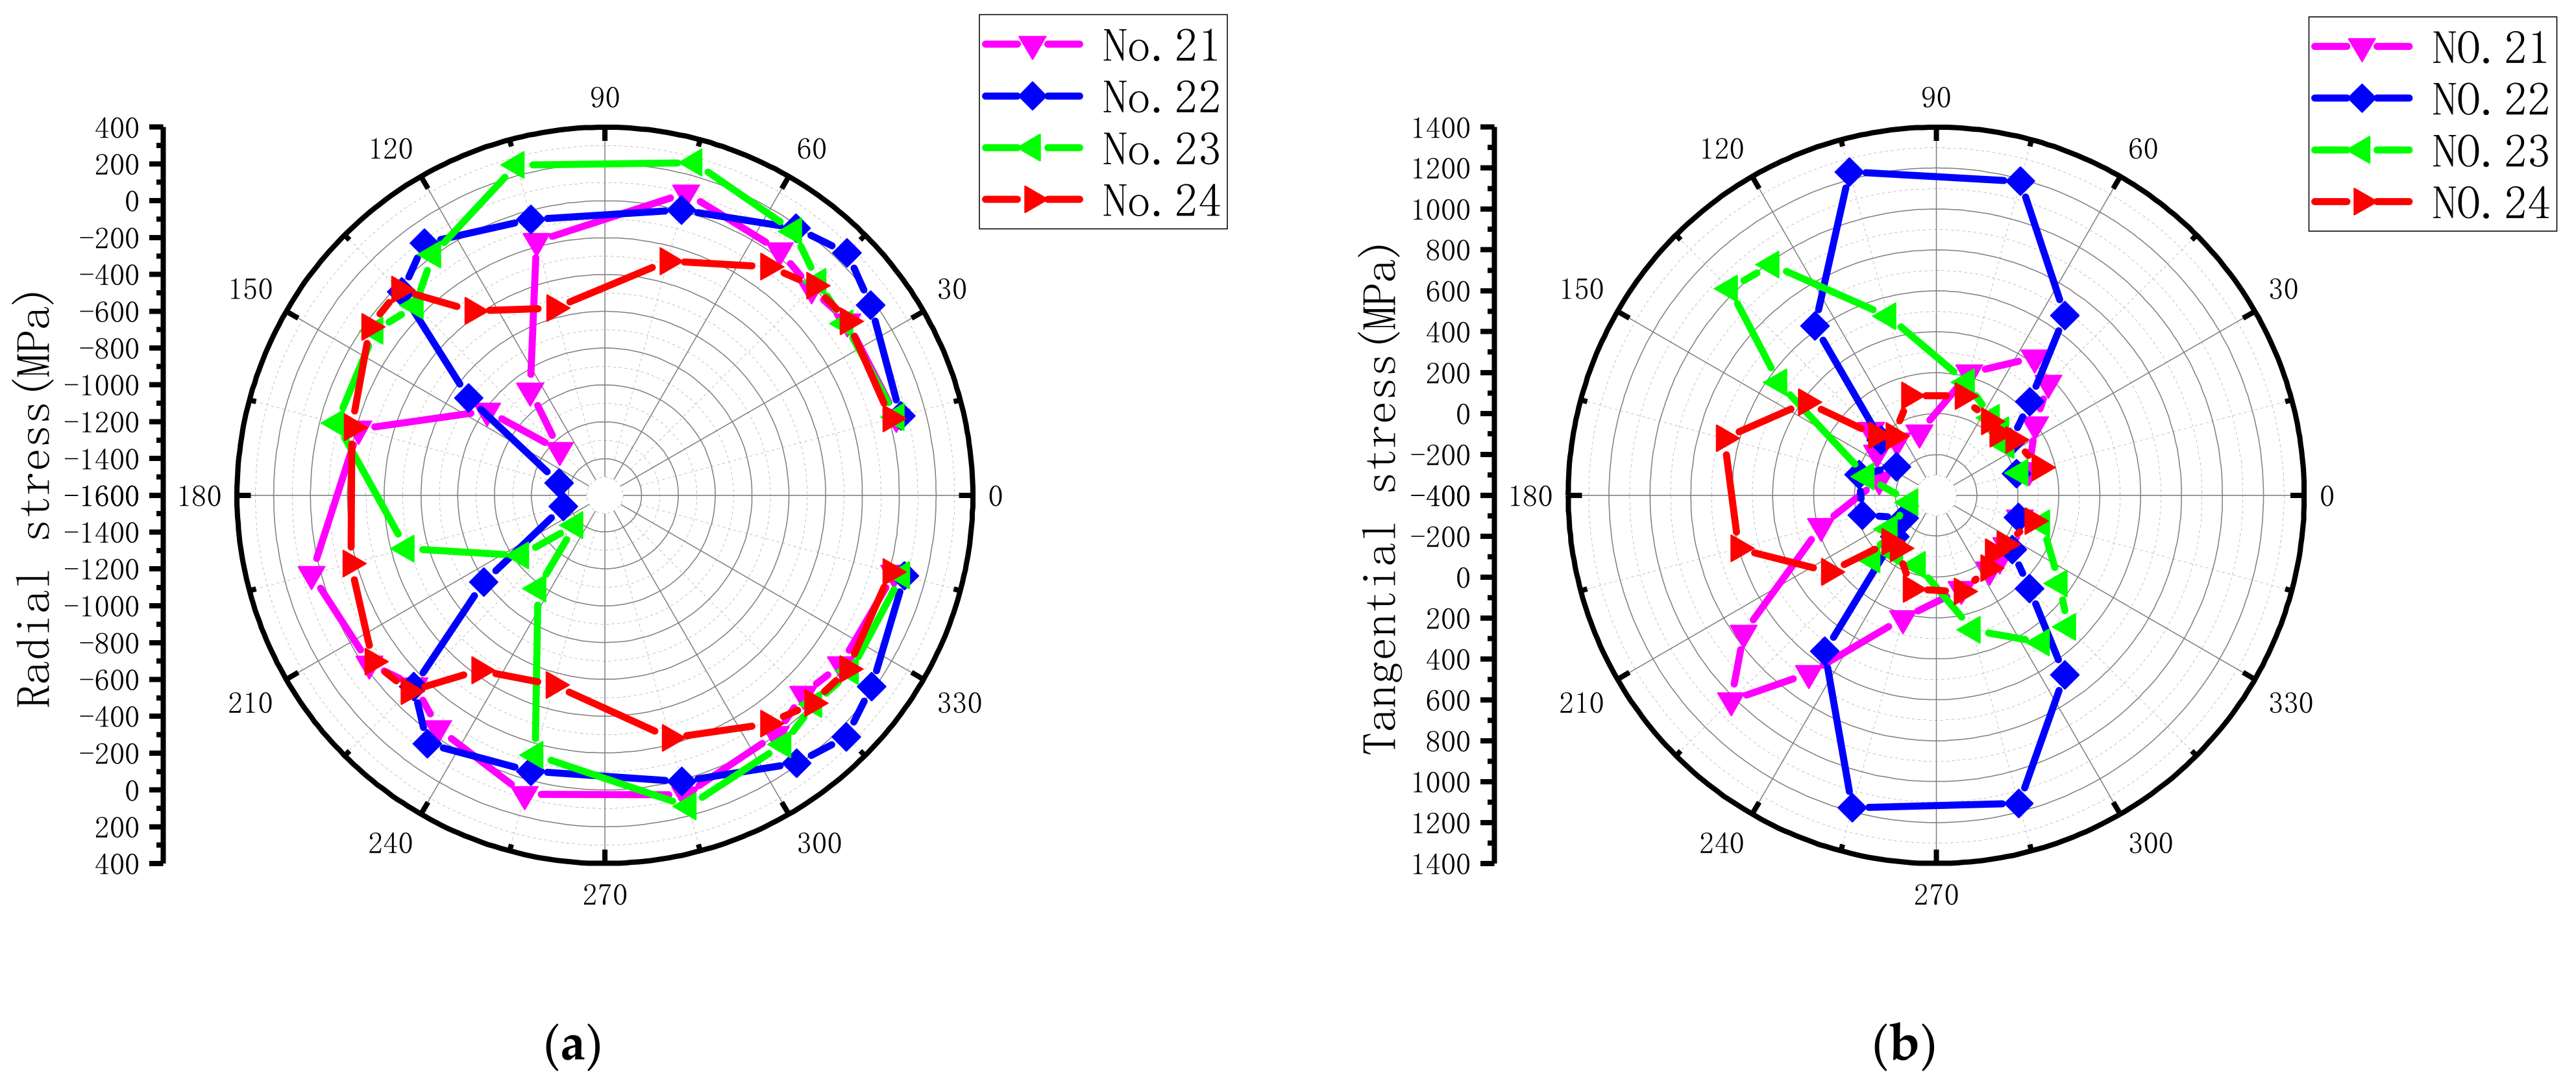
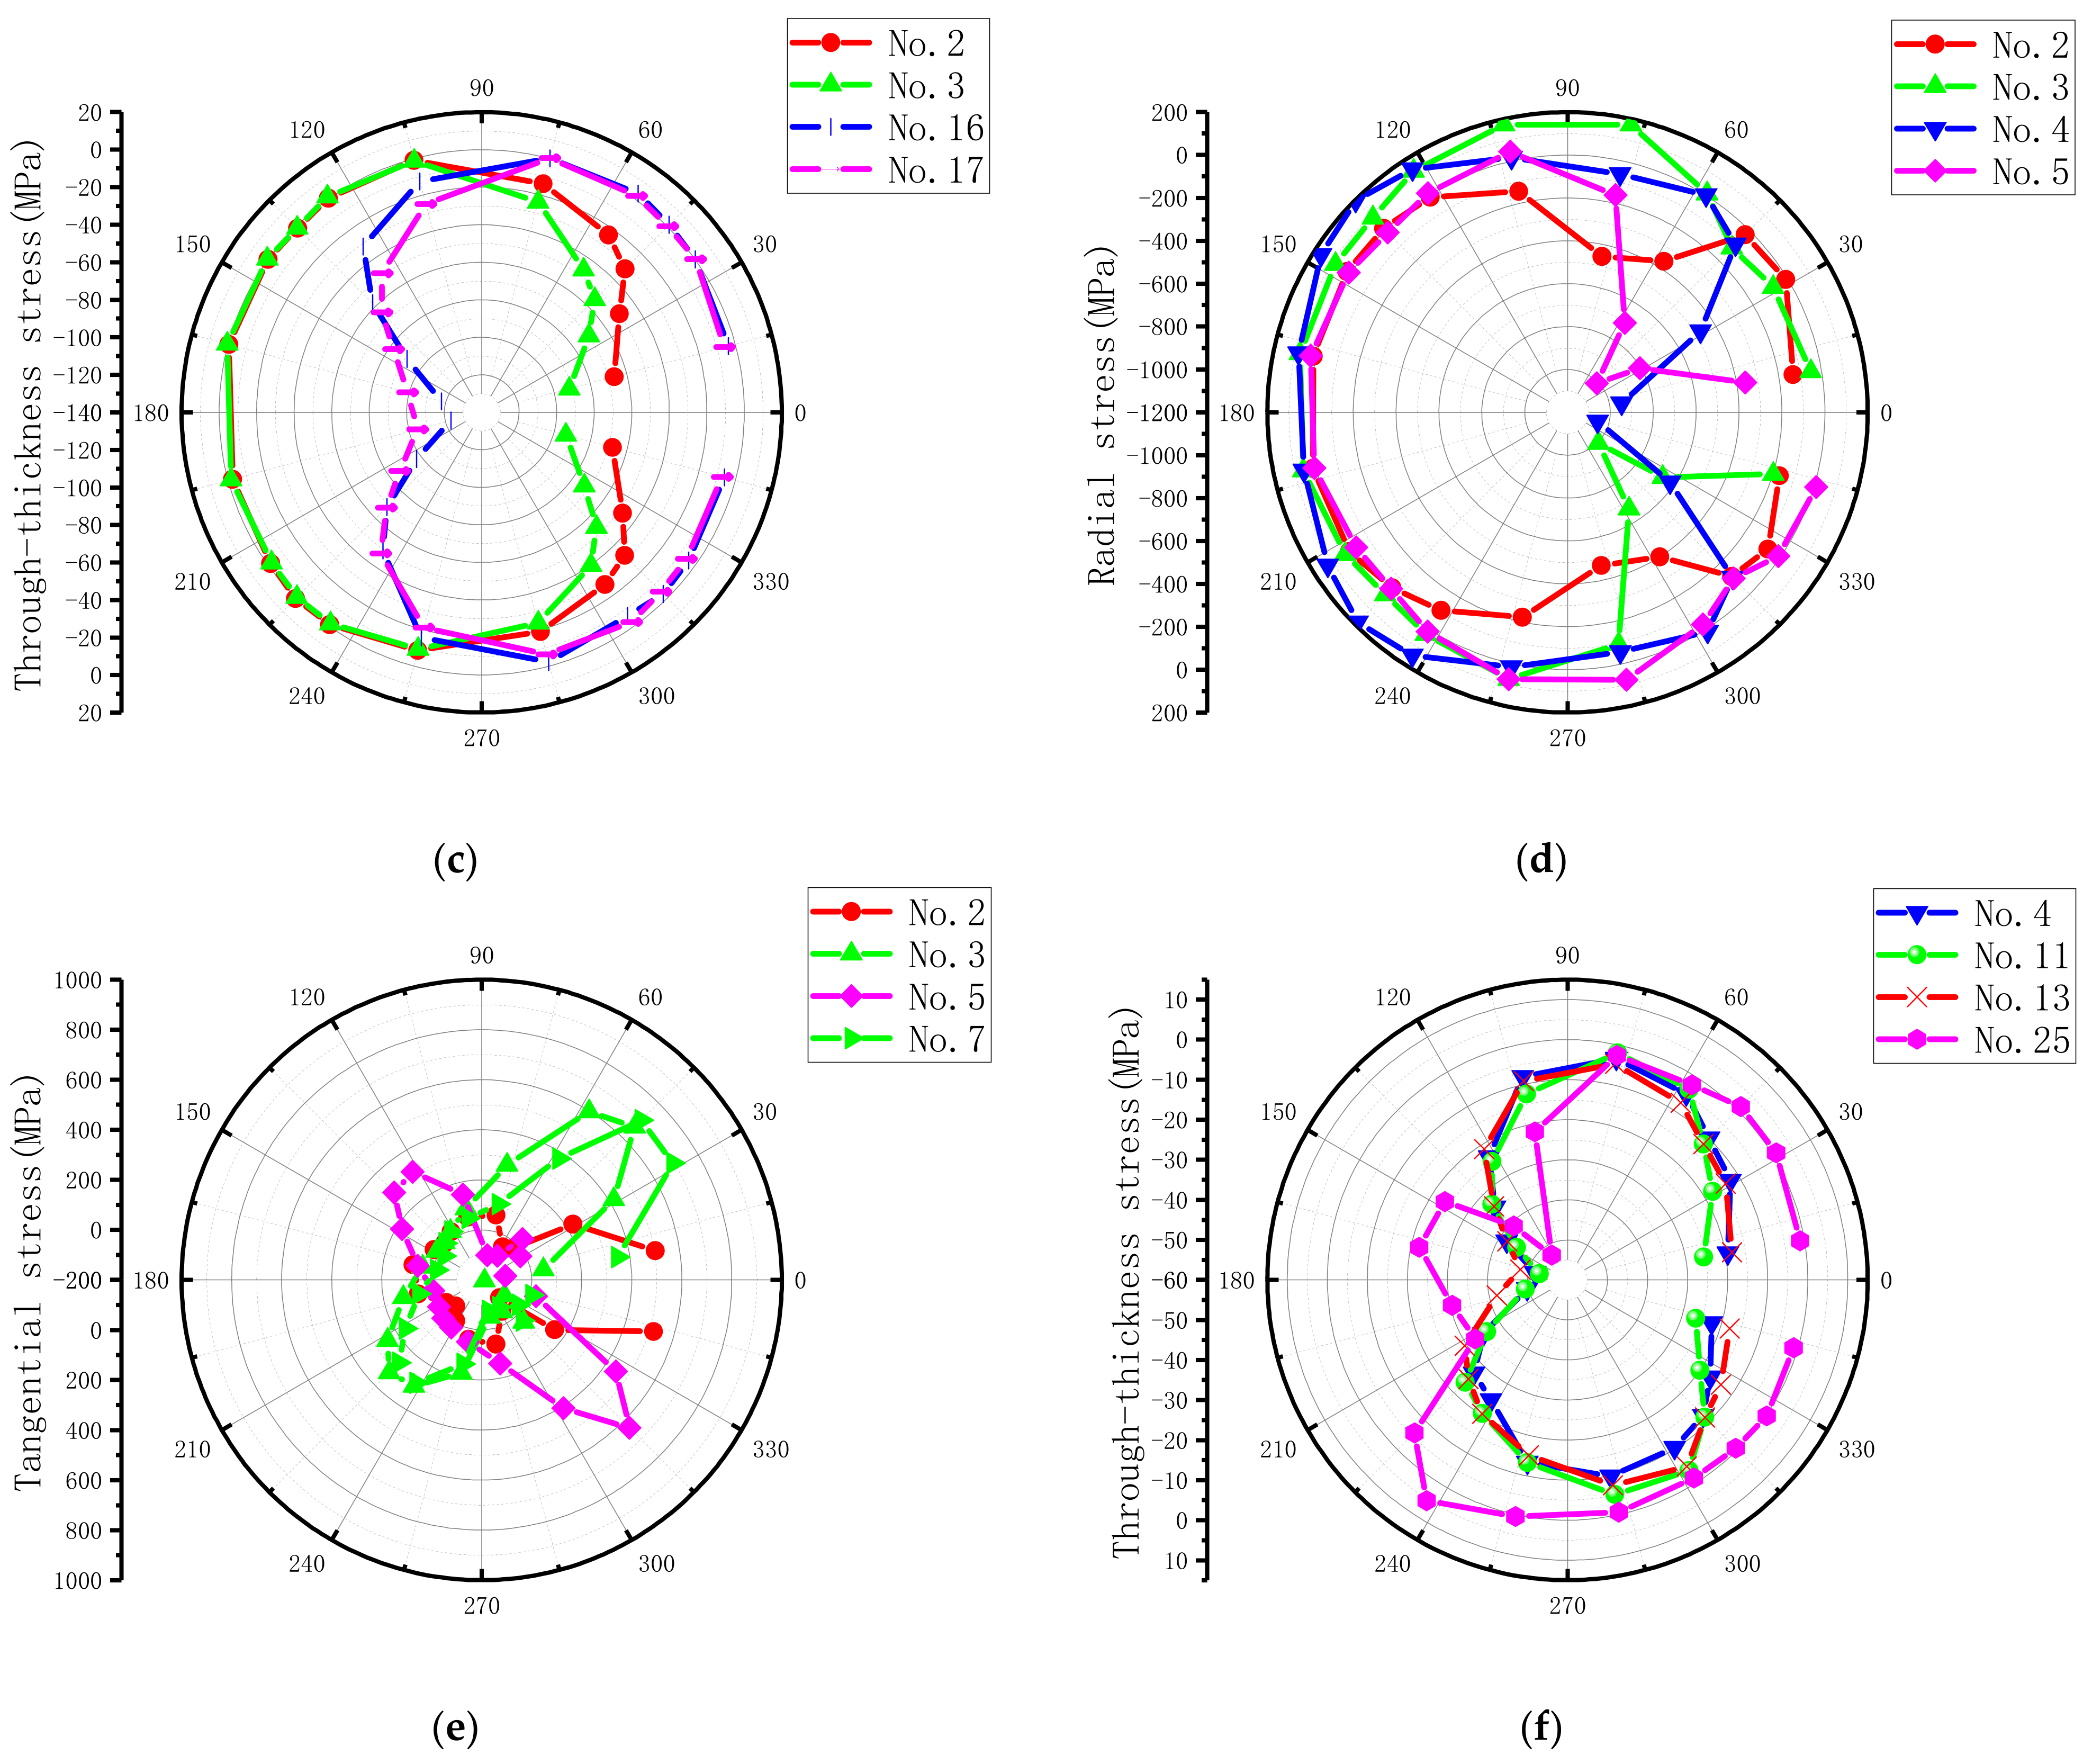
| Ply Angle | Radial Peak Stress (MPa) | Ply Number | Tangential Peak Stress (MPa) | Ply Number | Through-Thickness Peak Stress (MPa) | Ply Number | |
|---|---|---|---|---|---|---|---|
| Upper laminate | −45° | −1253.22 | No.21 | 1018.05 | No.21 | −104.62 | No.17 |
| 90° | −547.24 | No.24 | 673.80 | No.24 | −67.76 | No.2 | |
| 45° | −1370.35 | No.23 | 1028.53 | No.23 | −93.54 | No.3 | |
| 0° | −1367.04 | No.22 | 1236.67 | No.22 | −123.04 | No.16 | |
| Lower laminate | −45° | −1007.24 | No.5 | 635.70 | No.5 | −52.66 | No.25 |
| 90° | −468.67 | No.2 | 517.79 | No.2 | −47.93 | No.13 | |
| 45° | −997.04 | No.3 | 701.79 | No.7 | −52.80 | No.11 | |
| 0° | −1053.13 | No.4 | 835.62 | No.3 | −51.74 | No.4 |
| Ply Angle | Radial Peak Stress (MPa) | Ply Number | Tangential Peak Stress (Mpa) | Ply Number | Through-Thickness Peak Stress (Mpa) | Ply Number | |
|---|---|---|---|---|---|---|---|
| Upper laminate | −45° | −1216.93 | No.21 | 1013.53 | No.21 | −114.00 | No.17 |
| 90° | −532.98 | No.24 | 700.77 | No.24 | −85.18 | No.2 | |
| 45° | −1369.65 | No.23 | 1039.45 | No.23 | −119.45 | No.3 | |
| 0° | −1385.49 | No.22 | 1266.79 | No.22 | −119.62 | No.16 | |
| Lower laminate | −45° | −920.24 | No.5 | 576.90 | No.5 | −52.22 | No.25 |
| 90° | −453.72 | No.2 | 419.61 | No.2 | −45.34 | No.13 | |
| 45° | −917.18 | No.3 | 652.02 | No.7 | −47.30 | No.7 | |
| 0° | −958.37 | No.4 | 742.63 | No.4 | −49.03 | No.4 |
| Ply Angle | Radial Peak Stress Difference | Tangential Peak Stress Difference | Through-Thickness Peak Stress Difference | |
|---|---|---|---|---|
| Upper laminate | −45° | −2.90% | −0.44% | 8.97% |
| 90° | −2.61% | 4.00% | 25.71% | |
| 45° | −0.05% | 1.06% | 27.70% | |
| 0° | 1.35% | 2.44% | −2.78% | |
| Lower laminate | −45° | −8.64% | −9.25% | −0.84% |
| 90° | −3.19% | −18.92% | −5.40% | |
| 45° | −8.01% | −7.09% | −10.42% | |
| 0° | −9.00% | −11.13% | −5.24% |
| Ply Angle | Radial Peak Stress (MPa) | Ply Number | Tangential Peak Stress (MPa) | Ply Number | Through-Thickness Peak Stress (MPa) | Ply Number | |
|---|---|---|---|---|---|---|---|
| Upper laminate | −45° | −1164.09 | No.25 | 777.15 | No.25 | −86.44 | No.17 |
| 90° | −1044.92 | No.24 | 913.51 | No.24 | −67.61 | No.2 | |
| 45° | −2341.32 | No.23 | 1756.09 | No.23 | −99.53 | No.3 | |
| 0° | −2079.97 | No.22 | 1377.03 | No.22 | −103.21 | No.18 | |
| Lower laminate | −45° | −1057.99 | No.1 | 613.82 | No.5 | −40.86 | No.1 |
| 90° | −311.20 | No.2 | 537.24 | No.2 | −20.45 | No.13 | |
| 45° | −1053.36 | No.3 | 847.04 | No.3 | −29.16 | No.7 | |
| 0° | −1449.25 | No.4 | 1025.82 | No.4 | −26.81 | No.10 |
| Ply Angle | Radial Peak Stress Difference | Tangential Peak Stress Difference | Through-Thickness Peak Stress Difference | |
|---|---|---|---|---|
| Upper laminate | −45° | −7.11% | −23.66% | −17.38% |
| 90° | 90.94% | 35.58% | −0.22% | |
| 45° | 70.86% | 70.74% | 6.40% | |
| 0° | 52.15% | 11.35% | −16.12% | |
| Lower laminate | −45° | 5.04% | −3.44% | −22.41% |
| 90° | −33.60% | 3.81% | −57.33% | |
| 45° | 5.65% | 20.70% | −44.77% | |
| 0° | 37.61% | 22.76% | −48.18% |
Publisher’s Note: MDPI stays neutral with regard to jurisdictional claims in published maps and institutional affiliations. |
© 2022 by the authors. Licensee MDPI, Basel, Switzerland. This article is an open access article distributed under the terms and conditions of the Creative Commons Attribution (CC BY) license (https://creativecommons.org/licenses/by/4.0/).
Share and Cite
Zhang, J.; Chen, X.; Tian, A.; Fan, Y. Tests and Numerical Study of Single-Lap Thermoplastic Composite Joints Bolted by Countersunk. Materials 2022, 15, 2386. https://doi.org/10.3390/ma15072386
Zhang J, Chen X, Tian A, Fan Y. Tests and Numerical Study of Single-Lap Thermoplastic Composite Joints Bolted by Countersunk. Materials. 2022; 15(7):2386. https://doi.org/10.3390/ma15072386
Chicago/Turabian StyleZhang, Jian, Xiuhua Chen, Aiqin Tian, and Yin Fan. 2022. "Tests and Numerical Study of Single-Lap Thermoplastic Composite Joints Bolted by Countersunk" Materials 15, no. 7: 2386. https://doi.org/10.3390/ma15072386
APA StyleZhang, J., Chen, X., Tian, A., & Fan, Y. (2022). Tests and Numerical Study of Single-Lap Thermoplastic Composite Joints Bolted by Countersunk. Materials, 15(7), 2386. https://doi.org/10.3390/ma15072386