
Improving the Mechanical Properties of Fly Ash-Based Geopolymer Composites with PVA Fiber and Powder


Abstract
:1. Introduction
2. Materials and Methods
2.1. Materials and Properties
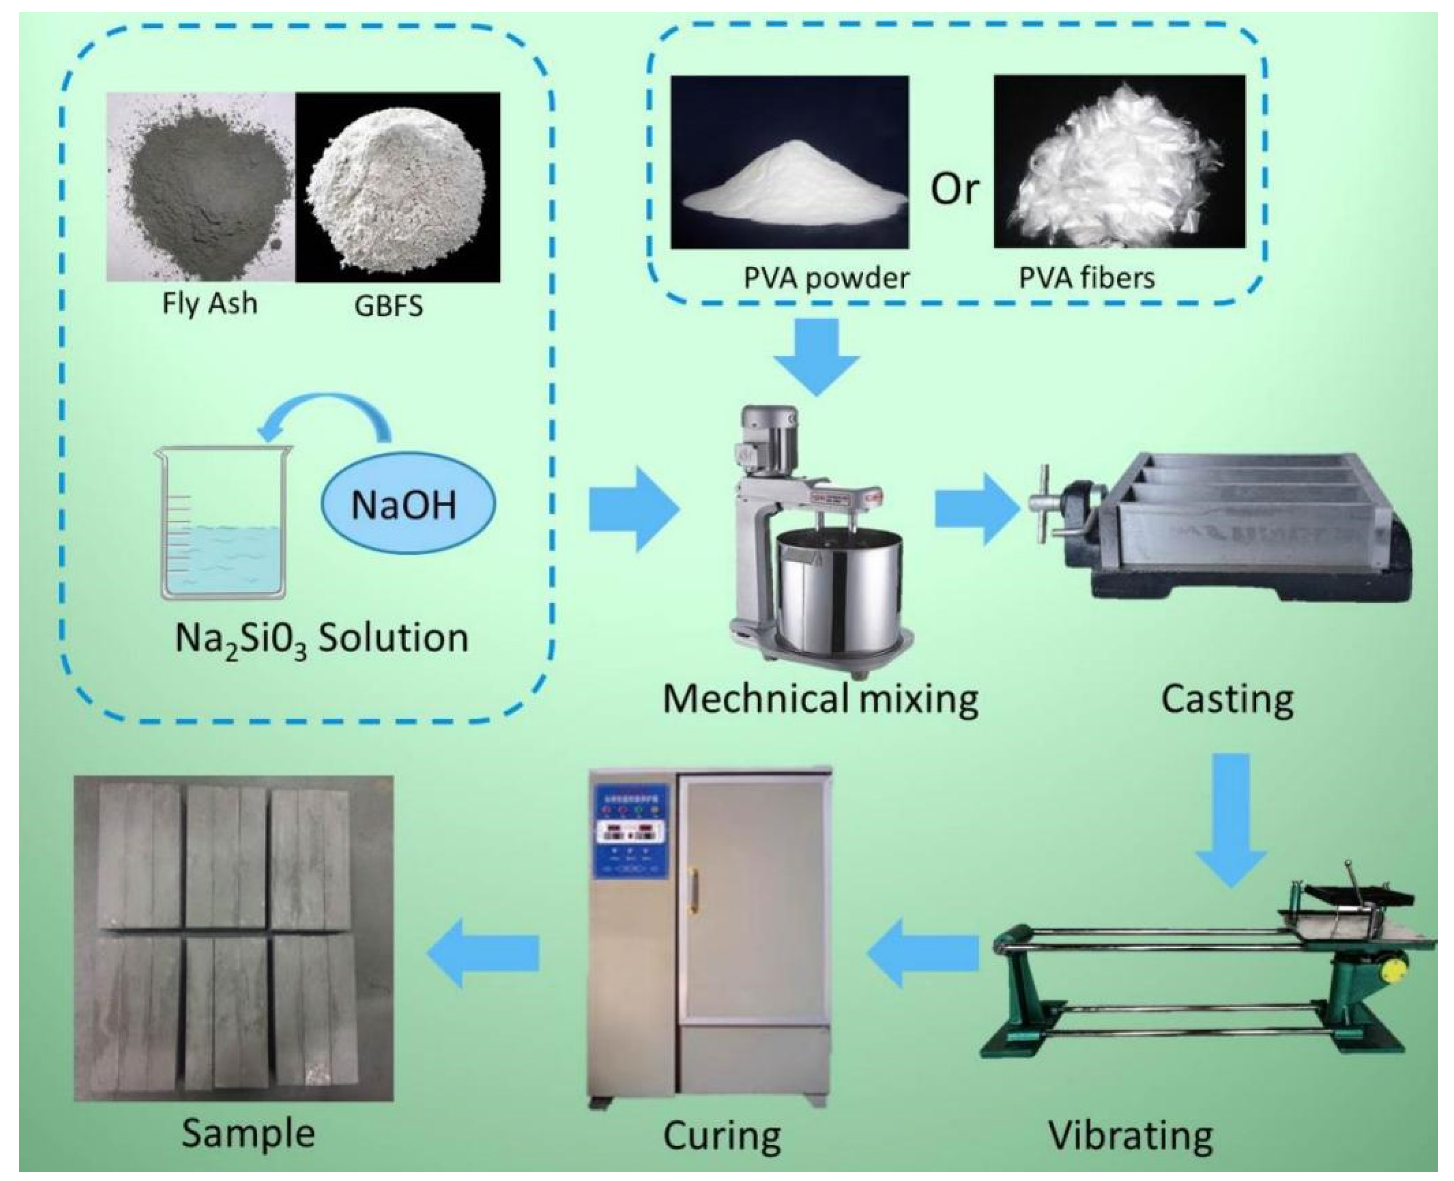
2.2. Preparation of Geopolymer Composite Samples
2.3. Characterization
3. Results and Discussion
3.1. Toughness Behavior
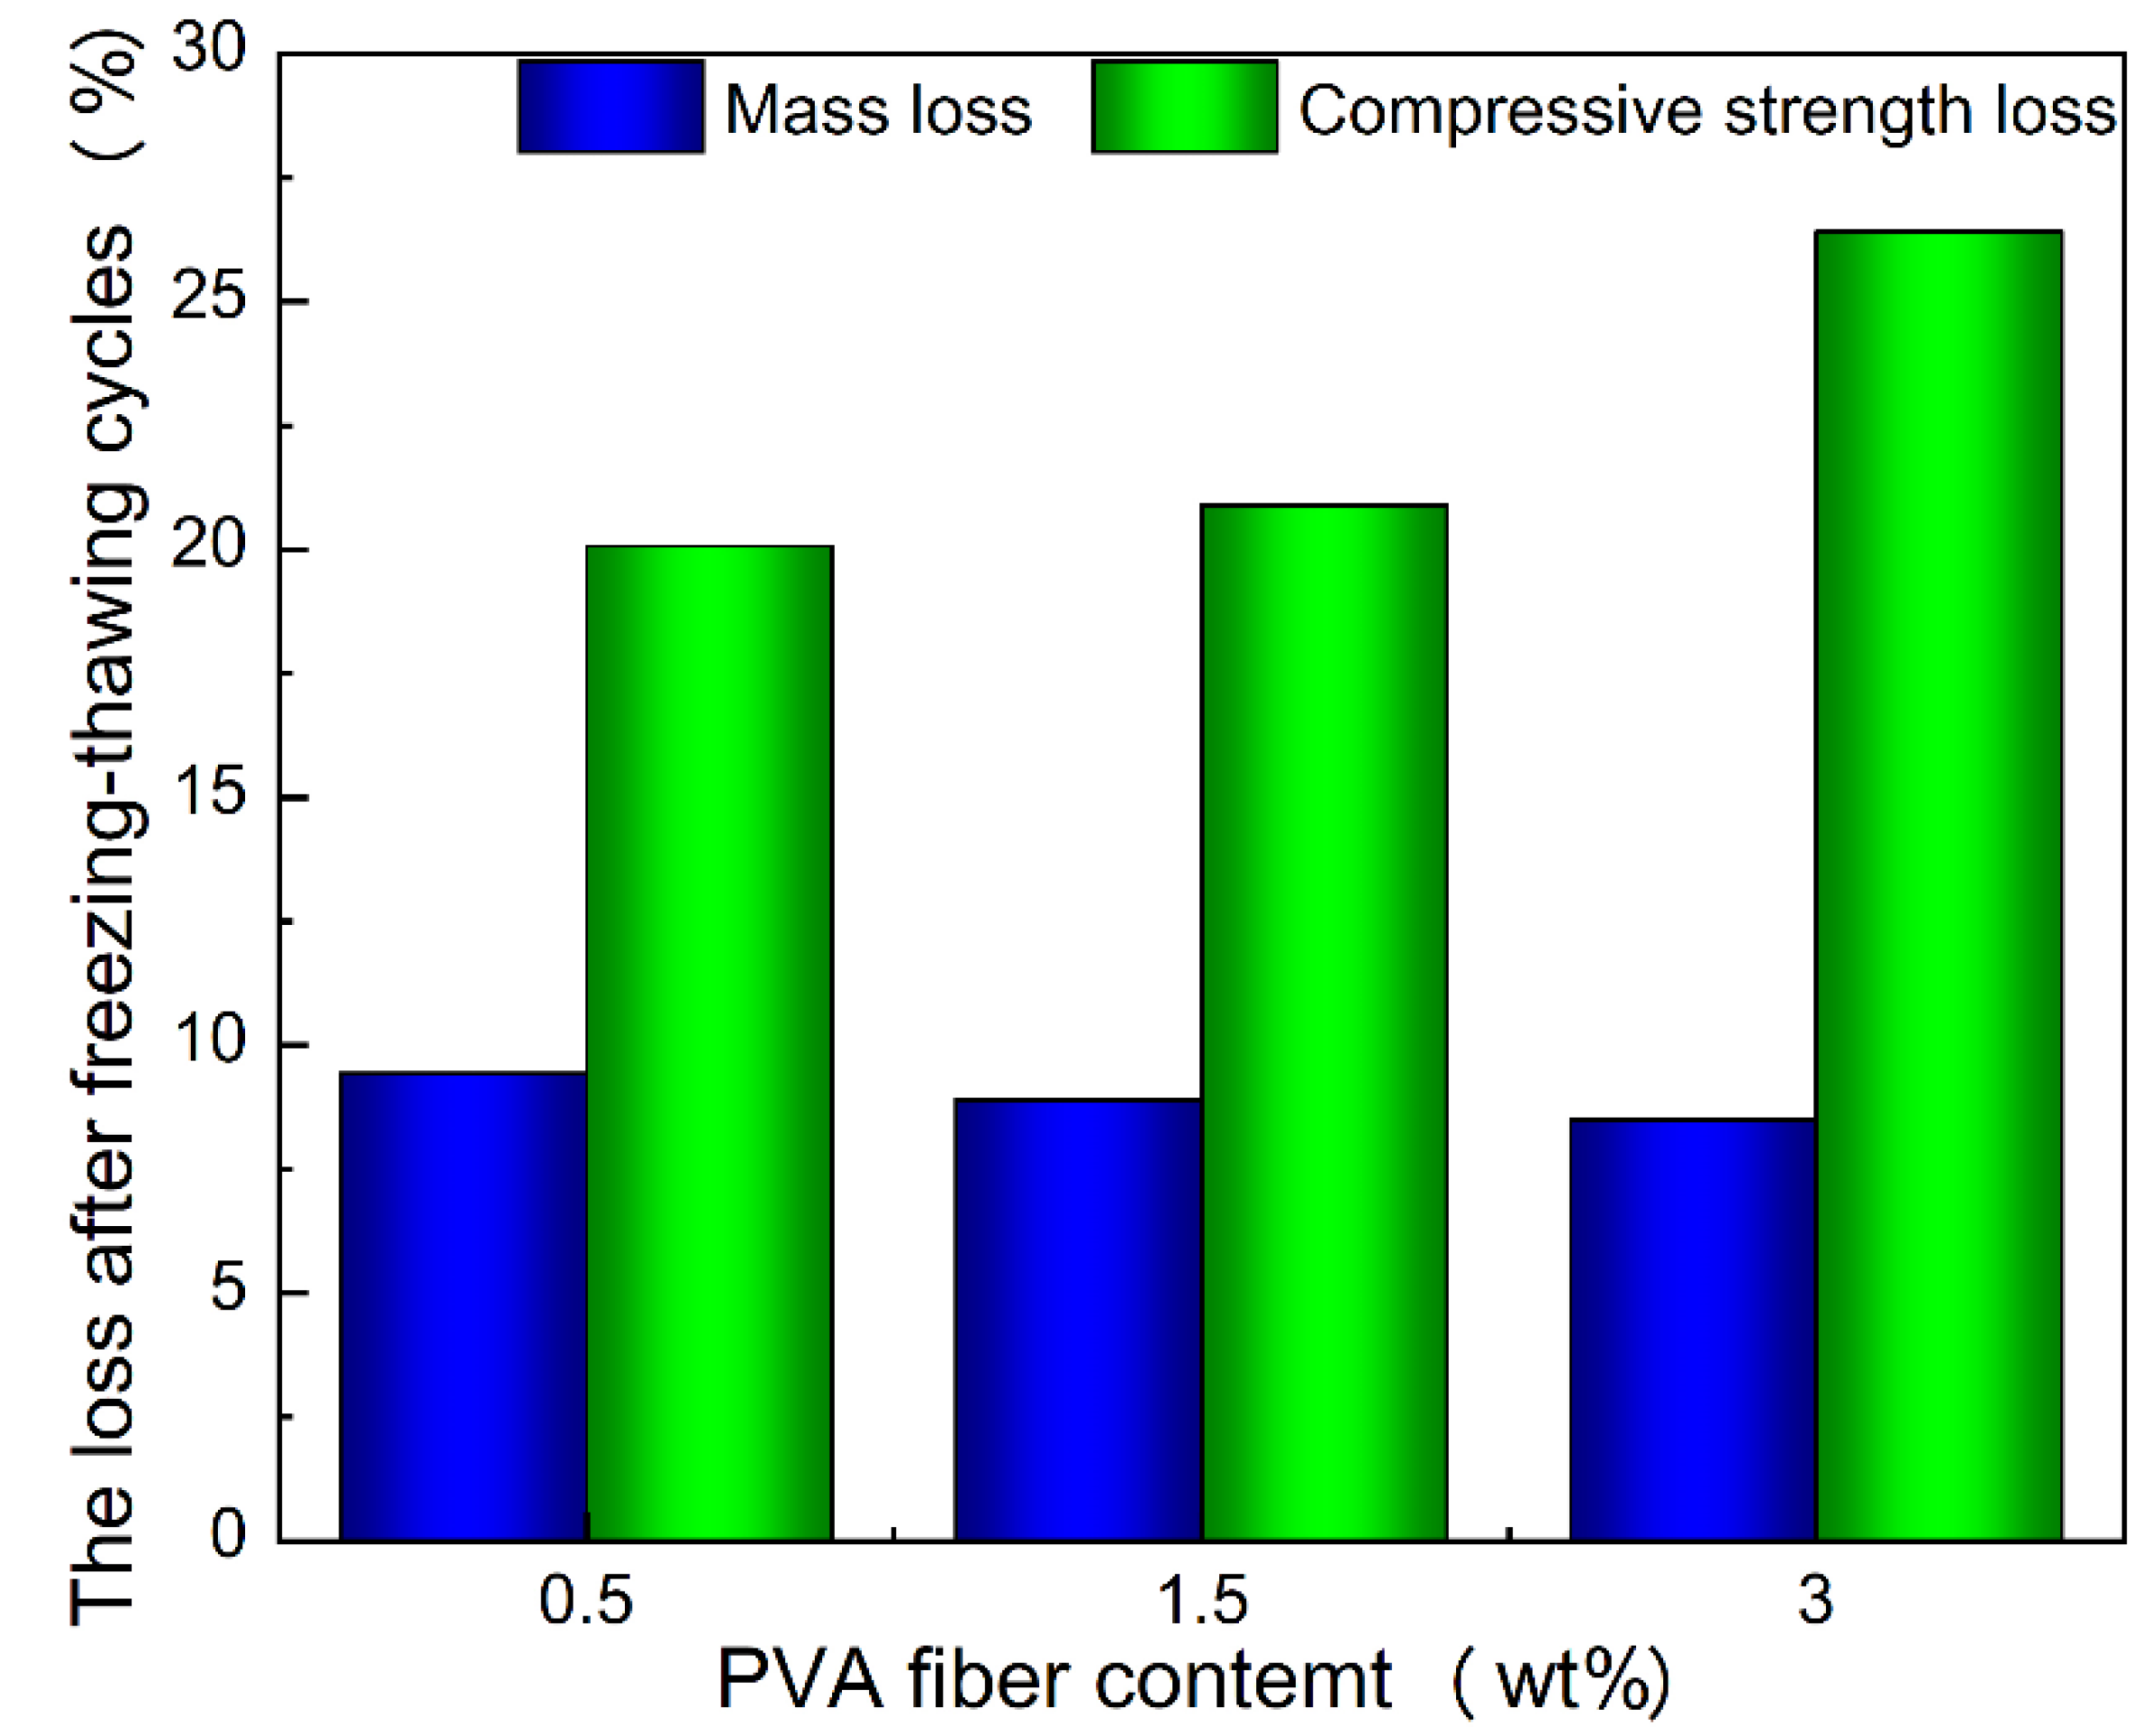
3.2. Freeze–Thaw Resistance Properties
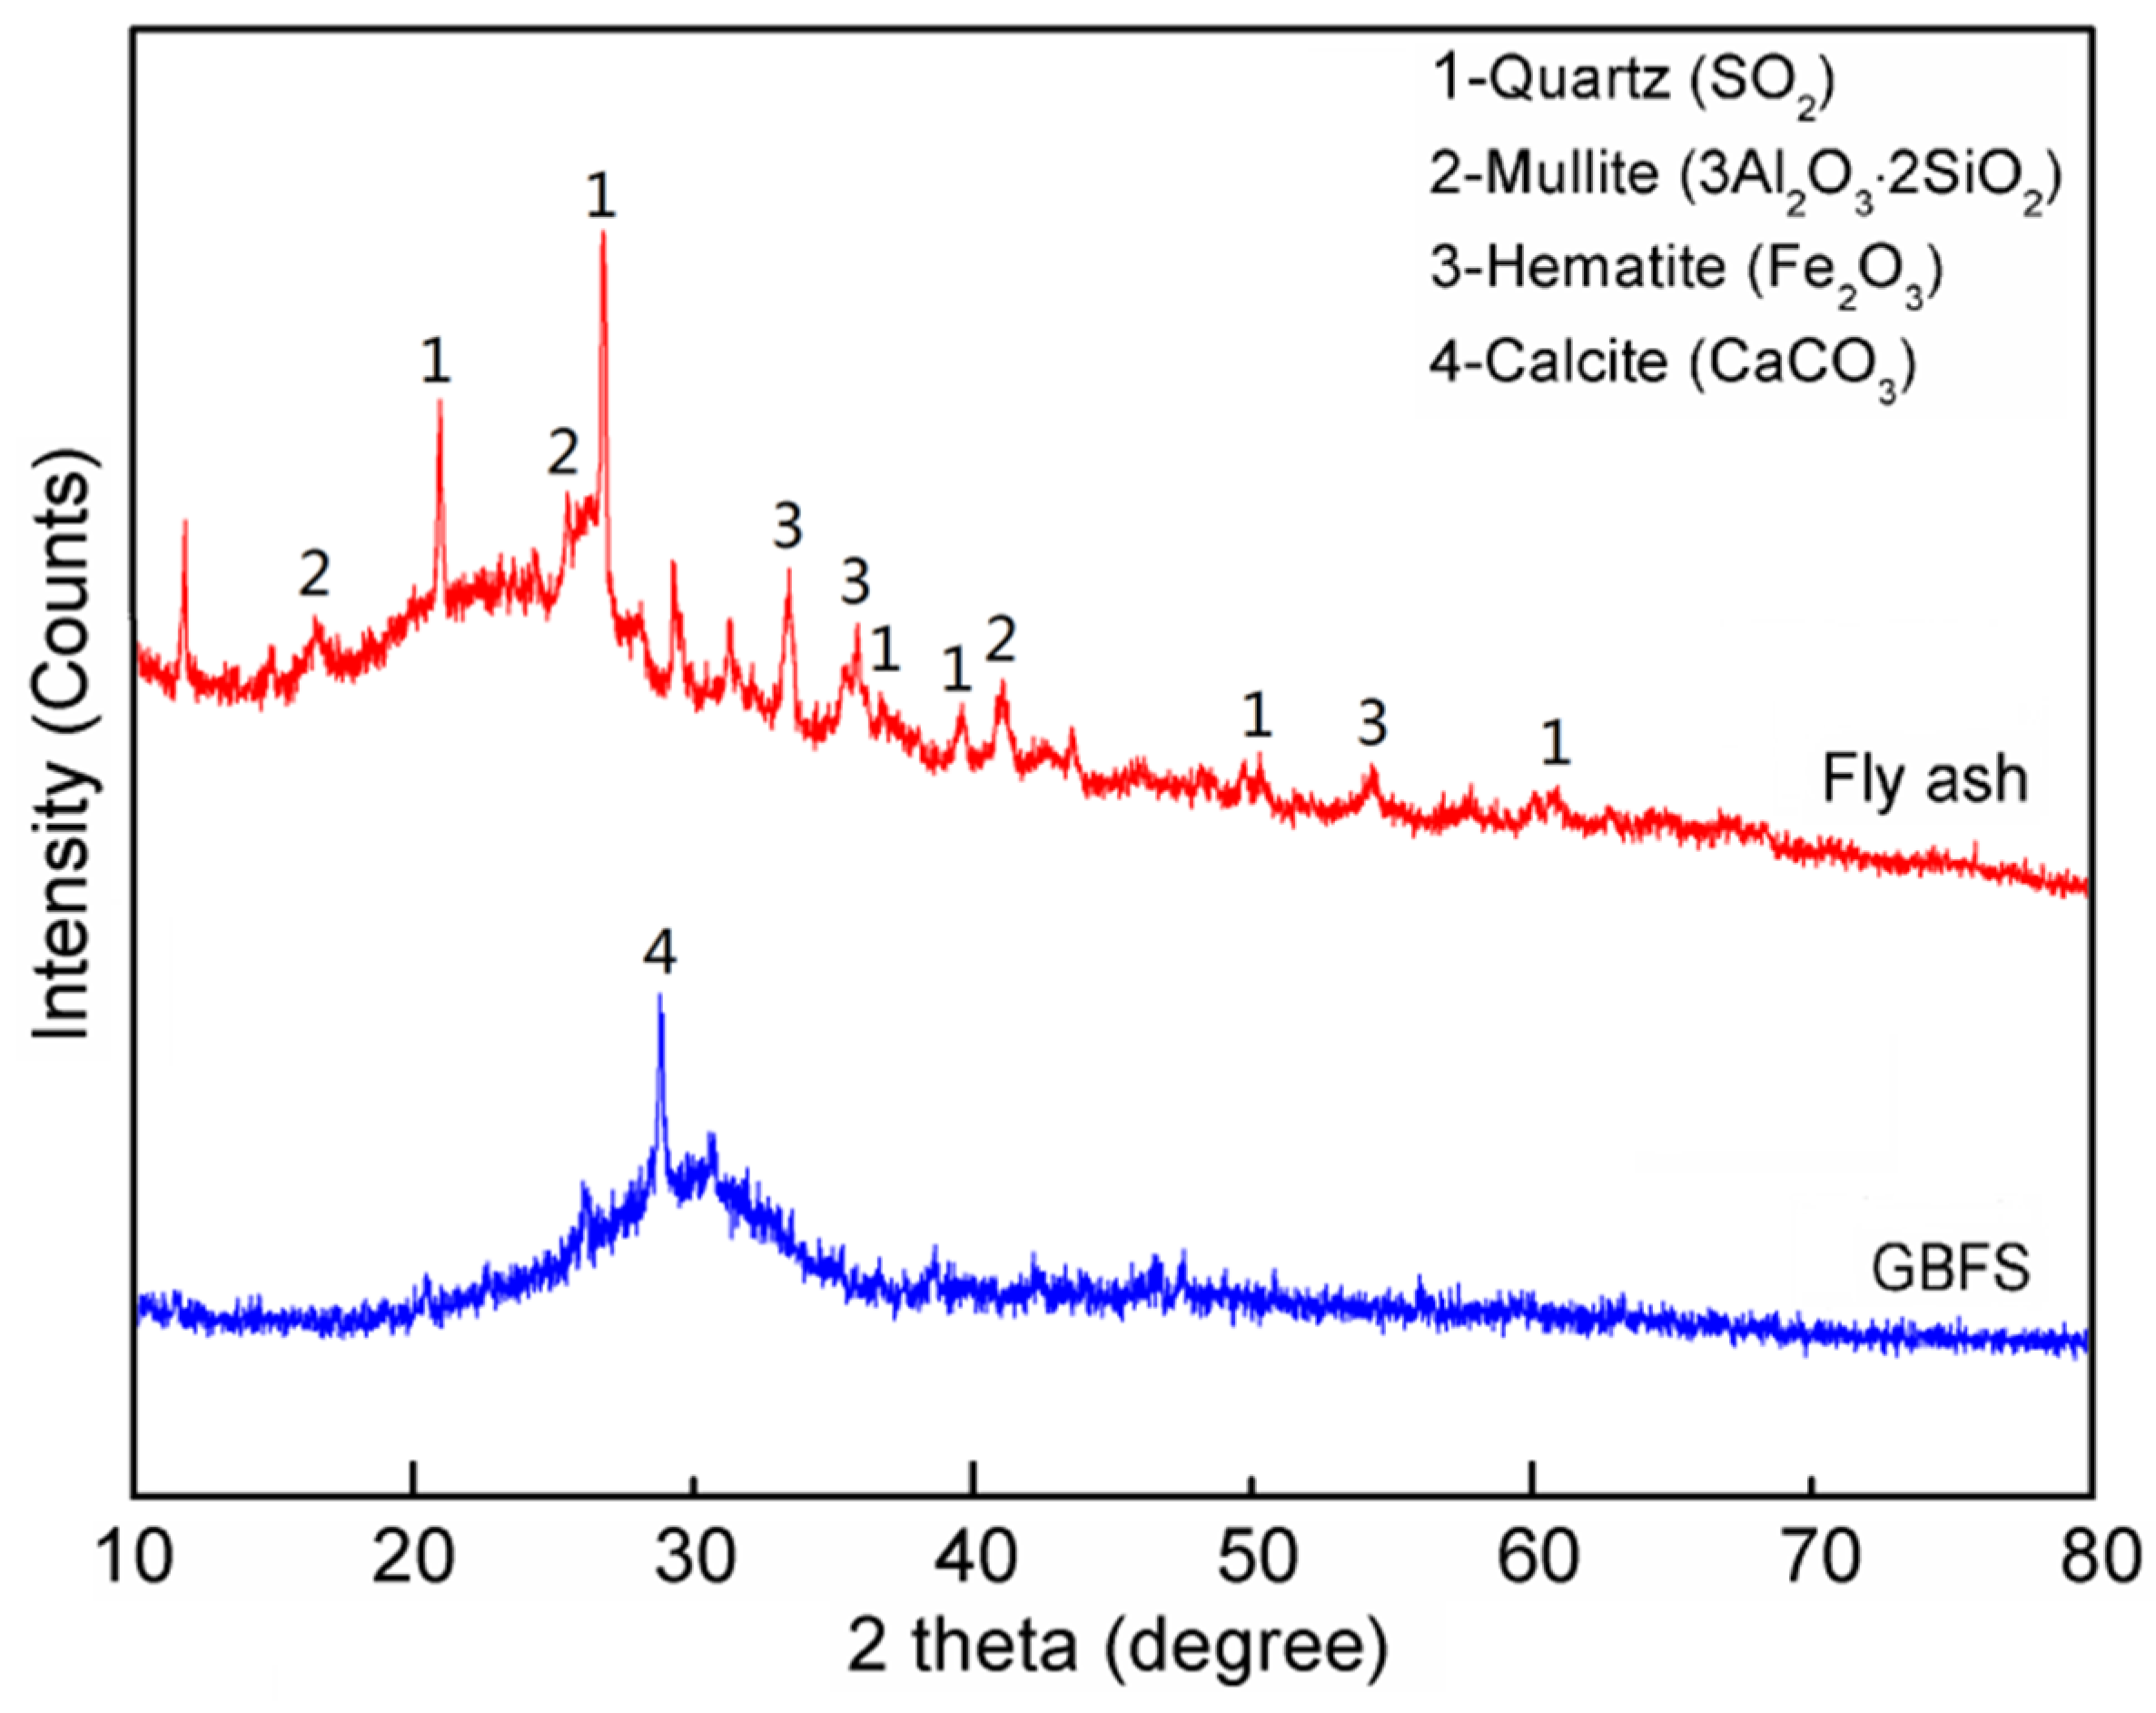
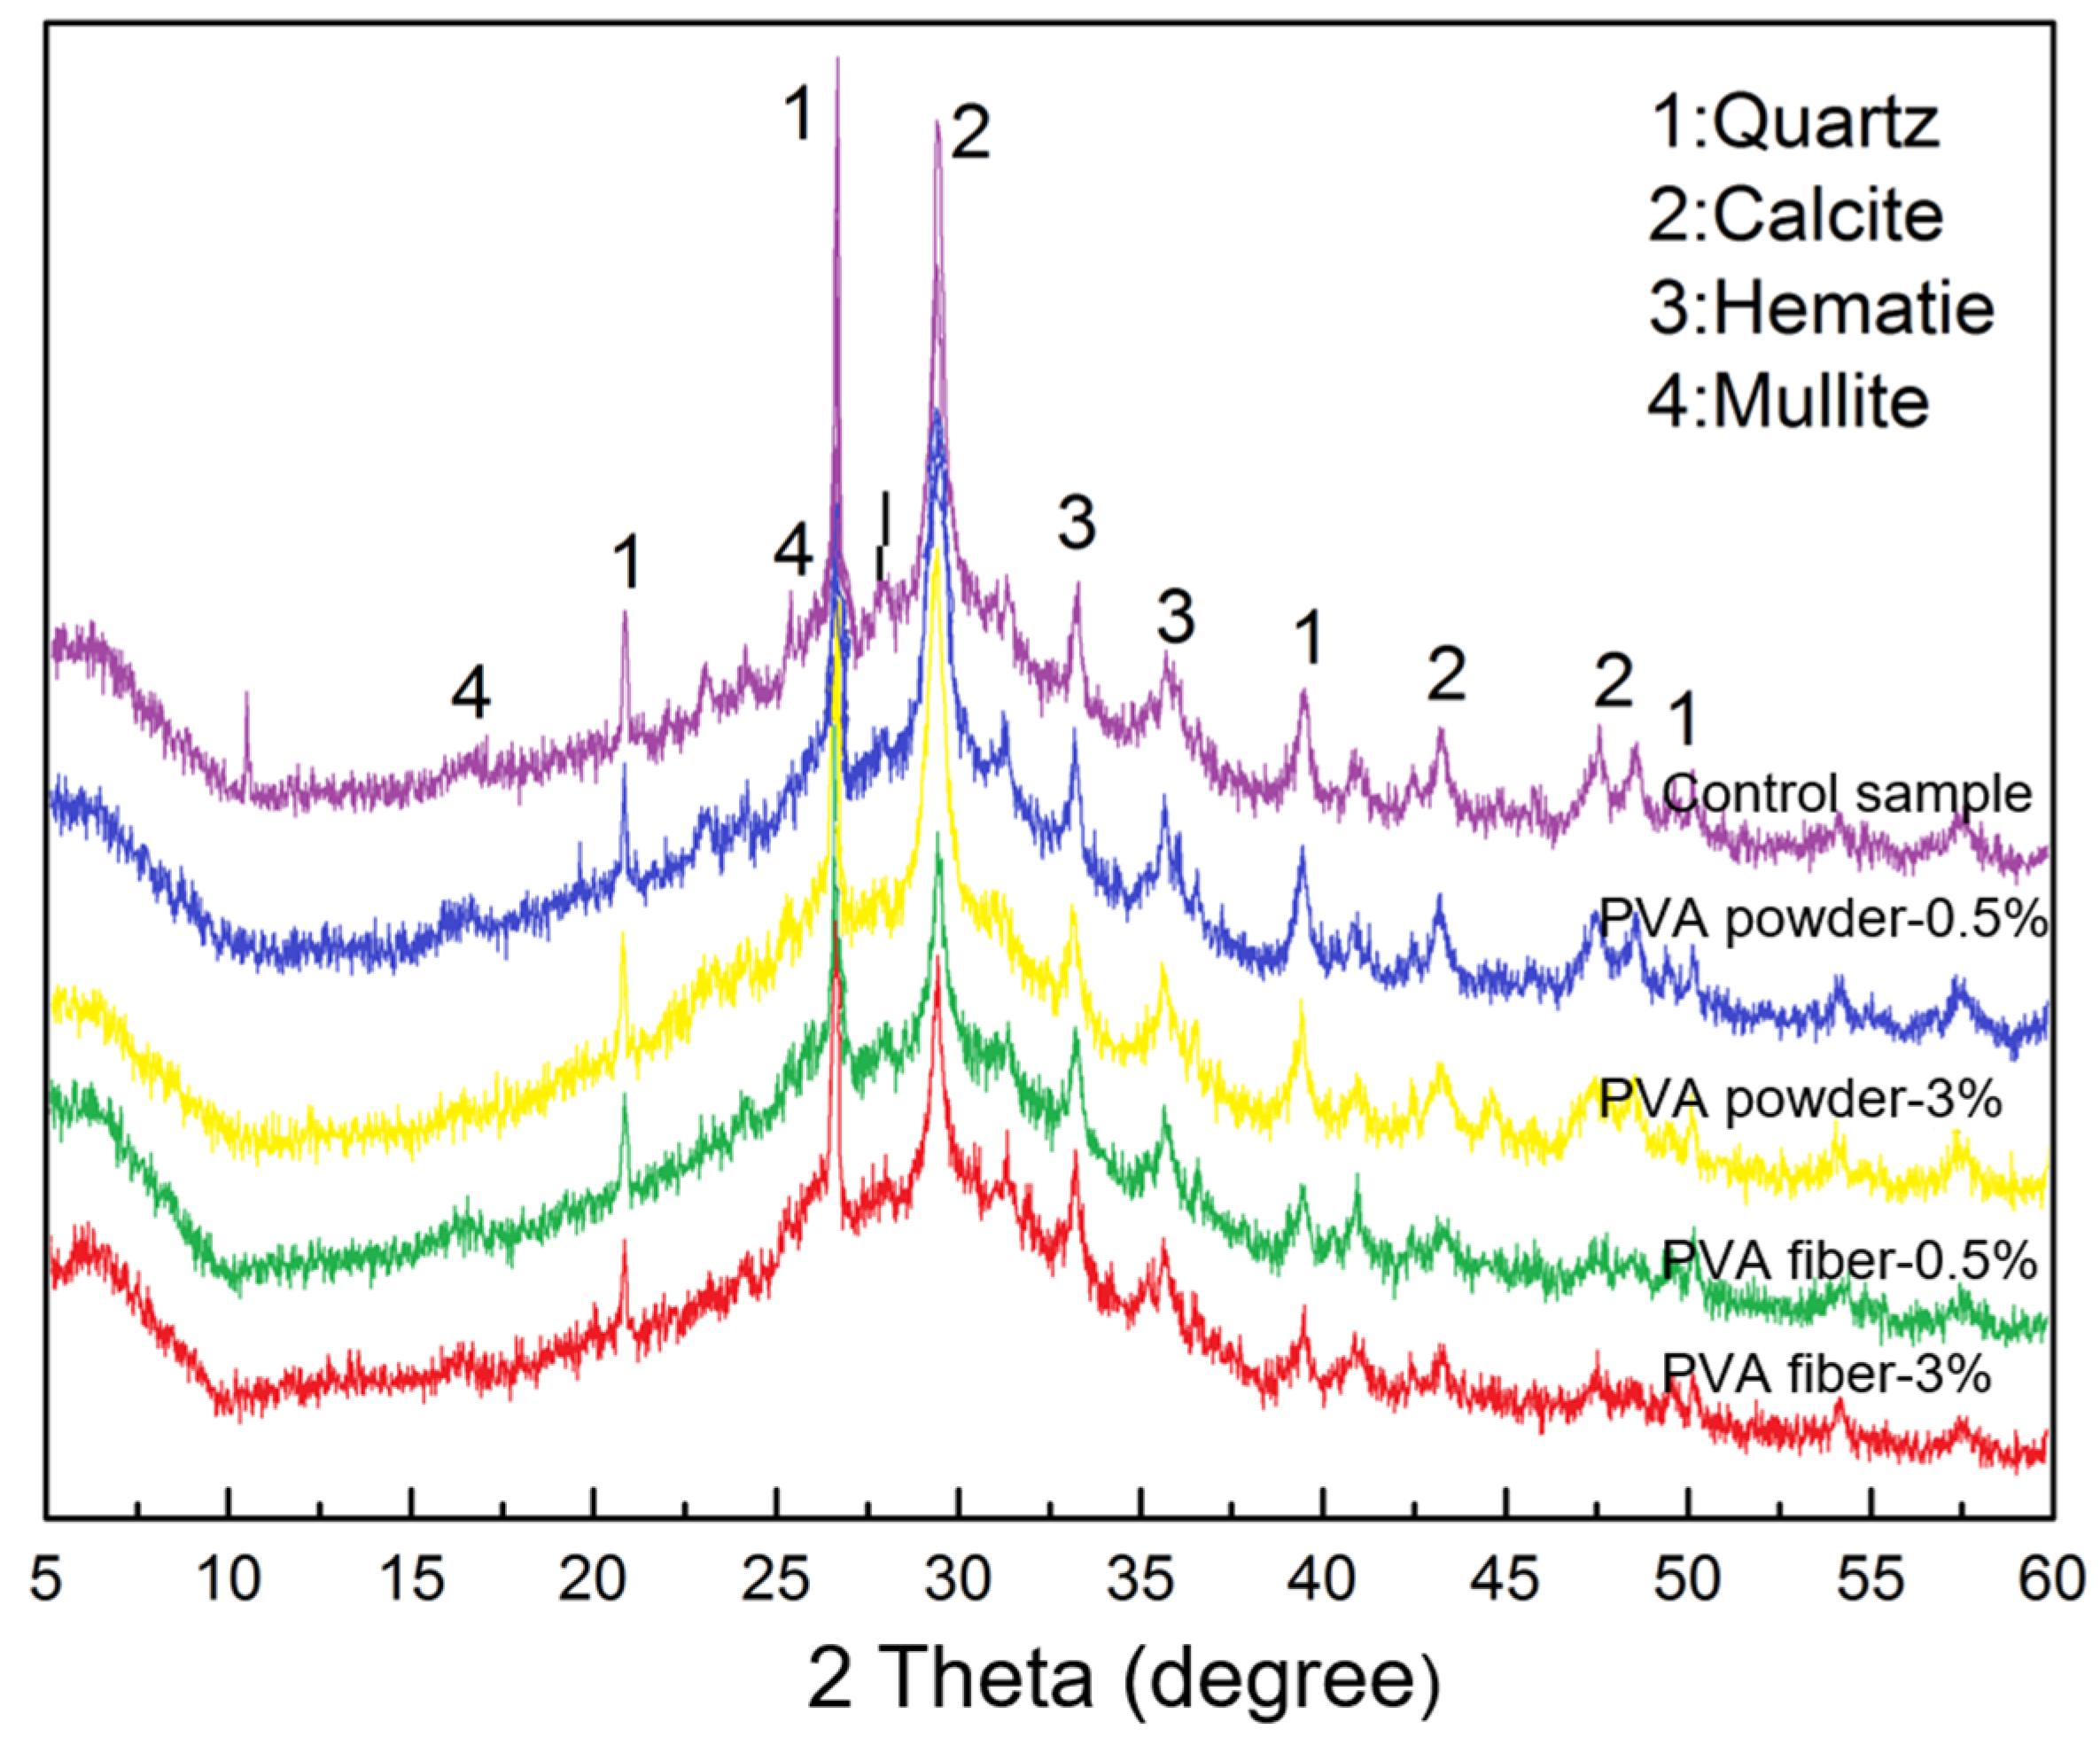
3.3. XRD Analysis
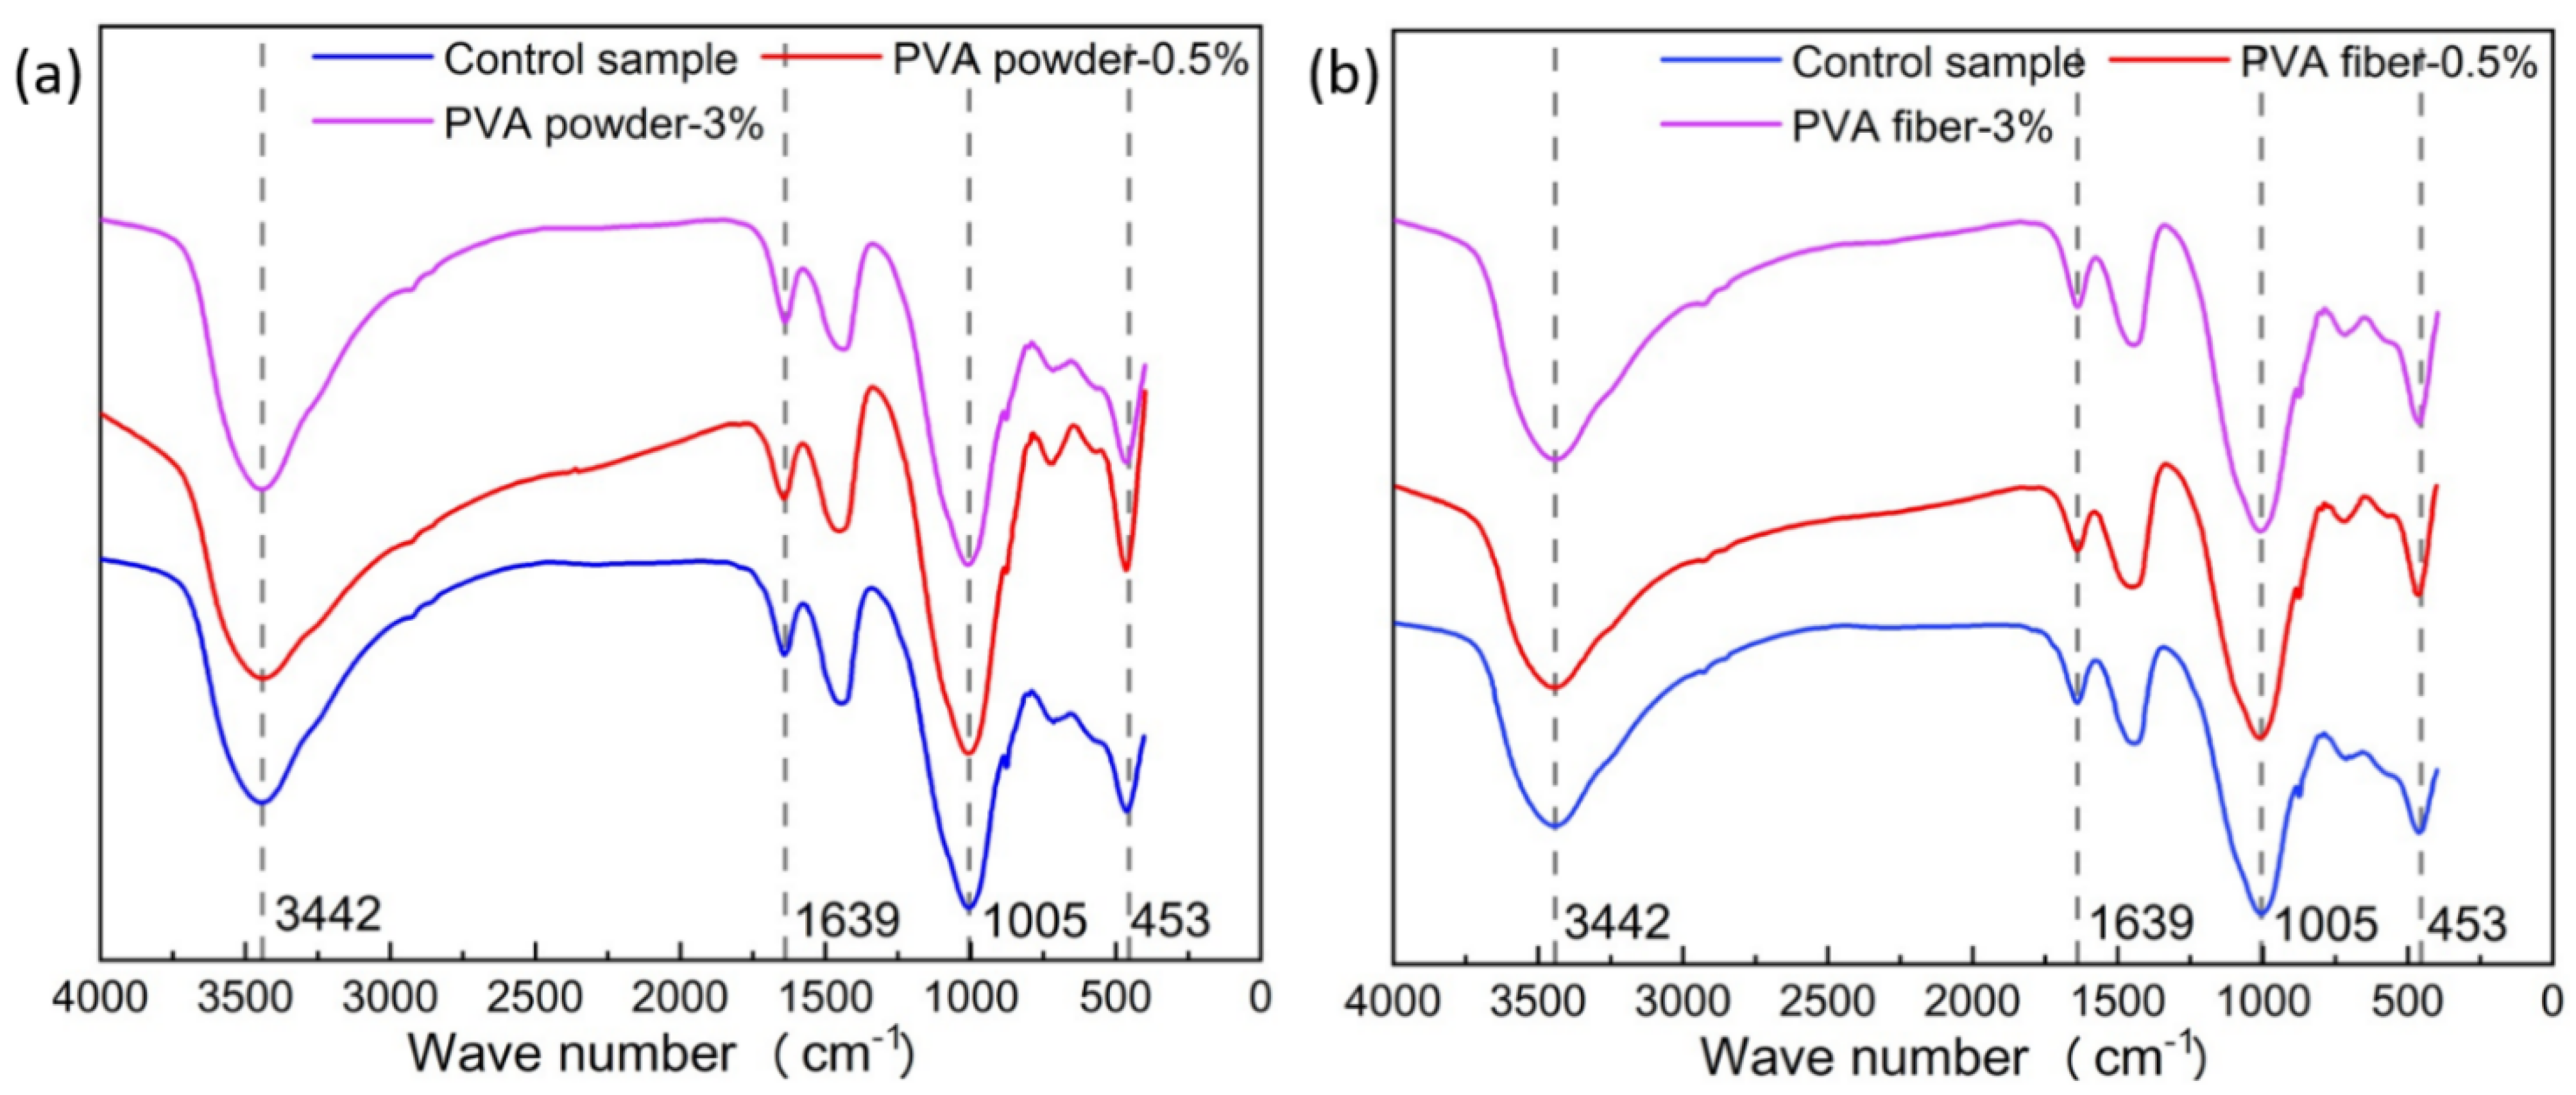
3.4. IR Analysis
3.5. TGA Analysis
3.6. SEM Analysis
4. Conclusions
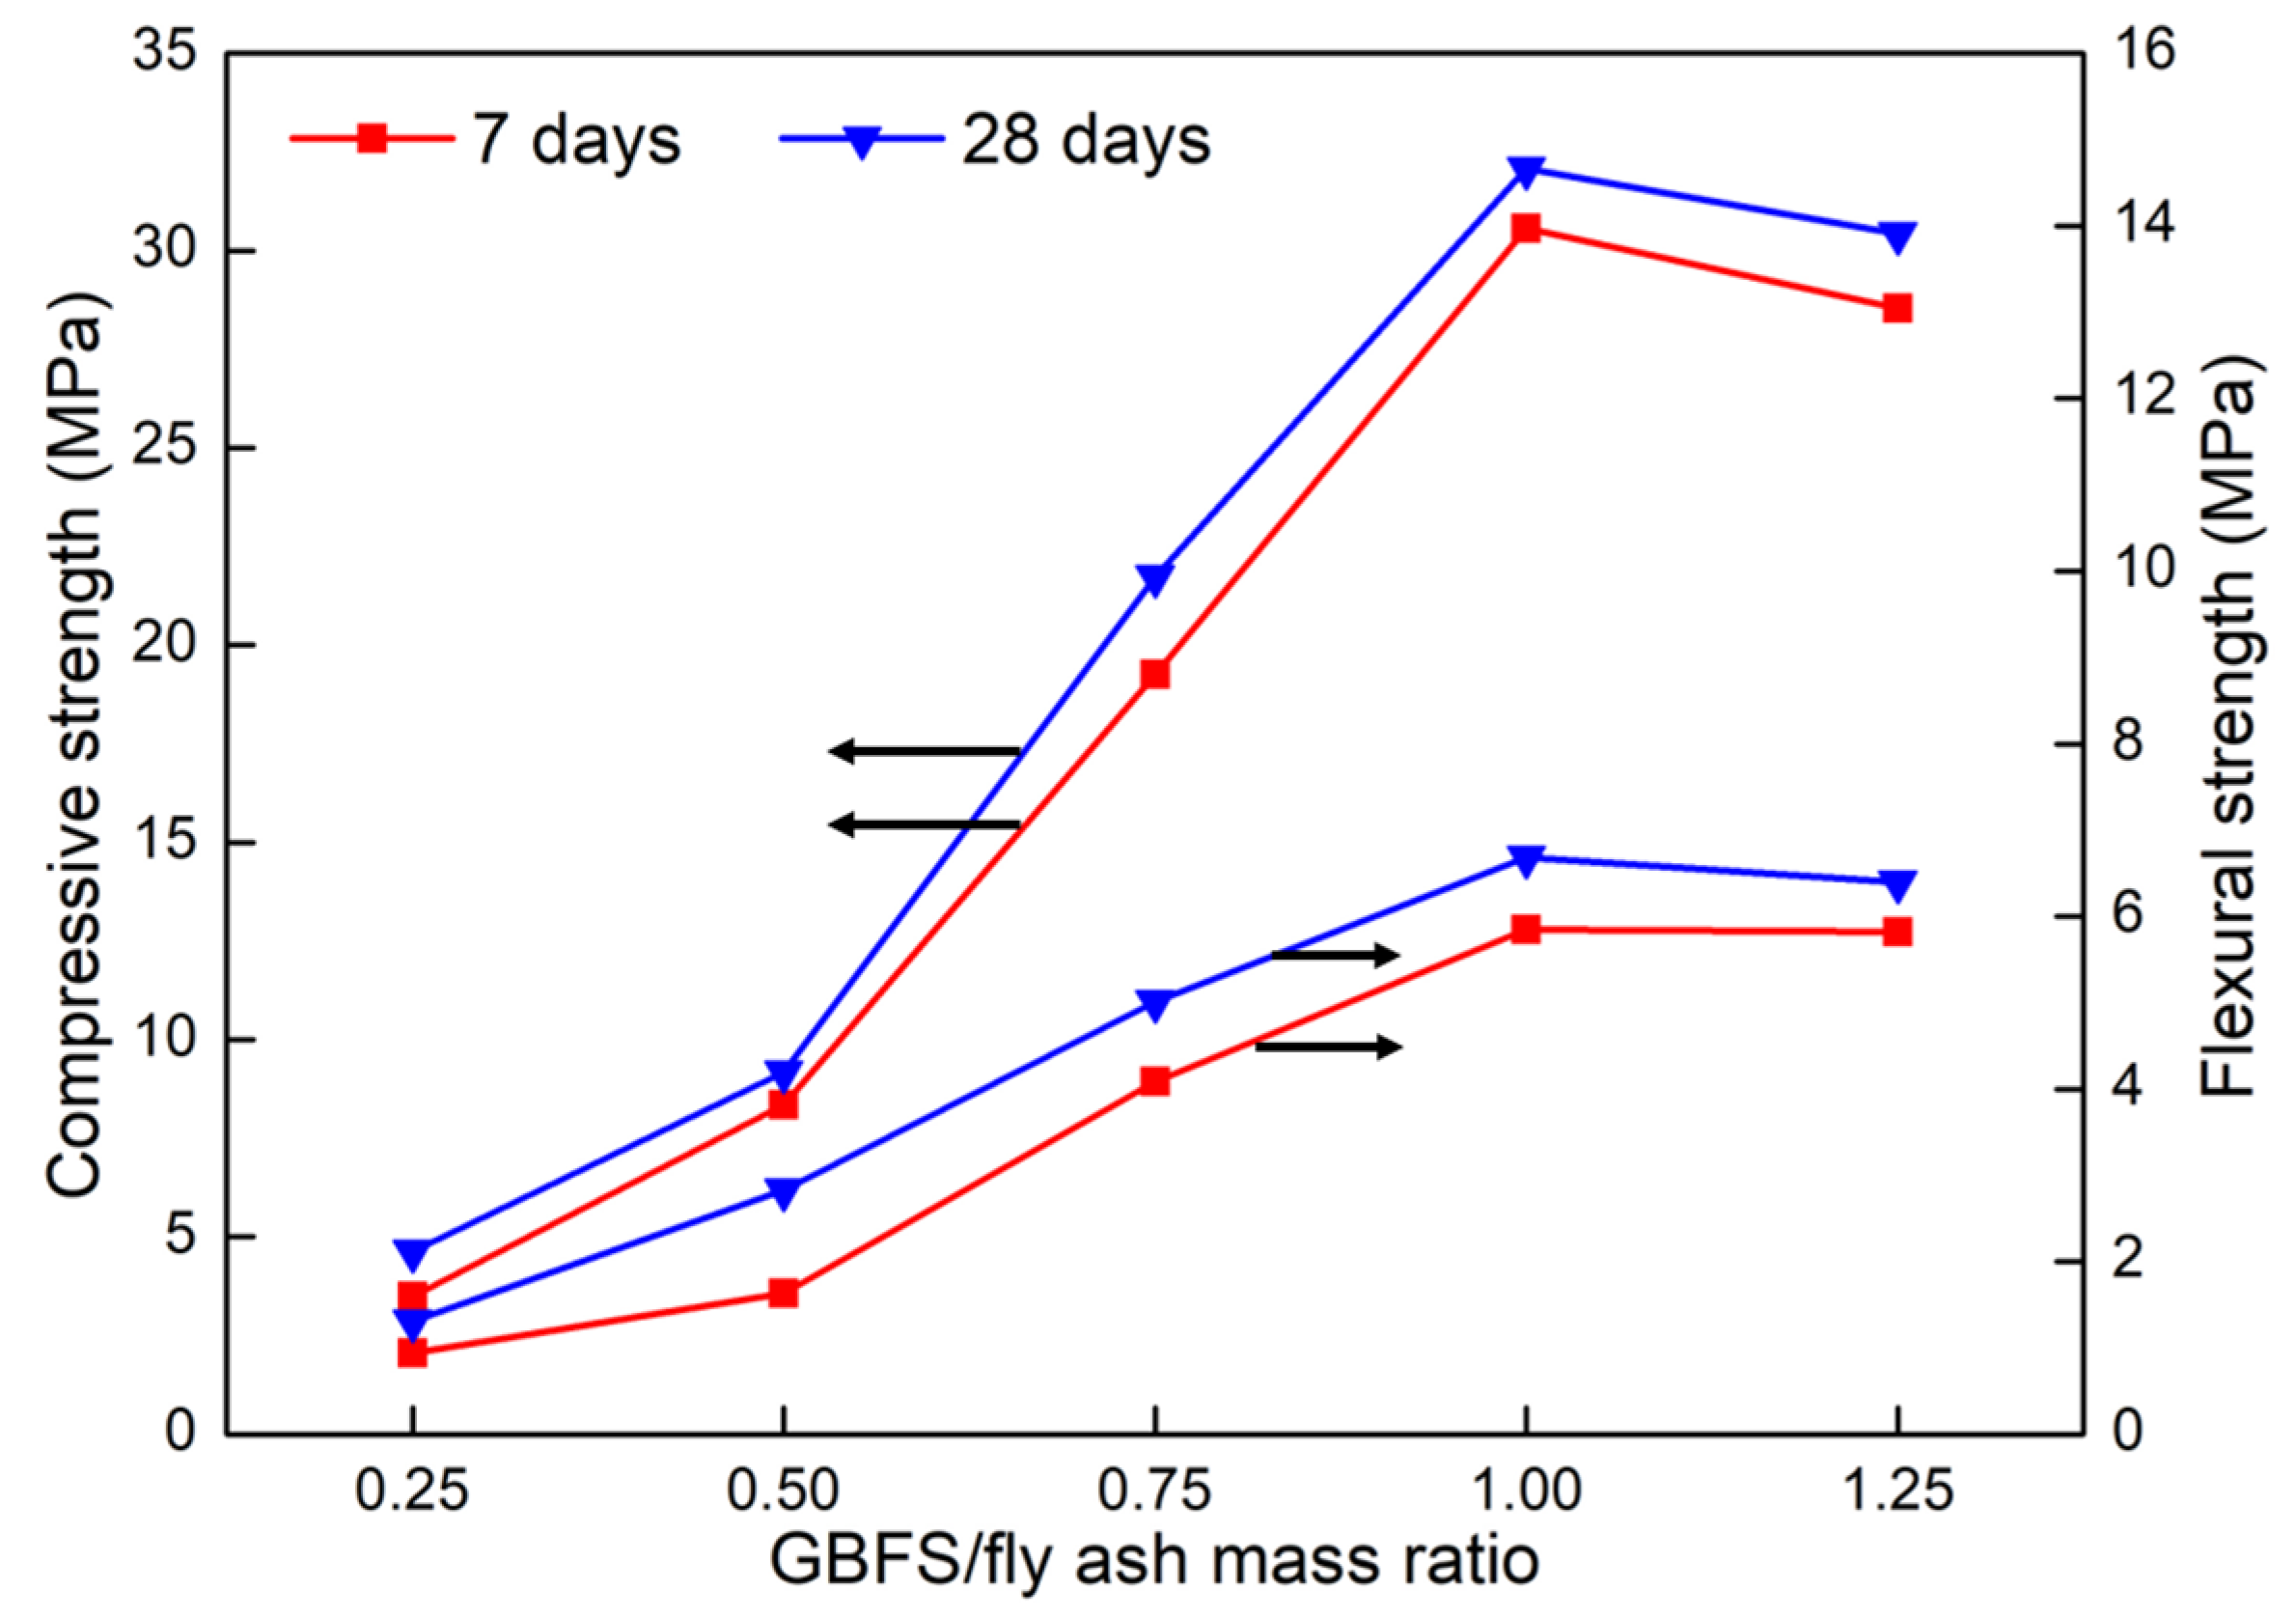
- The addition of GBFS can effectively improve the mechanical strength of fly ash geopolymer, and the mechanical strength was best when the ratio of GBFS to fly ash was 1:1 after curing for 28 days.
- PVA did not change the composition of geopolymer, nor did it react with the reaction process. The addition of PVA powders did not significantly improve the mechanical strength of the geopolymer. However, the addition of PVA fibers could effectively improve the mechanical strength. The optimal fiber content was 3 wt.%, resulting in compressive strength and flexural strength values of 41.11 MPa and 8.49 MPa, respectively, after curing for 28 days.
- The main reason that PVA powder did not significantly improve the mechanical properties of the matrix was that the powder formed films after being dissolved in water, which hindered the alkali-induced reaction. The addition of PVA fiber would not damage the continuity of the matrix and would form a bridge inside the matrix to compensate for internal defects. When the geopolymer was externally damaged, it consumed a large amount of energy through fiber pulling, breaking, etc., and it had an inhibitory effect on crack propagation.
Author Contributions
Funding
Acknowledgments
Conflicts of Interest
References
- Al Bakri, M.M.; Mohammed, H.; Kamarudin, H.; Niza, I.K.; Zarina, Y. Review on fly ash-based geopolymer concrete without Portland Cement. J. Eng. Technol. Res. 2011, 3, 1–4. [Google Scholar]
- Duxson, P.; Fernández-Jiménez, A.; Provis, J.L.; Lukey, G.C.; Palomo, A.; van Deventer, J.S.J. Geopolymer technology: The current state of the art. J. Mater. Sci. 2006, 42, 2917–2933. [Google Scholar] [CrossRef]
- Petermann, J.C.; Saeed, A.; Hammons, M.I. Alkali-Activated Geopolymers: A Literature Review, 1st ed.; Wright Patterson Air Force Base: Dayton, OH, USA, 2012; pp. 1–99. [Google Scholar]
- Duxson, P.; Provis, J.L.; Lukey, G.C.; Van Deventer, J.S. The role of inorganic polymer technology in the development of ’green concrete. Cem. Concr. Res. 2007, 37, 1590–1597. [Google Scholar] [CrossRef]
- Huntzinger, D.; Eatmon, T. A life-cycle assessment of Portland cement manufacturing: Comparing the traditional process with alternative technologies. J. Clean. Prod. 2009, 17, 668–675. [Google Scholar] [CrossRef]
- Reiterman, P.; Holcapek, O.; Zobal, O.; Keppert, M. Freeze-Thaw Resistance of Cement Screed with Various Supplementary Cementitious Materials. Rev. Adv. Mater. Sci. 2019, 58, 66–74. [Google Scholar] [CrossRef]
- Zhang, Z.; Yao, X.; Zhu, H. Potential application of geopolymers as protection coatings for marine concrete: II. Microstructure and anticorrosion mechanism. Appl. Clay Sci. 2010, 49, 7–12. [Google Scholar] [CrossRef]
- Łach, M.; Korniejenko, K.; Mikuła, J. Thermal Insulation and Thermally Resistant Materials Made of Geopolymer Foams. Procedia Eng. 2016, 151, 410–416. [Google Scholar] [CrossRef] [Green Version]
- Shill, S.K.; Al-deen, S.; Ashraf, M.; Hutchison, W. Resistance of fly ash based geopolymer mortar to both chemicals and high thermal cycles simultaneously. Constr. Build. Mater. 2019, 239, 117886. [Google Scholar] [CrossRef]
- Korniejenko, K.; Frączek, E.; Pytlak, E.; Adamski, M. Mechanical Properties of Geopolymer Composites Reinforced with Natural Fibers. Procedia Eng. 2016, 151, 388–393. [Google Scholar] [CrossRef]
- Sotelo-Piña, C.; Aguilera-González, E.N.; Martínez, A. Geopolymers: Past, present, and future of low carbon footprint eco-materials. In Handbook of Ecomaterials; Springer: Cham, Switzerland, 2019; pp. 2765–2785. [Google Scholar]
- Kozub, B.; Bazan, P.; Mierzwinski, D.; Korniejenko, K. Fly-Ash-Based Geopolymers Reinforced by Melamine Fibers. Materials 2021, 14, 400. [Google Scholar] [CrossRef]
- Nawaz, M.; Heitor, A.; Sivakumar, M. Geopolymers in construction—Recent developments. Constr. Build. Mater. 2020, 260, 120472. [Google Scholar] [CrossRef]
- Ranjbar, N.; Zhang, M. Fiber reinforced geopolymer composites: A review. Cem. Concr. Compos. 2019, 107, 103498. [Google Scholar] [CrossRef]
- Yan, S.; He, P.; Jia, D.; Yang, Z.; Duan, X.; Wang, S.; Zhou, Y. Effect of fiber content on the microstructure and mechanical properties of carbon fiber felt reinforced geopolymer composites. Ceram. Int. 2016, 42, 7837–7843. [Google Scholar] [CrossRef]
- Zhang, H.-y.; Kodur, V.; Cao, L.; Qi, S.-l. Fiber Reinforced Geopolymers for Fire Resistance Applications. Procedia Eng. 2014, 71, 153–158. [Google Scholar] [CrossRef] [Green Version]
- Shaikh, F. Deflection hardening behaviour of short fibre reinforced fly ash based geopolymer composites. Mater. Des. 2013, 50, 674–682. [Google Scholar] [CrossRef] [Green Version]
- Korniejenko, K.; Lin, W.-T.; Šimonová, H. Mechanical Properties of Short Polymer Fiber-Reinforced Geopolymer Composites. J. Compos. Sci. 2020, 4, 128. [Google Scholar] [CrossRef]
- Shaikh, F. Mechanical properties of recycled polyethylene terephthalate (PET) fiber-reinforced fly ash geopolymer and fly ash-slag-blended geopolymer composites. In Composite Materials; Elsevier: Amsterdam, The Netherlands, 2021; pp. 265–284. [Google Scholar] [CrossRef]
- Zhang, Y.; Wei, S.; Li, Z. Impact Behavior and Microstructural Characteristics of PVA Fiber Reinforced Fly Ash-Geopolymer Boards Prepared by Extrusion Technique. J. Mater. Sci. 2006, 41, 2787–2794. [Google Scholar]
- Reed, M.; Lokuge, W.; Karunasena, W. Fibre-reinforced geopolymer concrete with ambient curing for in situ applications. J. Mater. Sci. 2014, 49, 4297–4304. [Google Scholar] [CrossRef] [Green Version]
- Colangelo, F.; Roviello, G.; Ricciotti, L.; Ferone, C.; Cioffi, R. Preparation and Characterization of New Geopolymer-Epoxy Resin Hybrid Mortars. Materials 2013, 6, 2989–3006. [Google Scholar] [CrossRef] [Green Version]
- Kamalloo, A.; Emami, S.; Nuranian, H. Enhancing Mechanical Strength of Inorganic Geopolymer Using Phenol Resin. Int. J. Eng. 2012, 25, 325–328. [Google Scholar] [CrossRef]
- Zhang, S.; Gong, K.; Lu, J. Novel modification method for inorganic geopolymer by using water soluble organic polymers. Mater. Lett. 2004, 58, 1292–1296. [Google Scholar] [CrossRef]
- Temuujin, J.; van Riessen, A. Effect of fly ash preliminary calcination on the properties of geopolymer. J. Hazard. Mater. 2009, 164, 634–639. [Google Scholar] [CrossRef] [PubMed]
- Puligilla, S.; Mondal, P. Role of slag in microstructural development and hardening of fly ash-slag geopolymer. Cem. Concr. Res. 2013, 43, 70–80. [Google Scholar] [CrossRef]
- Singh, B.; Rahman, M.R.; Paswan, R.; Bhattacharyya, S.K. Effect of activator concentration on the strength, ITZ and drying shrinkage of fly ash/slag geopolymer concrete. Constr. Build. Mater. 2016, 118, 171–179. [Google Scholar] [CrossRef]
- Nath, P.; Sarker, P.K. Flexural strength and elastic modulus of ambient-cured blended low-calcium fly ash geopolymer concrete. Constr. Build. Mater. 2017, 130, 22–31. [Google Scholar] [CrossRef] [Green Version]
- Nazari, A.; Maghsoudpour, A.; Sanjayan, J.G. Flexural strength of plain and fibre-reinforced boroaluminosilicate geopolymer. Constr. Build. Mater. 2015, 76, 207–213. [Google Scholar] [CrossRef]
- Shi, C.; Jiménez, A.F.; Palomo, A. New cements for the 21st century: The pursuit of an alternative to Portland cement. Cem. Concr. Res. 2011, 41, 750–763. [Google Scholar] [CrossRef]
- Hidayati, R.E.; Anindika, G.R.; Faradila, F.S.; Pamungkas, C.I.B.; Hidayati, I.; Prasetyoko, D.; Fansuri, H. Geopolymerization of Fly Ashes From 6 Indonesian Power Plants Using A Standardized Recipes. IOP Conf. Ser. Mater. Sci. Eng. 2020, 864, 012017. [Google Scholar] [CrossRef]
- Katara, S. Surface Modification of Fly Ash by Thermal Activation: A DR/FTIR Study. Int. Res. J. Pure Appl. Chem. 2014, 3, 299–307. [Google Scholar] [CrossRef]
- Liu, X.; Wu, Y.; Li, M.; Jiang, J.; Guo, L.; Wang, W.; Zhang, W.; Zhang, Z.; Duan, P. Effects of graphene oxide on microstructure and mechanical properties of graphene oxide-geopolymer composites. Constr. Build. Mater. 2020, 247, 118544. [Google Scholar] [CrossRef]
- Olvianas, M.; Widiyatmoko, A.; Petrus, H.T.B.M. IR spectral similarity studies of geothermal silica-bentonite based geopolymer. AIP Conf. Proc. 2017, 1887, 020015. [Google Scholar]
- Yaowarat, T.; Horpibulsuk, S.; Arulrajah, A.; Mirzababaei, M.; A Rashid, A.S. Compressive and Flexural Strength of Polyvinyl Alcohol–Modified Pavement Concrete Using Recycled Concrete Aggregates. J. Mater. Civ. Eng. 2018, 30, 04018046. [Google Scholar] [CrossRef]
- Al-mashhadani, M.M.; Canpolat, O.; Aygörmez, Y.; Uysal, M.; Erdem, S. Mechanical and microstructural characterization of fiber reinforced fly ash based geopolymer composites. Constr. Build. Mater. 2018, 167, 505–513. [Google Scholar] [CrossRef]


| Chemical Composition (%) | Fly Ash | GBFS |
|---|---|---|
| SiO2 | 45.43 | 33.33 |
| Al2O3 | 35.89 | 13.76 |
| Fe2O3 | 4.32 | 0.62 |
| CaO | 6.00 | 38.04 |
| SO3 | 4.11 | 2.90 |
| TiO2 | 1.63 | 0.78 |
| MgO | 0.66 | 9.23 |
| K2O | 0.55 | 0.34 |
| P2O5 | 0.51 | 0.02 |
| Na2O | 0.14 | 0.32 |
| Parameter | Diameter (μm) | Length (mm) | Tensile Strength (MPa) | Young’s Modulus (GPa) | Elongation (%) | Density (g/cm3) |
|---|---|---|---|---|---|---|
| Value | 20 | 6 | 1200 | 35 | 6–11 | 1.30 |
| Parameter | Mesh Number | PH | Viscosity (mPa·s) | Molecular Weight | Degree of Polymerization |
|---|---|---|---|---|---|
| Value | 120 | 5–7 | 20.0–26.5 | 72,600–81,400 | 1650–1850 |
| Experiment Number | SiO2/Na2O Mole Ratio | Activators/Ash Mass Ratio | GBFS/Ash Mass Ratio | PVA Powder (wt.%) | PVA Fiber (wt.%) | Water/Binder Mass Ratio |
|---|---|---|---|---|---|---|
| 1 | 1.2 | 0.46 | 0.25 | - | - | 0.4 |
| 2 | 1.2 | 0.46 | 0.5 | - | - | 0.4 |
| 3 | 1.2 | 0.46 | 0.75 | - | - | 0.4 |
| 4 | 1.2 | 0.46 | 1.0 | - | - | 0.4 |
| 5 | 1.2 | 0.46 | 1.25 | - | - | 0.4 |
| 6 | 1.2 | 0.46 | 1.0 | 0.5 | - | 0.4 |
| 7 | 1.2 | 0.46 | 1.0 | 1.5 | - | 0.4 |
| 8 | 1.2 | 0.46 | 1.0 | 3 | - | 0.4 |
| 9 | 1.2 | 0.46 | 1.0 | - | 0.5 | 0.4 |
| 10 | 1.2 | 0.46 | 1.0 | - | 1.5 | 0.4 |
| 11 | 1.2 | 0.46 | 1.0 | - | 3 | 0.4 |
Publisher’s Note: MDPI stays neutral with regard to jurisdictional claims in published maps and institutional affiliations. |
© 2022 by the authors. Licensee MDPI, Basel, Switzerland. This article is an open access article distributed under the terms and conditions of the Creative Commons Attribution (CC BY) license (https://creativecommons.org/licenses/by/4.0/).
Share and Cite
Cai, J.; Jiang, J.; Gao, X.; Ding, M. Improving the Mechanical Properties of Fly Ash-Based Geopolymer Composites with PVA Fiber and Powder. Materials 2022, 15, 2363. https://doi.org/10.3390/ma15072363
Cai J, Jiang J, Gao X, Ding M. Improving the Mechanical Properties of Fly Ash-Based Geopolymer Composites with PVA Fiber and Powder. Materials. 2022; 15(7):2363. https://doi.org/10.3390/ma15072363
Chicago/Turabian StyleCai, Jianchen, Jinyun Jiang, Xiang Gao, and Meiya Ding. 2022. "Improving the Mechanical Properties of Fly Ash-Based Geopolymer Composites with PVA Fiber and Powder" Materials 15, no. 7: 2363. https://doi.org/10.3390/ma15072363
APA StyleCai, J., Jiang, J., Gao, X., & Ding, M. (2022). Improving the Mechanical Properties of Fly Ash-Based Geopolymer Composites with PVA Fiber and Powder. Materials, 15(7), 2363. https://doi.org/10.3390/ma15072363