
MATLAB Algorithms for Diameter Measurements of Textile Yarns and Fibers through Image Processing Techniques


Abstract
:1. Introduction
2. Materials and Methods
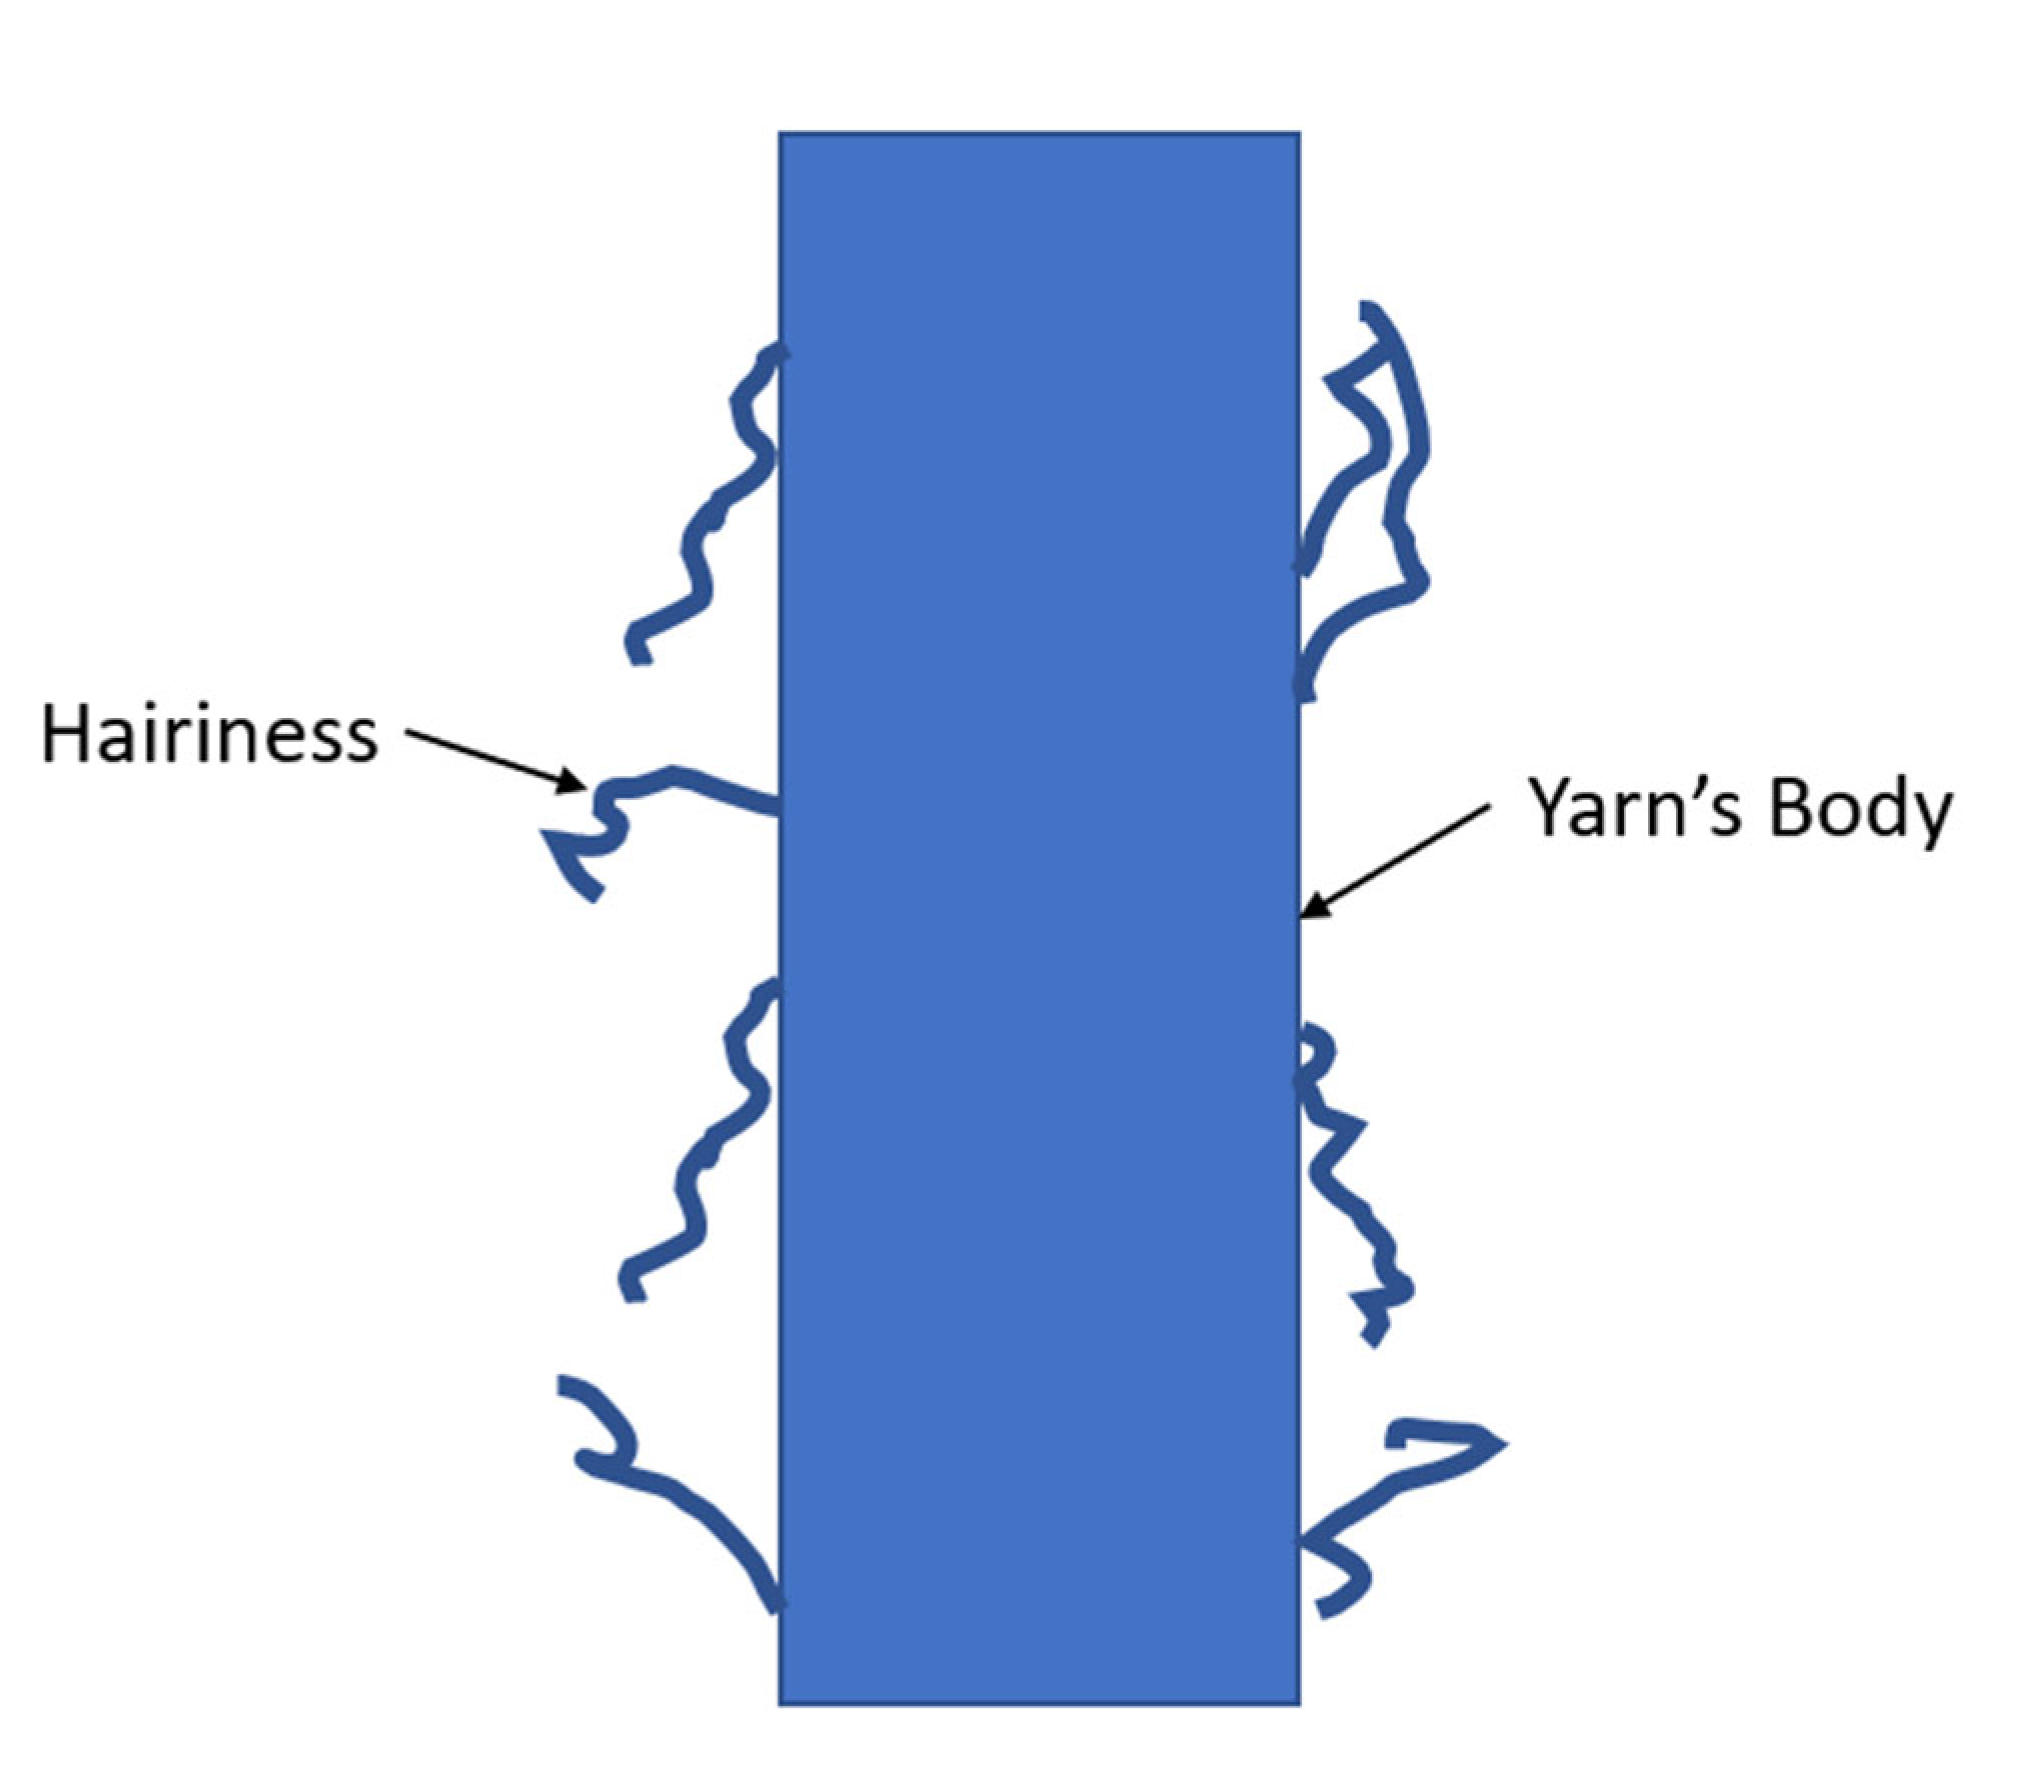
2.1. The Measurement of the Yarn’s Diameter
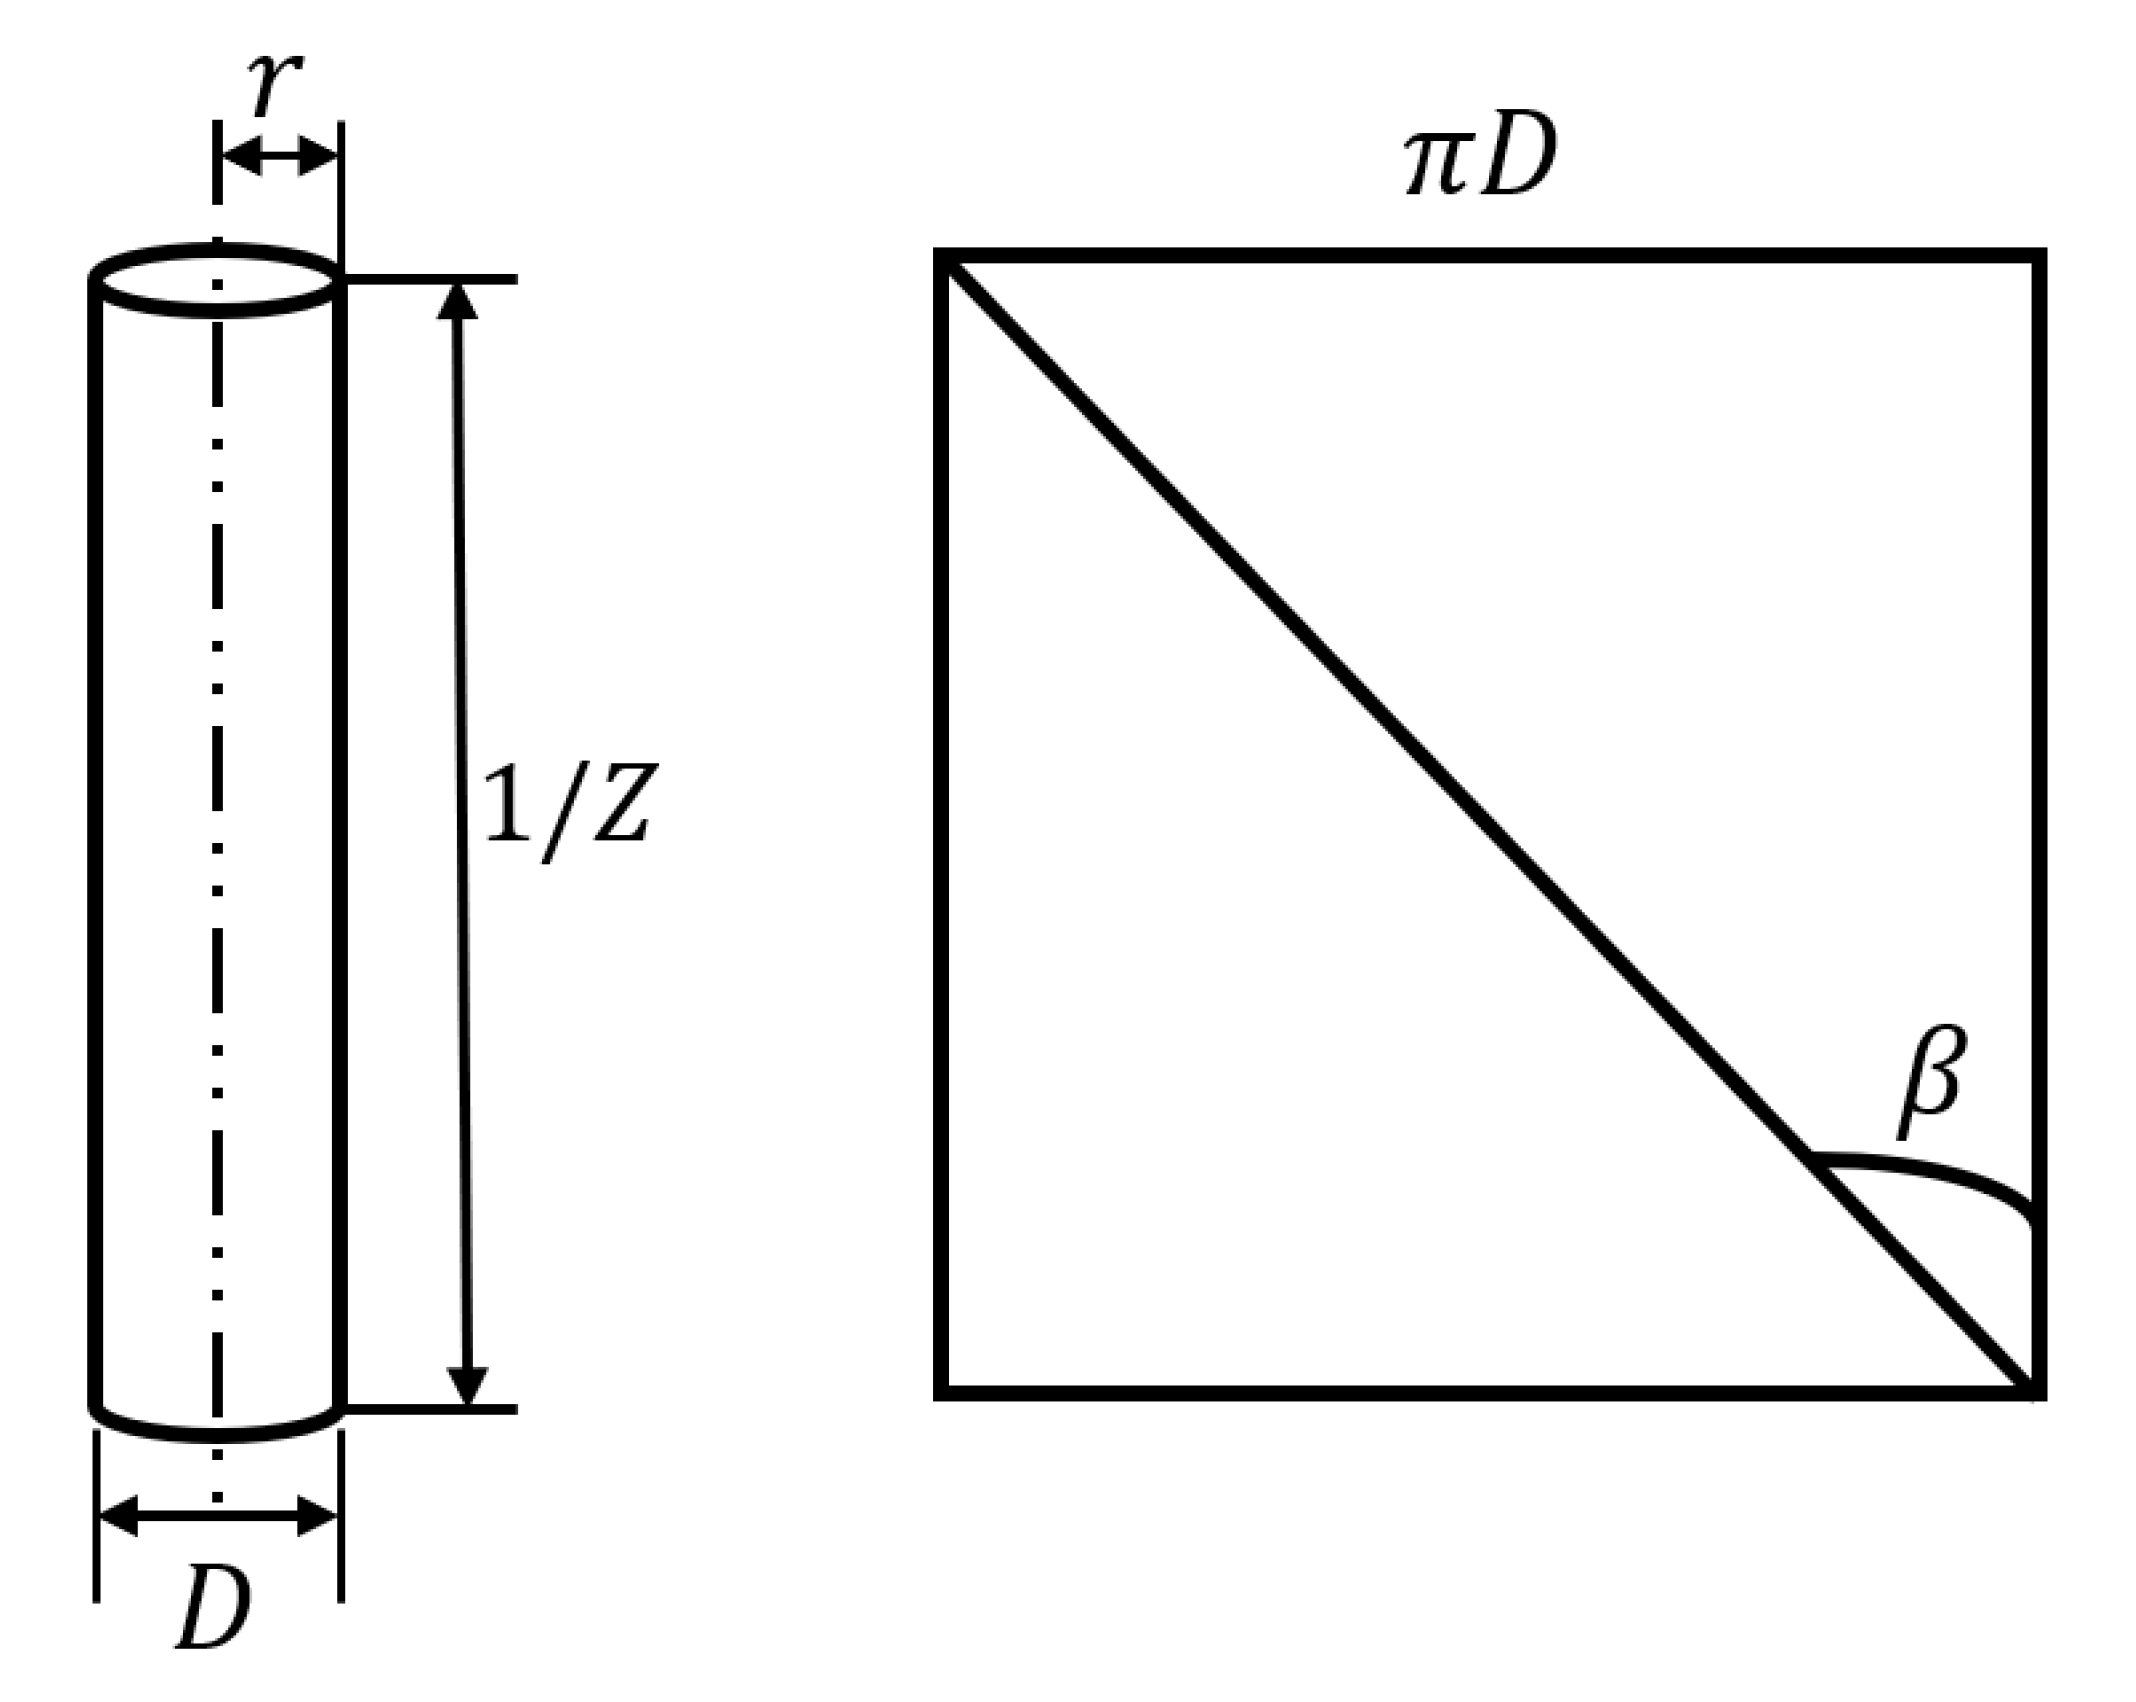
The Yarn’s Helix Model
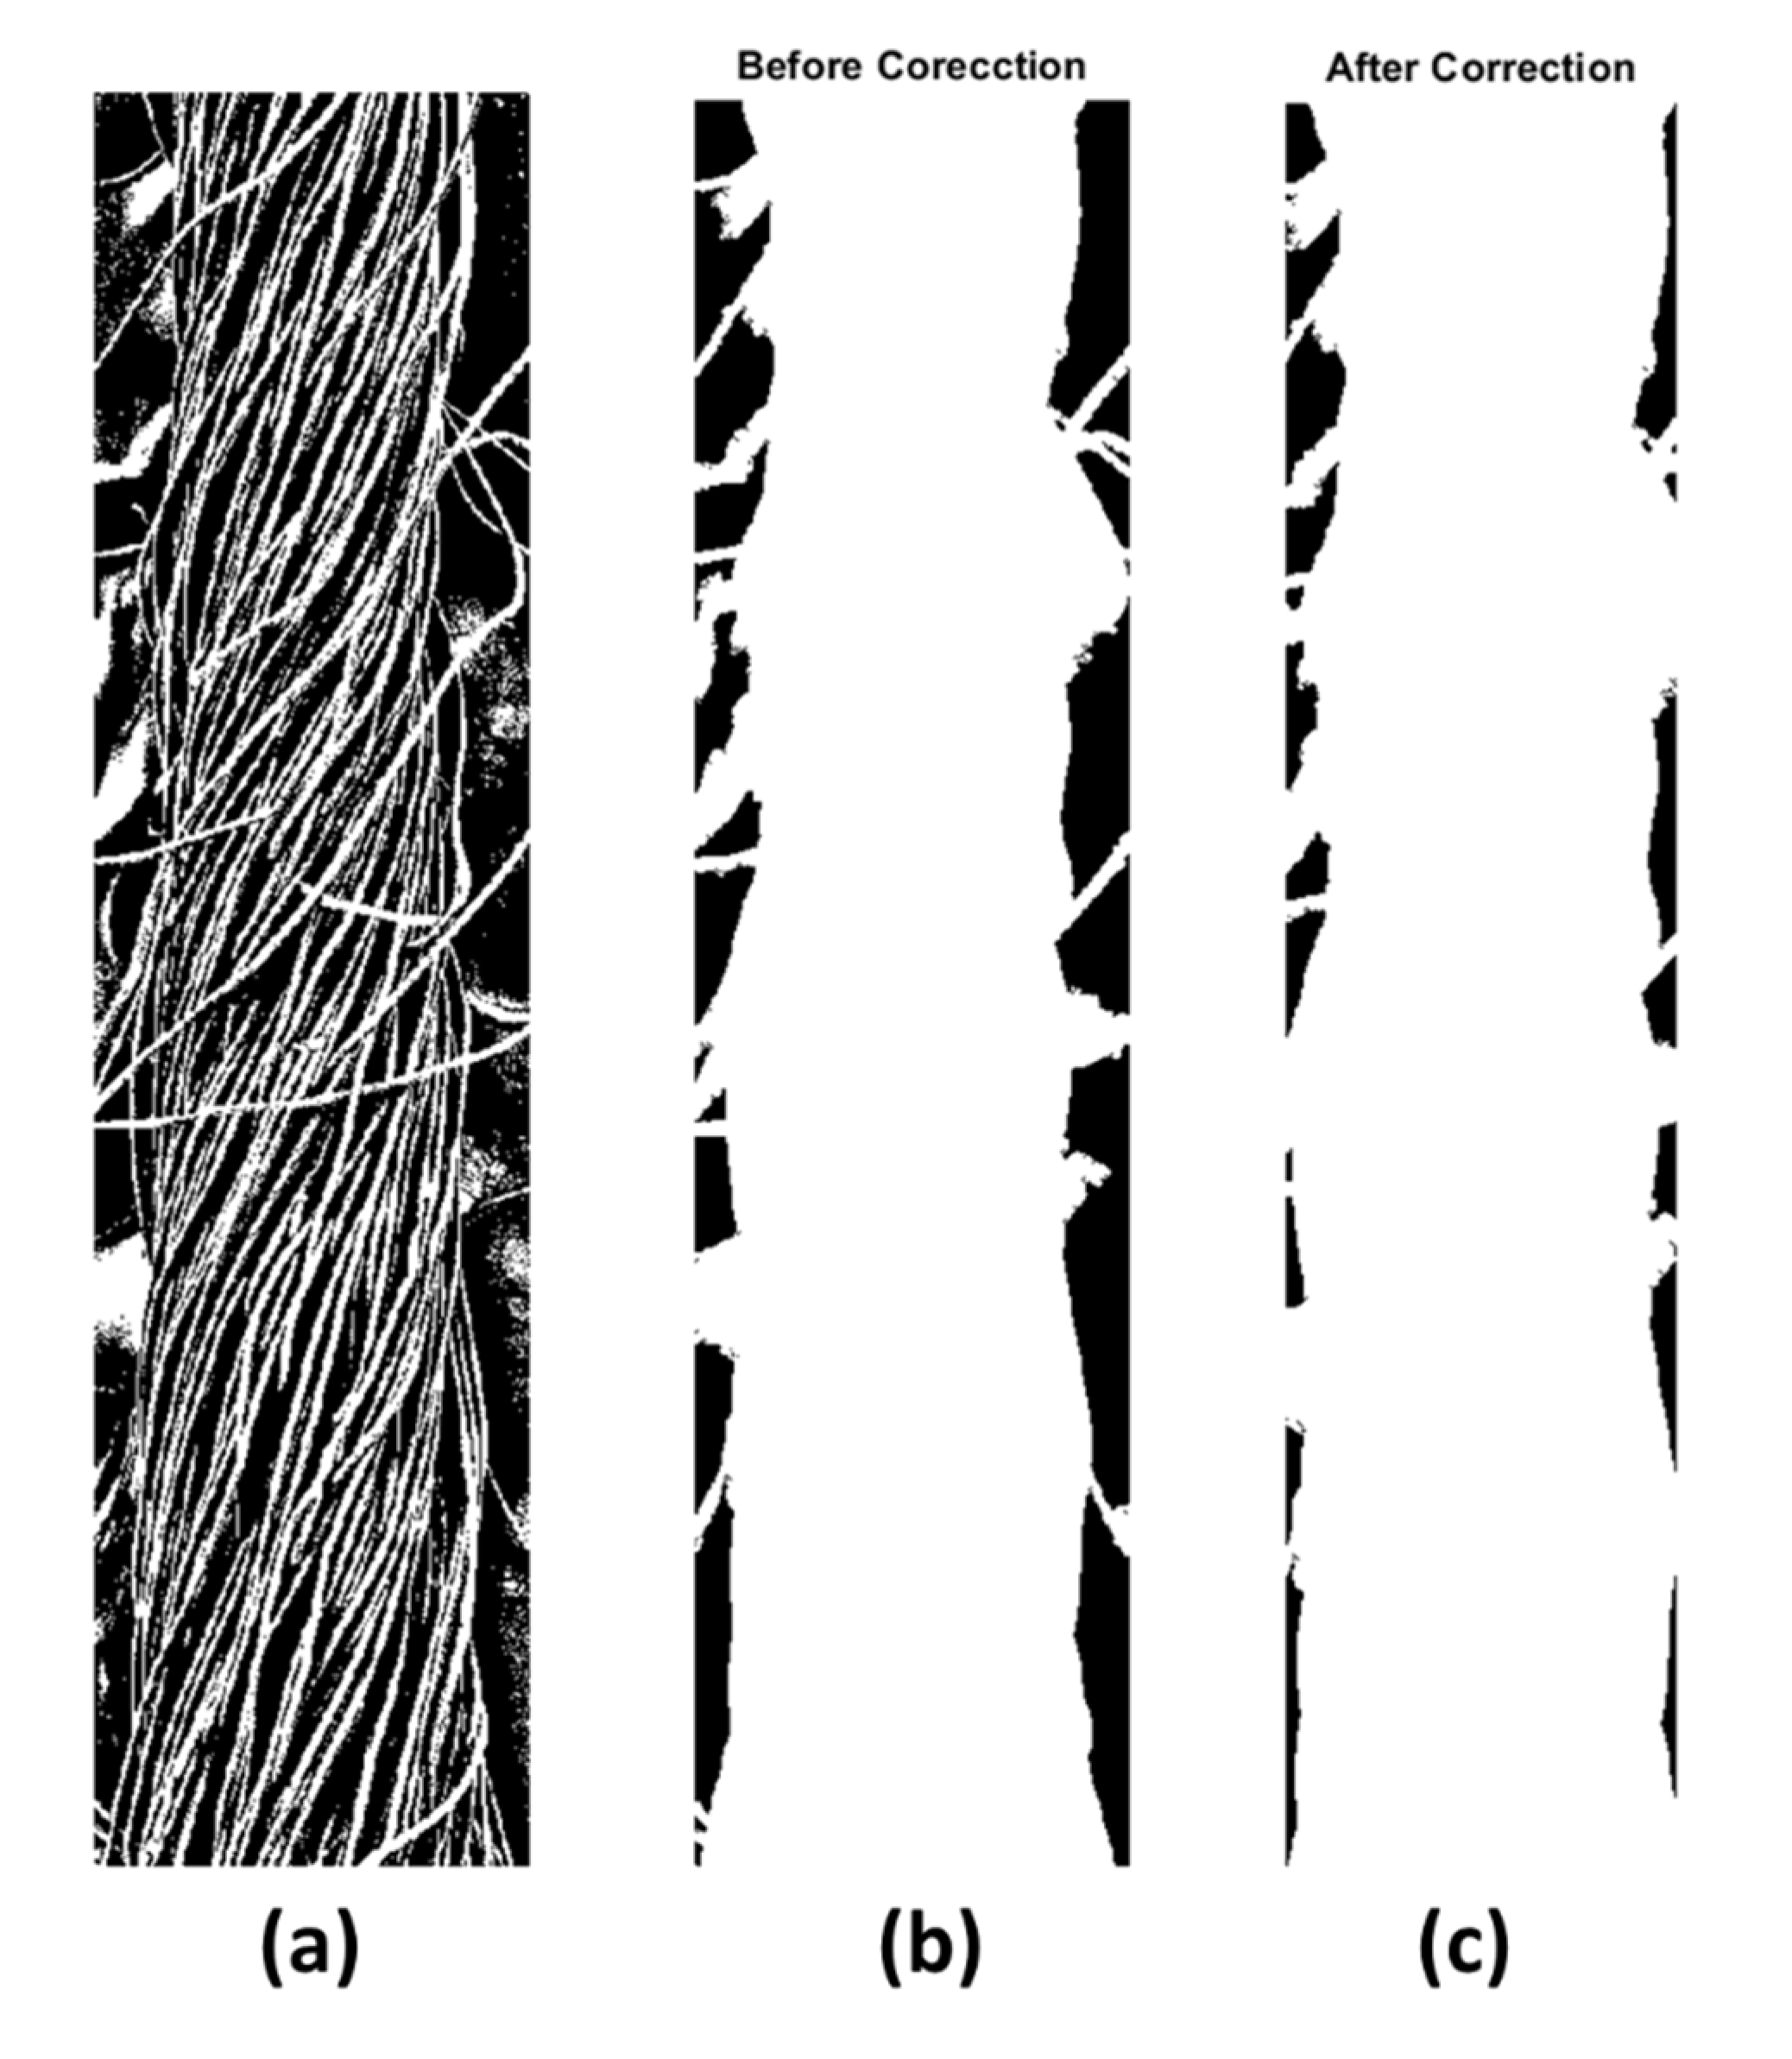
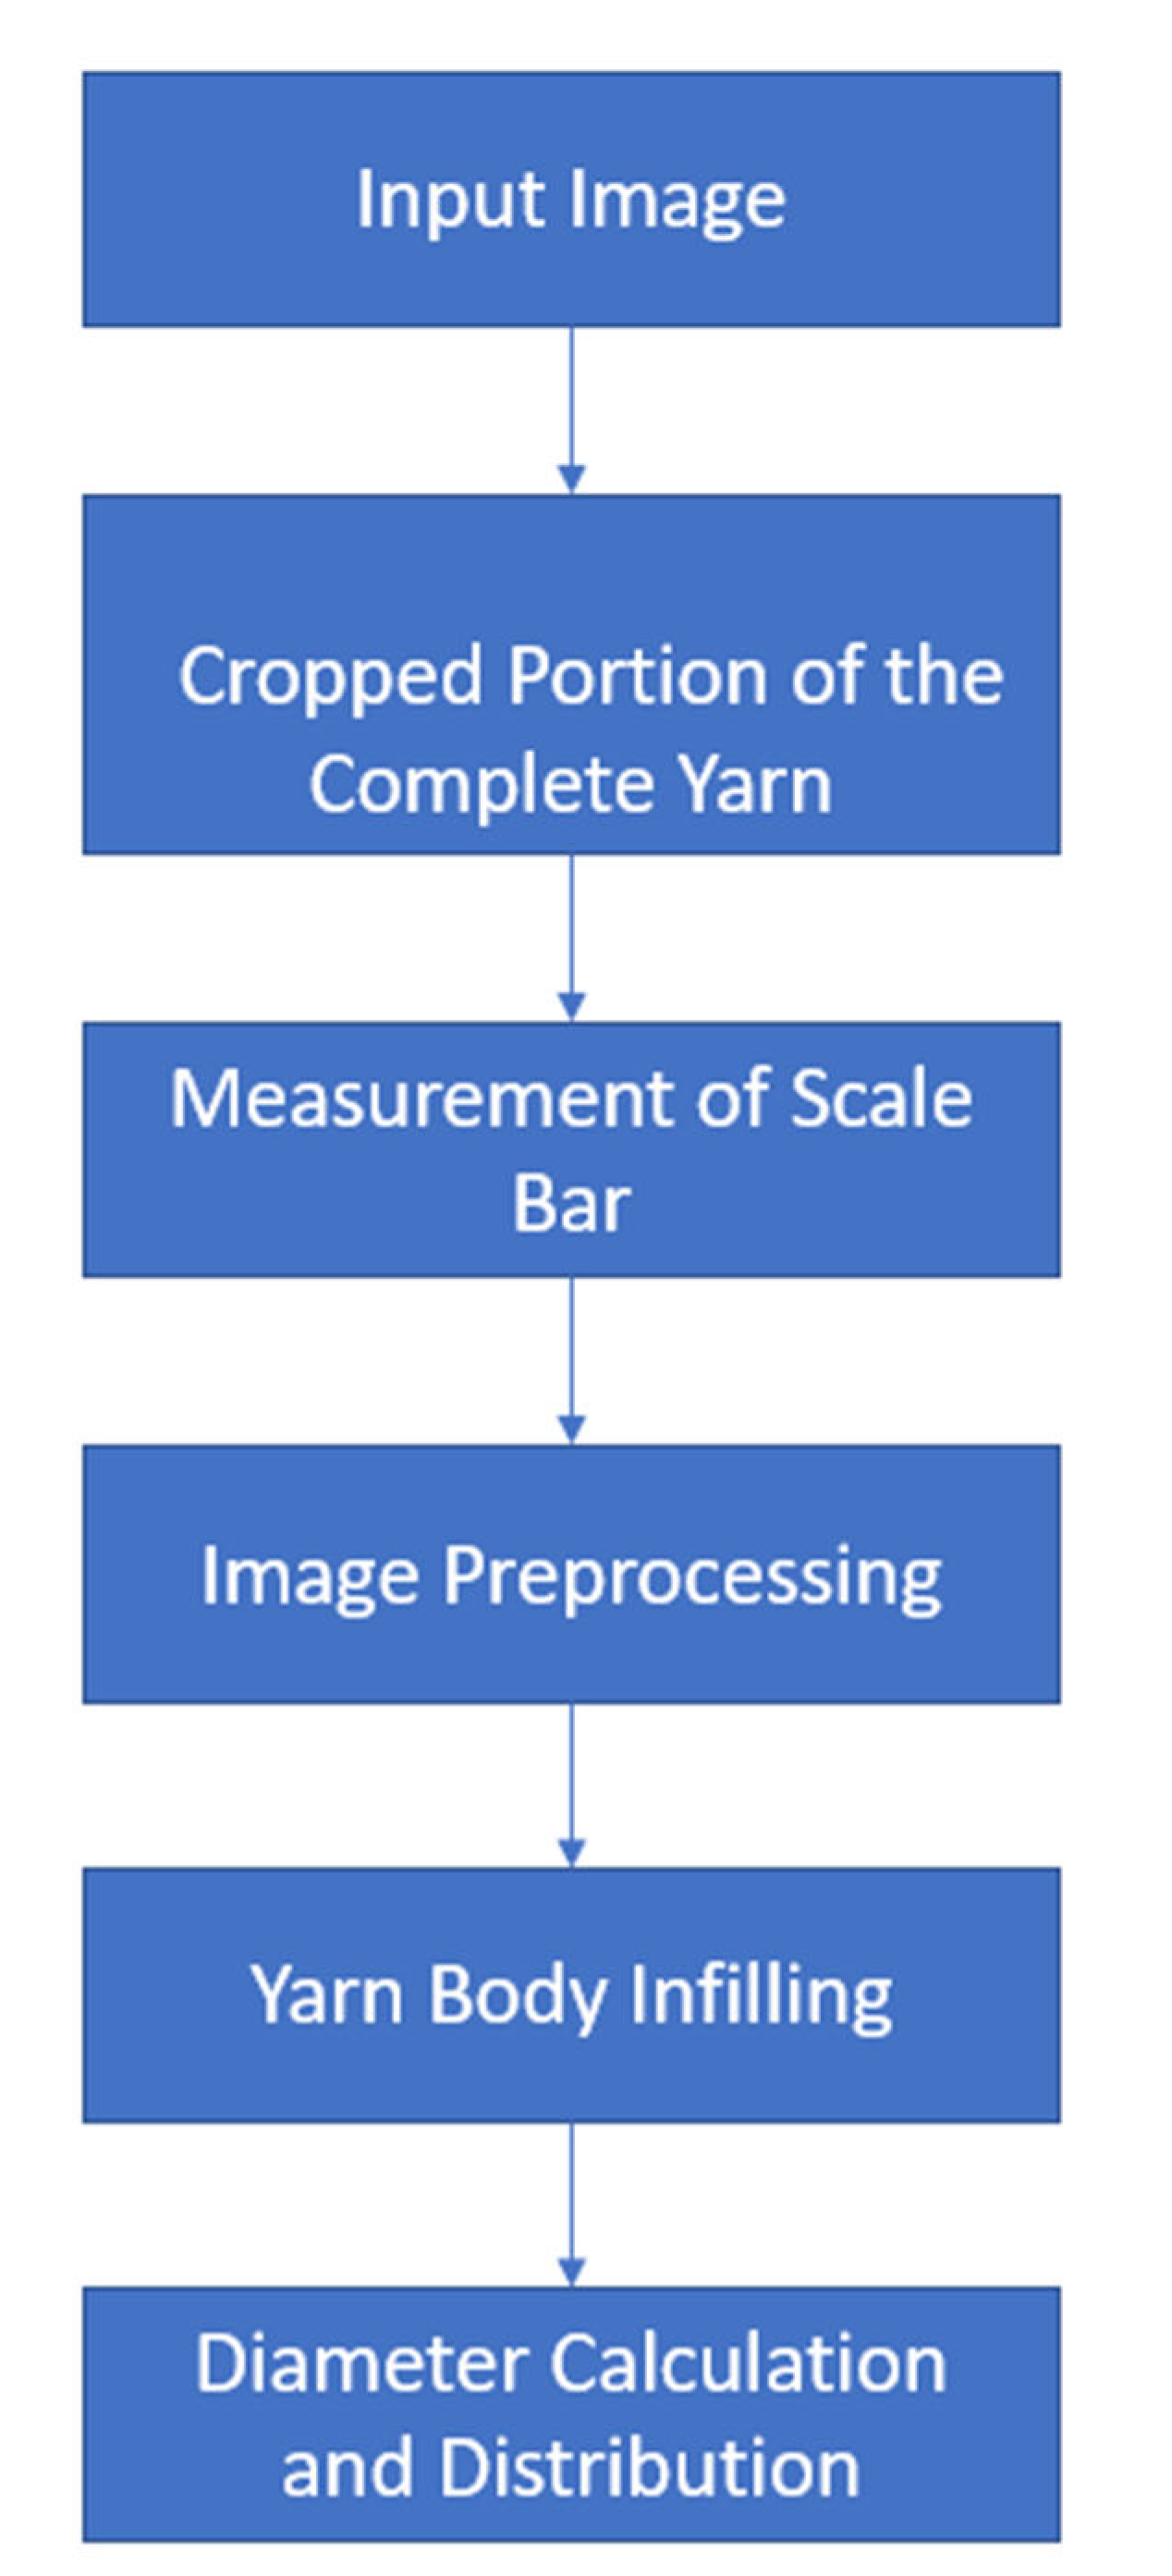
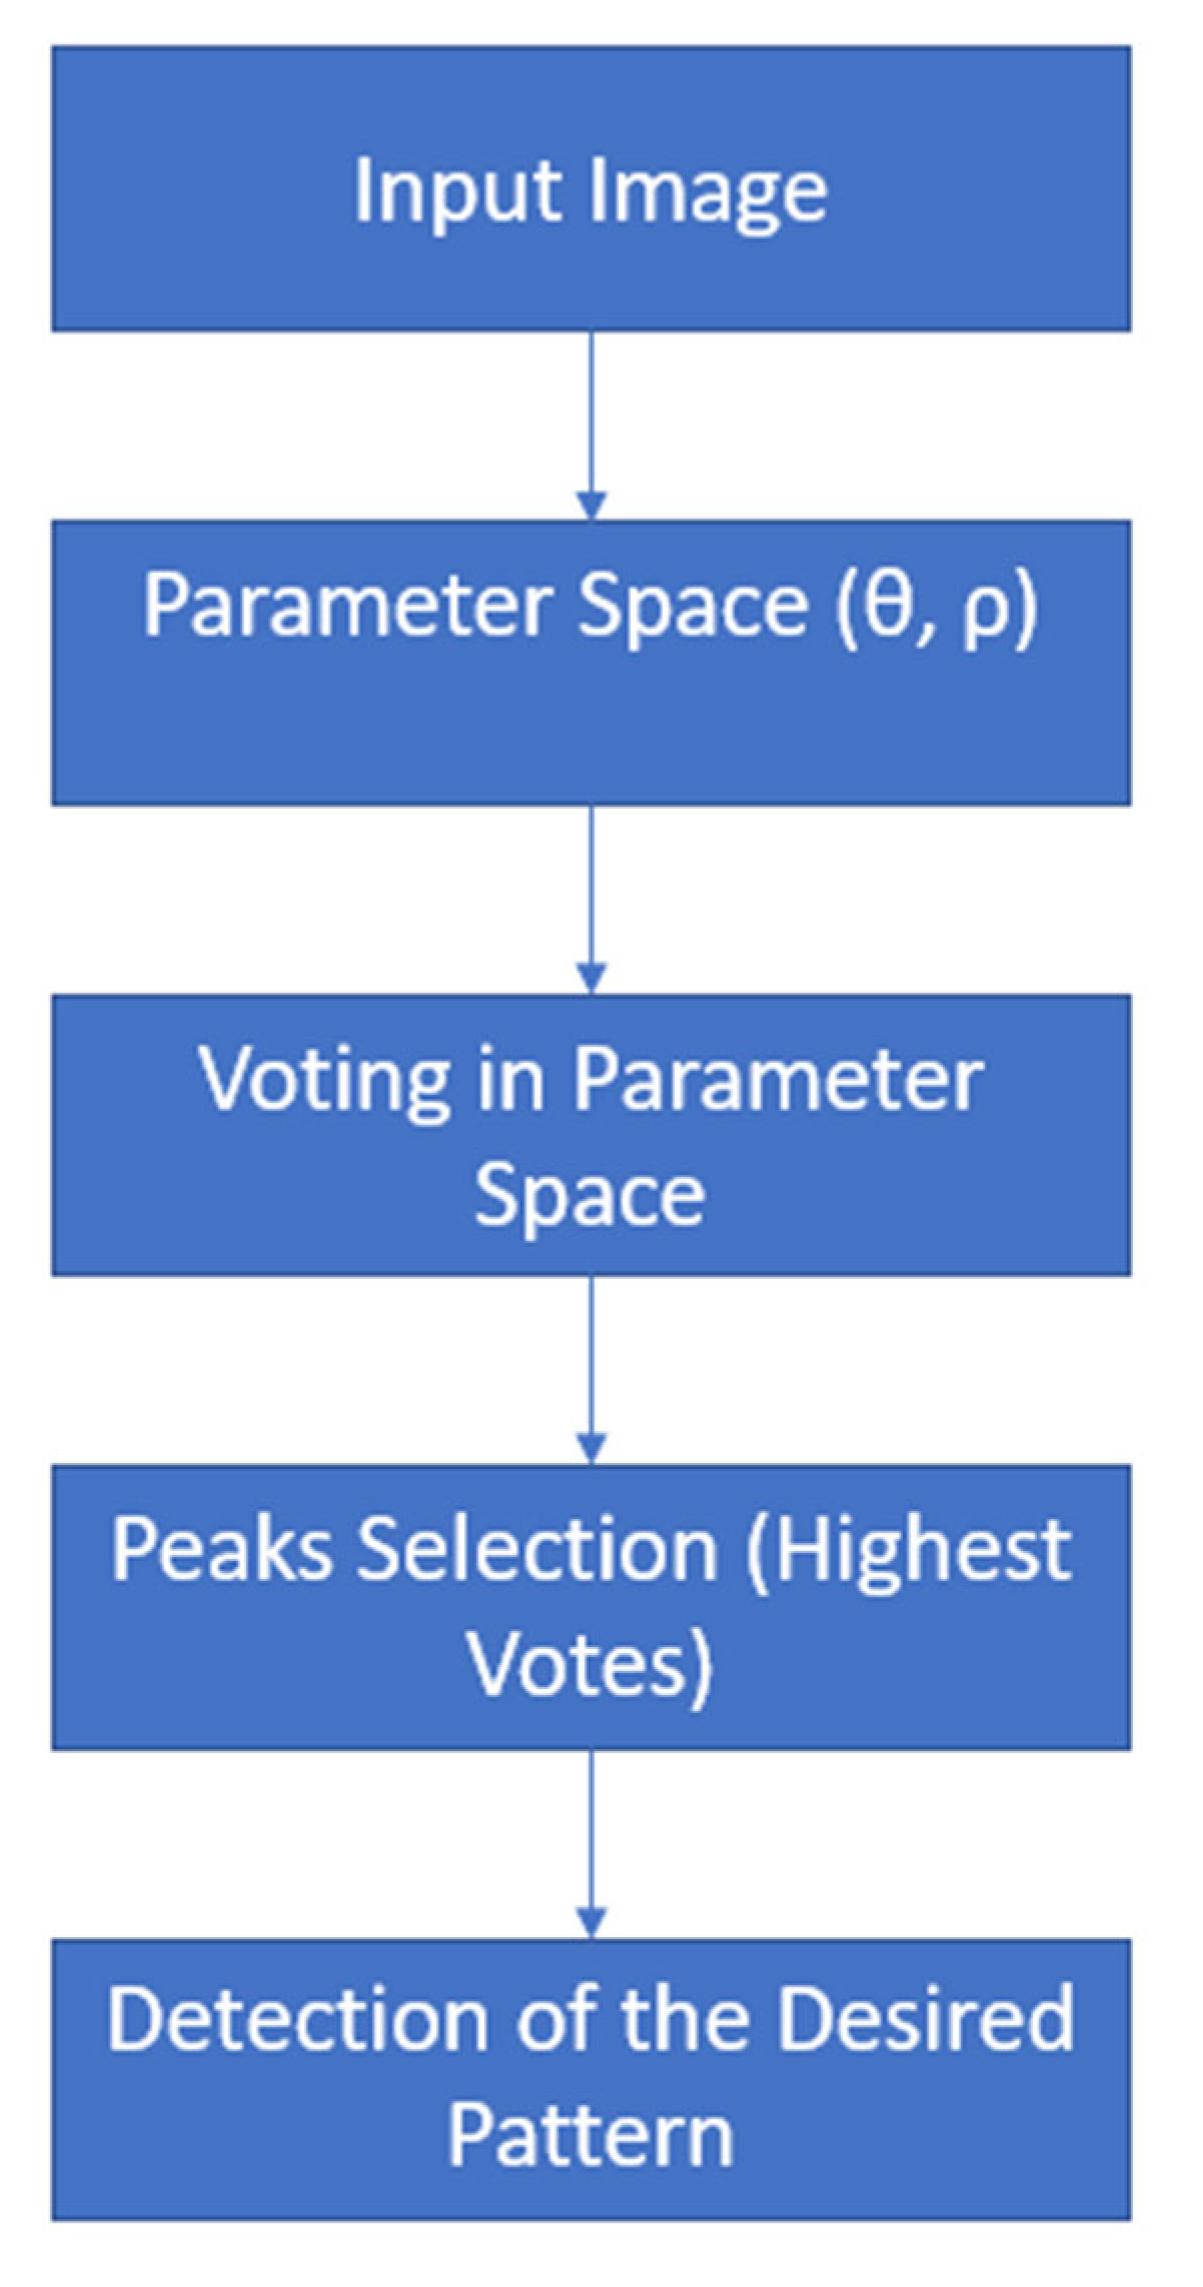
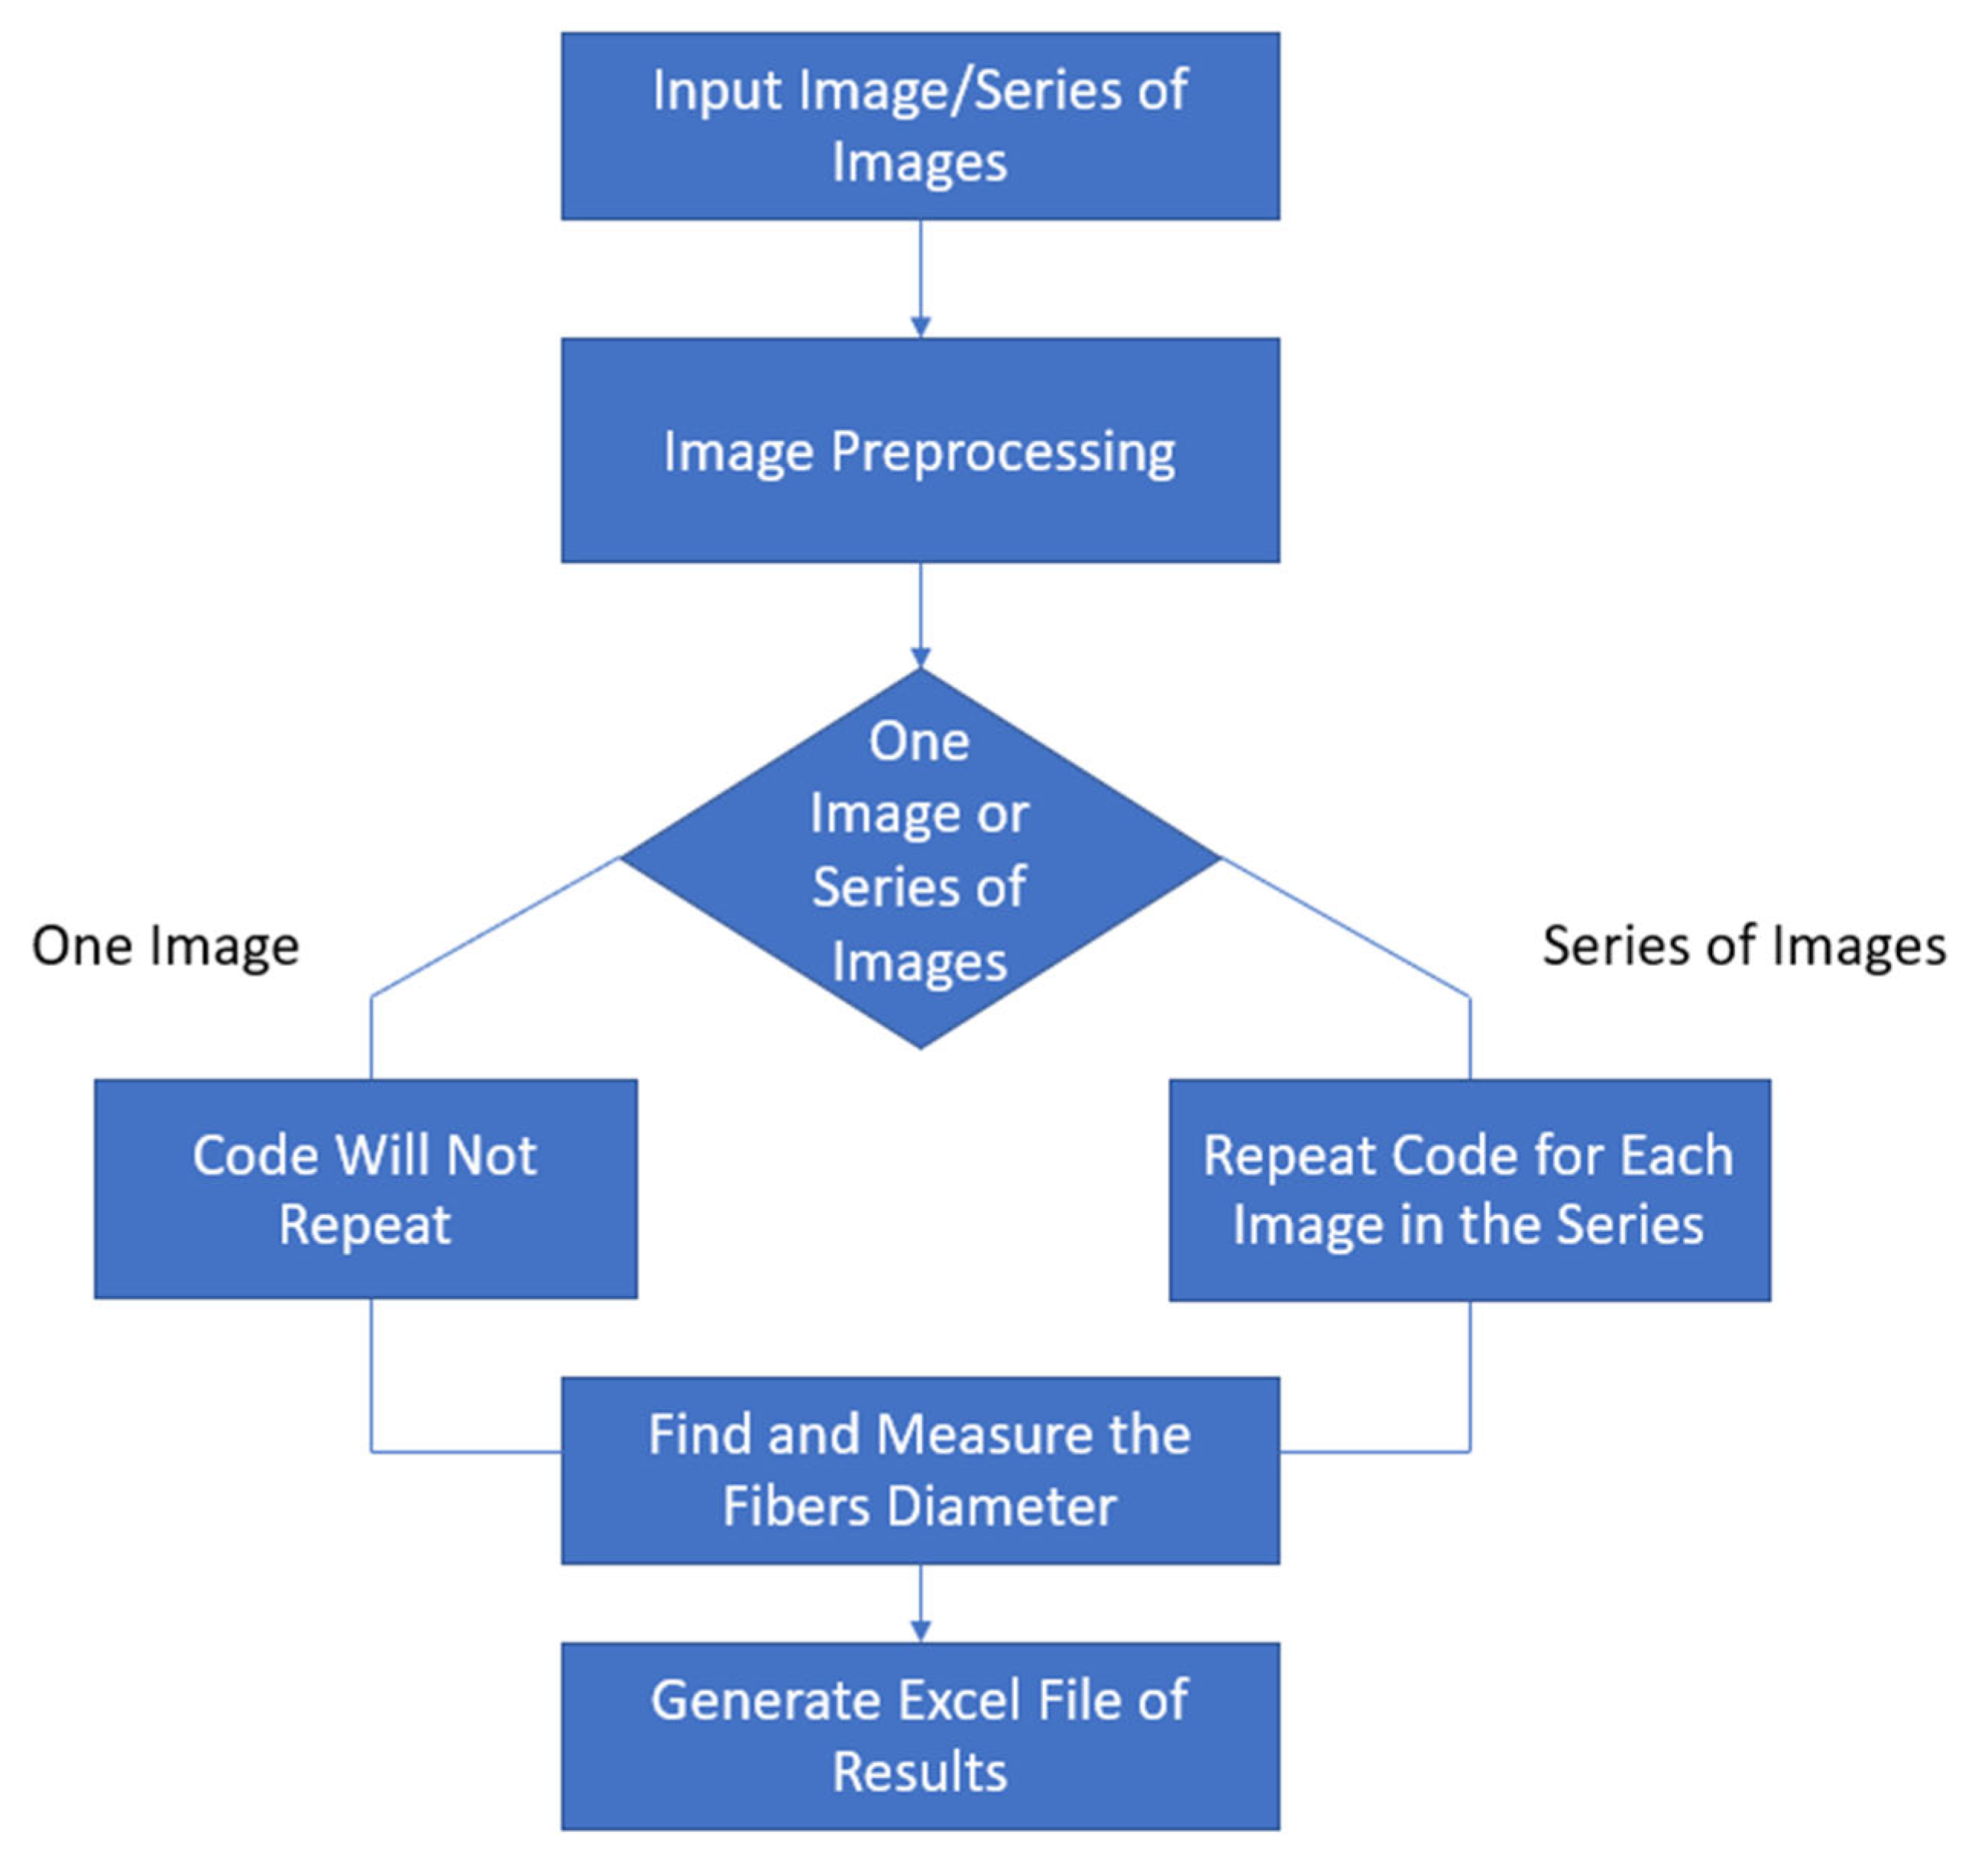
2.2. The Algorithm of Yarn’s Diameter
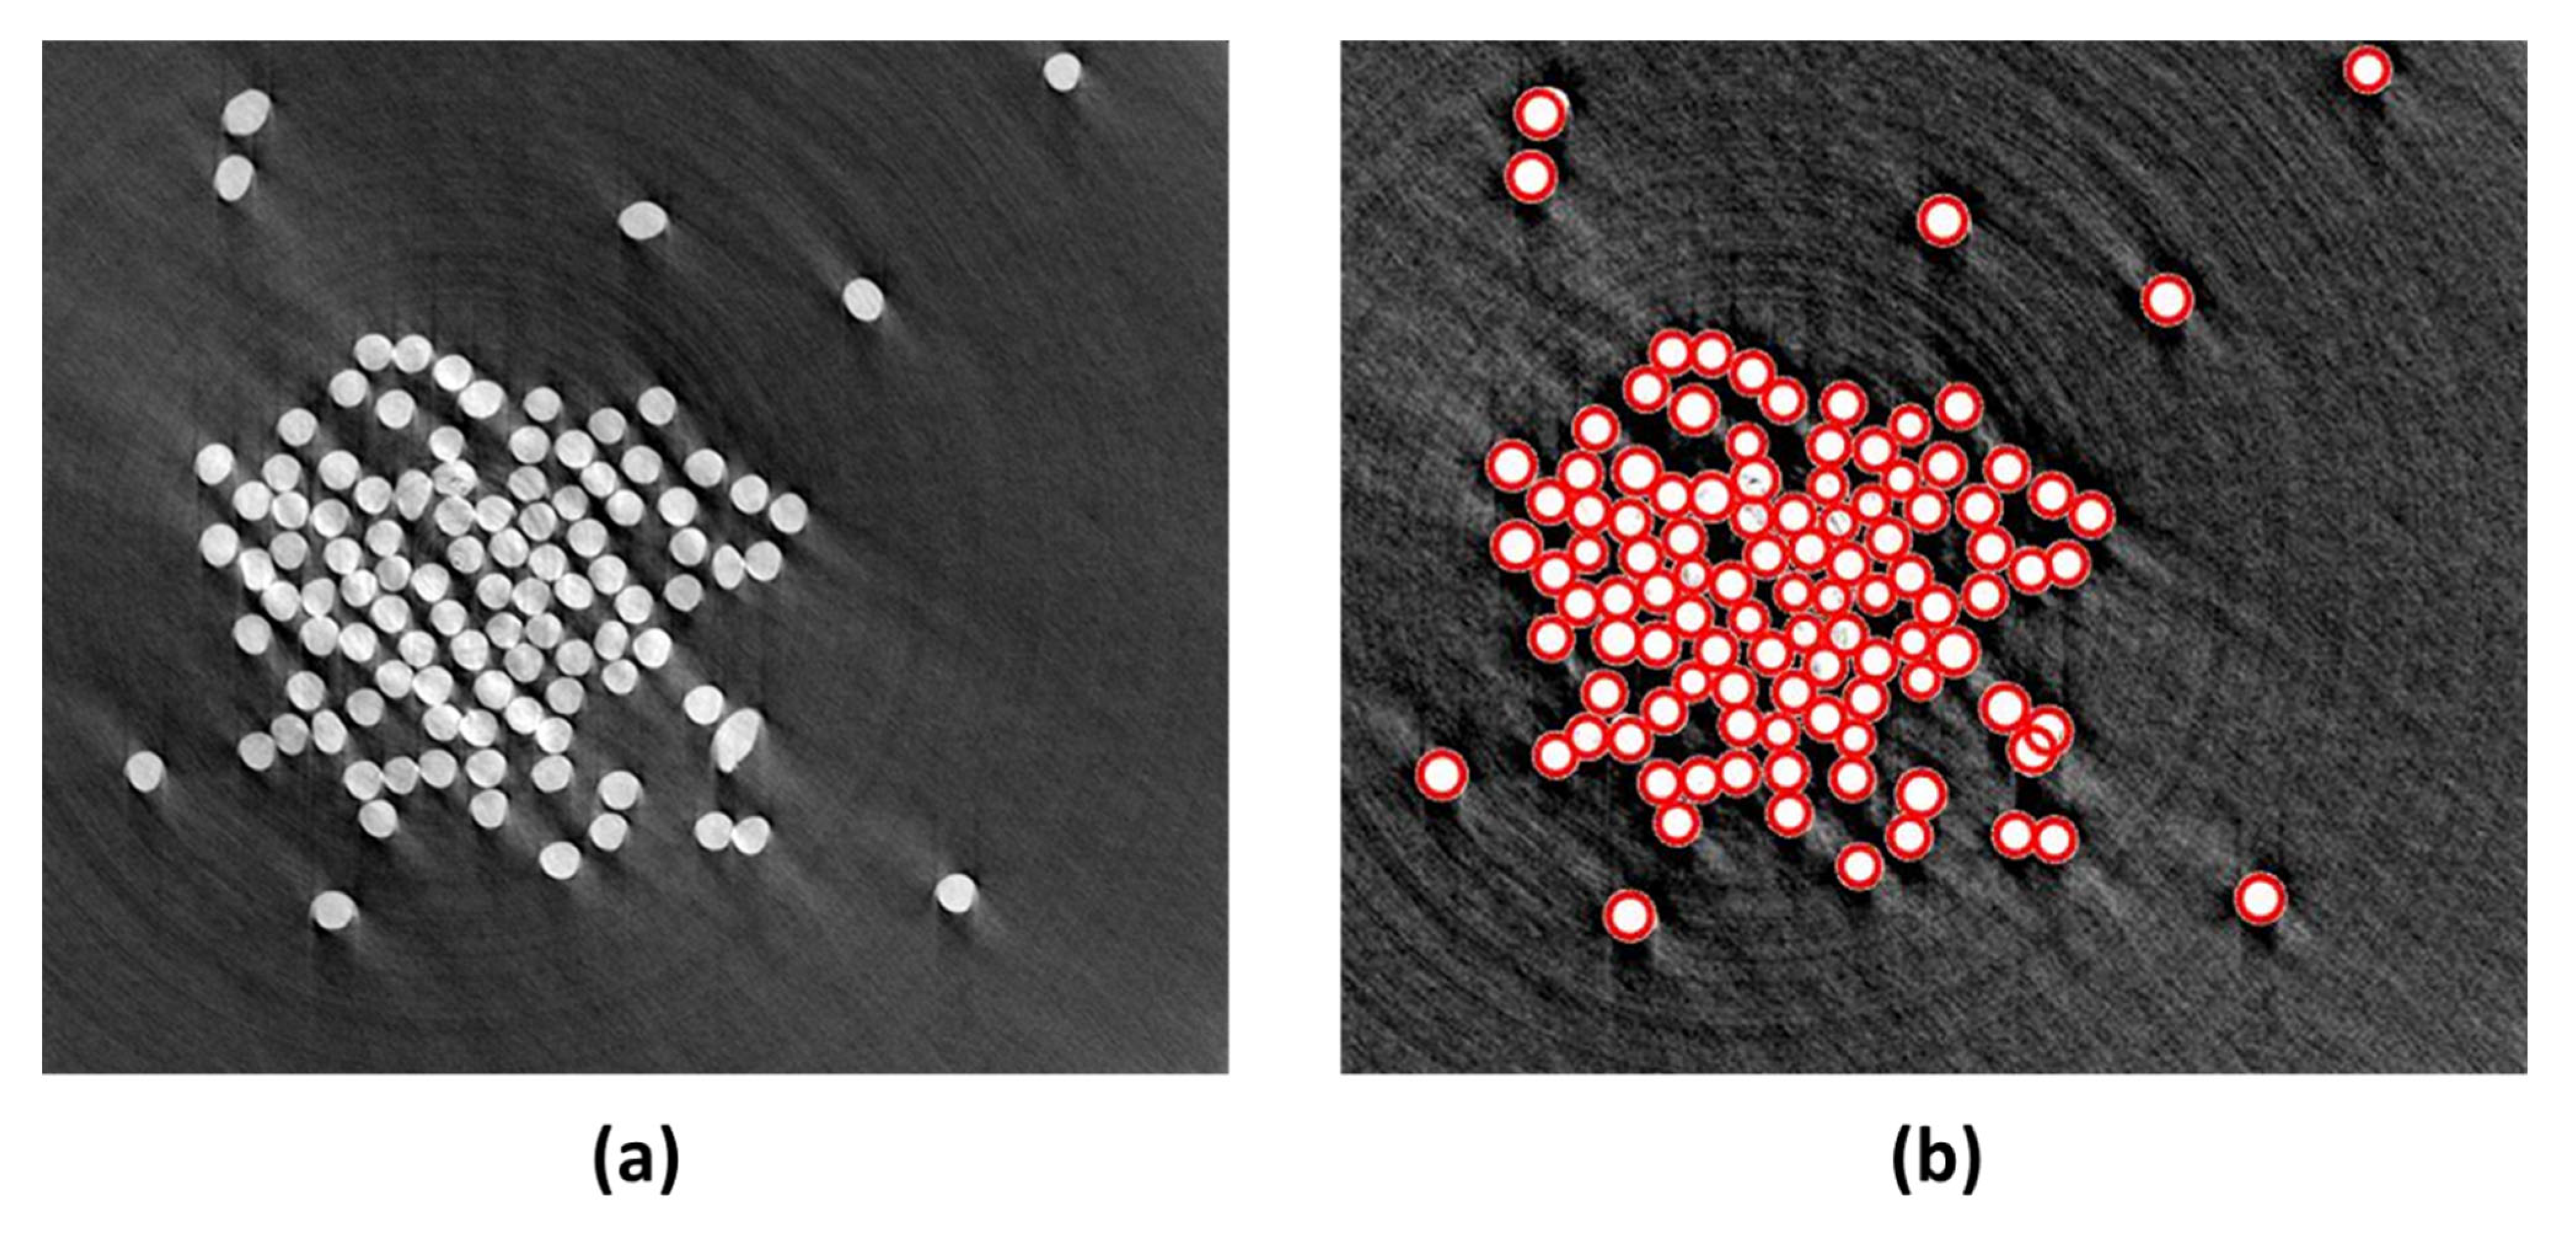
2.3. The Measurement of the Fibers’ Diameter
2.3.1. Obtaining Yarn’s Cross Sections
2.3.2. The Algorithm of the Yarn’s Diameter
3. Results and Discussion
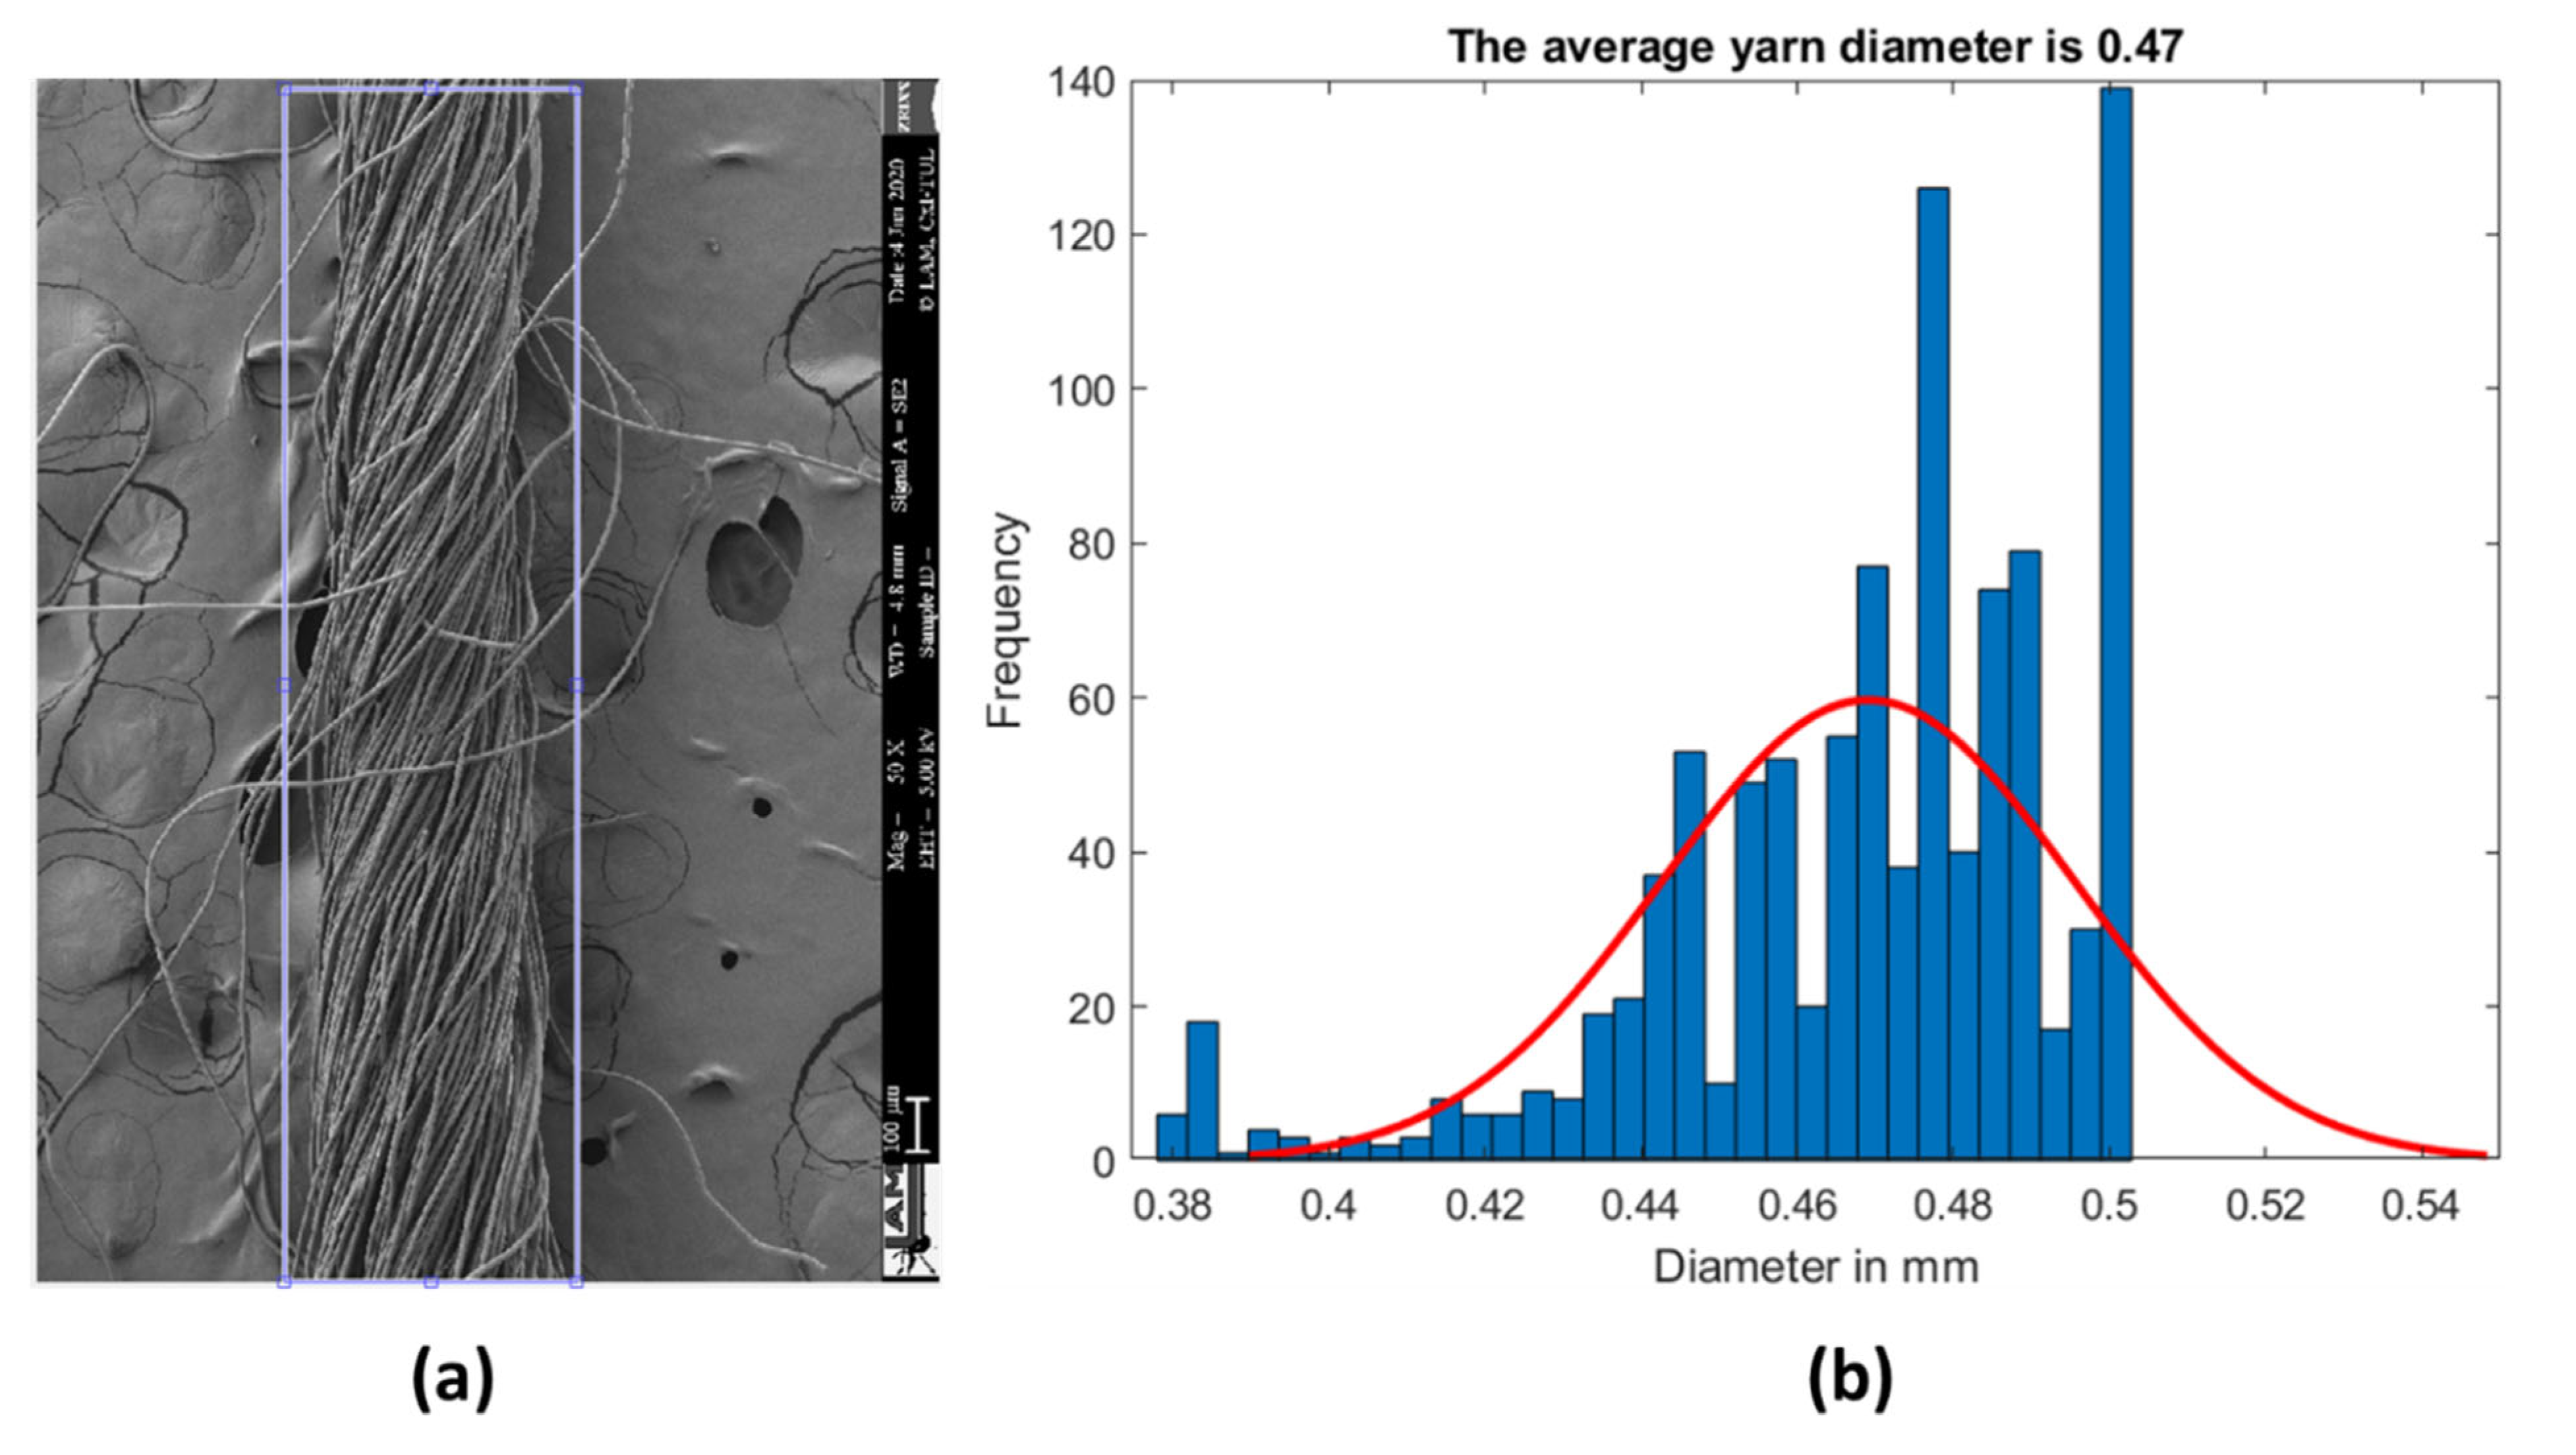
3.1. Yarn’s Results
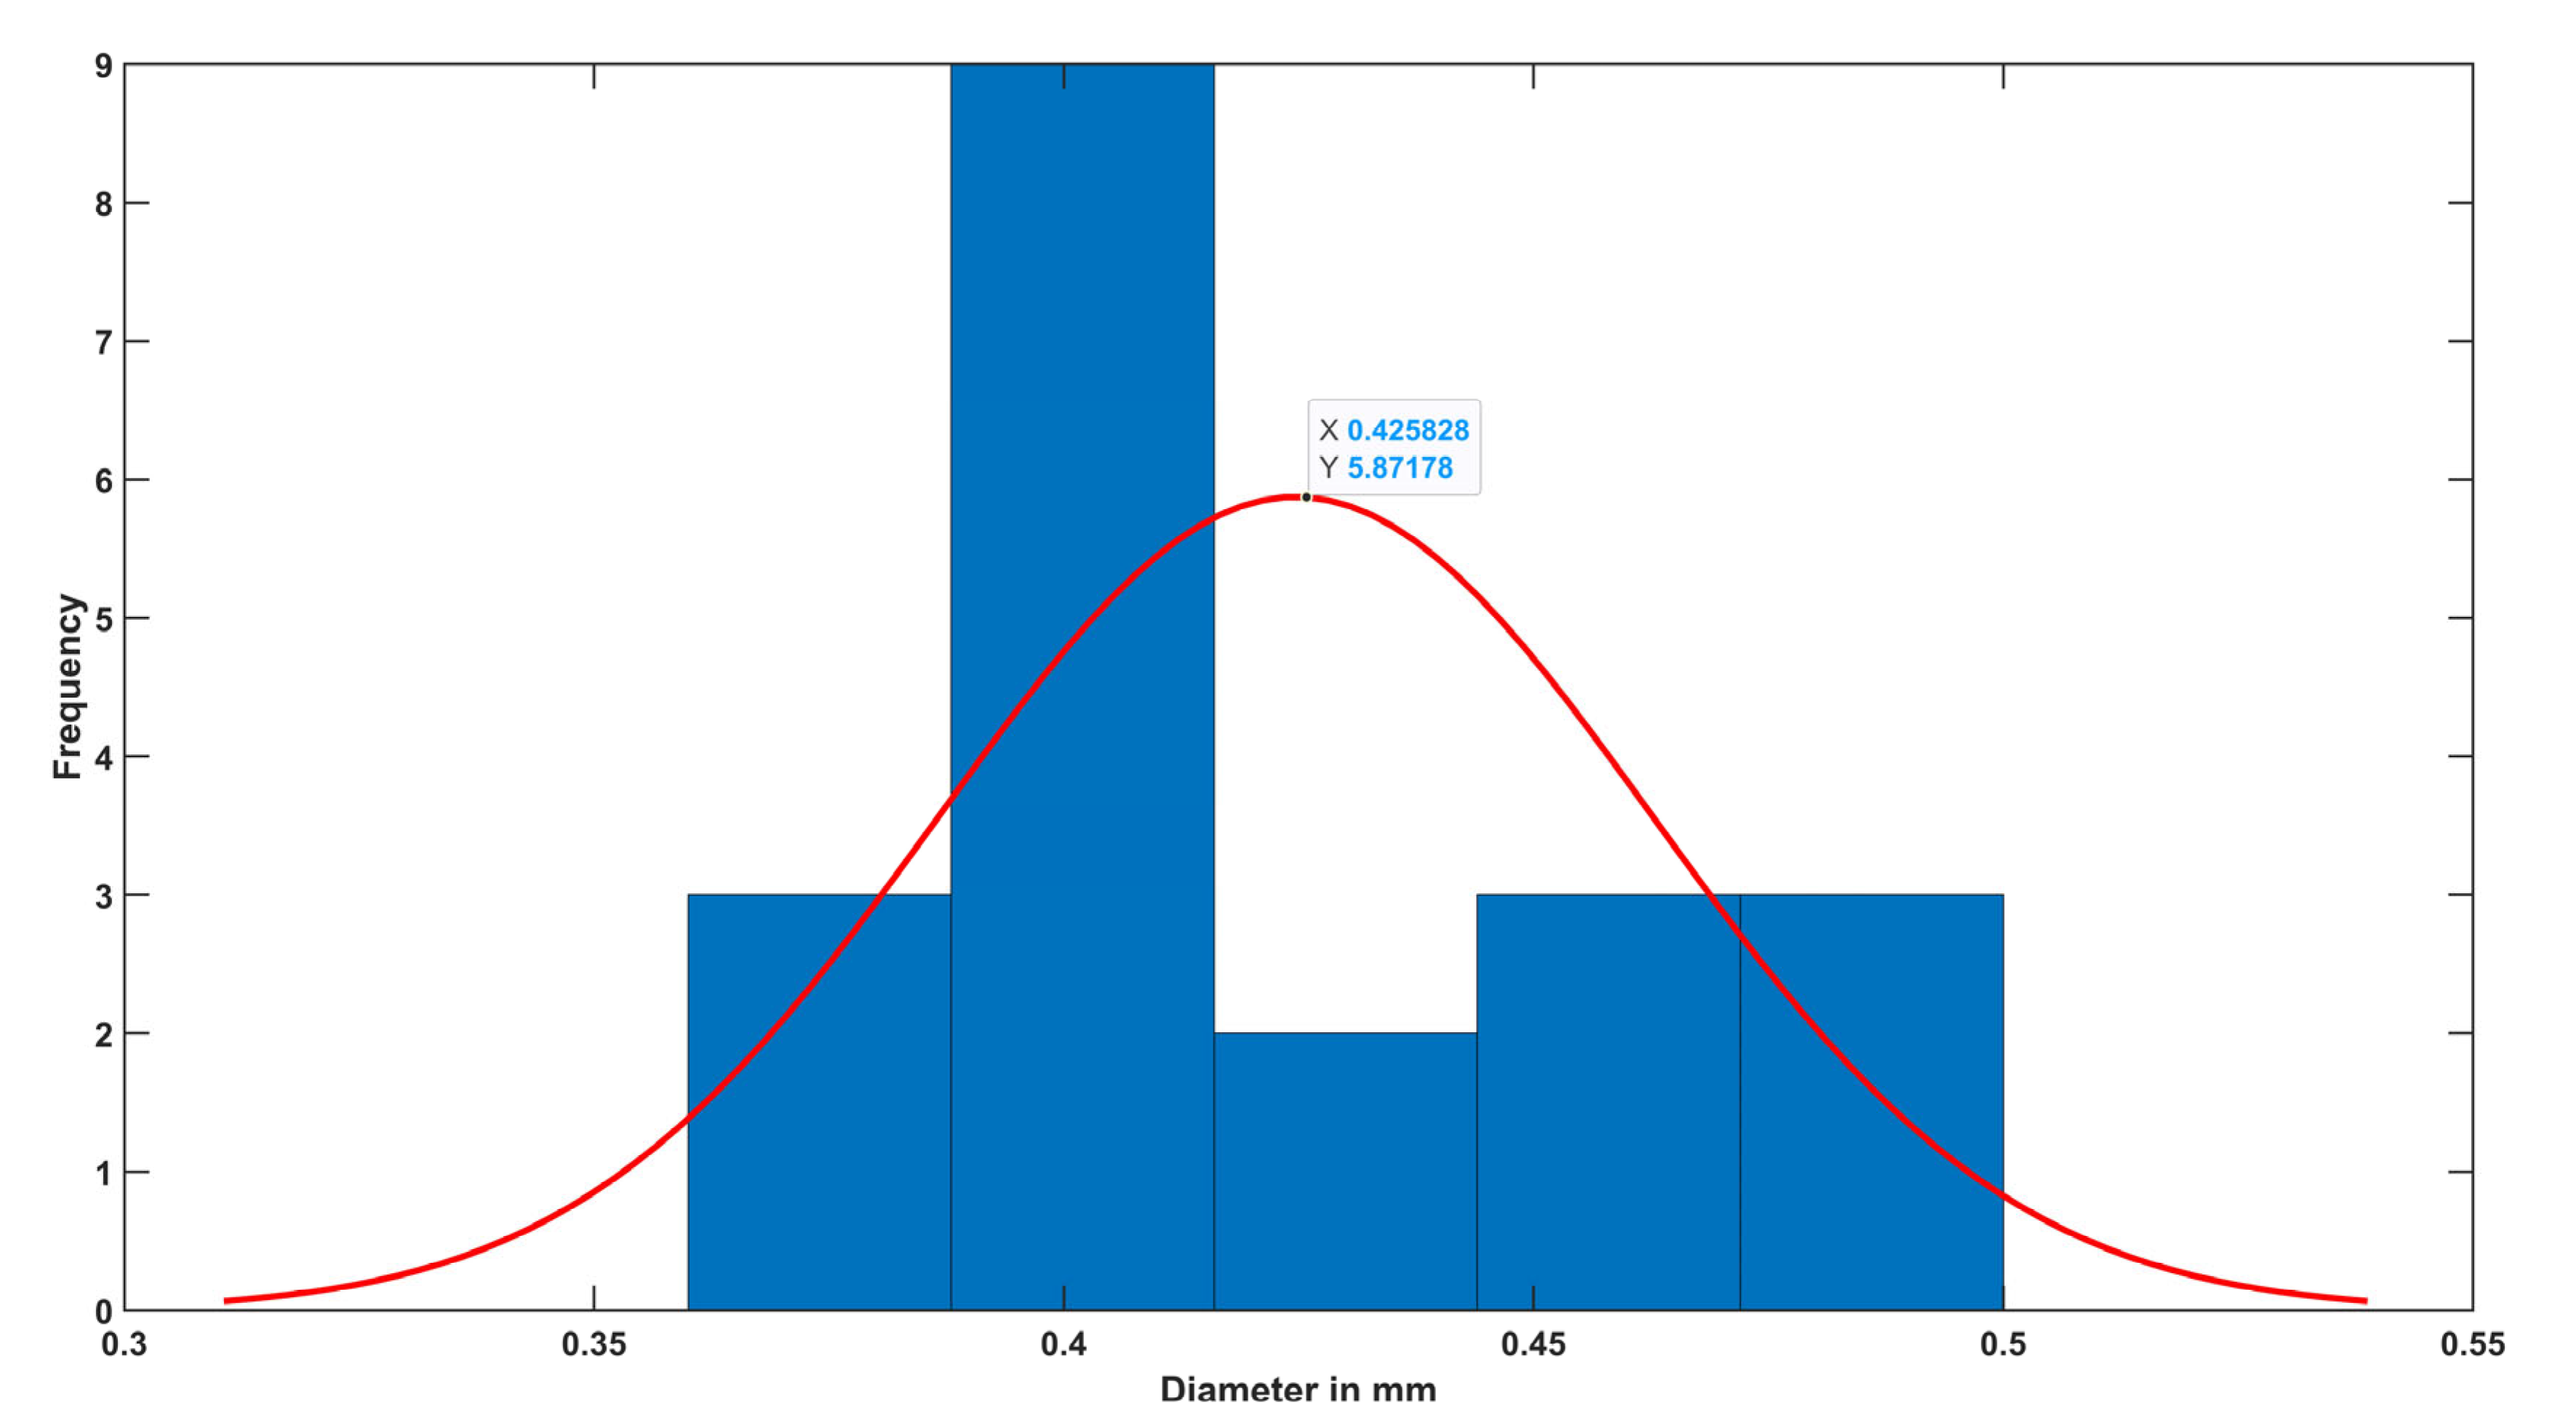
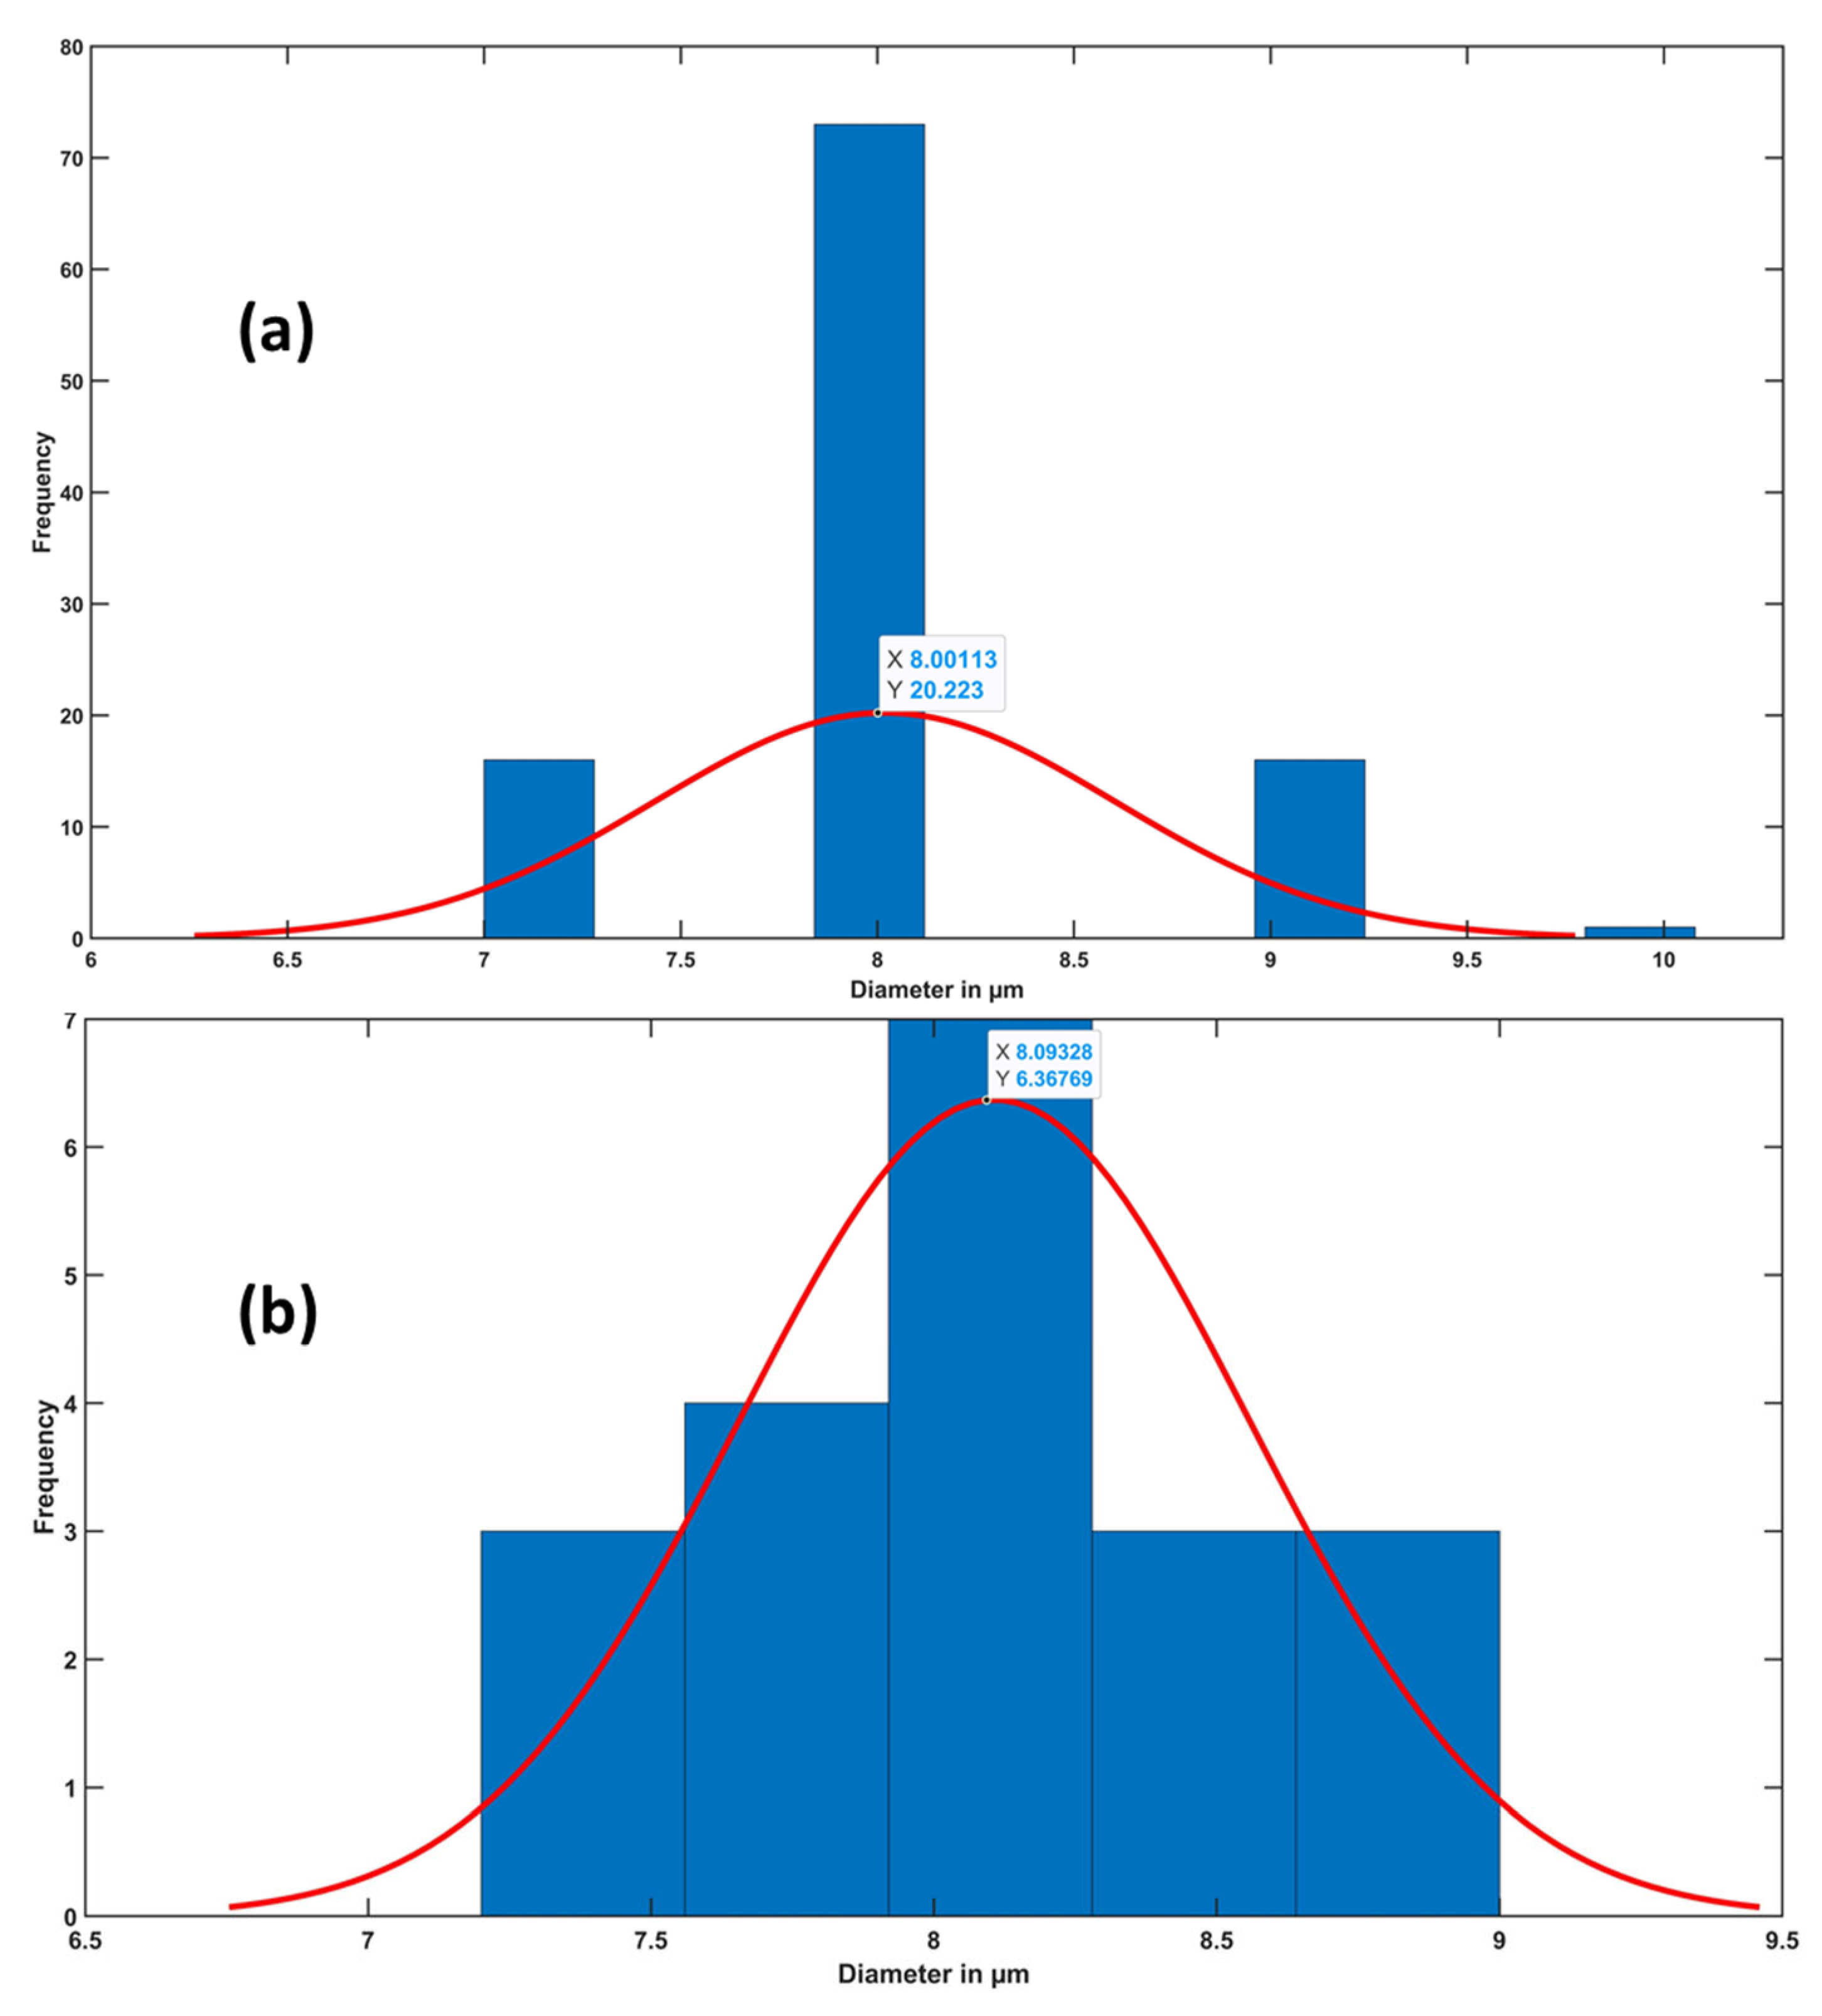
3.2. Fiber Results
4. Conclusions
Funding
Institutional Review Board Statement
Informed Consent Statement
Data Availability Statement
Conflicts of Interest
References
- Abrahart, E.N.; Whewell, C.S. Textile—Textile Finishing Processes. Available online: https://www.britannica.com/topic/textile/Textile-finishing-processes (accessed on 3 November 2021).
- Shah, D.U.; Schubel, P.J.; Clifford, M.J. Modelling the effect of yarn twist on the tensile strength of unidirectional plant fibre yarn composites. J. Compos. Mater. 2013, 47, 425–436. [Google Scholar] [CrossRef]
- Pan, N.; Hua, T.; Qiu, Y. Relationship Between Fiber and Yarn Strength. Text. Res. J. 2001, 71. [Google Scholar] [CrossRef]
- Turan, R.B.; Okur, A.; Deveci, R.; Açikel, M. Predicting the intra-yarn porosity by image analysis method. Text. Res. J. 2012, 82. [Google Scholar] [CrossRef]
- Eldessouki, M.; Ibrahim, S.; Militky, J. A dynamic and robust image processing based method for measuring the yarn diameter and its variation. Text. Res. J. 2014, 84. [Google Scholar] [CrossRef]
- Codaro, E.N.; Nakazato, R.Z.; Horovistiz, A.L.; Ribeiro, L.M.F.; Ribeiro, R.B.; Hein, L.R.O. An image processing method for morphology characterization and pitting corrosion evaluation. Mater. Sci. Eng. A 2002, 334, 298–306. [Google Scholar] [CrossRef]
- Sarfraz, M. Introductory Chapter: On Digital Image Processing. In Digital Imaging; IntechOpen: London, UK, 2020. [Google Scholar]
- Laykin, S.; Alchanatis, V.; Fallik, E.; Edan, Y. Image-processing algorithms for tomato classification. Trans. Am. Soc. Agric. Eng. 2002, 45, 851–858. [Google Scholar] [CrossRef]
- Erhardt, A.; Zinser, G.; Komitowski, D.; Bille, J. Reconstructing 3-D light-microscopic images by digital image processing. Appl. Opt. 1985, 24, 194–200. [Google Scholar] [CrossRef]
- Masselin, I.; Durand-Bourlier, L.; Laine, J.M.; Sizaret, P.Y.; Chasseray, X.; Lemordant, D. Membrane characterization using microscopic image analysis. J. Membr. Sci. 2001, 186, 85–96. [Google Scholar] [CrossRef]
- Yoon, J.; Kim, H.; Sim, S.H.; Pyo, S. Characterization of porous cementitious materials using microscopic image processing and X-ray CT analysis. Materials 2020, 13, 3105. [Google Scholar] [CrossRef]
- Wang, L.; Lu, Y.; Pan, R.; Gao, W. Evaluation of yarn appearance on a blackboard based on image processing. Text. Res. J. 2021, 91, 2263–2271. [Google Scholar] [CrossRef]
- Abd-Elhamied, M.R.; Hashima, W.A.; ElKateb, S.; Elhawary, I.; El-Geiheini, A. Prediction of Cotton Yarn’s Characteristics by Image Processing and ANN. Alex. Eng. J. 2022, 61, 3335–3340. [Google Scholar] [CrossRef]
- Huang, C.C.; Liu, S.C. Woven Fabric Analysis by Image Processing. Part II: Computing the Twist Angle. Text. Res. J. 2001, 71, 361–366. [Google Scholar] [CrossRef]
- Technologies, U. Think Quality—Think USTER®. Available online: https://www.uster.com/en/ (accessed on 6 November 2021).
- Ni, J.; Khan, Z.; Wang, S.; Wang, K.; Haider, S.K. Automatic detection and counting of circular shaped overlapped objects using circular hough transform and contour detection. In Proceedings of the 2016 12th World Congress on Intelligent Control and Automation (WCICA), Guilin, China, 12–15 June 2016; Volume 2016. [Google Scholar]
- Elmogahzy, Y. Structure and mechanics of yarns. In Structure and Mechanics of Textile Fibre Assemblies, 2nd ed.; Woodhead Publishing: Sawston, UK, 2019. [Google Scholar]
- Lu, S.; Xin, B.; Deng, N.; Wang, L.; Wang, W. Investigation of cross-sectional image analysis method to determine the blending ratio of polyester/cotton yarn. J. Microsc. 2020, 279, 16–25. [Google Scholar] [CrossRef] [PubMed]
- Yang, K.; Tao, X.M.; Xu, B.G.; Lam, J. Structure and Properties of Low Twist Short-staple Singles Ring Spun Yarns. Text. Res. J. 2007, 77, 675–685. [Google Scholar] [CrossRef]
- Yu, X.W.; Wang, H.; Wang, Z.W. Analysis of yarn fiber volume fraction in textile composites using scanning electron microscopy and X-ray micro-computed tomography. J. Reinf. Plast. Compos. 2019, 38. [Google Scholar] [CrossRef]
- Melenka, G.W.; Gholami, A. Fiber identification of braided composites using micro-computed tomography. Compos. Commun. 2021, 27, 100813. [Google Scholar] [CrossRef]
- Guo, Q.; Zhang, Y.; Li, D.; Guo, R.; Ma, M.; Chen, L. Effect of bias yarn on tensile fracture mechanism of multiaxial 3D angle-interlock woven composites. Thin-Walled Struct. 2021, 159, 107269. [Google Scholar] [CrossRef]
- Hough, P.V.C. A method and Means for Recognition Complex Patterns. US Patent US3069654A, 18 December 1962. [Google Scholar]
- Ballard, D.H. Generalizing the Hough transform to detect arbitrary shapes. Pattern Recognit. 1981, 13, 111–122. [Google Scholar] [CrossRef] [Green Version]
- Smereka, M.; Dulȩba, I. Circular object detection using a modified Hough transform. Int. J. Appl. Math. Comput. Sci. 2008, 18, 85–91. [Google Scholar] [CrossRef] [Green Version]
- Khairosfaizal, W.M.K.W.M.; Nor’aini, A.J. Eyes detection in facial images using circular hough transform. In Proceedings of the 2009 5th International Colloquium on Signal Processing and Its Applications (CSPA), Kuala Lumpur, Malaysia, 6–8 March 2009. [Google Scholar]
- Mirzaei, M.; Rafsanjani, H.K. An automatic algorithm for determination of the nanoparticles from TEM images using circular hough transform. Micron 2017, 96, 86–95. [Google Scholar] [CrossRef] [PubMed]
- Abdelkader, M. MATLAB Algorithms. Available online: https://github.com/MohamedAbdelkader94/Yarn-and-fibers-MATLAB-algorithms (accessed on 25 January 2022).
- Rueden, C.T.; Schindelin, J.; Hiner, M.C.; DeZonia, B.E.; Walter, A.E.; Arena, E.T.; Eliceiri, K.W. ImageJ2: ImageJ for the next generation of scientific image data. BMC Bioinform. 2017, 18, 529. [Google Scholar] [CrossRef] [PubMed]


Publisher’s Note: MDPI stays neutral with regard to jurisdictional claims in published maps and institutional affiliations. |
© 2022 by the author. Licensee MDPI, Basel, Switzerland. This article is an open access article distributed under the terms and conditions of the Creative Commons Attribution (CC BY) license (https://creativecommons.org/licenses/by/4.0/).
Share and Cite
Abdelkader, M. MATLAB Algorithms for Diameter Measurements of Textile Yarns and Fibers through Image Processing Techniques. Materials 2022, 15, 1299. https://doi.org/10.3390/ma15041299
Abdelkader M. MATLAB Algorithms for Diameter Measurements of Textile Yarns and Fibers through Image Processing Techniques. Materials. 2022; 15(4):1299. https://doi.org/10.3390/ma15041299
Chicago/Turabian StyleAbdelkader, Mohamed. 2022. "MATLAB Algorithms for Diameter Measurements of Textile Yarns and Fibers through Image Processing Techniques" Materials 15, no. 4: 1299. https://doi.org/10.3390/ma15041299
APA StyleAbdelkader, M. (2022). MATLAB Algorithms for Diameter Measurements of Textile Yarns and Fibers through Image Processing Techniques. Materials, 15(4), 1299. https://doi.org/10.3390/ma15041299