
Influence of Selected Ophthalmic Fluids on the Wettability and Hydration of Hydrogel and Silicone Hydrogel Contact Lenses—In Vitro Study


Abstract
:1. Introduction
2. Materials and Methods
2.1. Contact Lenses
2.2. Sample Preparation
2.3. Dehydration
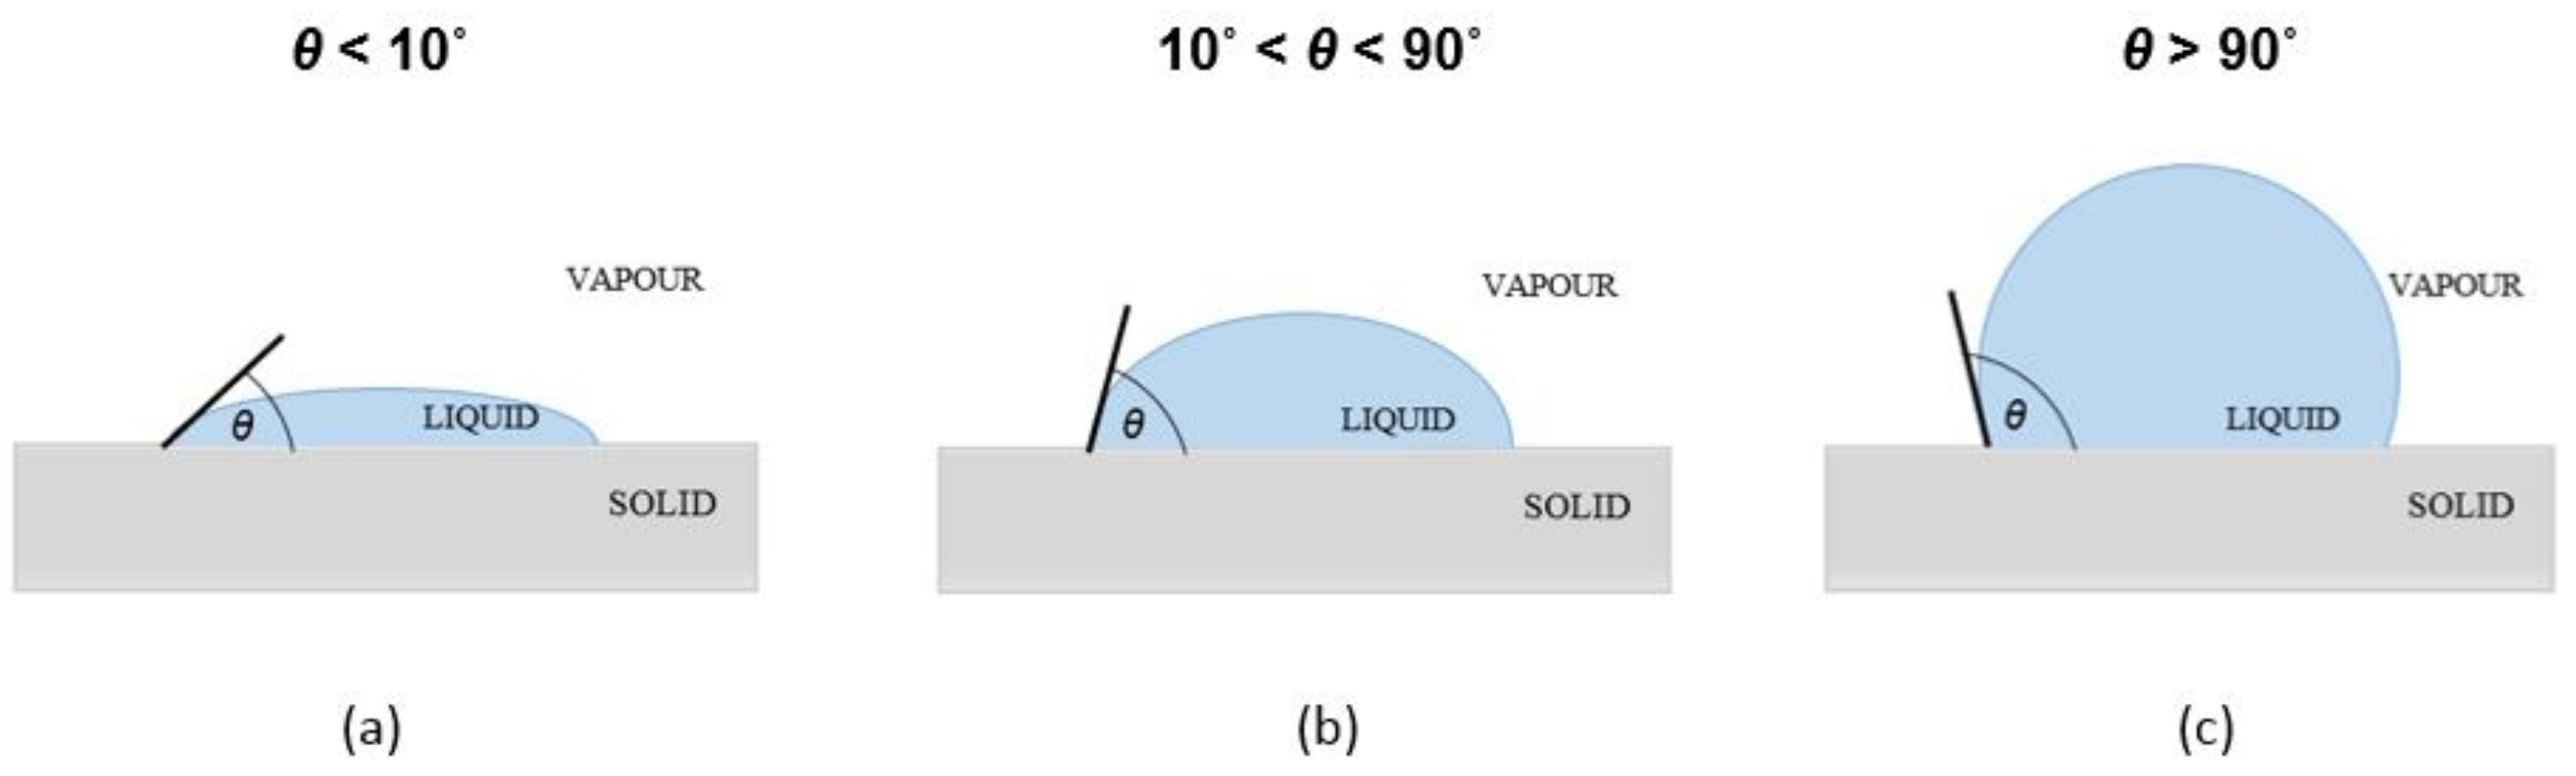
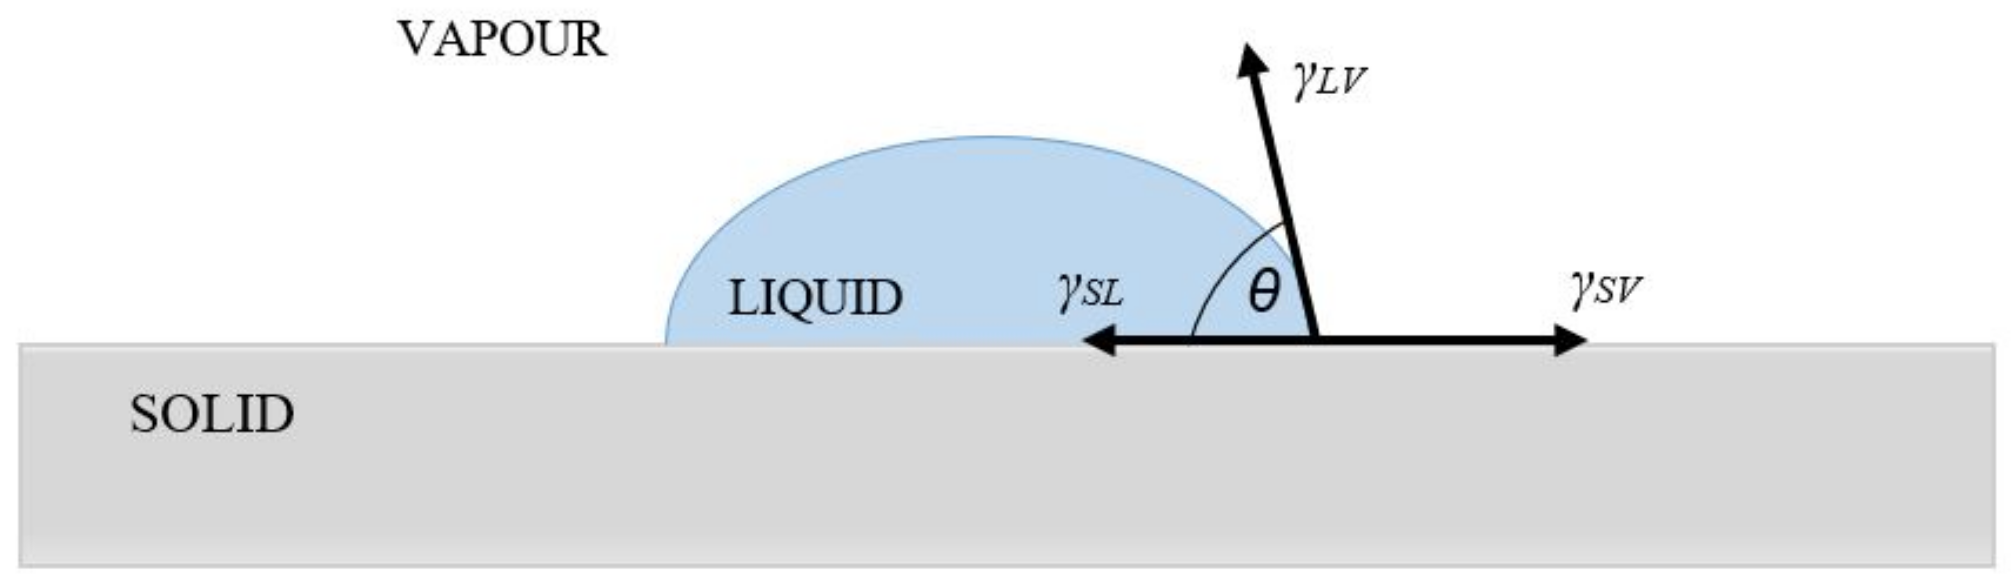
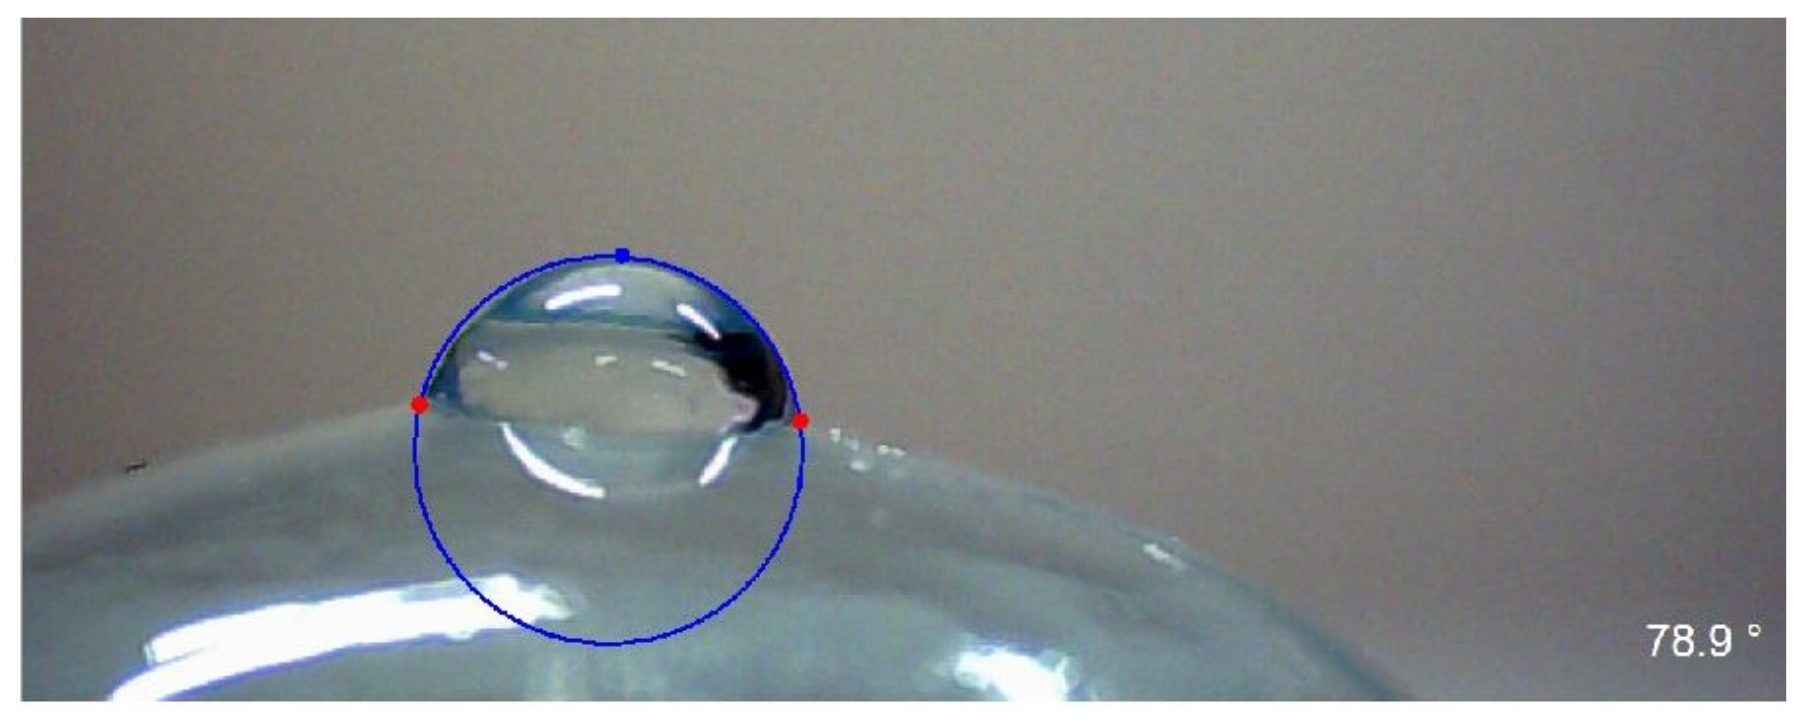
2.4. Wettability and Surface Free Energy (SFE)
2.4.1. Owens–Wendt Method
2.4.2. Wu Method
2.4.3. Neumann Method
2.4.4. Neumann–Kwok Method
3. Results
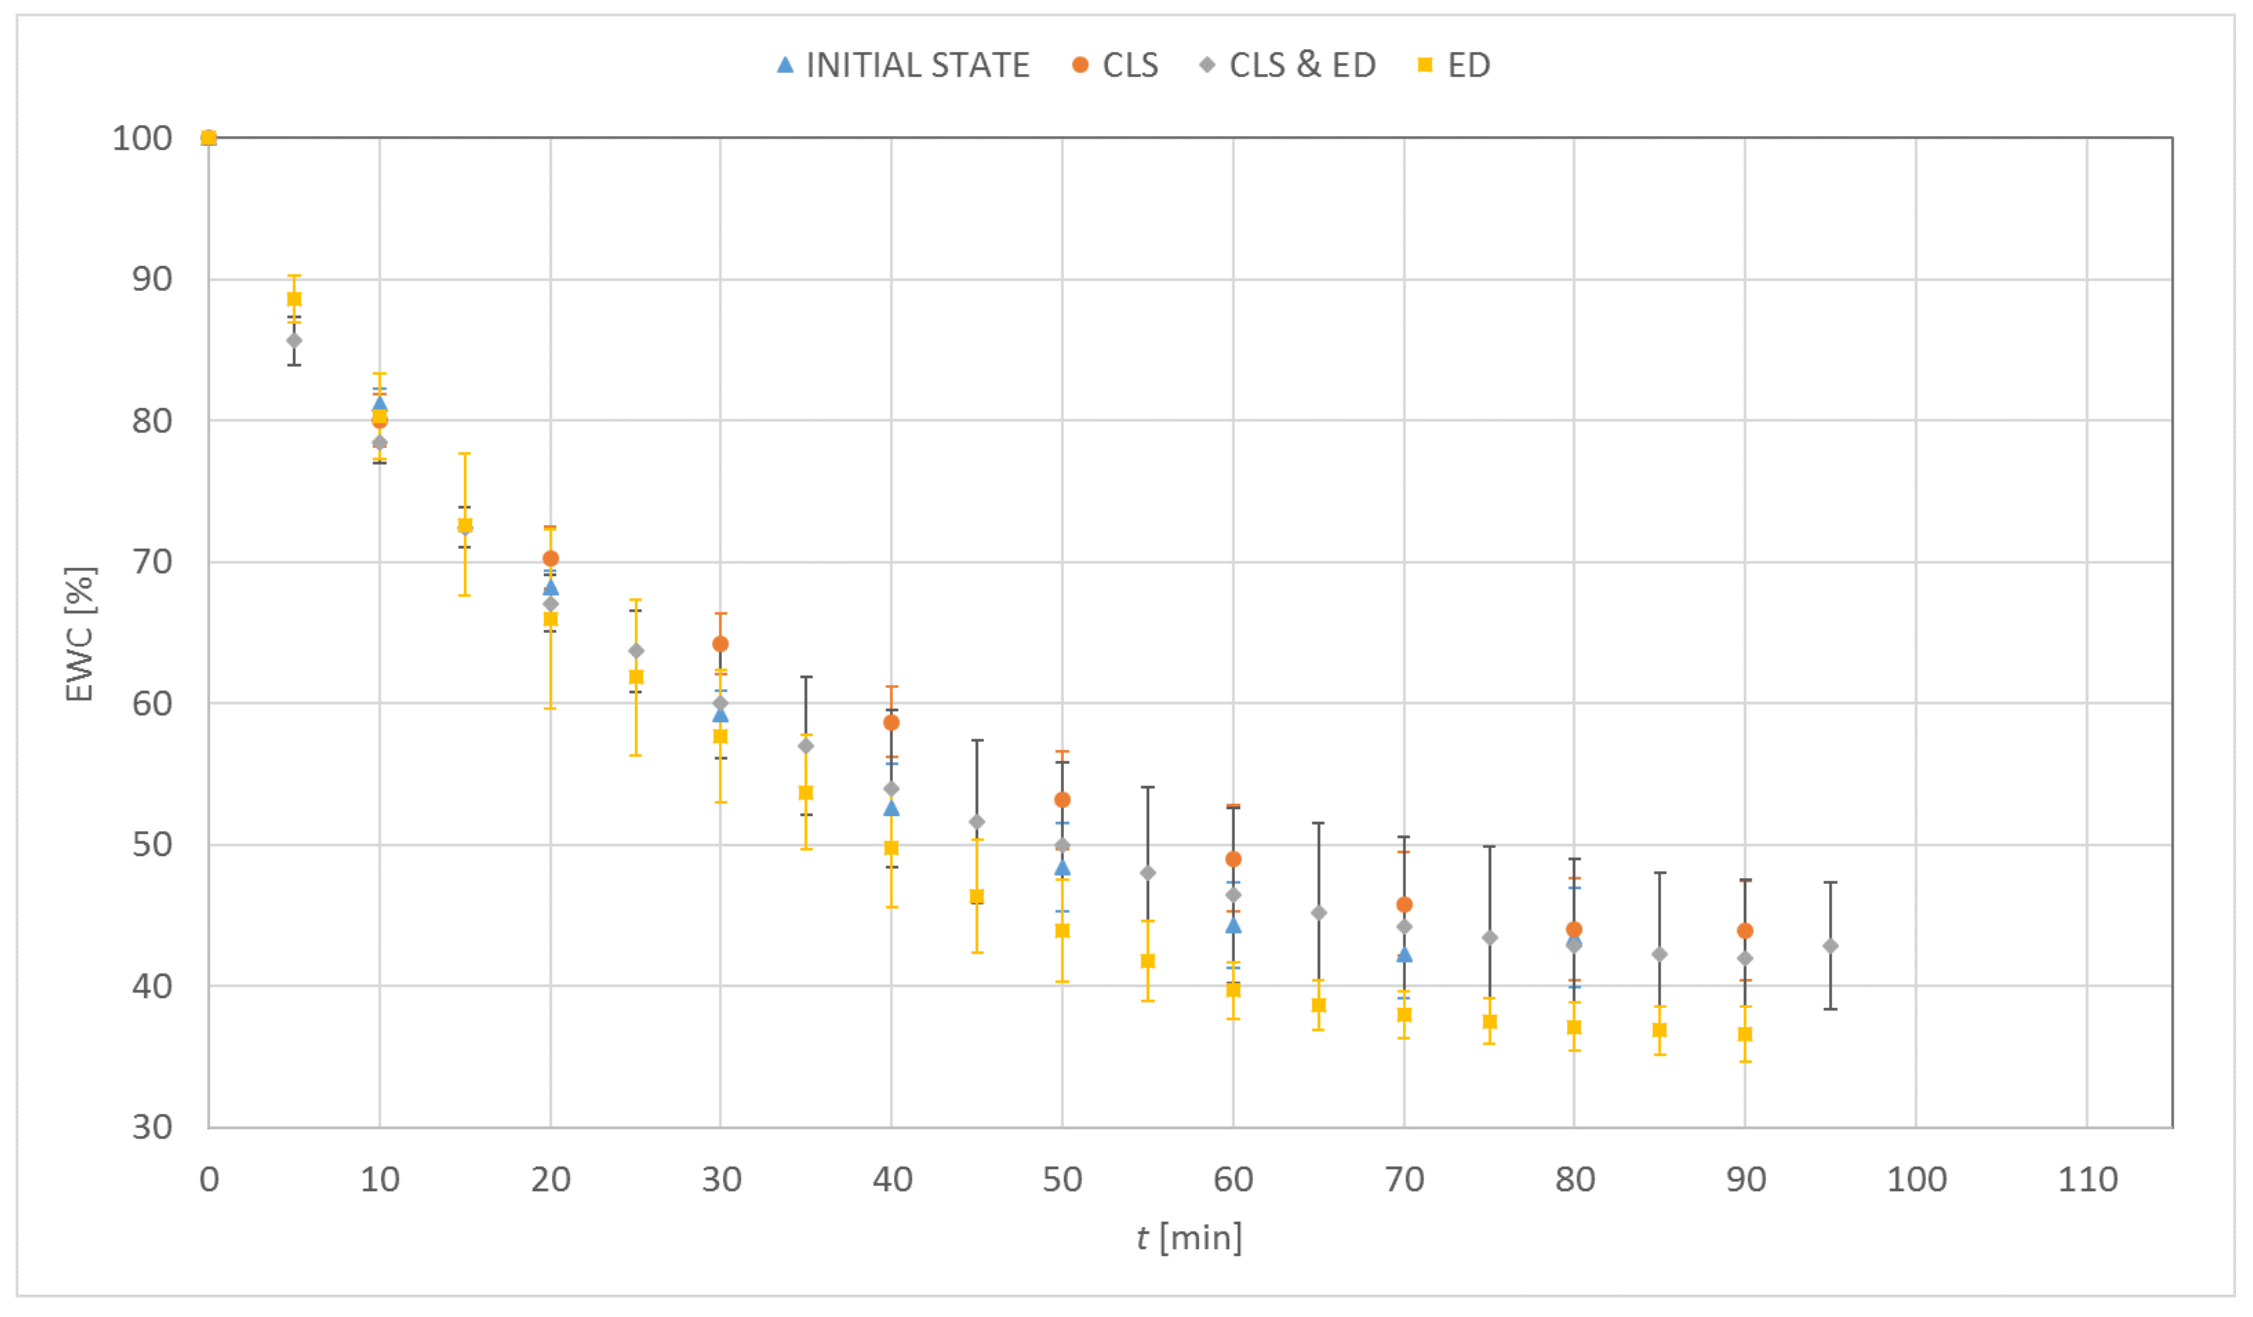
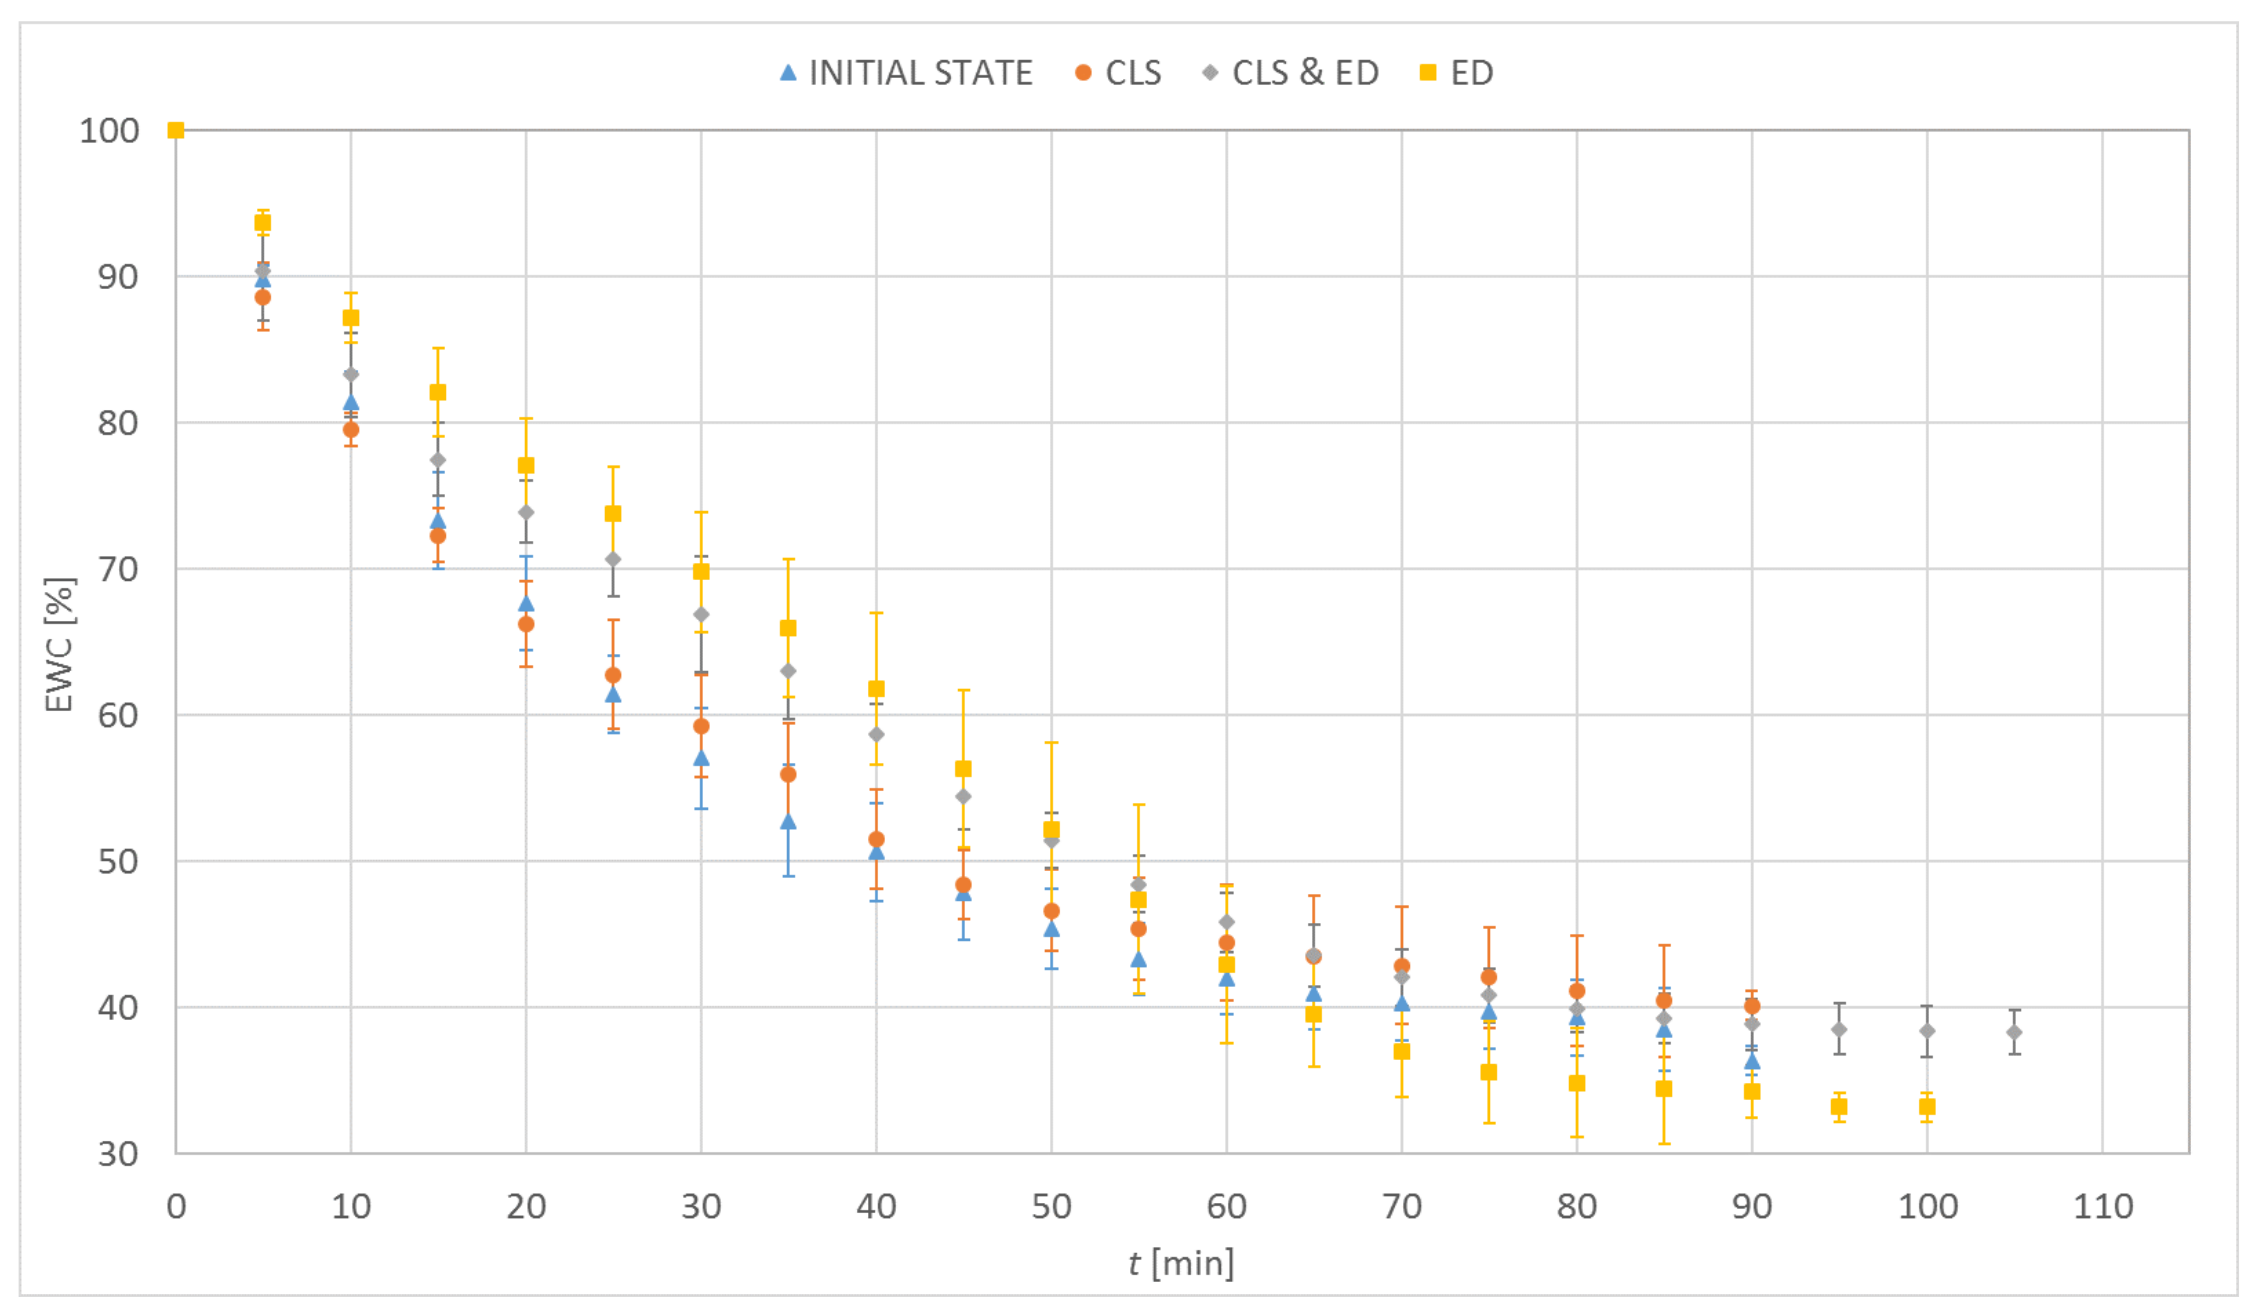
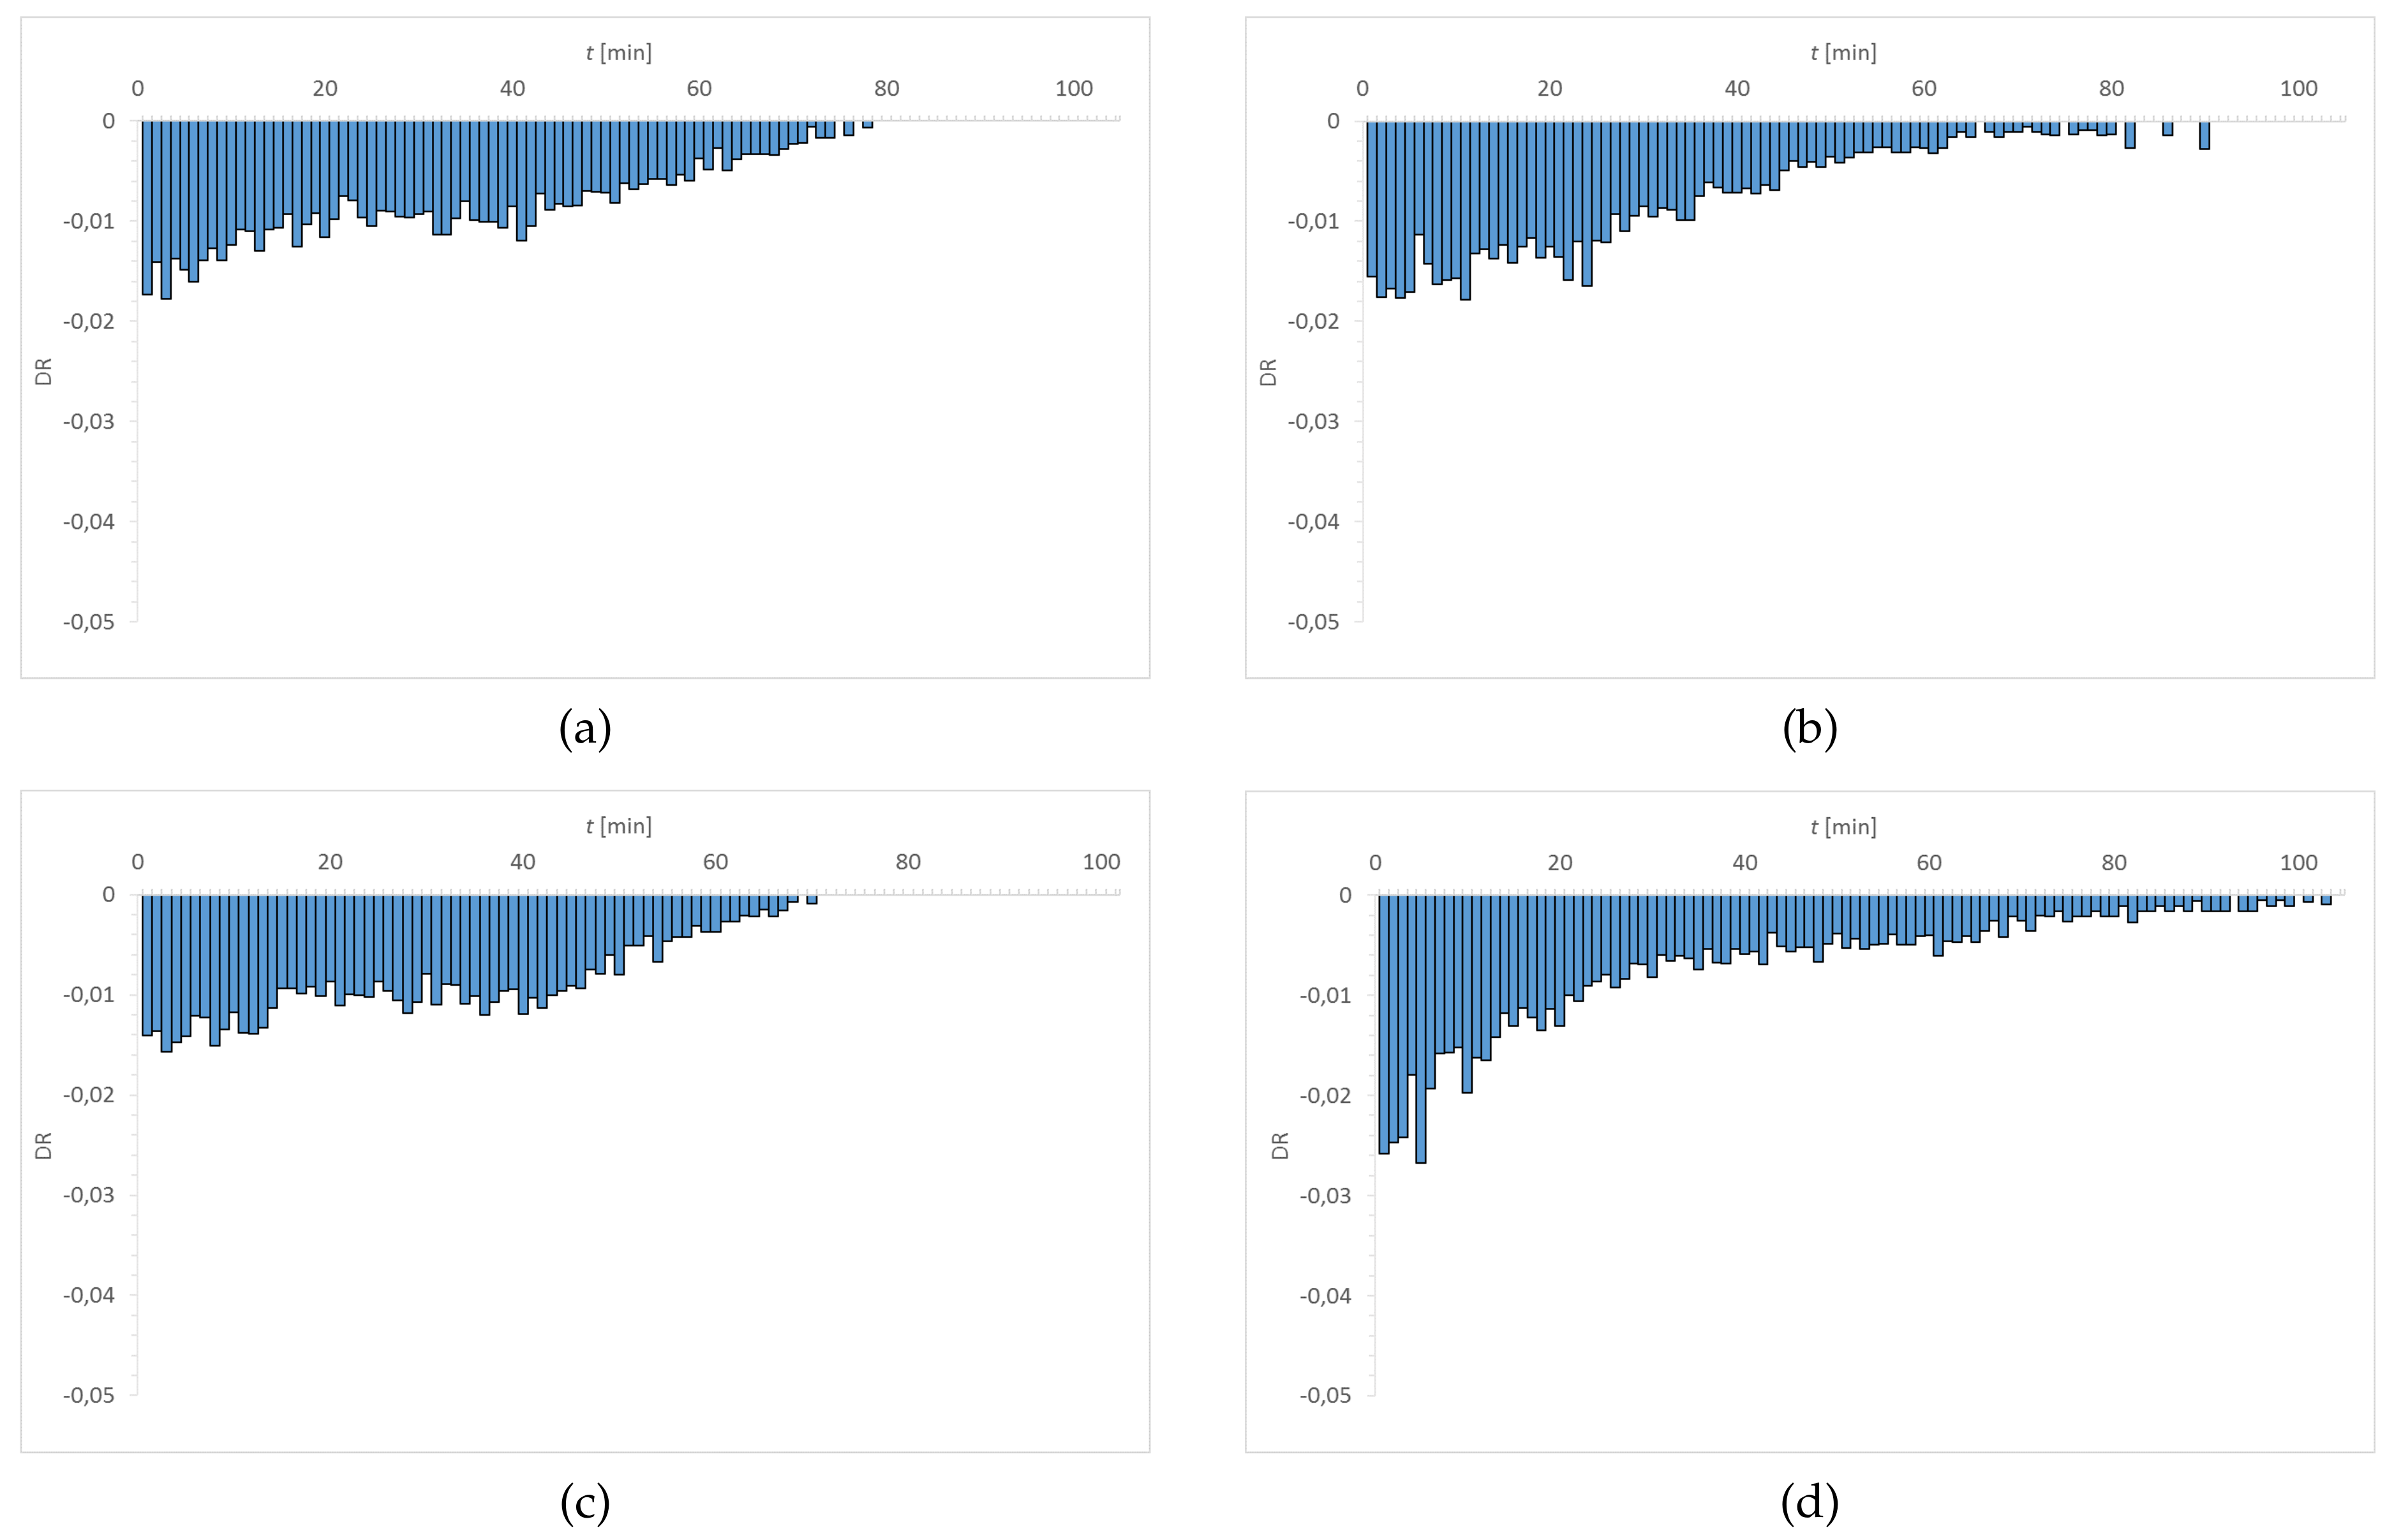
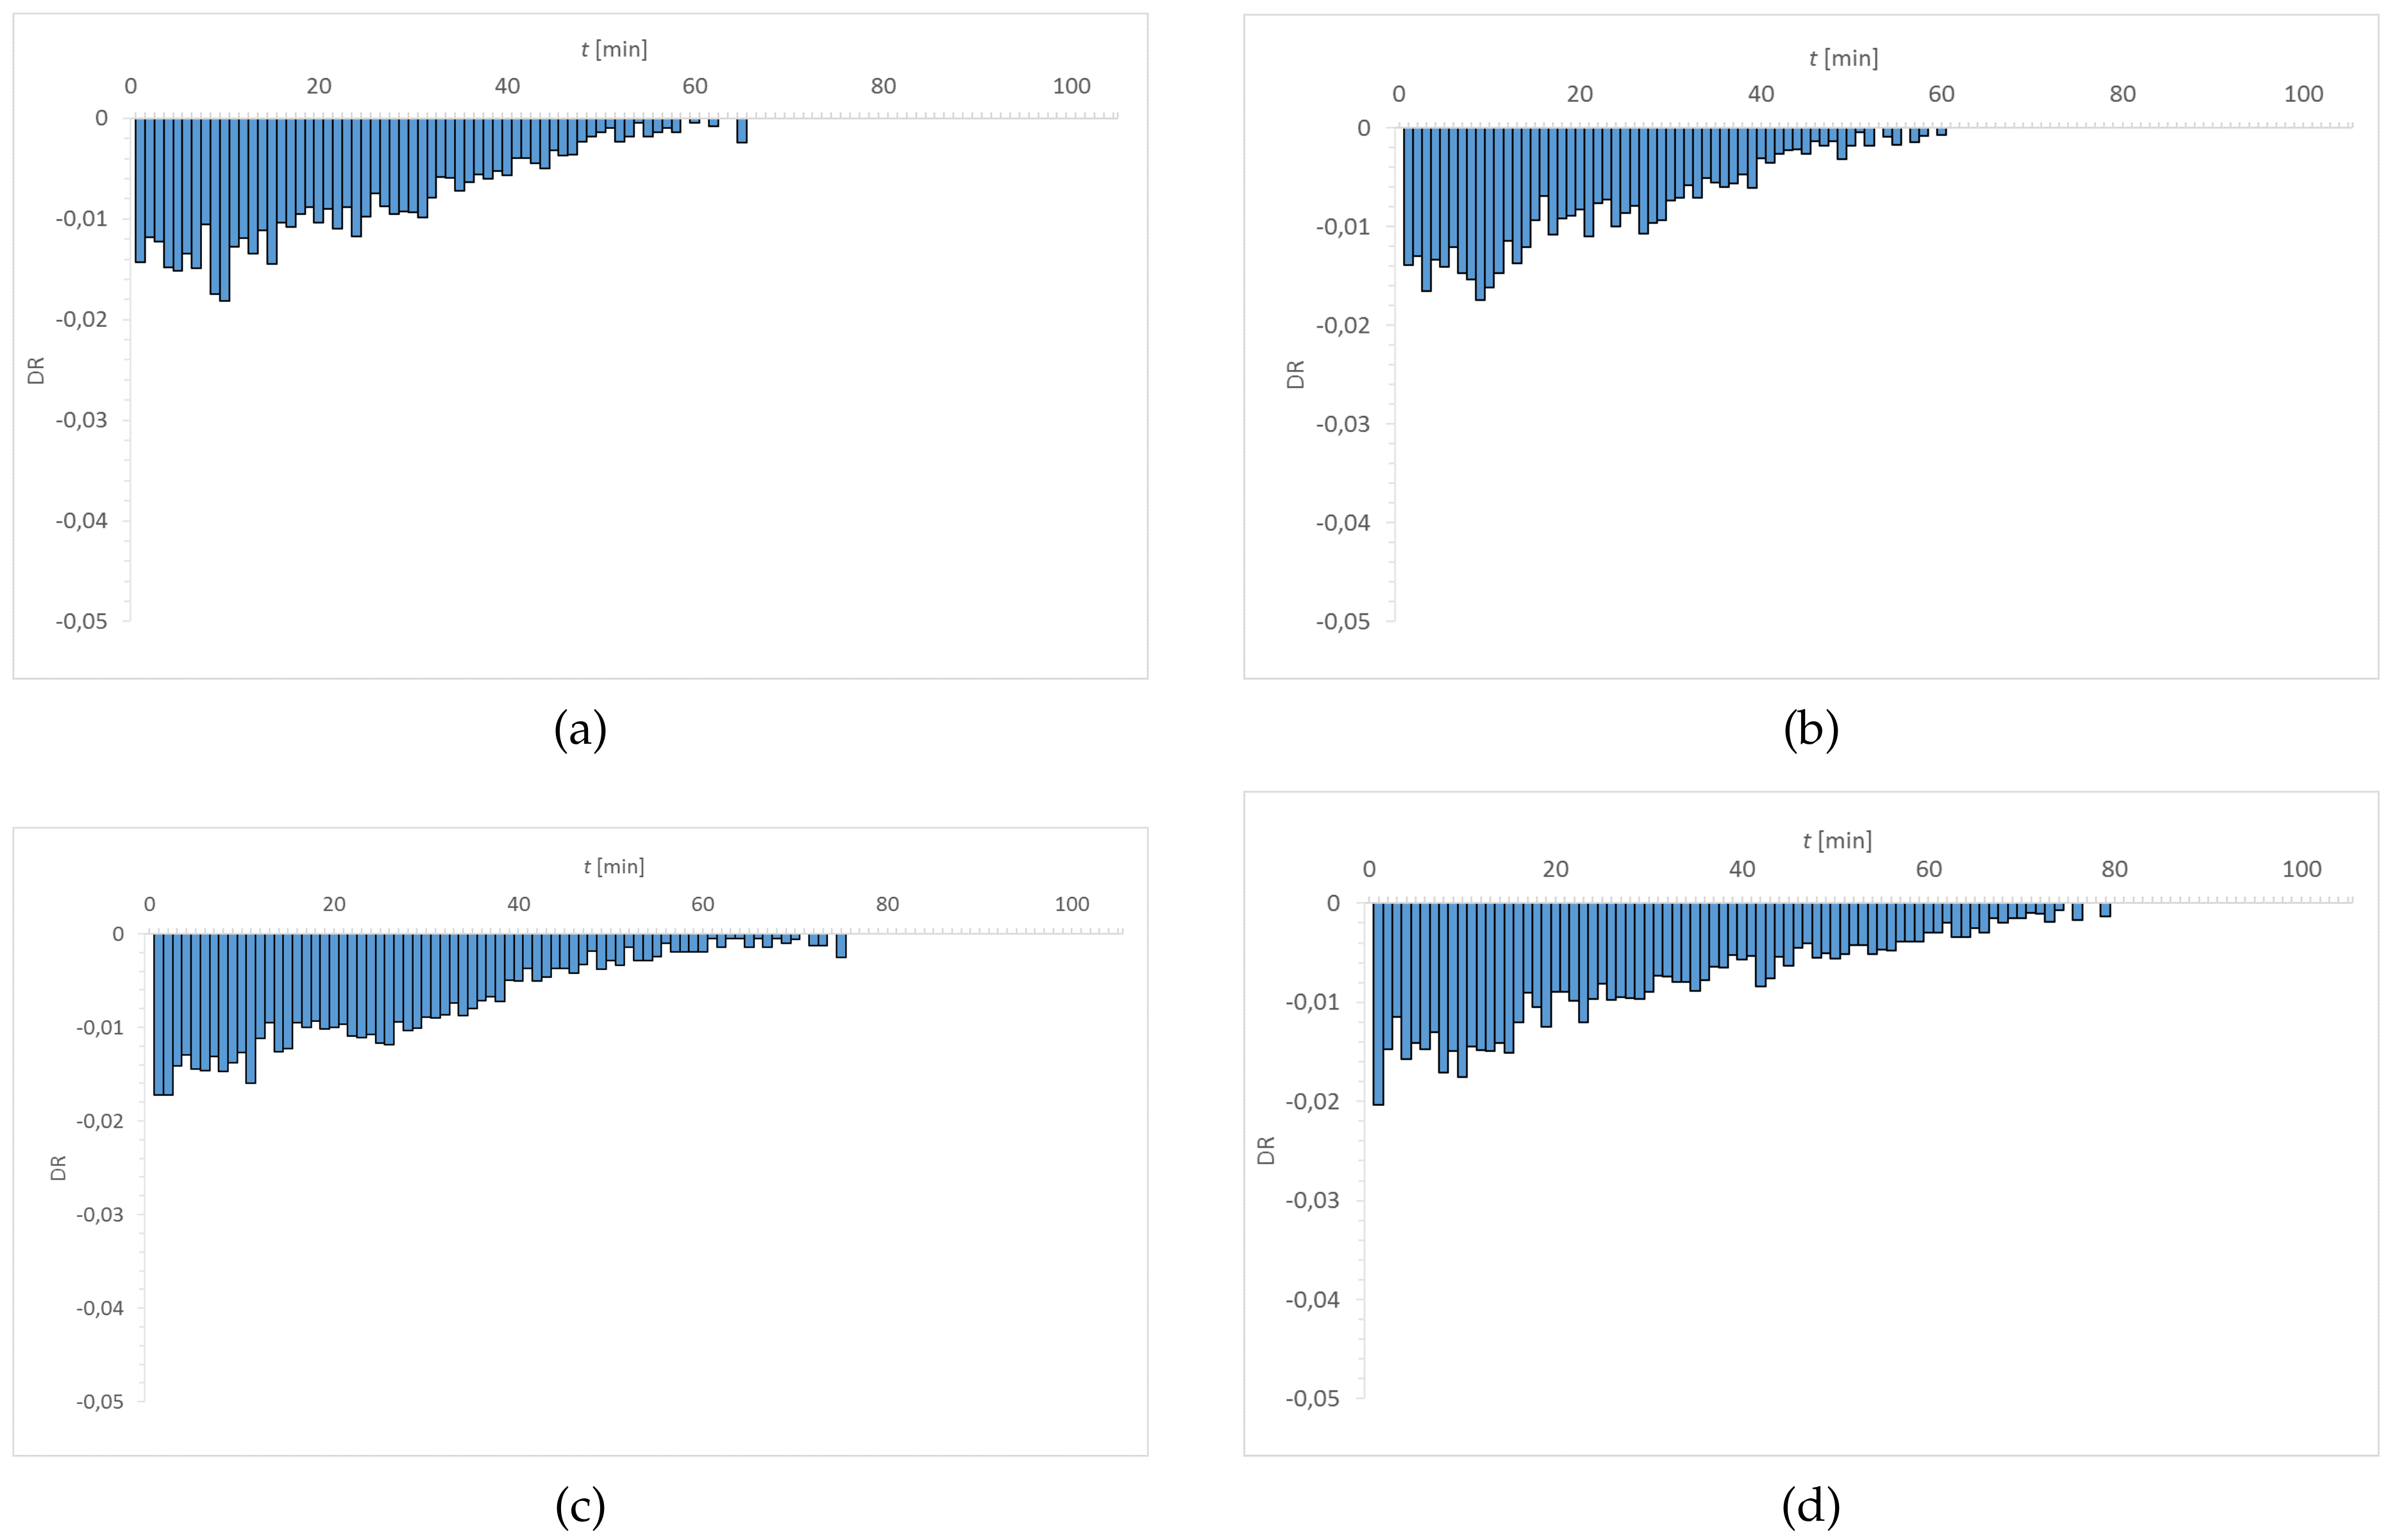
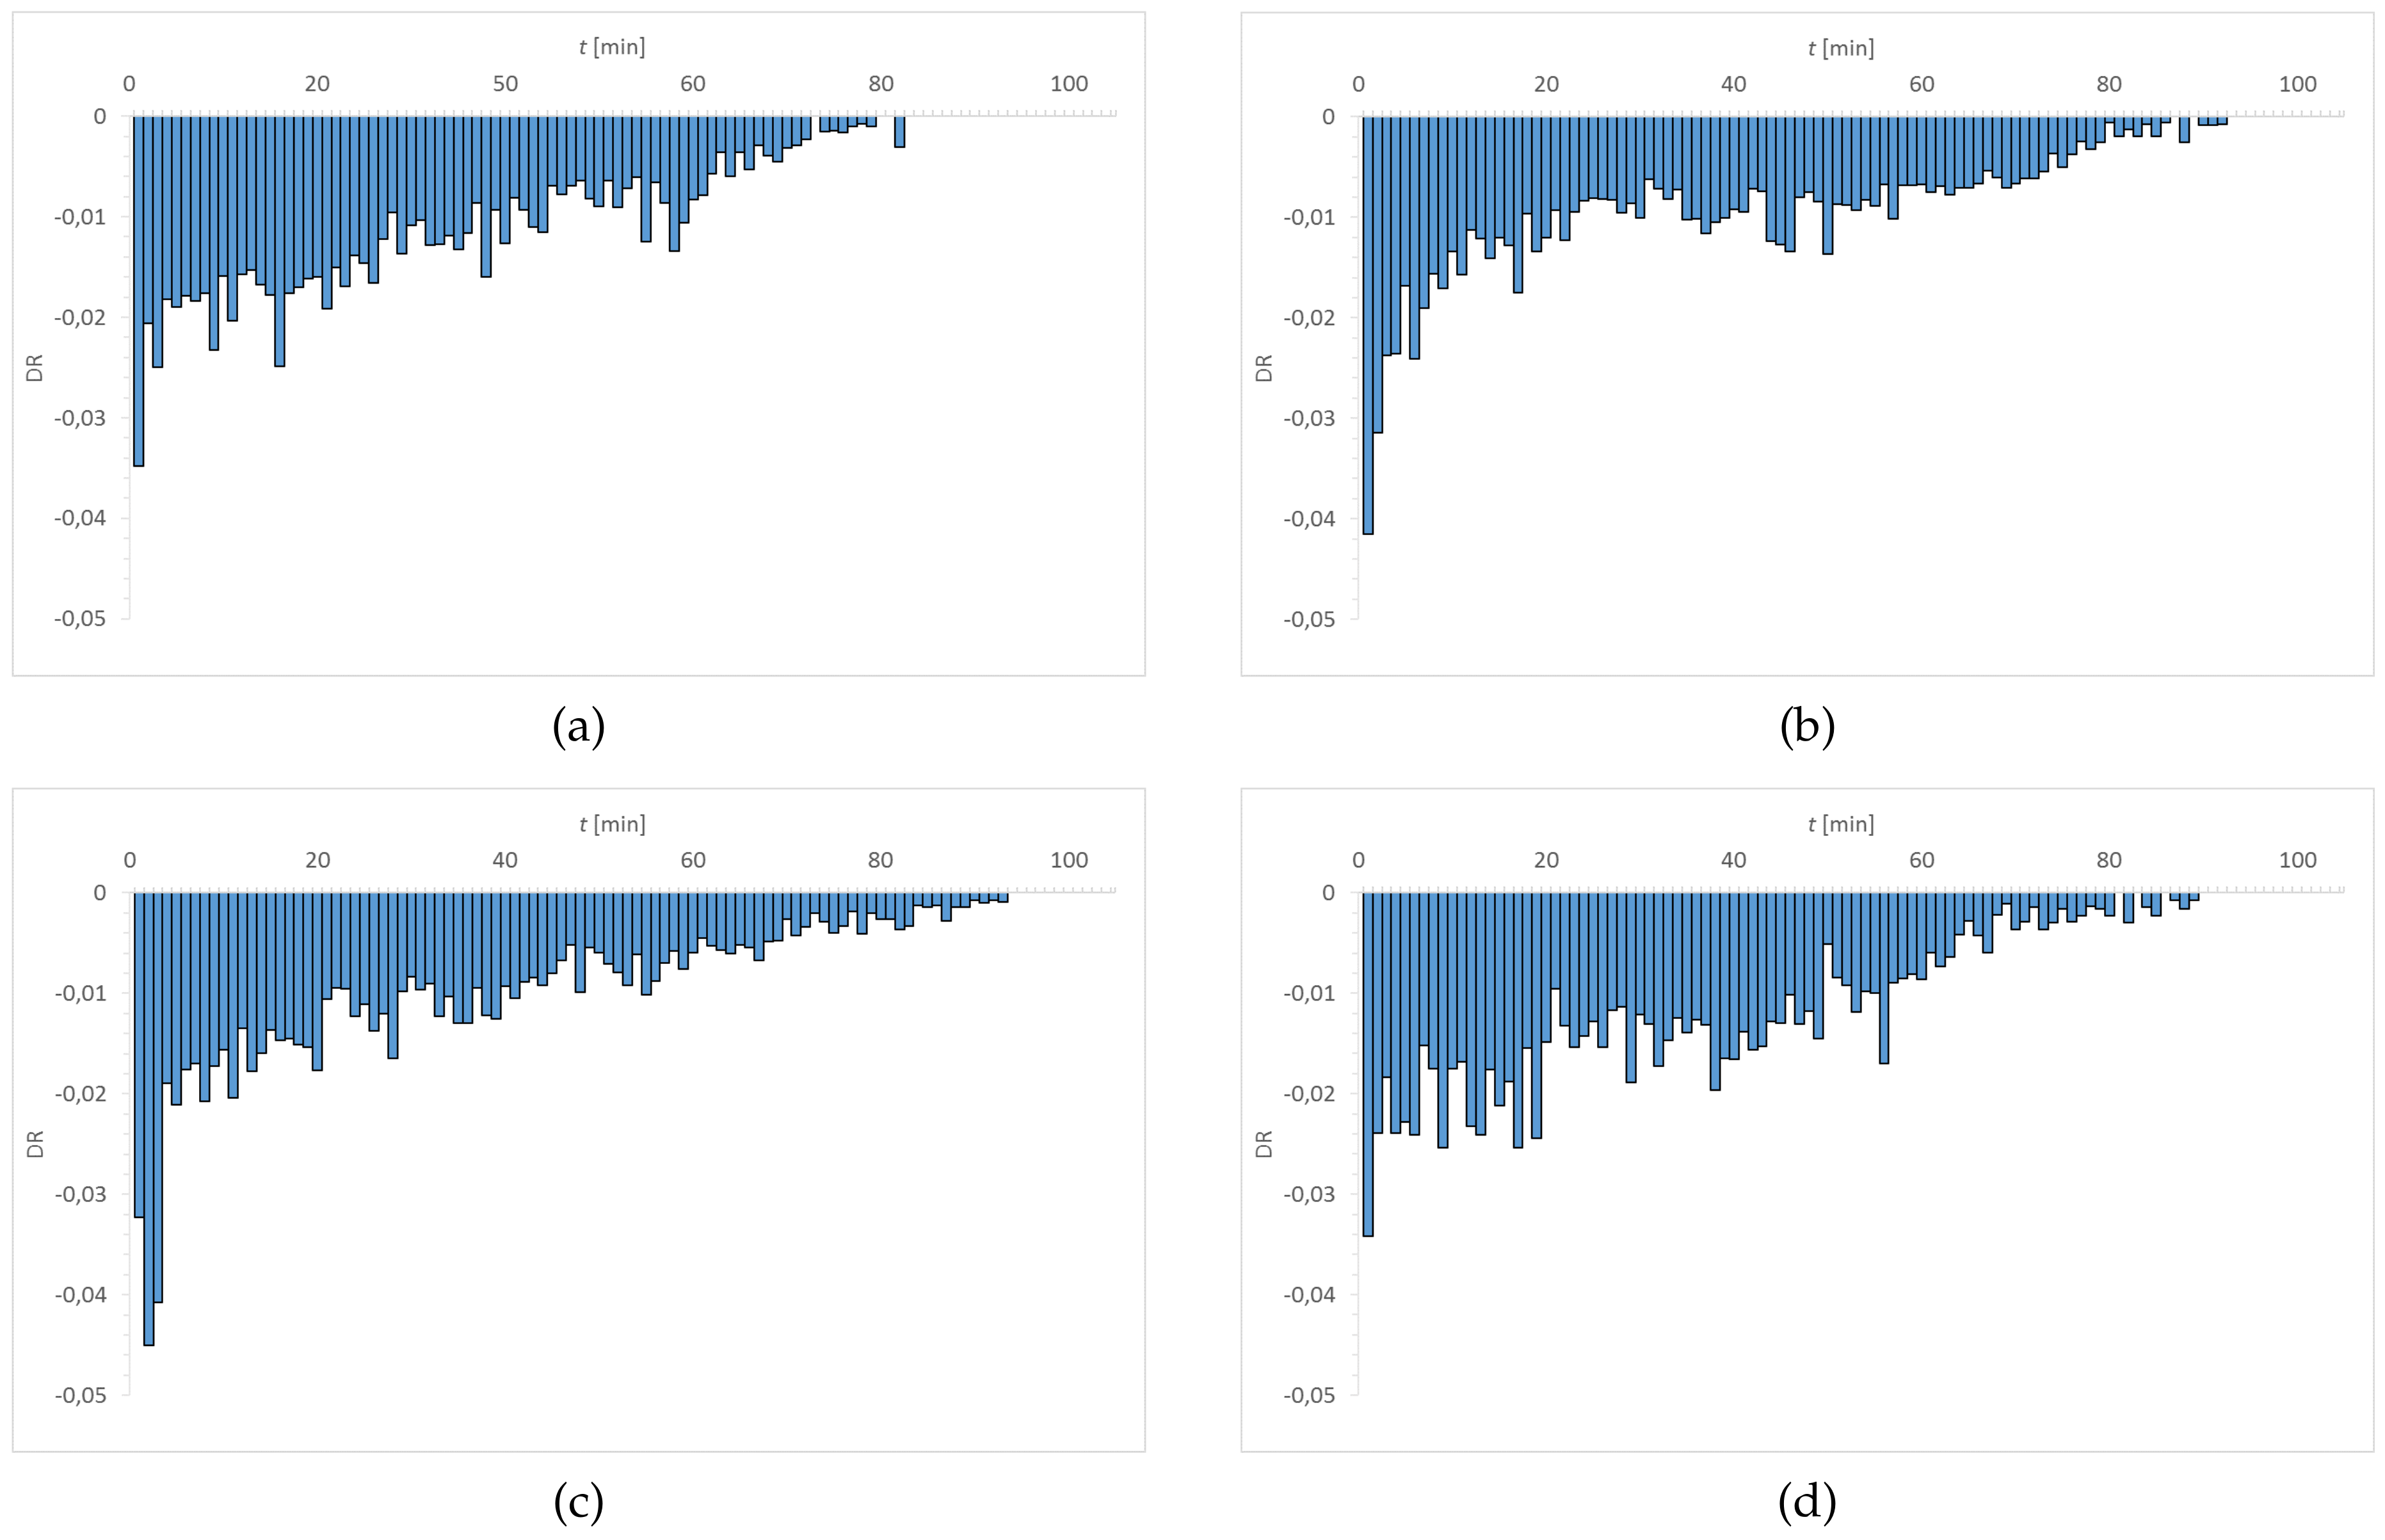
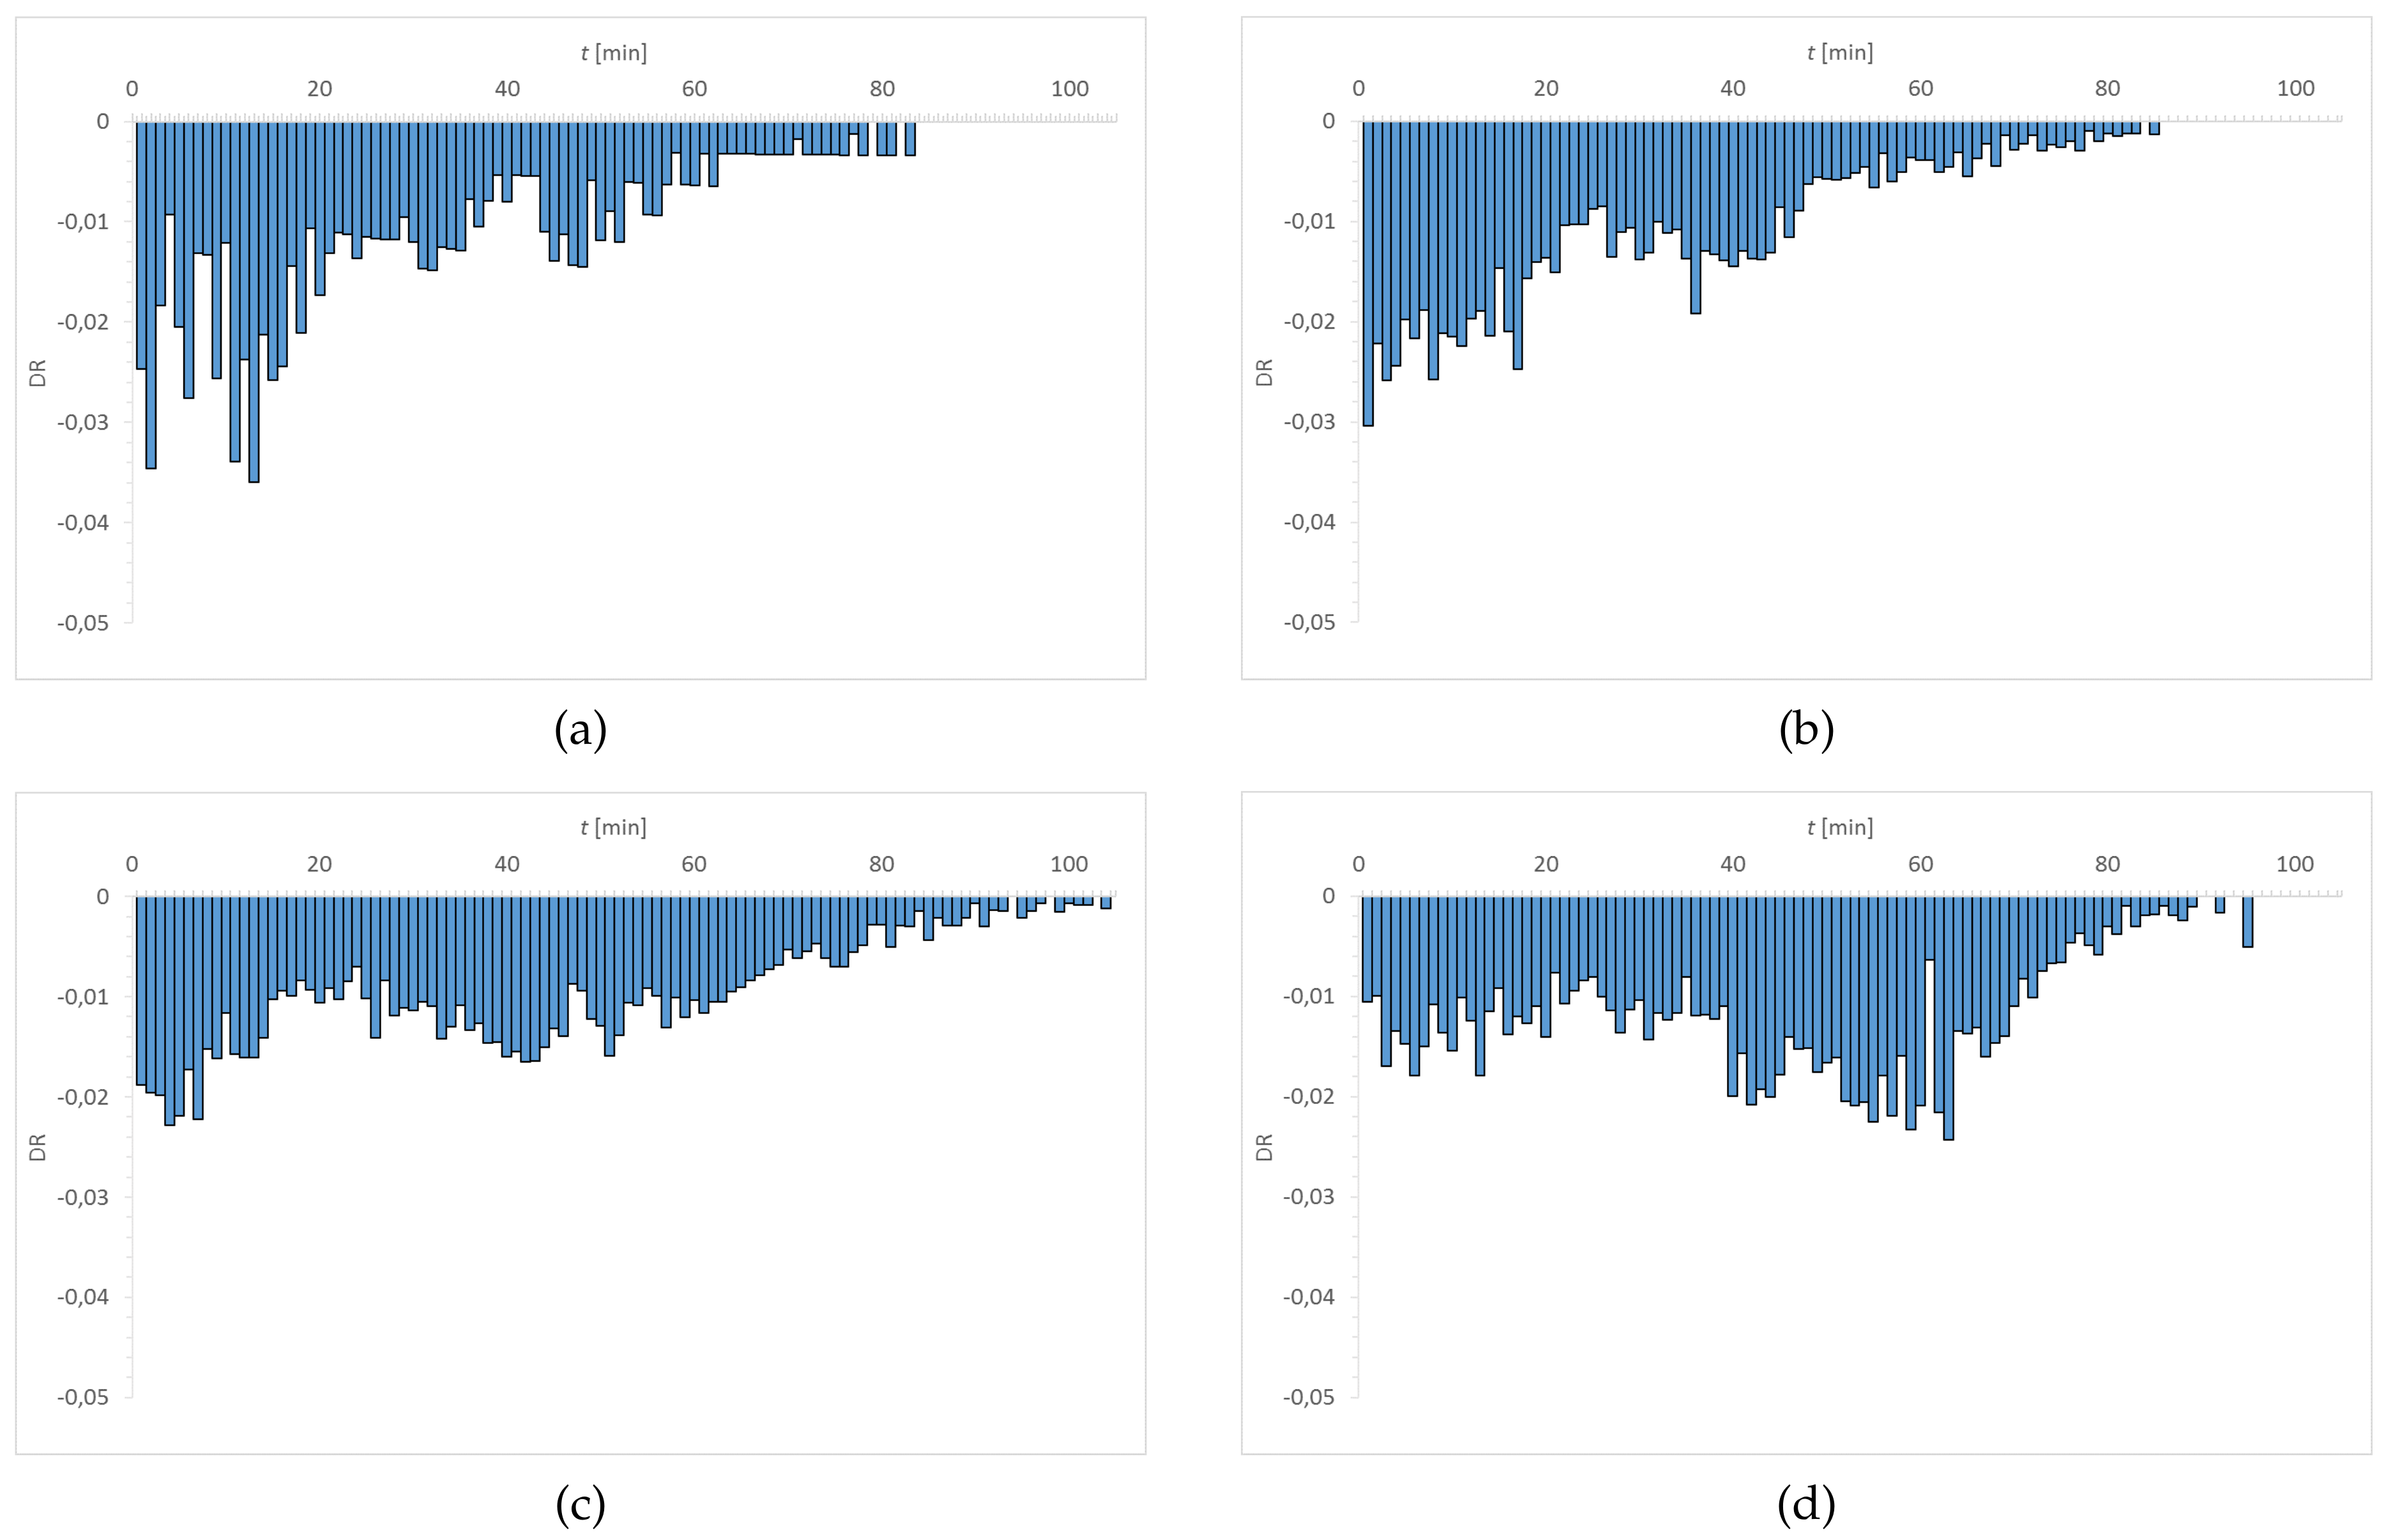
3.1. Dehydration
3.2. Wettability and Surface Free Energy (SFE)
4. Discussion
5. Conclusions
Author Contributions
Funding
Institutional Review Board Statement
Informed Consent Statement
Data Availability Statement
Conflicts of Interest
References
- Vidal-Rohr, M.; Wolffsohn, J.S.; Davies, L.N.; Cerviño, A. Effect of contact lens surface properties on comfort, tear stability and ocular physiology. Contact Lens Anterior Eye 2018, 41, 117–121. [Google Scholar] [CrossRef] [PubMed] [Green Version]
- Tranoudis, I.; Efron, N. In-eye performance of soft contact lenses made from different materials. Contact Lens Anterior Eye 2004, 27, 133–148. [Google Scholar] [CrossRef] [PubMed]
- Roba, M.; Duncan, E.G.; Hill, G.A.; Spencer, N.D.; Tosatti, S.G.P. Friction Measurements on Contact Lenses in Their Operating Environment. Tribol. Lett. 2011, 44, 387–397. [Google Scholar] [CrossRef]
- Guillon, M.; Patel, T.; Patel, K.; Gupta, R.; Maissa, C.A. Quantification of contact lens wettability after prolonged visual device use under low humidity conditions. Contact Lens Anterior Eye 2019, 42, 386–391. [Google Scholar] [CrossRef] [PubMed]
- Brygoła, R.; Sęk, S.; Sokołowski, M.; Kowalczyk-Hernández, M.; Pniewski, J. Limits in measurements of contact lens surface profile using atomic force microscopy. Colloids Surf. B Biointerfaces 2018, 165, 229–234. [Google Scholar] [CrossRef] [PubMed]
- Samsom, M.; Iwabuchi, Y.; Sheardown, H.; Schmidt, T.A. Proteoglycan 4 and hyaluronan as boundary lubricants for model contact lens hydrogels. J. Biomed. Mater. Res. B Appl. Biomater. 2018, 106, 1329–1338. [Google Scholar] [CrossRef] [PubMed]
- Yu, Y.; Macoon, R.; Chauhan, A. Improving wettability and lubricity of commercial contact lenses by polymerizing a thin film of dimethylacryamide. Colloids Surf. A Physicochem. Eng. Asp. 2019, 583, 123974. [Google Scholar] [CrossRef]
- Jones, L.; May, C.; Nazar, L.; Simpson, T. In Vitro evaluation of the dehydration characteristics of silicone hydrogel and conventional hydrogel contact lens materials. Contact Lens Anterior Eye 2002, 25, 147–156. [Google Scholar] [CrossRef]
- Rajchel, D.; Krysztofiak, K.; Szyczewski, A. Influence of sodium hyaluronate on dehydration and water distribution in soft contact lenses. Opt. Appl. 2016, 46, 483–496. [Google Scholar]
- Filipecki, J.; Sitarz, M.; Kocela, A.; Kotynia, K.; Jeleń, P.; Filipecka, K.; Gawęda, M. Studying functional properties of hydrogel and silicone–hydrogel contact lenses with PALS, MIR and Raman spectroscopy. Spectrochim. Acta A Mol. Biomol. Spectrosc. 2014, 131, 686–690. [Google Scholar] [CrossRef]
- Levitt, A.E.; Galor, A.; Chowdhury, A.R.; Felix, E.R.; Sarantopoulos, C.D.; Zhuang, G.Y.; Patin, D.; Maixner, W.; Smith, S.B.; Martin, E.R.; et al. Evidence that Dry Eye Represents a Chronic Overlapping Pain Condition. Mol. Pain 2017, 13, 1–9. [Google Scholar] [CrossRef]
- McMonnies, C.W. Could contact lens dryness discomfort symptoms sometimes have a neuropathic basis? Eye Vis. 2021, 8, 12. [Google Scholar] [CrossRef]
- Situ, P.; Simpson, T.L.; Jones, L.W.; Fonn, D. Effects of Silicone Hydrogel Contact Lens Wear on Ocular Surface Sensitivity to Tactile, Pneumatic Mechanical, and Chemical Stimulation. Investig. Ophthalmol. Vis. Sci. 2010, 51, 6111–6117. [Google Scholar] [CrossRef]
- Murphy, P.J.; Patel, S.; Marshall, J. The Effect of Long-term, Daily Contact Lens Wear on Corneal Sensitivity. Cornea 2001, 20, 264–269. [Google Scholar] [CrossRef]
- Eftimov, P.; Yokoi, N.; Peev, N.; Georgiev, G.A. Impact of Air Exposure Time on the Water Contact Angles of Daily Disposable Silicone Hydrogels. Int. J. Mol. Sci. 2019, 20, 1313. [Google Scholar] [CrossRef] [Green Version]
- Willcox, M.; Keir, N.; Maseedupally, V.; Masoudi, S.; McDermott, A.; Mobeen, R.; Purslow, C.; Santodomingo-Rubido, J.; Tavazzi, S.; Zeri, F.; et al. BCLA CLEAR—Contact lens wettability, cleaning, disinfection and interactions with tear. Contact Lens Anterior Eye 2021, 44, 157–191. [Google Scholar] [CrossRef]
- Lin, C.; Cho, H.; Yeh, Y.; Yang, M. Improvement of the surface wettability of silicone hydrogel contact lenses via layer-by-layer self-assembly technique. Colloids Surf. B Biointerfaces 2015, 136, 735–743. [Google Scholar] [CrossRef]
- Efron, N.; Morgan, P.B. Hydrogel contact lens dehydration and oxygen transmissibility. Clao J. 1999, 25, 148–151. [Google Scholar]
- Pritchard, N.; Fonn, D. Dehydration, lens movement and dryness ratings of hydrogel contact lenses. Ophthalmic Physiol. Opt. 1995, 15, 281–286. [Google Scholar] [CrossRef]
- Andrasko, G.; Schoessler, J. The effect of humidity on the dehydration of soft contact lenses on the eye. Int. Contact Lens Clin. 1980, 7, 30–33. [Google Scholar]
- Brennan, N.; Efron, N.; Bruce, A.; Duldig, D.; Russo, N. Dehydration of hydrogel lenses: Environmental influences during normal wear. Am. J. Optom. Physiol. Opt. 1988, 65, 277–281. [Google Scholar] [CrossRef] [PubMed]
- Efron, N.; Brennan, N. The clinical relevance of hydrogel lens water content. Contact Lens Anterior Eye 1987, 4, 9–14. [Google Scholar]
- Caló, E.; Khutoryanskiy, V.V. Biomedical applications of hydrogels: A review of patents and commercial products. Eur. Polym. J. 2015, 65, 252–267. [Google Scholar] [CrossRef] [Green Version]
- Brennan, N.; Efron, N. Hydrogel lens dehydration: A material dependent phenomenon? Contact Lens Forum 1987, 12, 28–29. [Google Scholar]
- Larsen, D.; Huff, J.; Holden, B. Proton NMR relaxation in hydrogel contact lenses: Correlation with in vivo lens dehydration data. Curr. Eye Res. 1990, 9, 697–706. [Google Scholar] [CrossRef]
- Benz, P.; Ors, J. New materials demand more accurate measurements of performance. Spectrum 1997, 12, 40–46. [Google Scholar]
- Andrasko, G. Hydrogel dehydration in various environments. Int. Contact Lens Clin. 1983, 10, 22–28. [Google Scholar]
- Marx, S.; Sickenberger, W. A novel In-Vitro method for assessing contact lens surface dewetting: Noninvasive keratograph dry-up time (NIK-DUT). Contact Lens Anterior Eye 2017, 40, 382–388. [Google Scholar] [CrossRef]
- Wechsler, S.; Johnson, M.; Businger, U. In Vivo hydration of hydrogel lenses—The first hour. Int. Contact Lens Clin. 1983, 10, 349–352. [Google Scholar]
- González-Méijome, J.M.; López-Alemany, A.; Almeida, J.B.; Parafita, M.A.; Refojo, M.F. Qualitative and quantitative characterization of the in vitro dehydration process of hydrogel contact lenses. Biomed. Mater. Res. B Appl. Biomater. 2007, 83, 512–526. [Google Scholar] [CrossRef] [Green Version]
- Insua Pereira, E.; Lira, M. Comfort, Ocular Dryness, and Equilibrium Water Content Changes of Daily Disposable Contact Lenses. Eye Contact Lens 2018, 44, S233–S240. [Google Scholar] [CrossRef]
- Krysztofiak, K. Badanie procesu dehydratacji w hydrożelowych i silikonowo-hydrożelowych soczewkach kontaktowych. Ph.D. Thesis, UAM, Poznań, Poland, 2015. [Google Scholar]
- Kyritsis, A.; Pissis, P.; Gómez Ribelles, J.L.; Monleón Pradas, M. Polymer-water interactions in poly(hydroxyethyl acrylate) hydrogels studied by dielectric, calorimetric and sorption isotherm measurements. Polym. Gels Netw. 1995, 3, 445–469. [Google Scholar] [CrossRef]
- Martín-Montañez, V.; López-Miguel, A.; Arroyo, C.; Mateo, M.E.; González-Méijome, J.M.; Calonge, M.; González-García, M.J. Influence of environmental factors in the in vitro dehydration of hydrogel and silicone hydrogel contact lenses. J. Biomed. Mater. Res. B Appl. Biomater. 2014, 102, 764–771. [Google Scholar] [CrossRef] [Green Version]
- Calonge, M. The treatment of dry eye. Surv. Ophthalmol. 2001, 45, 227–239. [Google Scholar] [CrossRef]
- Stahl, U.; Willcox, M.; Stapleton, F. Role of hypo-osmotic saline drops in ocular comfort during contact lens wear. Contact Lens Anterior Eye 2010, 33, 68–75. [Google Scholar] [CrossRef]
- Lapčík, L.; De Smedt, S.; Demeester, J.; Chabreček, P. Hyaluronan: Preparation, structure, properties, and applications. Chem. Rev. 1998, 98, 2663–2684. [Google Scholar] [CrossRef]
- Nashida, T.; Nakamura, M.; Mishima, H.; Otori, T. Hyaluronan stimulates corneal epithelial migration. Exp. Eye Res. 1991, 53, 753–758. [Google Scholar] [CrossRef]
- Rah, M.J. A review of hyaluronan and its ophthalmic applications. Optometry 2011, 82, 38–43. [Google Scholar] [CrossRef]
- Aragona, P.; Di Stefano, G.; Ferreri, F.; Spinella, R.; Stilo, A. Sodium hyaluronate eye drops of different osmolarity for the treatment of dry eye in Sjögren’s syndrome patients. Br. J. Ophthalmol. 2002, 86, 879–884. [Google Scholar] [CrossRef] [Green Version]
- Brjesky, V.V.; Maychuk, Y.F.; Petrayevsky, A.V.; Nagorsky, P.G. Use of preservative-free hyaluronic acid (Hylabak) for a range of patients with dry eye syndrome: Experience in Russia. Clin. Ophthalmol. 2014, 8, 1169–1177. [Google Scholar]
- Cazzaniga, G.; Ottobelli, M.; Ionescu, A.; Garcia-Godoy, F.; Brambilla, E. Surface properties of resin-based composite materials and biofilm formation: A review of the current literature. Am. J. Dent. 2015, 28, 311–320. [Google Scholar] [PubMed]
- Lam, C.N.C.; Kim, N.; Hui, D.; Kwok, D.Y.; Hair, M.L.; Neumann, A.W. The effect of liquid properties to contact angle hysteresis. Colloids Surf. A Physicochem. Eng. Asp. 2001, 189, 265–278. [Google Scholar] [CrossRef]
- Simpson, J.T.; Hunter, S.R.; Aytug, T. Superhydrophobic materials and coatings: A review. Rep. Prog. Phys. 2015, 78, 1–15. [Google Scholar] [CrossRef] [PubMed]
- Lira, M.; Silva, R. Contact lens care solutions and their influence on contact lens hydrophobicity. Contact Lens Anterior Eye 2018, 41, S14–S15. [Google Scholar] [CrossRef]
- Figura, P. Powierzchnia soczewek kontaktowych a bezpieczeństwo i komfort użytkownika. OphthaTherapy 2015, 2, 148–153. [Google Scholar]
- Giraldez, M.J.; Resua, C.G.; Lira, M.; Oliveira, M.E.; Magariños, B.; Toranzo, A.E.; Yebra-Pimentel, E. Contact lens hydrophobicity and roughness effects on bacterial adhesion. Optom. Vis. Sci. 2010, 87, E426–E431. [Google Scholar] [CrossRef]
- Yu, Y.; Hsu, K.H.; Gharami, S.; Butler, J.E.; Hazra, S.; Chauhan, A. Interfacial polymerization of a thin film on contact lenses for improving lubricity. J. Colloid Interface Sci. 2020, 1571, 356–367. [Google Scholar] [CrossRef]
- Galas, S.; Copper, L. Oxygen permeability of the pigmented material used in cosmetic daily disposable contact lenses. Clin. Ophthalmol. 2016, 10, 2469–2474. [Google Scholar] [CrossRef] [Green Version]
- Lewandowska, M.; Jasińska-Kwaśnik, W.; Jóźwik, A.; Siedlecki, D. Measurement of oxygen permeability of contact lenses based on analysis of porosity. Int. J. Eng. Sci. Technol. 2015, 3, 1–5. [Google Scholar]
- Burgos-Fernández, F.J.; Guaus, E.; Martínez, C.; Vilaseca, M. Terahertz-based system for dehydration analysis of hydrogel contact lenses. Opt. Appl. 2019, 49, 571–584. [Google Scholar] [CrossRef]
- Krysztofiak, K.; Szyczewski, A. Study of dehydration and water states in new and worn soft contact lens materials. Opt. Appl. 2014, 44, 237–250. [Google Scholar]
- Żenkiewicz, M. Methods for the calculation of surface free energy of solids. J. Achiev. Mater. Manuf. 2007, 24, 137–145. [Google Scholar]
- Owens, D.K.; Wendt, R.C. Estimation of the Surface Free Energy of Polymers. J. Appl. Polym. Sci. 1969, 13, 1741–1747. [Google Scholar] [CrossRef]
- Liber-Kneć, A.; Łagan, S. Surface Testing of Dental Biomaterials—Determination of Contact Angle and Surface Free Energy. Materials 2021, 14, 2716. [Google Scholar] [CrossRef]
- Lotfi, M.; Nejib, M.; Naceur, M. Cell adhesion to biomaterials: Concept of biocompatibility. In Advances in Biomaterials Science and Biomedical Applications; Pignatello, R., Ed.; Intech: London, UK, 2013; pp. 208–240. [Google Scholar]
- Wu, S. Calculation of Interfacial Tension in Polymer Systems. J. Polym. Sci. Part C 1971, 34, 19–30. [Google Scholar] [CrossRef]
- Hejda, F.; Solař, P.; Kousal, J. Surface Free Energy Determination by Contact Angle Measurements–A Comparison of Various Approaches. In Proceedings of the 19th Annual Conference of Doctoral Students—WDS’10; Proceedings of Contributed Papers, Part III, Prague, Czech Republic, 1–4 June 2010; Matfyzpress: Prague, Czech Republic, 2010; pp. 25–30. [Google Scholar]
- Neumann, A.W.; Good, R.J.; Hope, C.J.; Sejpol, M. An equation-of-state approach to determine surface tensions of low-energy solids from contact angles. J. Colloid Interface Sci. 1974, 49, 291–304. [Google Scholar] [CrossRef]
- Li, D.; Neumann, A.W. A reformulation of the equation of state for interfacial tensions. J. Colloid Interface Sci. 1990, 137, 304–307. [Google Scholar] [CrossRef]
- Kwok, D.Y.; Neumann, A.W. Contact angle measurement and contact angle interpretation. Adv. Colloid Interface Sci. 1999, 81, 167–249. [Google Scholar] [CrossRef]
- Lira, M.; Franco, S.; Vazquez-Dorrio, J.B.; Real Oliveira, M.E.; Costa, M.F. Surface roughness and refractive index changes in contact lens induced by lens care systems. Eye Contact Lens 2014, 40, 140–147. [Google Scholar] [CrossRef] [Green Version]
- Krysztofiak, K.; Płucisz, M.; Szyczewski, A. The influence of wearing on water states and dehydration of silicone-hydrogel contact lenses. Eng. Biomater. 2012, 15, 18–25. [Google Scholar]
- Morgan, P.B.; Efron, N. In Vivo Dehydration of Silicone Hydrogel Contact Lenses. Eye Contact Lens 2003, 29, 173–176. [Google Scholar] [CrossRef]
- Sekine, Y.; Ikeda-Fukazawa, T. Structural changes of water in a hydrogel during dehydration. J. Chem. Phys. 2009, 130, 034501. [Google Scholar] [CrossRef]
- Tranoudis, I.; Efron, N. Water properties of soft contact lens materials. Contact Lens Anterior Eye 2004, 27, 193–208. [Google Scholar] [CrossRef]
- Fornasiero, F.; Krull, F.; Radke, C.J.; Prausnitz, J.M. Diffusivity of water through a HEMA-based soft contact lens. Fluid Phase Equilibria 2005, 228–229, 269–273. [Google Scholar] [CrossRef]
- French, K. Contact lens material properties part 1—Wettability. Optician 2005, 230, 20–28. [Google Scholar]
- Alves, M.; Castanheira, E.M.S.; Lira, M. Interactions between contact lenses and lens care solutions: Influence in optical properties. Contact Lens Anterior Eye 2021, 44, 101414. [Google Scholar] [CrossRef]
- Curtin, S.; Seitz, M.; Ouyang, M.; Tomic, K.; Wiseman, M.; Vanwersch, H. Characterization of contact lenses through oxygen permeability, equilibrium water content, and silicone content. Investig. Ophthalmol. Vis. Sci. 2013, 54, 490. [Google Scholar]
- Iwashita, H.; Itokawa, T.; Suzuki, T.; Okajima, Y.; Kakisu, K.; Hori, Y. Evaluation of In Vitro Wettability of Soft Contact Lenses Using Tear Supplements. Eye Contact Lens 2021, 47, 244–248. [Google Scholar] [CrossRef] [PubMed]
- Lira, M.; Silva, R. Effect of Lens Care Systems on Silicone Hydrogel Contact Lens Hydrophobicity. Eye Contact Lens 2017, 43, 89–94. [Google Scholar] [CrossRef] [PubMed]
- Bruinsma, G.M.; Rustema-Abbing, M.; de Vries, J.; Stegenga, B.; van der Mei, H.C.; van der Linden, M.L.; Hooymans, J.M.; Busscher, H.J. Influence of wear and overwear on surface properties of etafilcon A contact lenses and adhesion of Pseudomonas aeruginosa. Investig. Ophthalmol. Vis. Sci. 2002, 43, 3646–3653. [Google Scholar]
- Tonge, S.; Jones, L.; Goodall, S.; Tighe, B. The ex vivo wettability of soft contact lenses. Curr. Eye Res. 2001, 23, 51–59. [Google Scholar] [CrossRef]
- Yamasaki, K.; Drolle, E.; Nakagawa, H.; Hisamura, R.; Ngo, W.; Jones, L. Impact of a low molecular weight hyaluronic acid derivative on contact lens wettability. Contact Lens Anterior Eye 2021, 44, 1–9. [Google Scholar] [CrossRef]
- Eftimov, P.B.; Yokoi, N.; Peev, N.; Paunski, Y.; Georgiev, G.A. Relationships between the material properties of silicone hydrogels: Desiccation, wettability and lubricity. J. Biomater. Appl. 2021, 35, 933–946. [Google Scholar] [CrossRef]
- Menzies, K.L. In Vitro Analysis of Wettability and Physical Properties of Blister Pack Solutions of Hydrogel Contact Lenses. Ph.D. Thesis, University of Waterloo, Waterloo, ON, Canada, 2010. [Google Scholar]
- Xu, L.; Siedlecki, C.A. Effects of surface wettability and contact time on protein adhesion to biomaterial surfaces. Biomaterials 2007, 28, 3273–3283. [Google Scholar] [CrossRef] [Green Version]
- Fagehi, R.; Pearce, E.I.; Oliver, K.; Abusharha, A.A.; Tomlinson, A. Care solution effects on contact lens in vivo wettability. Clin. Exp. Optom. 2017, 100, 623–632. [Google Scholar] [CrossRef] [Green Version]
- Wolffsohn, J.; Hall, L.; Mroczkowska, S.; Hunt, O.A.; Bilkhu, P.; Drew, T.; Sheppard, A. The influence of end of day silicone hydrogel daily disposable contact lens fit on ocular comfort, physiology and lens wettability. Contact Lens Anterior Eye 2015, 38, 339–344. [Google Scholar] [CrossRef] [Green Version]
- Menzies, K.L.; Jones, L. The impact of contact angle on the biocompatibility of biomaterials. Optom. Vis. Sci. 2010, 87, 387–399. [Google Scholar] [CrossRef]
- Beattie, T.K.; Tomlinson, A.; McFadyen, A.K.; Seal, D.V.; Grimason, A.M. Enhanced attachment of acanthamoeba to extended-wear silicone hydrogel contact lenses: A new risk factor for infection? Ophthalmology 2003, 110, 765–771. [Google Scholar] [CrossRef]
- Henriques, M.; Sousa, C.; Lira, M.; Elisabete, M.; Oliveira, R.; Oliveira, R.; Azeredo, J. Adhesion of Pseudomonas aeruginosa and Staphylococcus epidermidis to silicone-hydrogel contact lenses. Optom. Vis. Sci. 2005, 82, 446–450. [Google Scholar] [CrossRef] [Green Version]
- Campbell, D.; Carnell, S.M.; Eden, R.J. Applicability of Contact Angle Techniques Used in the Analysis of Contact Lenses, Part 1: Comparative methodologies. Eye Contact Lens 2013, 39, 254–262. [Google Scholar] [CrossRef]
- Lin, M.C.; Svitova, T.F. Contact lenses wettability in vitro: Effect of surface-active ingredients. Optom. Vis. Sci. 2010, 87, 440–447. [Google Scholar] [CrossRef] [PubMed] [Green Version]


| Material | EWC [%] | Oxygen Permeability [Dk/t] | FDA Group | Chemical Composition |
|---|---|---|---|---|
| Etafilcon A | 58 | 23.8–28 | IV | HEMA, MAA, EGDMA, TMPTMA, PVP |
| Omafilcon A | 60 | 37 | II | HEMA, PC |
| Narafilcon A | 46 | 118 | V | HEMA, mPDMS, DMA, TEGDMA, PVP, siloxane monomer |
| Senofilcon A | 38 | 103–147 | I | mPDMS, DMA, HEMA, siloxane macromere, PVP, TEGDMA |
| Measuring Liquid | |||
|---|---|---|---|
| Distilled water | 72.8 | 21.8 | 51.0 |
| Diiodomethane | 50.8 | 50.8 | 0.0 |
| Material | Contact Angle () | |||
|---|---|---|---|---|
| Initial State | After Incubation | |||
| in CLS | in CLS & ED | in ED | ||
| Etafilcon A | 40.3 ± 6.9 | 44.8 ± 5.6 | 40.6 ± 3.2 | - |
| Omafilcon A | 43.7 ± 7.0 | 46.7 ± 9.3 | 45.3 ± 6.9 | - |
| Narafilcon A | 72.2 ± 9.7 | 73.8 ± 5.9 | 75.9 ± 5.3 | - |
| Senofilcon A | 76.3 ± 8.1 | 78.6 ± 5.6 | 81.6 ± 8.9 | - |
| Material | Environment | Owens-Wendt | ||
|---|---|---|---|---|
| Etafilcon A | Initial state | 26.35 ± 4.73 | 31.74 ± 5.42 | 58.09 ± 4.86 |
| CLS | 25.13 ± 4.09 | 29.68 ± 4.48 | 54.81 ± 4.12 | |
| CLS & ED | 26.63 ± 3.37 | 31.35 ± 3.26 | 57.98 ± 2.22 | |
| ED | 21.20 ± 3.11 | - | - | |
| Omafilcon A | Initial state | 28.03 ± 5.21 | 28.29 ± 5.36 | 56.32 ± 4.86 |
| CLS | 26.77 ± 5.28 | 27.68 ± 7.35 | 54.45 ± 6.56 | |
| CLS & ED | 28.93 ± 4.89 | 27.02 ± 5.85 | 55.95 ± 4.79 | |
| ED | 22.59 ± 3.89 | - | - | |
| Narafilcon A | Initial state | 21.37 ± 5.43 | 13.96 ± 5.85 | 35.33 ± 6.56 |
| CLS | 22.59 ± 3.57 | 12.03 ± 3.81 | 34.62 ± 3.55 | |
| CLS & ED | 21.72 ± 3.65 | 11.14 ± 3.59 | 32.86 ± 3.47 | |
| ED | 19.77 ± 4.42 | - | - | |
| Senofilcon A | Initial state | 23.55 ± 5.67 | 10.49 ± 5.08 | 34.04 ± 5.65 |
| CLS | 25.69 ± 3.70 | 8.07 ± 2.95 | 33.75 ± 3.78 | |
| CLS & ED | 26.58 ± 4.76 | 6.81 ± 4.27 | 33.39 ± 5.13 | |
| ED | 21.41 ± 4.26 | - | - | |
| Material | Environment | Wu | Neumann | Neumann–Kwok | ||
|---|---|---|---|---|---|---|
| Etafilcon A | Initial state | 28.61 ± 4.03 | 32.22 ± 4.16 | 60.83 ± 4.50 | 59.10 ± 3.74 | 58.80 ± 3.85 |
| CLS | 27.57 ± 3.48 | 30.26 ± 3.41 | 57.83 ± 3.80 | 56.69 ± 3.15 | 56.33 ± 3.24 | |
| CLS & ED | 28.84 ± 2.87 | 31.91 ± 2.31 | 60.75 ± 2.19 | 59.00 ± 1.73 | 58.71 ± 1.78 | |
| ED | 24.24 ± 2.64 | - | - | - | - | |
| Omafilcon A | Initial state | 30.05 ± 4.47 | 29.59 ± 4.07 | 59.64 ± 4.60 | 57.11 ± 3.80 | 56.76 ± 3.91 |
| CLS | 28.98 ± 4.51 | 28.87 ± 5.79 | 57.85 ± 5.81 | 55.78 ± 5.45 | 55.40 ± 5.60 | |
| CLS & ED | 30.82 ± 4.21 | 28.67 ± 4.47 | 59.49 ± 4.38 | 56.49 ± 4.08 | 56.12 ± 4.19 | |
| ED | 25.41 ± 3.30 | - | - | - | - | |
| Narafilcon A | Initial state | 24.37 ± 4.62 | 16.57 ± 4.99 | 40.94 ± 6.03 | 40.32 ± 5.98 | 39.72 ± 5.94 |
| CLS | 25.41 ± 3.04 | 15.13 ± 3.24 | 40.54 ± 3.29 | 39.37 ± 3.66 | 38.74 ± 3.62 | |
| CLS & ED | 24.67 ± 3.11 | 14.28 ± 3.00 | 38.95 ± 3.20 | 38.01 ± 3.31 | 37.38 ± 3.28 | |
| ED | 23.02 ± 3.76 | - | - | - | - | |
| Senofilcon A | Initial state | 26.22 ± 4.82 | 13.78 ± 4.32 | 40.00 ± 5.27 | 37.80 ± 5.01 | 37.20 ± 4.97 |
| CLS | 28.04 ± 3.14 | 11.86 ± 2.73 | 39.90 ± 3.61 | 36.33 ± 3.50 | 35.73 ± 3.45 | |
| CLS & ED | 28.81 ± 4.06 | 10.44 ± 4.22 | 39.25 ± 5.01 | 34.47 ± 5.55 | 33.92 ± 5.44 | |
| ED | 24.41 ± 3.61 | - | - | - | - | |
Publisher’s Note: MDPI stays neutral with regard to jurisdictional claims in published maps and institutional affiliations. |
© 2022 by the authors. Licensee MDPI, Basel, Switzerland. This article is an open access article distributed under the terms and conditions of the Creative Commons Attribution (CC BY) license (https://creativecommons.org/licenses/by/4.0/).
Share and Cite
Chwalik-Pilszyk, G.; Wiśniewska, A. Influence of Selected Ophthalmic Fluids on the Wettability and Hydration of Hydrogel and Silicone Hydrogel Contact Lenses—In Vitro Study. Materials 2022, 15, 930. https://doi.org/10.3390/ma15030930
Chwalik-Pilszyk G, Wiśniewska A. Influence of Selected Ophthalmic Fluids on the Wettability and Hydration of Hydrogel and Silicone Hydrogel Contact Lenses—In Vitro Study. Materials. 2022; 15(3):930. https://doi.org/10.3390/ma15030930
Chicago/Turabian StyleChwalik-Pilszyk, Gabriela, and Anna Wiśniewska. 2022. "Influence of Selected Ophthalmic Fluids on the Wettability and Hydration of Hydrogel and Silicone Hydrogel Contact Lenses—In Vitro Study" Materials 15, no. 3: 930. https://doi.org/10.3390/ma15030930
APA StyleChwalik-Pilszyk, G., & Wiśniewska, A. (2022). Influence of Selected Ophthalmic Fluids on the Wettability and Hydration of Hydrogel and Silicone Hydrogel Contact Lenses—In Vitro Study. Materials, 15(3), 930. https://doi.org/10.3390/ma15030930