Article

Increasing Impact Strength of a Short Glass Fiber Compression Molded BMC by Shortening Fibers without Change in Equipment

by
Michael C. Faudree
1,*,
Yoshitake Nishi
2,3 and
Michelle Salvia
4
1
Faculty of Liberal Arts and Science, Tokyo City University, Yokohama-shi 224-8551, Japan
2
Graduate School of Engineering, Tokai University, Hiratsuka-shi 259-1292, Japan
3
Kanagawa Institute of Industrial Science and Technology (KISTEC), Ebina-shi 243-0435, Japan
4
Ecole Centrale de Lyon, Ecully, CEDEX, 69134 Lyon, France
*
Author to whom correspondence should be addressed.
Materials 2022, 15(3), 1145; https://doi.org/10.3390/ma15031145
Submission received: 17 October 2021 / Revised: 24 January 2022 / Accepted: 25 January 2022 / Published: 1 February 2022
(This article belongs to the Special Issue Organic Matrix Composites and Multifunctional Materials)

Abstract

:
Bird strike, volcanic rock, hailstones, micrometeoroids, or space debris can cause damage to aircraft and space vehicles, therefore their composite materials must have high impact resistance to maximize safety. In a 55% wt. CaCO3 compression molded short glass fiber polyester GFRP-BMC (bulk molded compound), shortening the nominal 6.4 mm fiber length formulation, by 30 min extended mixing, to 0.44 mm was found to increase Charpy impact values, auc, without a change in the compression molding equipment. Specimens were cut from square panels in a spiral configuration in conformity with ASTM D 6110-02 for orthotropic panels, the flow direction approximately radially outward from the charge. At a median-fracture probability of Pf = 0.50, extended mixing improved auc by 29%, from 7.43 to 9.59 kJm−2, and for each solidification texture angle, namely, 0 to 90 (random), 71, 45 and 18 deg, the auc increased by 25% (6.26 to 7.86 kJm−2), 18% (9.36 to 11.07 kJm−2), 35% (7.68 to 10.37 kJm−2), and 20% (6.96 to 8.36 kJm−2), respectively. This strengthening can be explained by an increased number of thermal compressive stress sites between the glass fiber and matrix due to a difference in the coefficient of thermal expansion (CTE) during cool-down, and shrinkage, with an increased number of spaces between fibers, |Sf| from 217 to approximately 2950 per mm3, enhancing impact energy.

1. Introduction

Bulk molded compounds (BMCs) are utilized for non-heavy load bearing parts, having advantages over metals in being lightweight, lowering fuel consumption for aircraft and other vehicles to reduce CO2 emissions, and are also corrosion resistant. BMCs typically contain ~5 to 30 wt.% fiber and are highly filled [1,2,3,4,5,6,7,8,9,10]. Glass fiber reinforced polymer GFRP-BMCs contain ~5 to 30 mass% chopped fiber about 3 to 13 mm in length [1,3,7], and are highly filled with CaCO3 powder ranging from ~35 to over 50 mass% [7,8], while other fillers can include TiO2, Al2O3, SiC, Mg(OH)2, ZnO, [9] fumed silica [10], fly ash [5], or waste thermosetting BMC [2], to name a few [1,2,3,4,5,6,7,8,9,10].
Previously, unexpected findings for FRP composites, namely that of polyester with styrene-butadiene copolymer reinforced with glass fibers and CaCO3 filler, were reported where the tensile modulus could be increased by 5 to 25% [8] along with fracture strength, and its strain increased ~60 and ~40% [7], by decreasing mean fiber length from the commercial 6.4 mm (1/4 in) to 0.44 mm via 30 min of extended mixing of paste prior to injection molding, without a change in the injection molding equipment. This was a new finding not observed prior, because most of the literature concerns 2-phase fiber and polymer composites whose mechanical properties, such as impact strength, tensile stress and strain, increase with increasing fiber length [11,12,13,14,15,16,17], and longer fibers are reported as desired [18]. However, the GFRP-BMC is a 3-phase filler, fiber and polymer system in which the CaCO3 filler particles appear to play a role in strengthening the composite when shortening the fiber length below that of commercial length [7,8]. Therefore, this study presents new experimental results that impact strength and can be increased by a 30 min extended mixing in the GFRP-BMC.
The strengthening method is congruent to earlier studies [7,8] of 30 min extended mixture of commercial 6.4 mm fiber length GFRP-BMC paste to shorten glass fibers to 0.44 mm, prior to injection molding [7]. Nominal fiber length of 6.4 mm was chosen since it was commercially available, whereas the 0.44 mm length was produced by 30 min of mixing [2]. The 0.44 mm fiber length was determined by measuring several hundred fibers of polished masticated samples by SEM, showing a mean fiber length of 0.44 mm (standard deviation = ± 0.203 mm) [1,7]. Generally, two standard deviations equal about 95% of the population (0.04 mm < lfiber < 0.85 mm), representing a wide distribution from the extended mixing, yet significantly less than 6.4 mm [1,7], and below the reported critical fiber length for GFRPs of ~1.0 mm (0.56–0.59 mm for nylon GFRP; 1.4 mm for polypropylene (PP) GFRP; and 0.68 to 0.84 mm for polybutylene terephthalate (PBI) GFRP) [14]; however these critical lengths are for 2-phase systems [14,15] and would depend on the strength of the coupling. Nevertheless, the glass fibers have a strong coupling agent to adhere to the polymer component in the GFRP-BMC. Therefore, mean fiber lengths of the 6.4 and 0.44 mm data sets are considered to have enough variance for the results to be reliable [7,8]. With a 30 min extended mix, it is assumed, in the compression molded samples, that fiber length is reduced to approximately 0.44 mm. The CaCO3 filler (<1 to ~7 μm) is reported to be unaffected by 30 min extended mixing [2].
The polymers used in the formulation are thermoset polyester, with styrene-butadiene, as illustrated in Figure 1.
To provide background, fiber length studies on polymer composites appear to be predominantly limited to 2-phase fiber and polymer systems, where mechanical properties are reduced with shortened fibers [11,12,13,14,15,16,17,19,20]. In a study of polypropylene GFRP at a fiber weight percent between 3 and 60%, varying fiber length from 0.1 to 50 mm showed that stiffness was reduced at fiber lengths under 0.5 mm, and was nearly unaffected above 0.5 mm [11]. High weight percentages above 40% were reported to cause fiber packing problems, with an increase in void formation reducing the modulus [11]. It was also reported for polypropylene GFRP, that impact properties were raised as fiber length was increased to 6.4 mm, while a strain energy model predicted 8 mm as the optimal fiber length [13]. For short carbon fiber polypropylene CFRP, Izod impact, Rockwell hardness, tensile strength and modulus, and flexural strength and modulus values were lowered as fiber lengths were shortened: 10 → 5 → 2 → 1 → 0.5 mm [17]. Similarly, Capela et al. found in compression molded CFRP with Biresin®CR120 resin, for higher Vf of 60 wt.% carbon fibers, the optimum fiber length for tensile properties was 4 mm. Stiffness and tensile strength increased by increasing fiber length from 2 mm to 4 mm, but then decreased for 6.4 mm fibers. The decrease was attributed to poor fiber dispersion, and disorder within the matrix with the longer fibers [19].
In addition, a trend of decreasing mechanical properties with shorter fiber length has been found for green composites (2-phase). In hemp fiber reinforced thermoplastic polyurethane, increasing the fiber length from 6 to an optimum of 15 mm increased tensile strength from 16 to 27 MPa, while a further increase to 40 mm resulted in little change [20].
Because assessing the effect of fiber length can be difficult, many studies on 2-phase GFRP systems have utilized numerical modelling to characterize the increase in mechanical properties as fibers are lengthened, predicting that shortening fibers below the critical length of ~1.0 mm greatly reduces mechanical properties [14,15].
Conversely, we demonstrate a new result not previously reported in the literature, that for the highly-filled 3-phase GFRP-BMC, impact values can be increased by shortening fibers below 1.0 mm. The strengthening mechanism is similar to ceramics, cemented carbide composites, and metal matrix composites (MMC), in that strength is increased by decreasing the particle size [21,22,23]. For instance, in WC-Ni cemented carbide composites, strength was increased for 0.5 μm particles above the coarser 1.7 μm particles [21]. In Al2O3 dispersed ceramics, the smaller 16 μm diameter particle size raised fracture stress 30% above 41 μm diameter particle size [22]. The enhancements were attributed to the difference in the proliferation of residual stress sites by CTE (coefficient of thermal expansion) between particles and matrix, as particle size was reduced. Reported SEM observations for injection molded polyester GFRP-BMC showed CaCO3 filler particles to be <1 to 7 μm [8], about the same size as reported for ceramics, namely, from <1 μm to several microns [21,22,23].
As for the effect of percent filler on BMC, few studies were found. One study was performed with polymer mixed with a filler of waste thermosetting BMC (filler, glass fiber and polymer) crushed into a powder, where filler amounts of 0 → 30 → 40 → 50 → 60 wt.% resulted in fairly low impact values of 4.91 → 1.76 → 1.69 → 1.73 → and 1.93 kJm−2, respectively [2]. Shore D hardness was virtually unchanged at ~66 oSh D [2]. Loss of properties were attributed to poor adhesion between filler and matrix. Since our study focuses on fiber length, the effect of percent filler will not be covered here.
For 3-phase GFRP-BMCs, decreasing mechanical properties with decreasing fiber length has been reported [3]. In a highly filled 50 wt.% CaCO3 GFRP-BMC with ~30 wt.% polymers and 16.7 wt.% glass fibers, bending strength and modulus were reported to decrease with glass fiber length. For 12.7 → 6.4 → 3.2 mm (1/2 → 1/4 → 1/8 in) fibers, bending strength decreased: 115 → 81 → 53 MPa, along with bending moduli: 13.4 → 12.3 → 11.5 GPa [3]. This indicates that choice of binder and other additives are important for good adhesion of matrix with filler and fibers in GFRP-BMCs.
In our study, the CTE of cured polyester resin matrix (55 to 100 × 10−6/K) [24] is approximately ten times higher than E-glass fibers (5.4 × 10⁻⁶/K) [25], hence, when the panels are cooled, the matrix will volumetrically contract onto the fibers more than the fibers contract themselves, creating compressive residual stresses onto the fibers. It follows that shorter fiber length creates a higher number of spaces between fibers (Sf,) [8] allowing increased sites for action of CTE difference to collectively stiffen the composite, thereby raising impact strength.
In fact, tensile tests of GFRP-BMC showed that shortening glass fibers: 6.4 → 3.2 → 0.44 mm increased stiffness in the form of initial tensile modulus (dσ/dε)o (strain, ε = 0 to 0.05%) with decreasing fiber length of 6.19 → 7.18 → 7.86 GPa [8]. Maximum moduli (dσ/dε)max between the zero point and Δε = 0.4% were also increased: 7.50 → 8.86 → 9.54 GPa for the 6.4 → 3.2 → and 0.44 mm samples, respectively. In sum, shorter 0.44 mm samples exhibited a 27% and 40% increase in (dσ/dε)o and (dσ/dε)max, respectively, over those of commercial 6.4 mm [8]. An increase in modulus with lowering fiber length was attributed to increasing spaces between fibers acting with a CTE difference as mentioned above [8]. Interestingly, the 0.44 mm samples appeared to show evidence of slight strain hardening during early tensile deformation. Although an earlier study of the data showed little change in modulus with decreasing fiber length [7], when analyzed in more detail at strain increments Δε = 0.00734%, the increase was found [8].
As for higher deformations with increasing damage, tensile stress–strain curves of the GFRP-BMC exhibited ~60 and −40% increase in tensile fracture stress and strain, respectively, by shortening fibers from a commercial length of 6.4 mm, to 0.44 mm [7]. Acoustic emission (AE) detected three times the number of cracks, while scanning electron microscopy (SEM) showed increased fiber debonding at fiber ends and along fiber lengths in the 0.44 mm samples compared with the 6.4 mm sample. Increases in tensile properties were attributed to strain fields from the fiber debonding proliferating expansion sites, which have been found to halt cracks before their critical length is reached [7]. However, damage from impact occurs much faster than tensile tests, therefore, it would seem the cracking dynamics of sudden impact would differ from that of tensile. It follows that the stress–strain curves showed a higher modulus at all strains throughout tensile deformation up to fracture [7], therefore, an increase in impact resistance seems mostly due to increased stiffness, and less to expansion around fibers caused by debonding. Moreover, since the impact tip hitting the specimen is a straight line across the specimen thickness, a higher number of fibers would be directly impacted in the higher-dispersed 0.44 mm samples, in which hardness is more evenly distributed. Therefore, the main mechanism of increasing impact resistance in the GFRP-BMC by 30 min of extended mixing appears be from an increase in stiffness throughout the impact process.
Unlike 2-phase fiber and polymer systems, within the matrix itself, the third phase of CaCO3 particles evidently assists in strengthening [8]. Particles well-dispersed and at short distances from each other can be advantageous in maximizing residual thermal stresses [26] leading to the design of stronger BMC composites. Within spaces between fibers, Sf, the filler and polymer sub-system undergoes compressive stresses as a whole, the resin shrinking around CaCO3 filler and fibers, with higher and more dispersed force than 2-phase fiber and polymer systems, increasing—not decreasing—mechanical properties as fiber length is decreased.
To the knowledge of the authors, increasing the impact strength of GFRP-BMC by shortening fibers has not yet been reported. Therefore, the goal is to demonstrate that Charpy impact values can be increased in compression-molded short-fiber GFRP-BMC panels containing a high percentage (55 mass%) of CaCO3 filler, by shortening fibers from a commercial length of 6.4 mm to 0.44 mm, by 30 min extended mixing prior to molding, without changing the compression molding equipment.

2. Materials and Methods

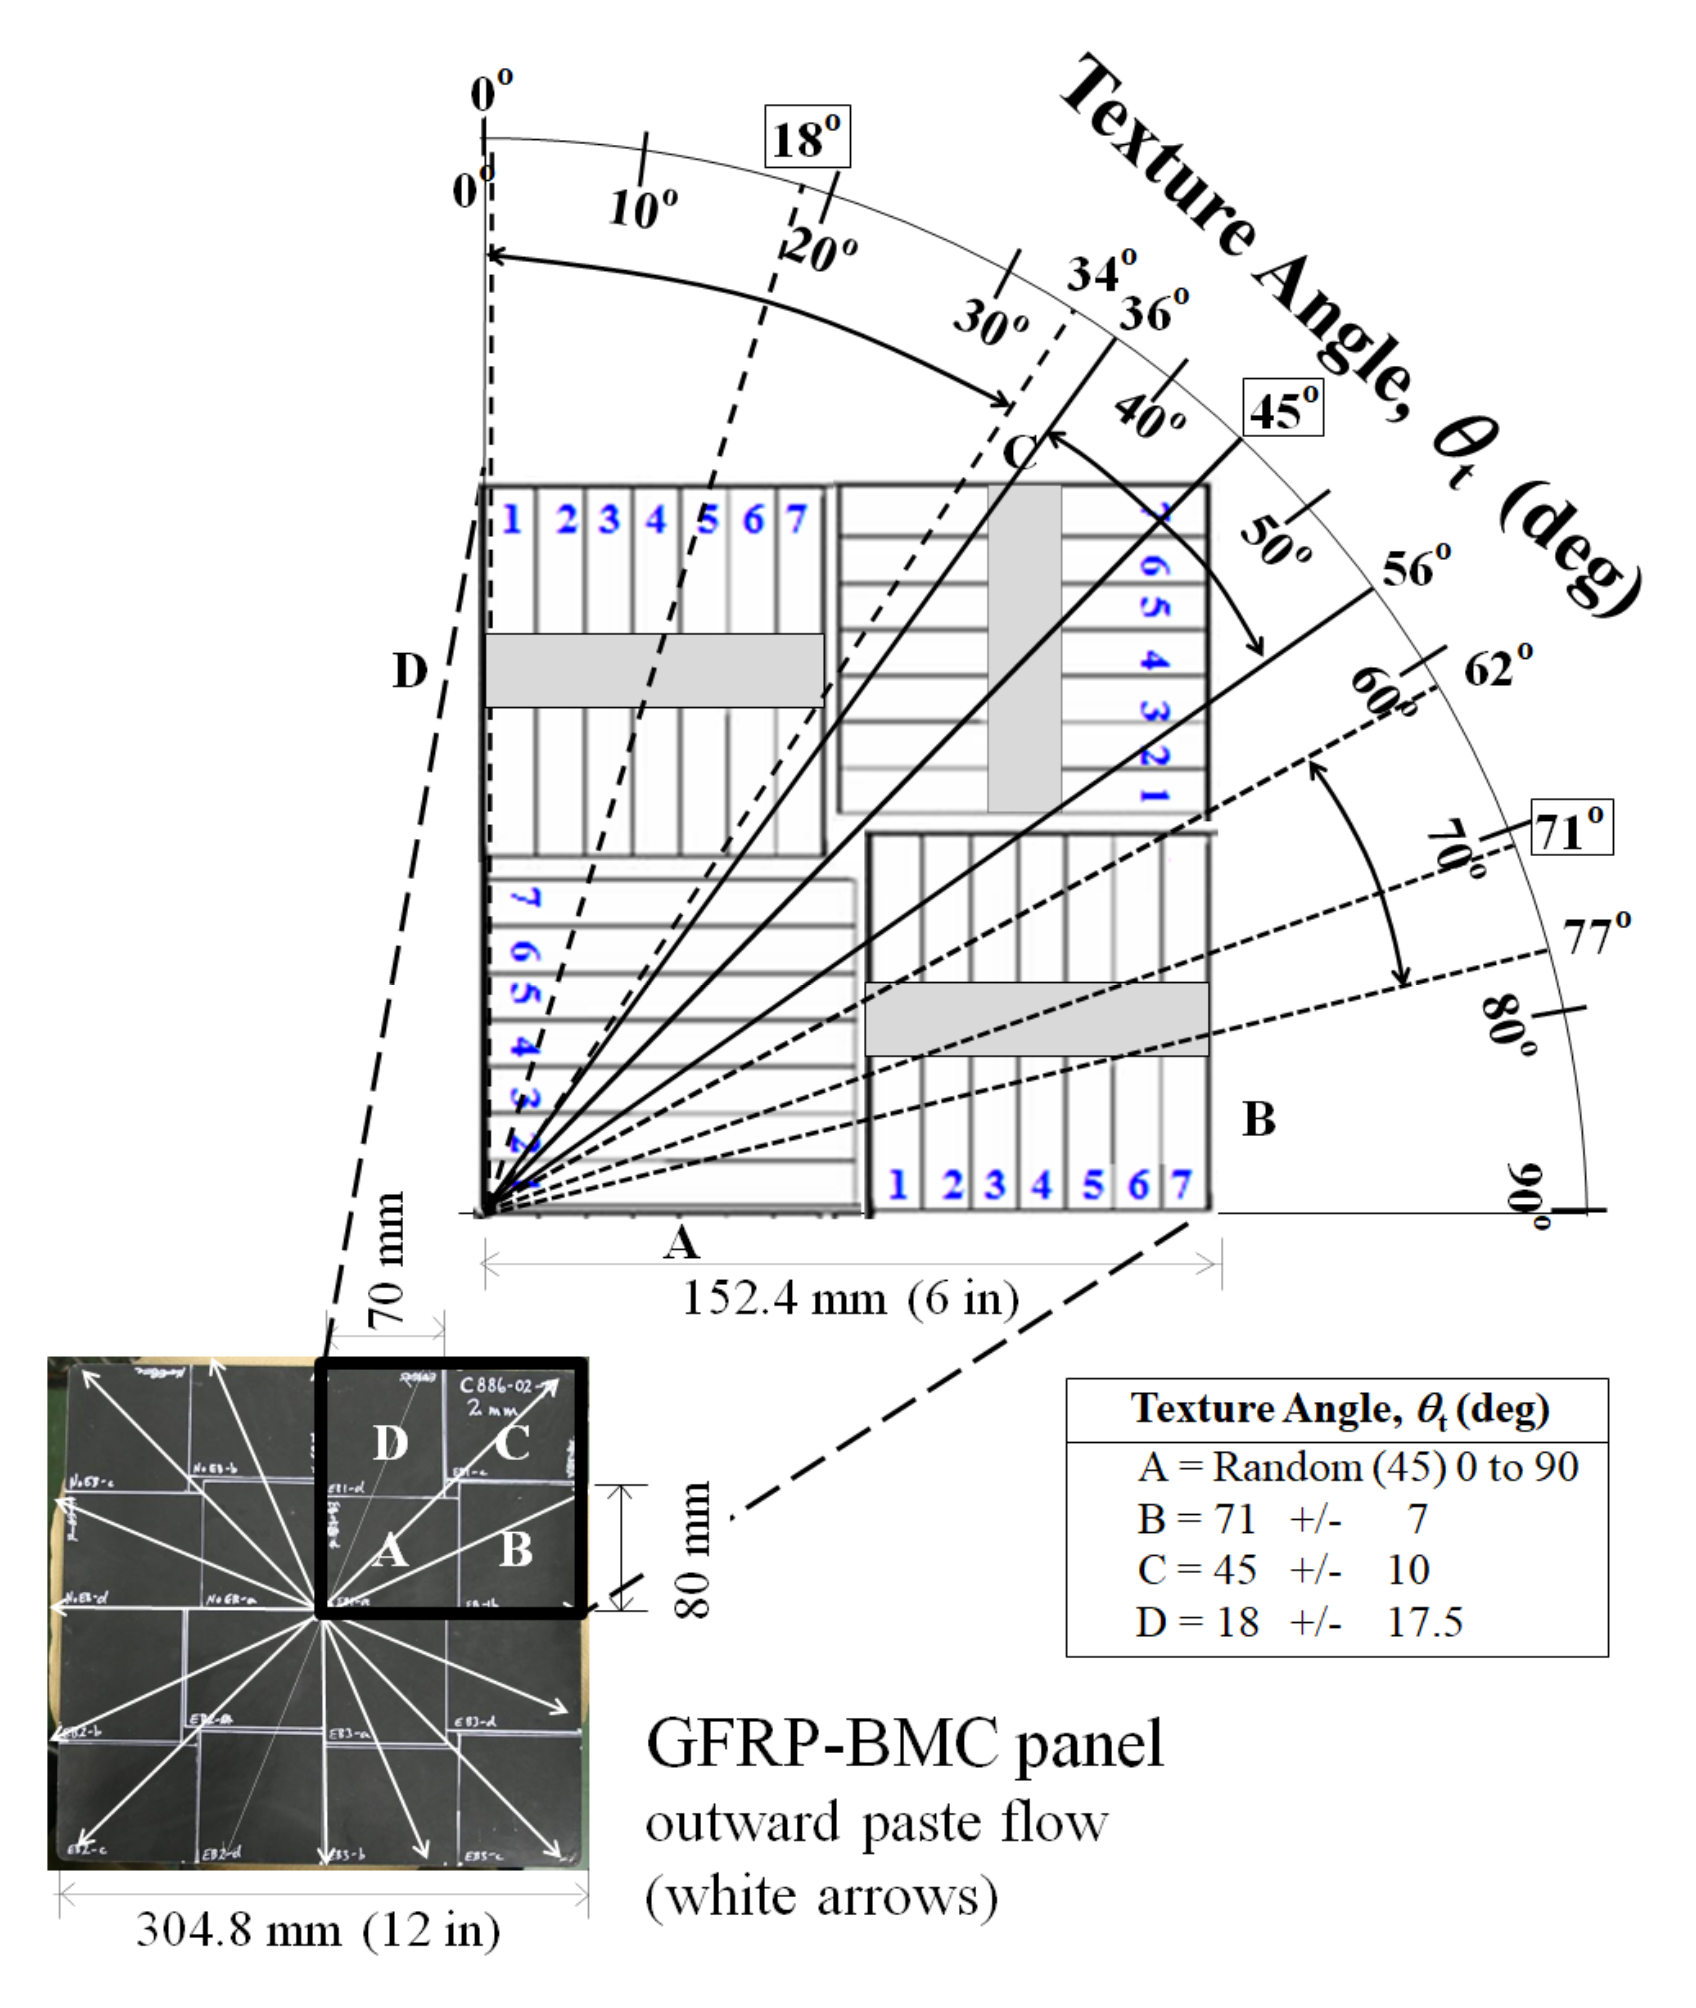
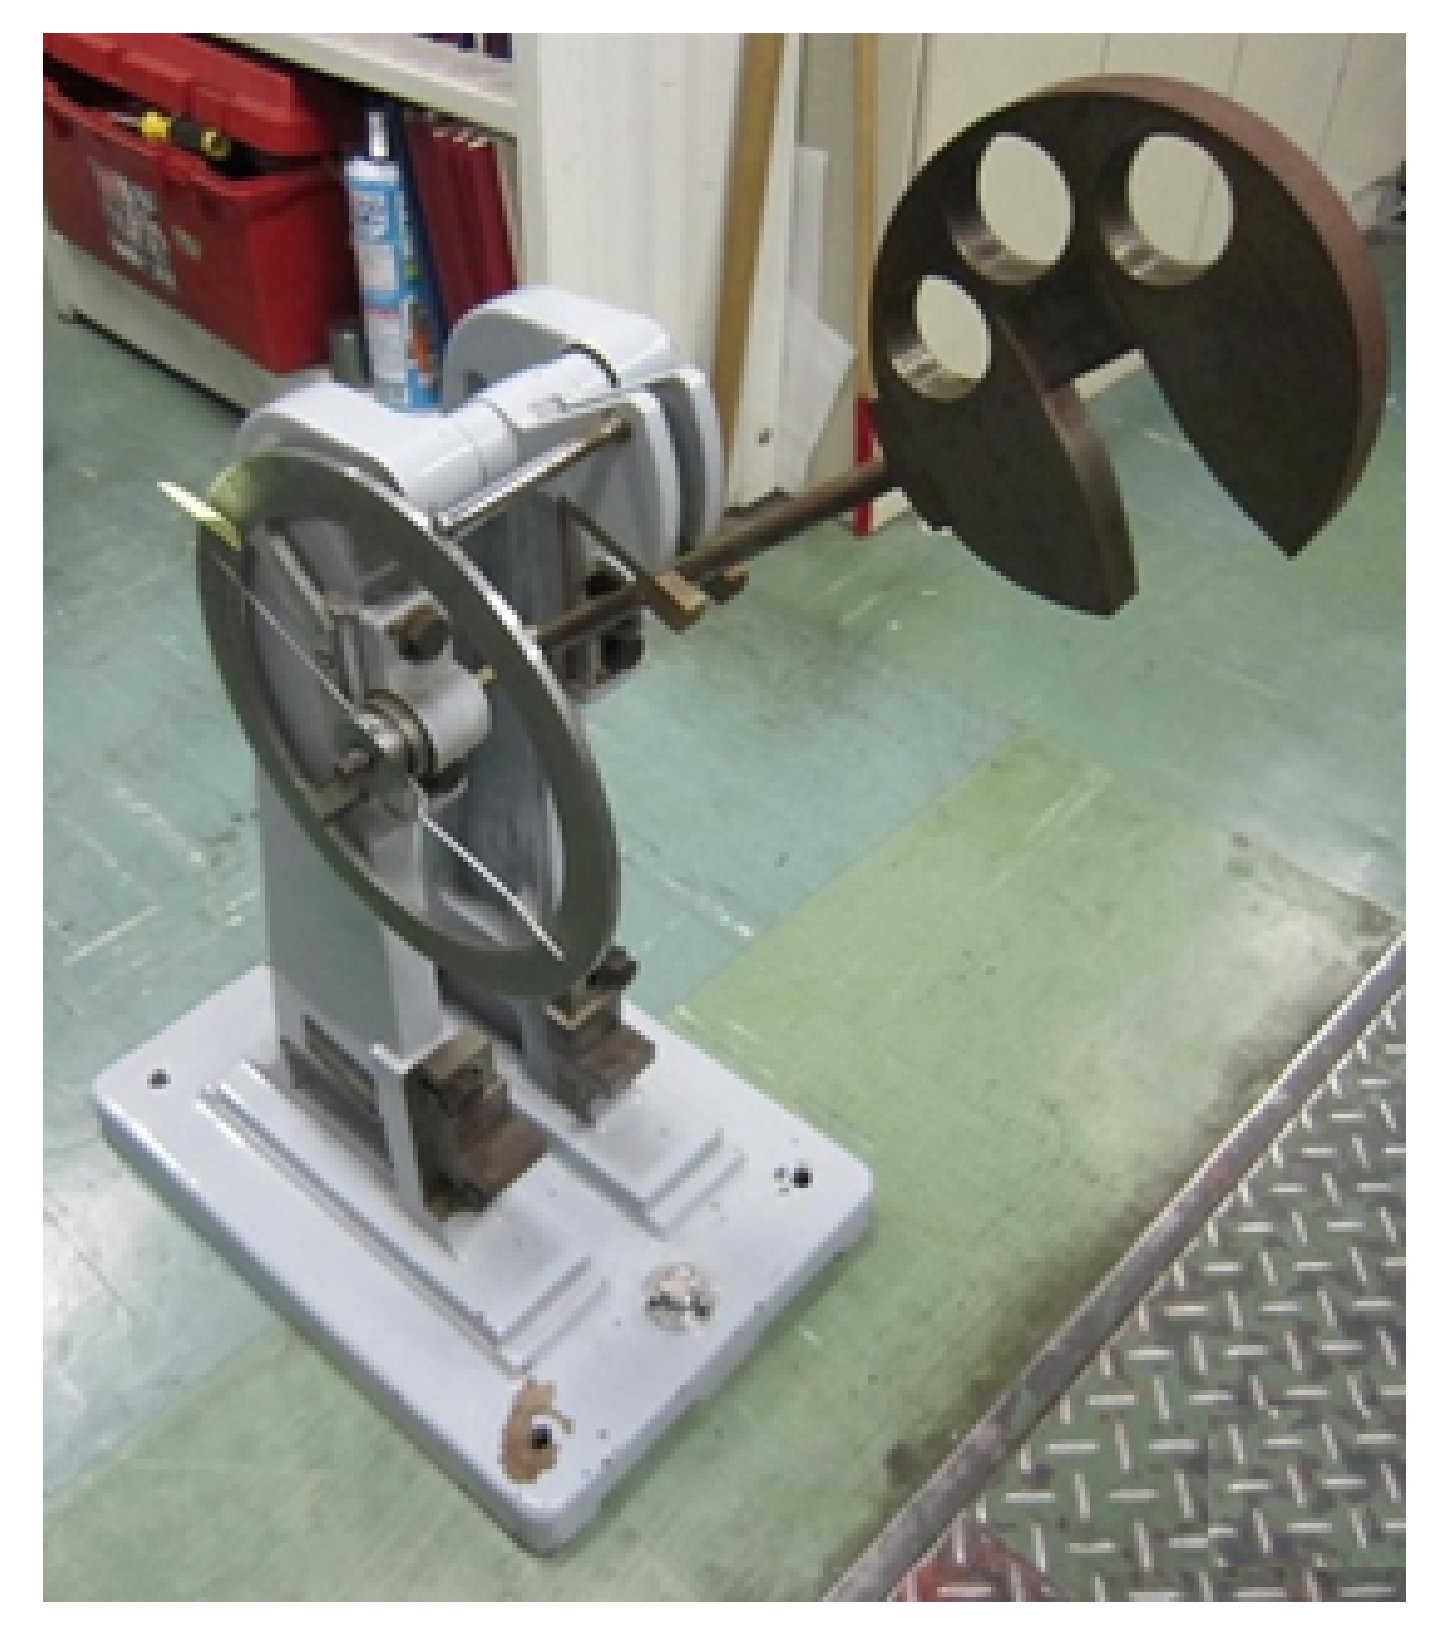
2.1. Preparation of GFRP

The components, molding parameters, and fiber lengths of the GFRP-BMC compression molded panels [27,28,29] are summarized in Table 1, Table 2 and Table 3.
Panels were provided by Premix, Inc., (now Citadel) of North Kingsville, Ohio, with nominal 6 mm to 6.4 mm chopped glass fibers (exact nominal length between 6 and 6.4 mm proprietary), reported here as U.S. 1/8 in (6.4 mm) [7,27]. As mentioned above, the mean fiber lengths of the 6.4 and 0.44 mm data sets are considered to have enough variance for results to be reliable [7,8]. Optical microscope Nikon Eclipse ME600 was used to examine the polished GFRP-BMC samples.
Figure 2 shows Charpy impact samples with dimensions 80 × 10 × 2 mm cut in a spiral formation according to ASTM D 6110-02 (2002) [29], since mold flow in the compression molded GFRP-BMC panels is anisotropic. This resulted in four 7-sample sub-quadrants designated “A, B, C, or D” according to solidification texture angle with respect to the long 80 mm direction, θt (deg), of: random (45) 0 to 90; (71 ± 7); (45 ± 10); and (18 ± ~17.5) [27,28].
Table 4 shows 56 tested samples of GFRP-BMC for each of the two fiber length sample data sets of 6.4 and 0.44mm, divided into 14 samples within each section A, B, C, and D, respectively. Figure 2 shows the location of the sample in the panel, according to the sample number, which is always counted from center 1 to 7. These were designated as “A1, A2, A3; B1, B2, B3, etc.”. Since 2 sub-quadrants of 7 samples each were tested, to distinguish the samples, the second quadrant was designated as “A1′, A2′, A3′; B1′, B2′, B3′, etc.”, therefore, the same location according to the solidification flow angle can be compared.

2.2. Charpy Impact Tests

Charpy impact tests were conducted to evaluate fracture toughness, auc (kJm−2), of the GFRP-BMC samples. The Charpy impact test is a quick and easy method often employed to evaluate the safety of materials for quality control (QC). Figure 3 shows the apparatus used (Shimadzu Corp. No. 51735) conforming to JIS K 7077-1991 testing standard, which operated by a drop weight pendulum [27,28,29,30,31,32,33]. A diamond cutter (MC-201, MARUTO) was used to cut unnotched specimens to size according to JIS K 7077-1991 [30].
Impact fracture energy, E (kJ) is calculated in Equation (1):
E = WR[(cos β − cos α) − (cos α’ − cos α)(α + β)/(αα’)]
where W = hammer mass (0.86 kg), R = distance from impact point of specimen to rolling center (0.21 m), β = finish angle after impact (radians), α = start angle (2.3 radians) and α’ = average angle of 3 blank tests for calibration [30,31]. The auc (kJ/m2) is calculated by [30,31]:
auc = E/(bt)
where b = sample width (~10 mm) and t = thickness (~2 mm). When the specimen was placed in the holder, there was a gap distance of 40 mm. The fracture probability, Pf, is expressed using the median rank method [33]:
Pf = (I − 0.3)/(Ns + 0.4)
where Ns is the total number of samples (Ns = 56 for each data set; or 14 for each sub-quadrant, A, B, C, D) and I is the ascending strength order of each sample, respectively.

3. Results and Discussion

3.1. Effect of Shortening Fibers on Impact Strength of Panel at All Texture Angles, θt Cumulative, and Sub-Quadrants

Table 5 shows the results for all texture angles, θt cumulative. Shortening fibers from the commercial length of 6.4 mm to 0.44 mm raised the average auc by 26% from 7.63 to 9.62 kJm−2 in the compression molded GFRP-BMC panels (standard deviation in brackets). Moreover, the auc was increased by 27.6, 19.1, 29.9 and 29.5% for each sub-quadrant A, B, C, D, respectively, demonstrating that auc can be raised regardless of the texture angles examined in the panel.
Figure 4a shows the Pf vs. auc plot for all solidification texture angles, θt, of all individual samples of Sections A, B, C, and D, cumulatively in the two 56-specimen data sets, namely, the 6.4 mm and the shortened fiber 0.44 mm samples, respectively. At median-fracture probability, Pf = 0.50, therefore, shortening fibers by 30 min extended mixing improved the Charpy impact value auc by 29%, from 7.43 to 9.59 kJm−2. Moreover, at high Pf = 0.88, auc improved by 40%, from 9.57 to 13.38 kJm−2. The auc was improved at all Pf above 0.03.

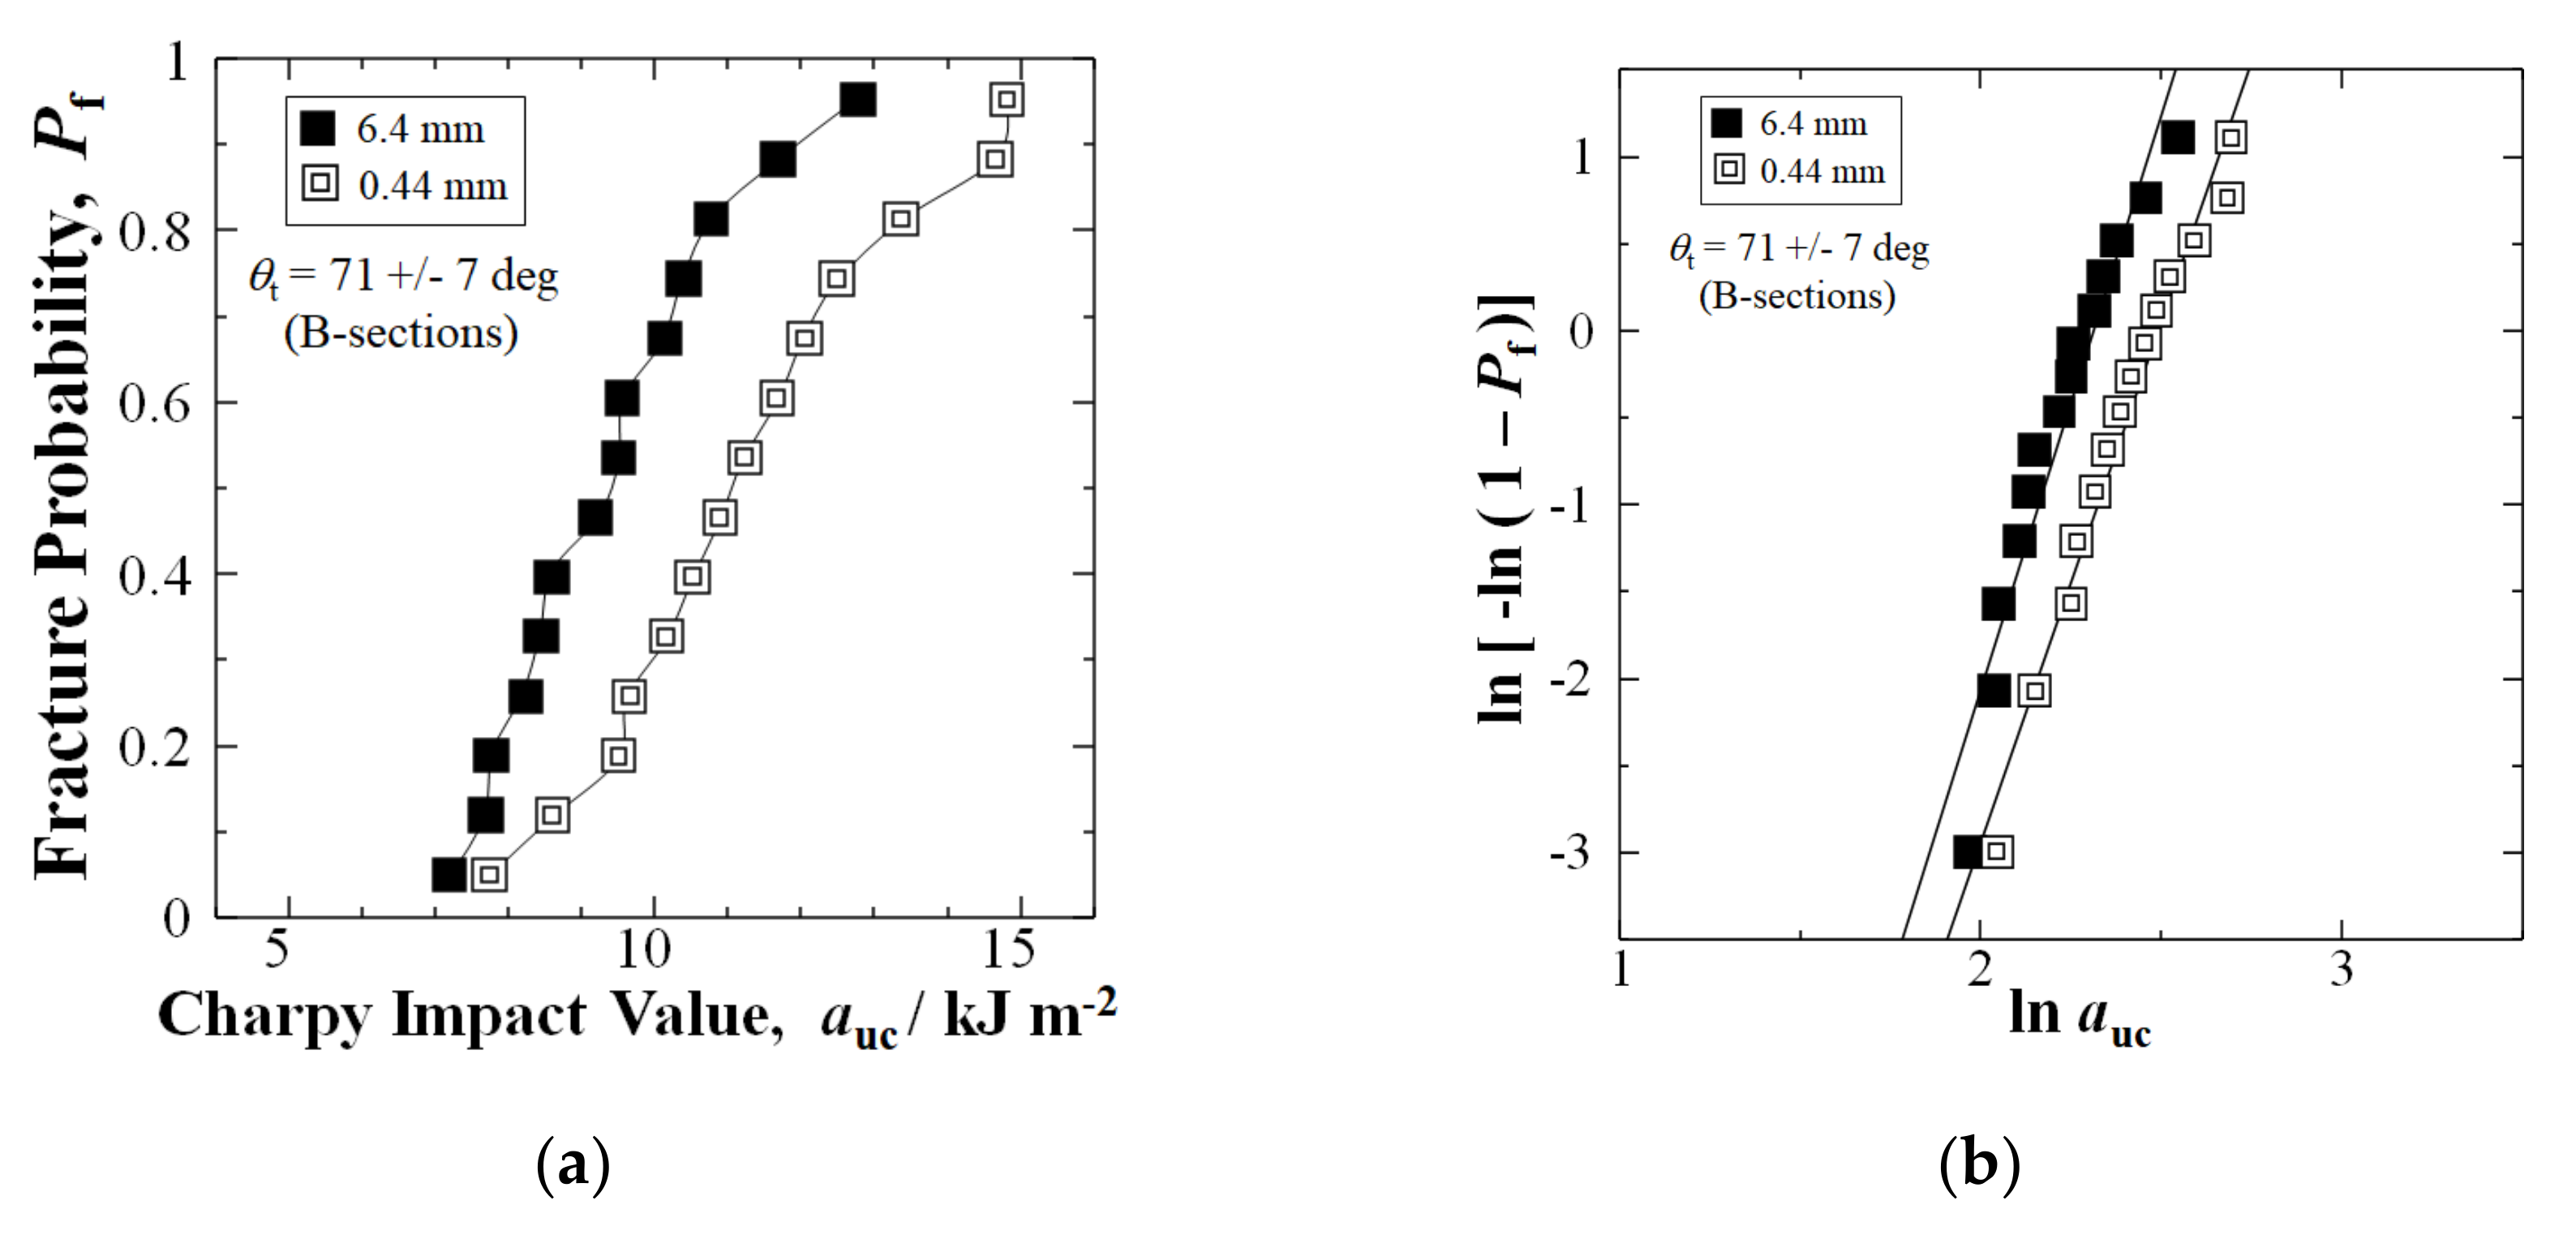
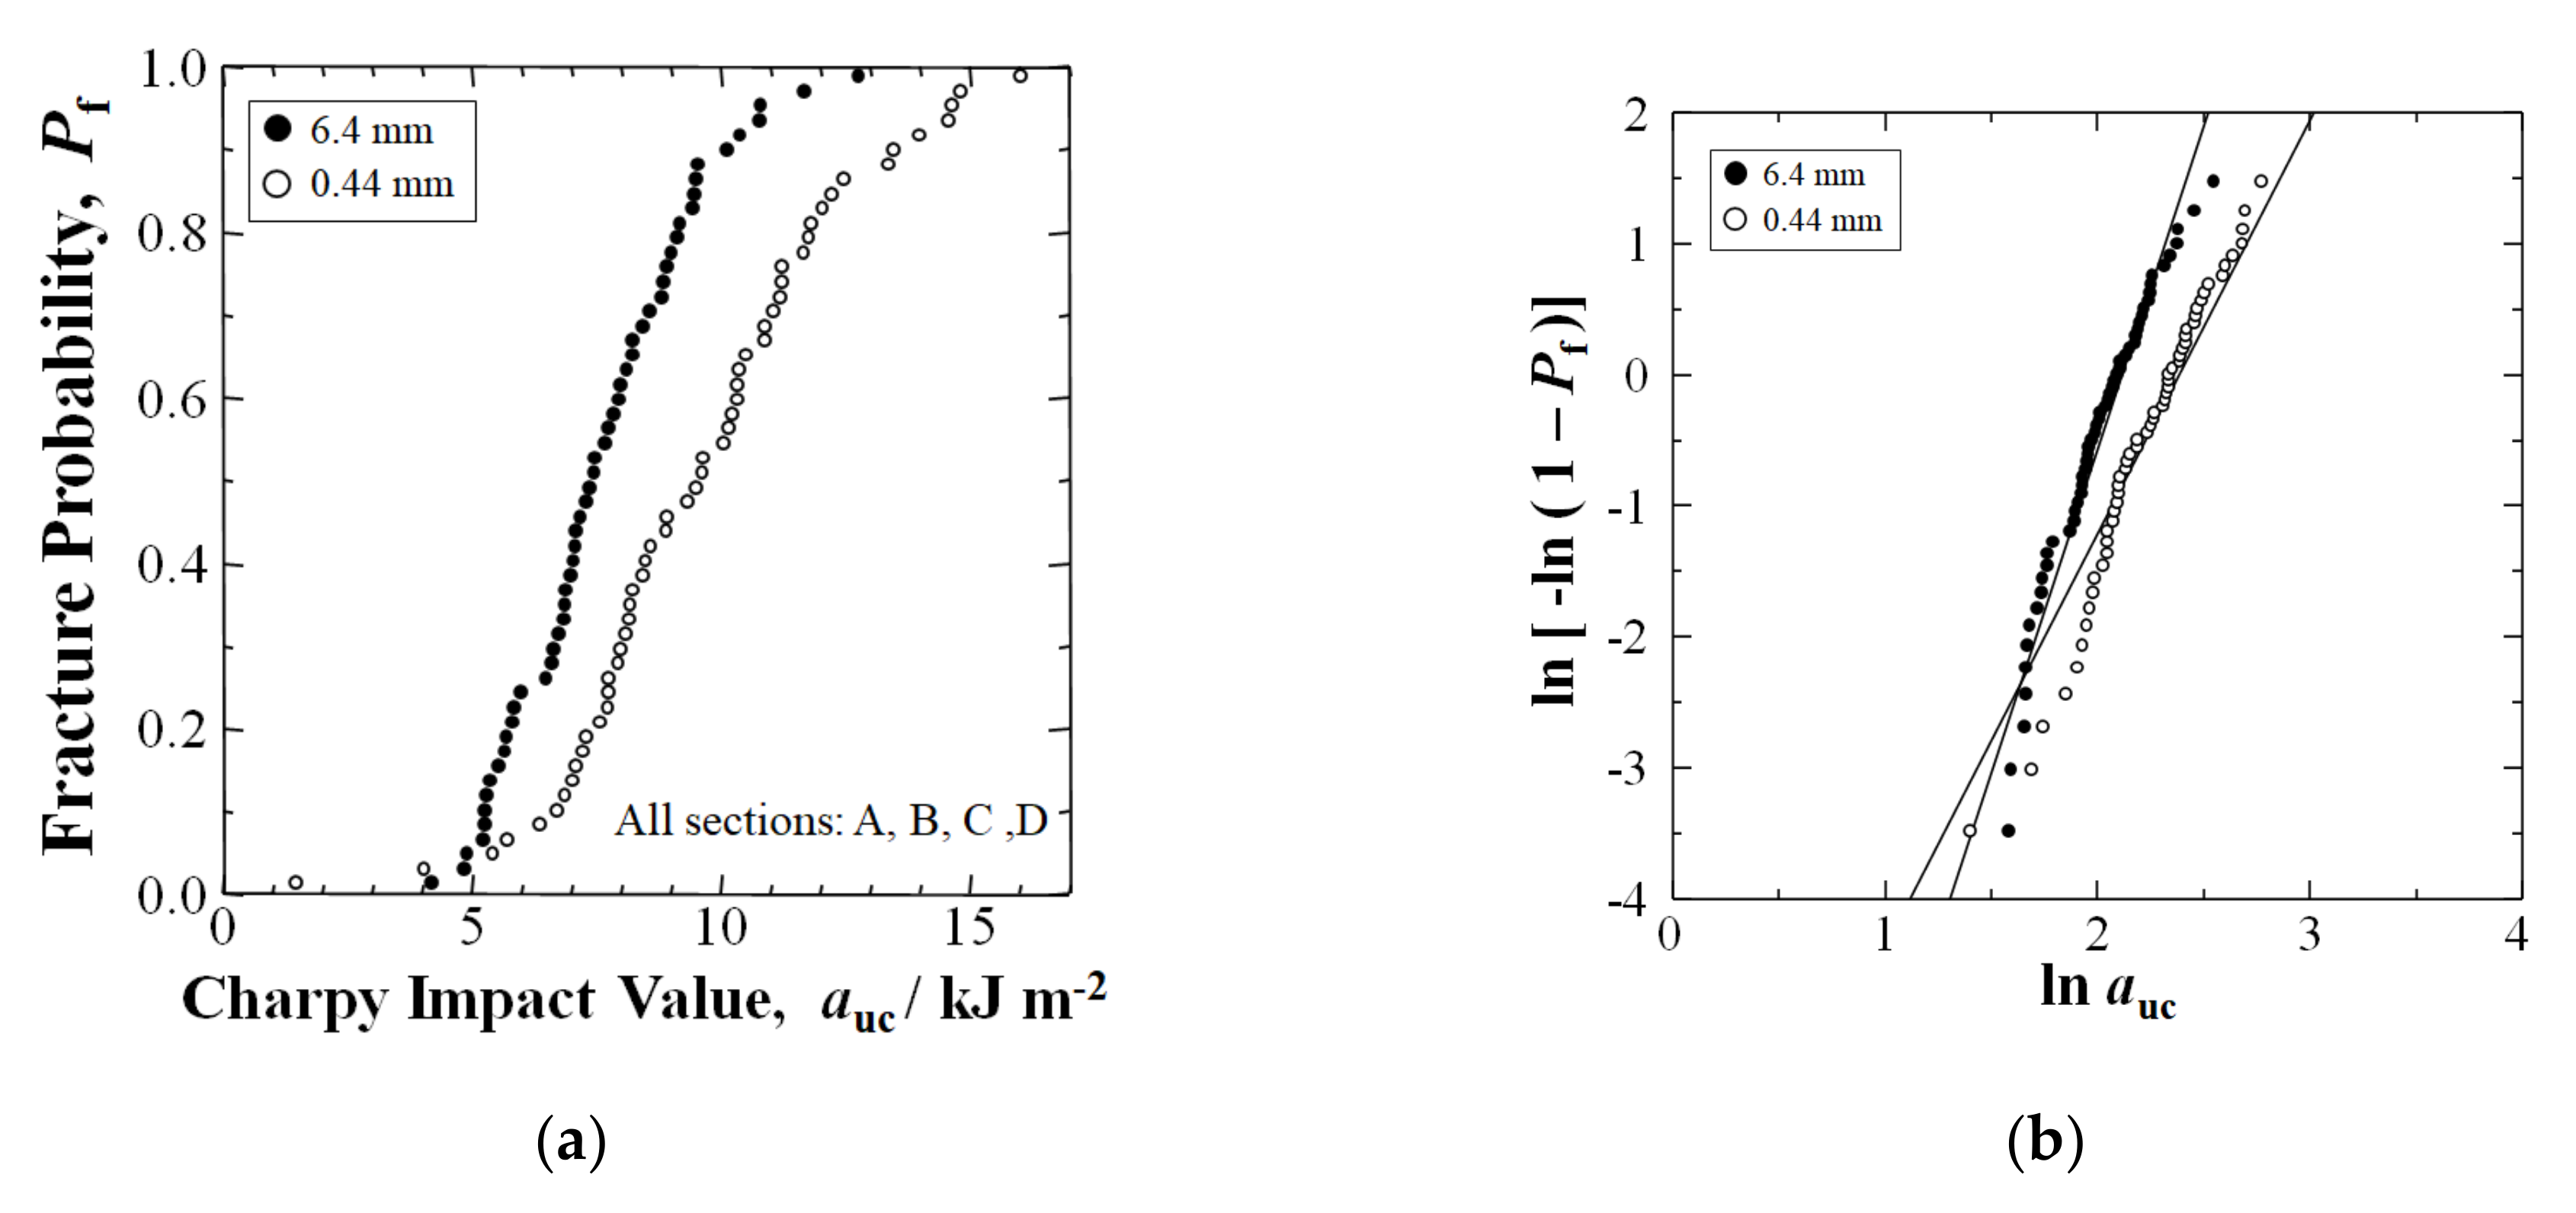
3.2. Weibull Analysis: All Texture Angles, θt Cumulative

Weibull analysis is a standard method widely utilized to compare many structural materials [34,35,36]. The 2-dimensional Weibull coefficient (n) is calculated from the experimental Charpy impact values (auc) and fracture probability (Pf), where (auc/ao) is the rupture risk [34,35,36]:
Pf = 1 − exp[−(auc/ao)n]
The linear form is [34,35,36]:
ln(−ln(1 − Pf)) = n[ln auc − ln ao]
Figure 4b shows the resulting Weibull plots for the 6.4 mm and 0.44 mm data sets, respectively, where the n values are slope lines. In the 0.44 mm data set, although n reduced from 4.92 to 3.15, the impact values increased by 29% at a median–Pf of 0.50, and 26% average. The n was reduced due to the two weakest samples achieving below Pf = 0.03.
Differences in n result from higher gradients of low and high fiber or filler density areas [27], i.e., an increased anisotropy within a panel or between different panels. For the 0.44 mm data set, the two lowest auc samples probably had more lower fiber density or abrupt fiber density reduction sites than the other samples, which may be an explanation for the high variance. Shortening the glass fibers by extended mixing increased the auc and overcame this issue.

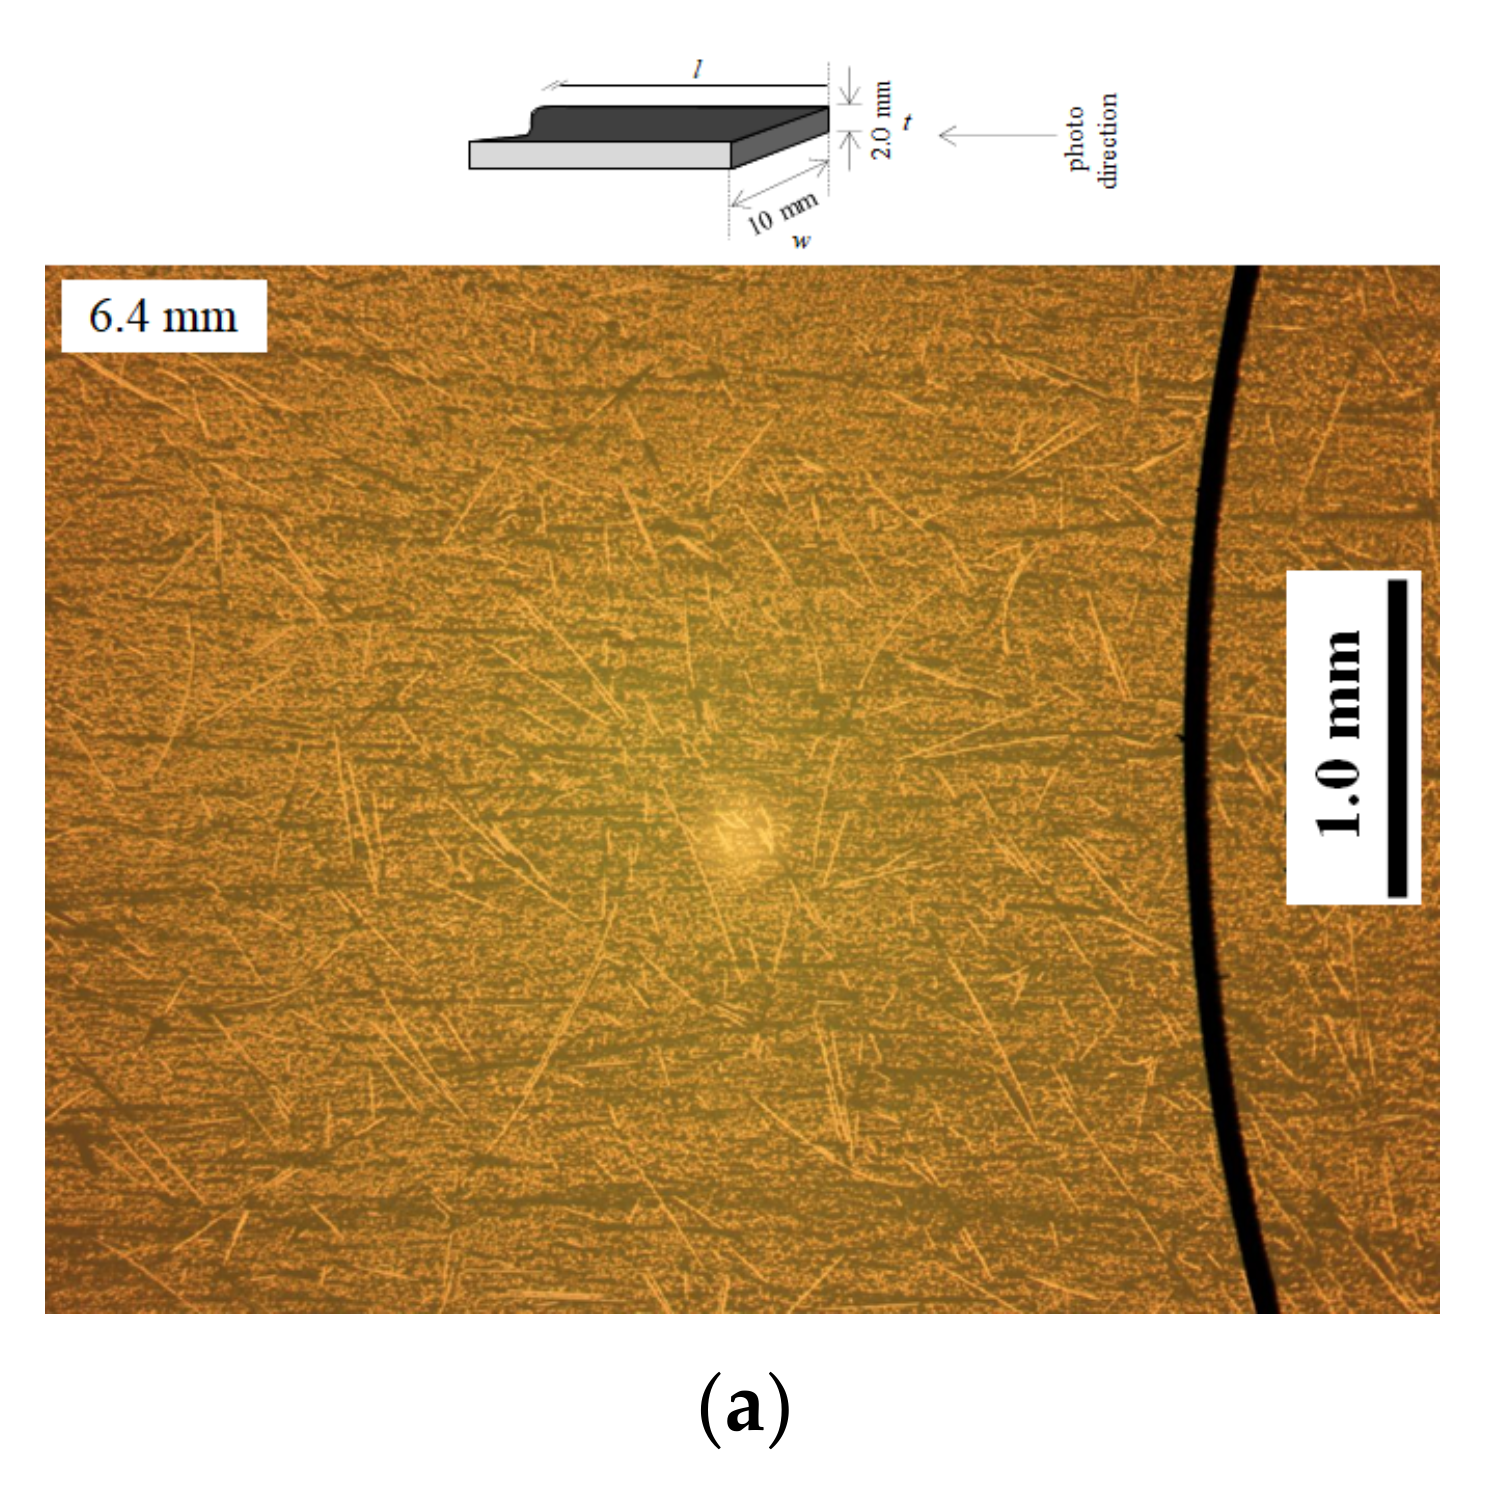
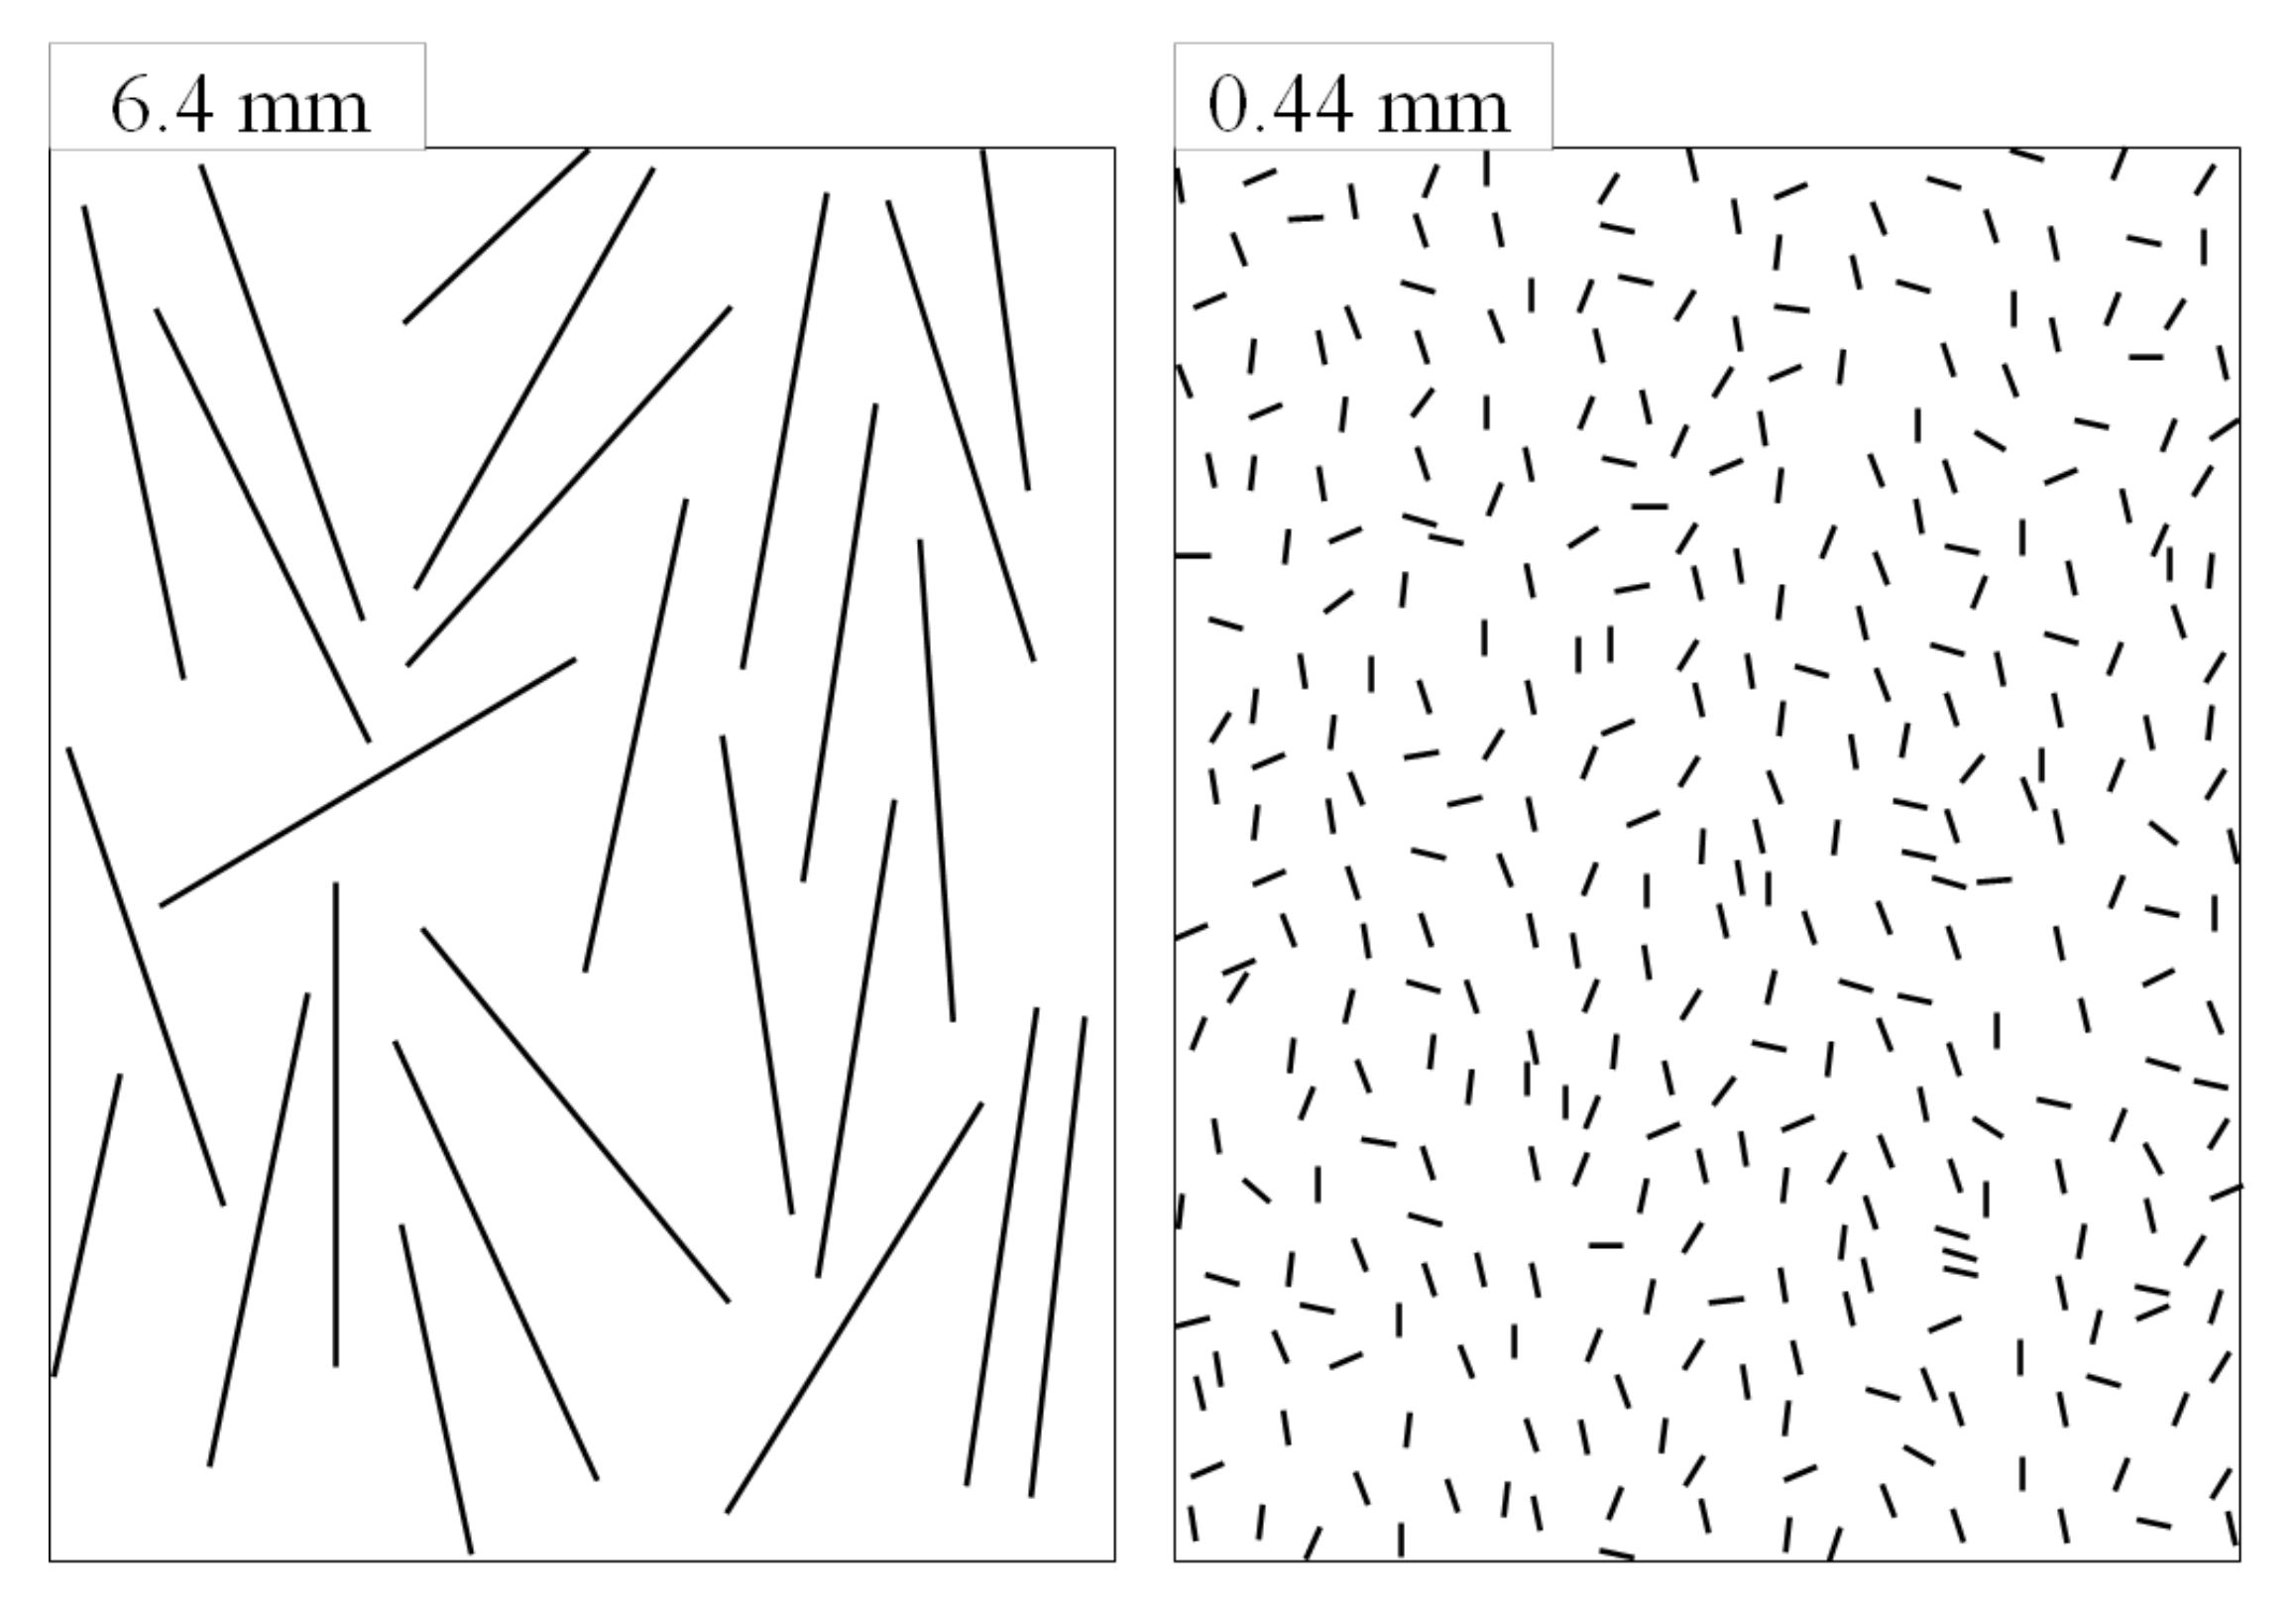
3.3. Optical Microscopy

Figure 5a,b shows photos by optical microscope of polished samples from center A-Sections for (a) nominal 6.4 mm, and (b) shortened fiber formulations, respectively. Photos were taken normal to sample cross-sections as illustrated. The extended mixing formulation appears to have a significantly higher proportion of shorter fiber cross-sections with higher, more homogeneous dispersion than the nominal 6.4 mm commercial fibers, allowing for an increased number of spaces between fibers, Sf.
Note that the top photo of the nominal 6.4 mm specimen (Figure 5a) has curved long fibers probably configuring into the 2 mm panel thickness, which is mostly absent in the shorter fiber photo (Figure 5b).

3.4. Effect of Shortening Fibers on Impact Strength as a Function of Texture Angle

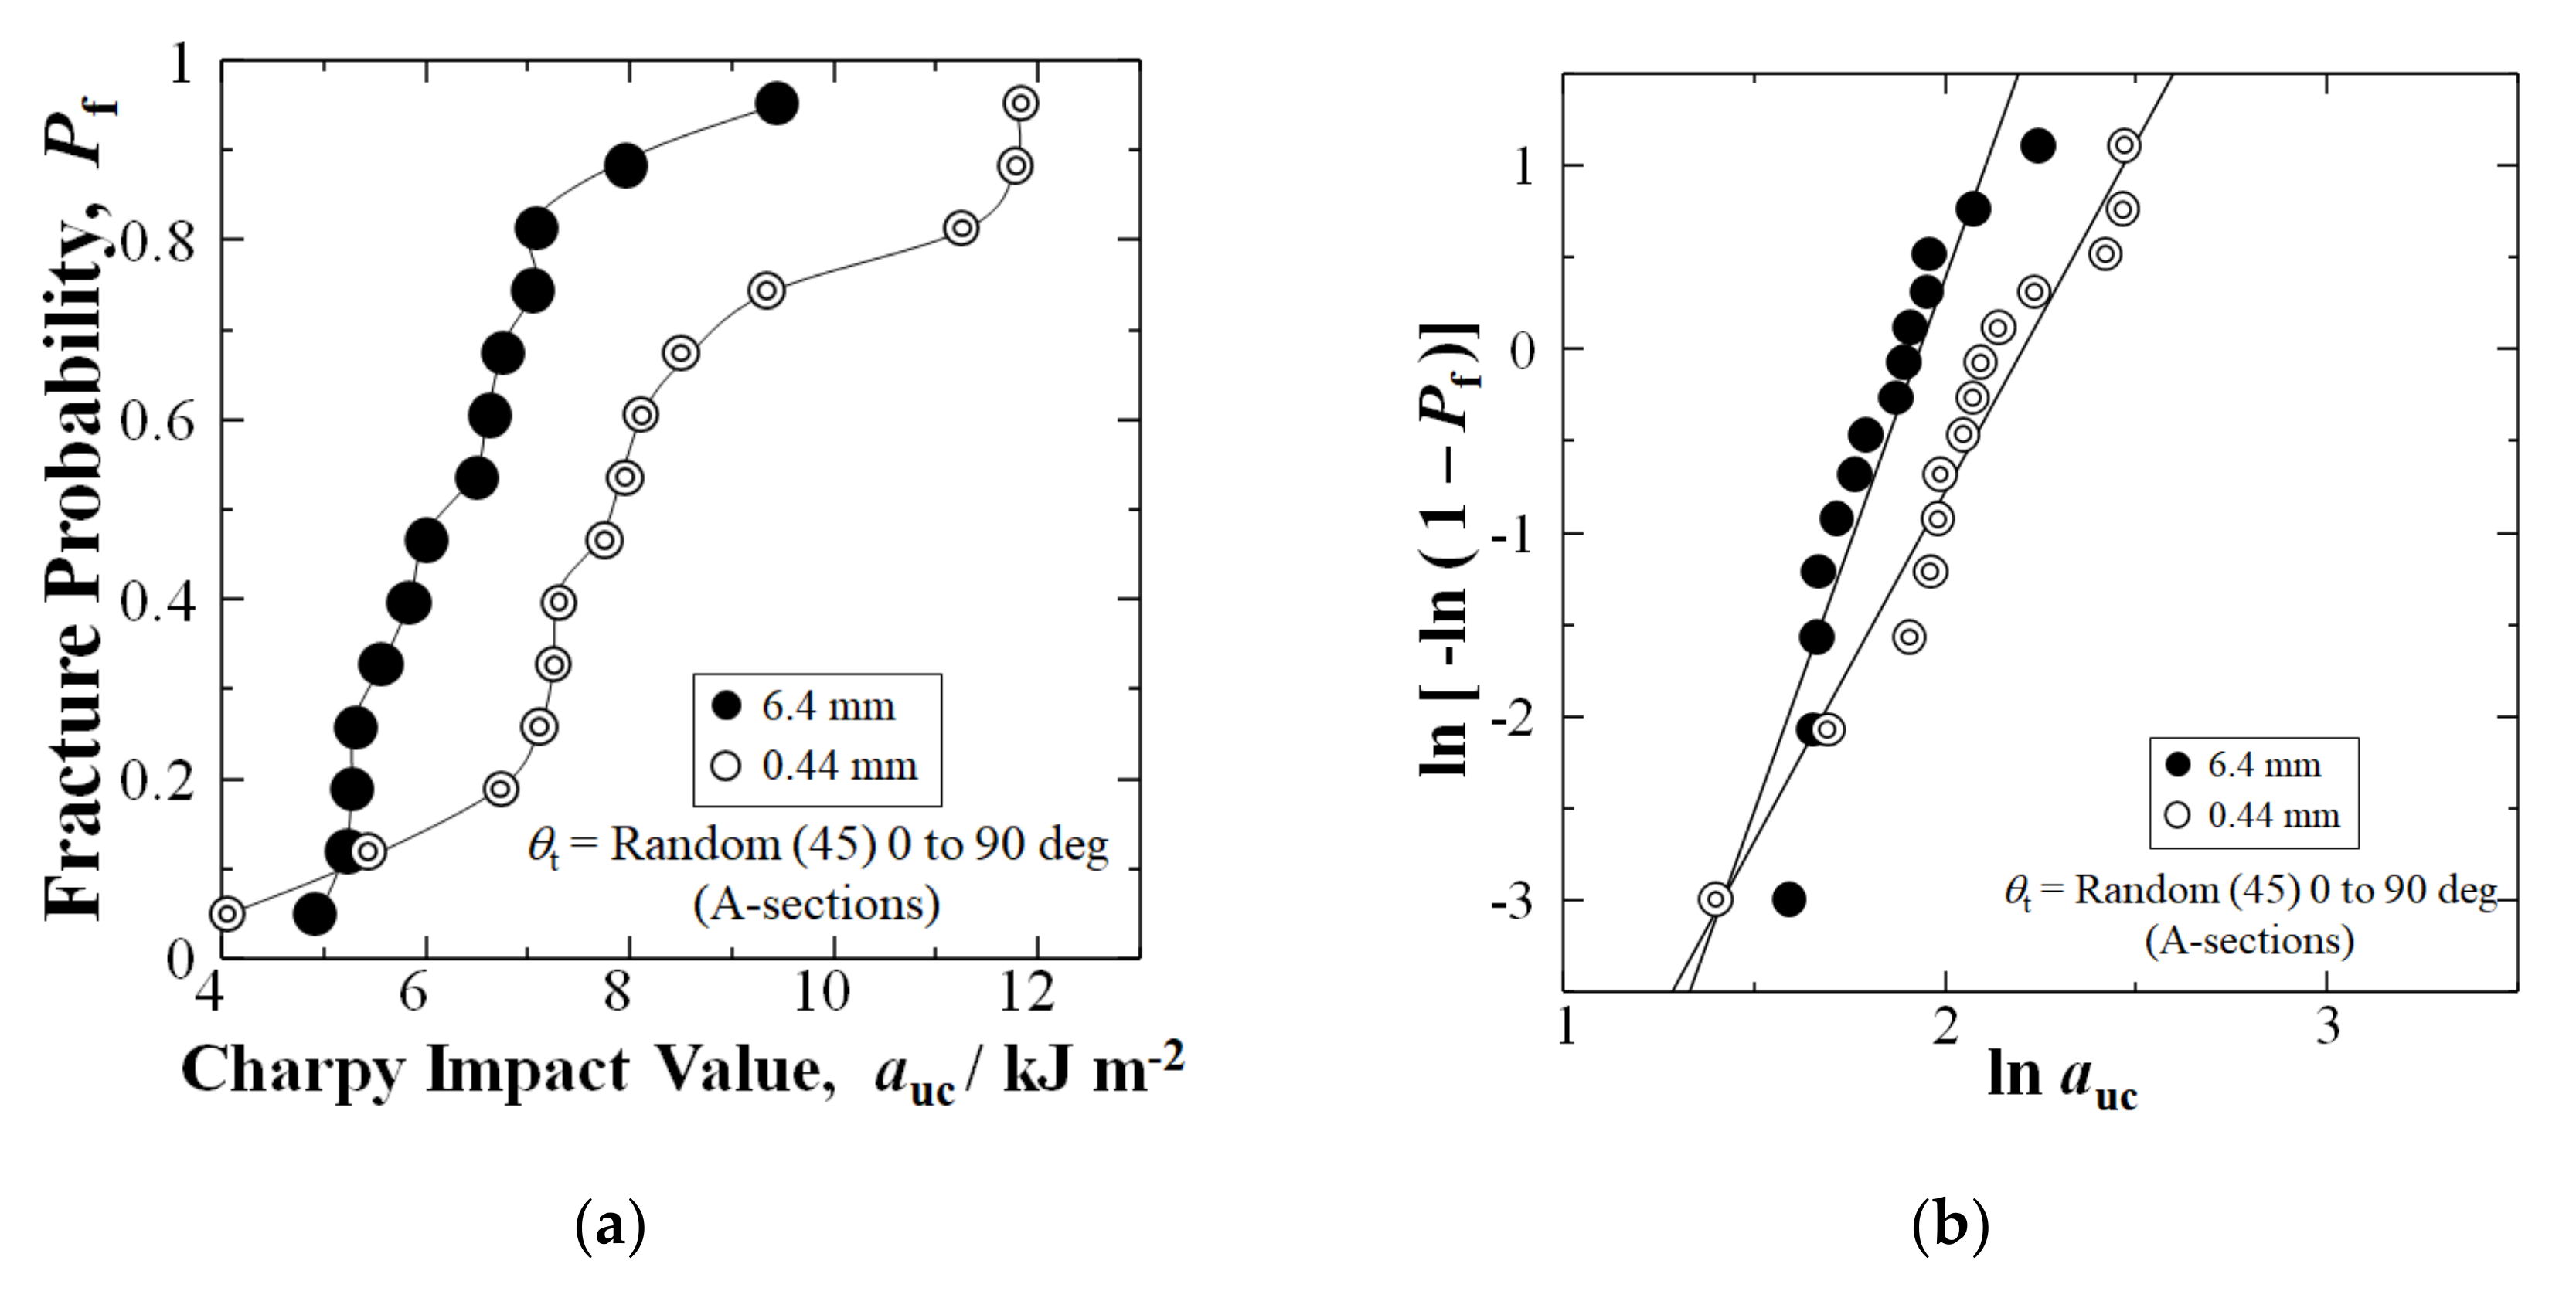
3.4.1. [θt = Random (45) 0 to 90 deg] A-Section

To show the effects of shortening fibers on the increase of impact strength according to the solidification texture angle, θt, between mold flow and longitudinal direction of the testing sample, sections A, B, C, D that were depicted in the Pf vs. auc plot of Figure 2 are examined separately in Figure 6, Figure 7, Figure 8 and Figure 9, for 6.4 and 0.44 mm data sets, respectively.
Figure 6a shows that for the typically weakest center of the GFRP panel with a texture angle of random (45) 0 to 90 deg (A-sections) [27], shortening fibers by extended mixing improved the Charpy impact value of auc by 25%, from 6.26 to 7.86 kJm−2, at a median-fracture probability of Pf = 0.50. Moreover, at high Pf = 0.88, the auc improved remarkably by 48%, from 7.97 to 11.79 kJm−2. Figure 6a shows that the auc improved at all fracture probabilities, Pf, above 0.05.
Furthermore, the extended mixing to 0.44 mm increased the average auc in A-Section by 28% over the 6.4 mm fiber length samples, from 6.41 (1.24) to 8.18 (2.27) kJm−2. Figure 6b shows that the Weibull modulus, n was reduced by extended mixing from 5.81 to 3.81, due to higher scatter in the 0.44 mm data set.

3.4.2. [θt = 71 ± 7 deg] B-Section

Similar to the highest solidification texture angle, with a θt of 71 ± 7 deg (B-sections) in the GFRP panel, Figure 7a shows that shortening fibers to 0.44 mm by extended mixing improved the Charpy impact value auc by 18%, from 9.36 to 11.07 kJm−2, at a median-fracture probability of Pf = 0.50. Moreover, at high Pf = 0.88, the auc improved by 25%, from 11.70 to 14.67 kJm−2. Figure 7a shows that in B-Section the auc improved at all fracture probabilities, Pf.
In addition, the average auc of 0.44 mm fiber length samples improved 19% above the 6.4 mm samples, from 9.44 (1.61) to 11.25 (2.11) kJm−2. Weibull modulus, n, slightly decreased for B-Section, from 6.61 to 5.96, as shown in Figure 7b.

3.4.3. [θt = 45 ± 10 deg] C-Section

For the diagonal texture angle 45 ± 10 deg (C-sections), as shown in Figure 8a, shortening the fibers improved the auc by 35%, from 7.68 to 10.37 kJm−2 at a median-fracture probability of Pf = 0.50. Moreover, at high Pf = 0.88, auc improved remarkably by 60%, from 9.14 to 14.61 kJm−2.
Moreover, the average auc for C-Section improved by 30% over the 6.4 mm fiber length samples from 7.89 (1.28) to 10.25 (3.79) kJm−2.
The Weibull calculation in Figure 8b shows the n value reduced from 6.96 to 1.75, for the two weakest samples below Pf = 0.15. However, the auc increased at all Pf above 0.15.

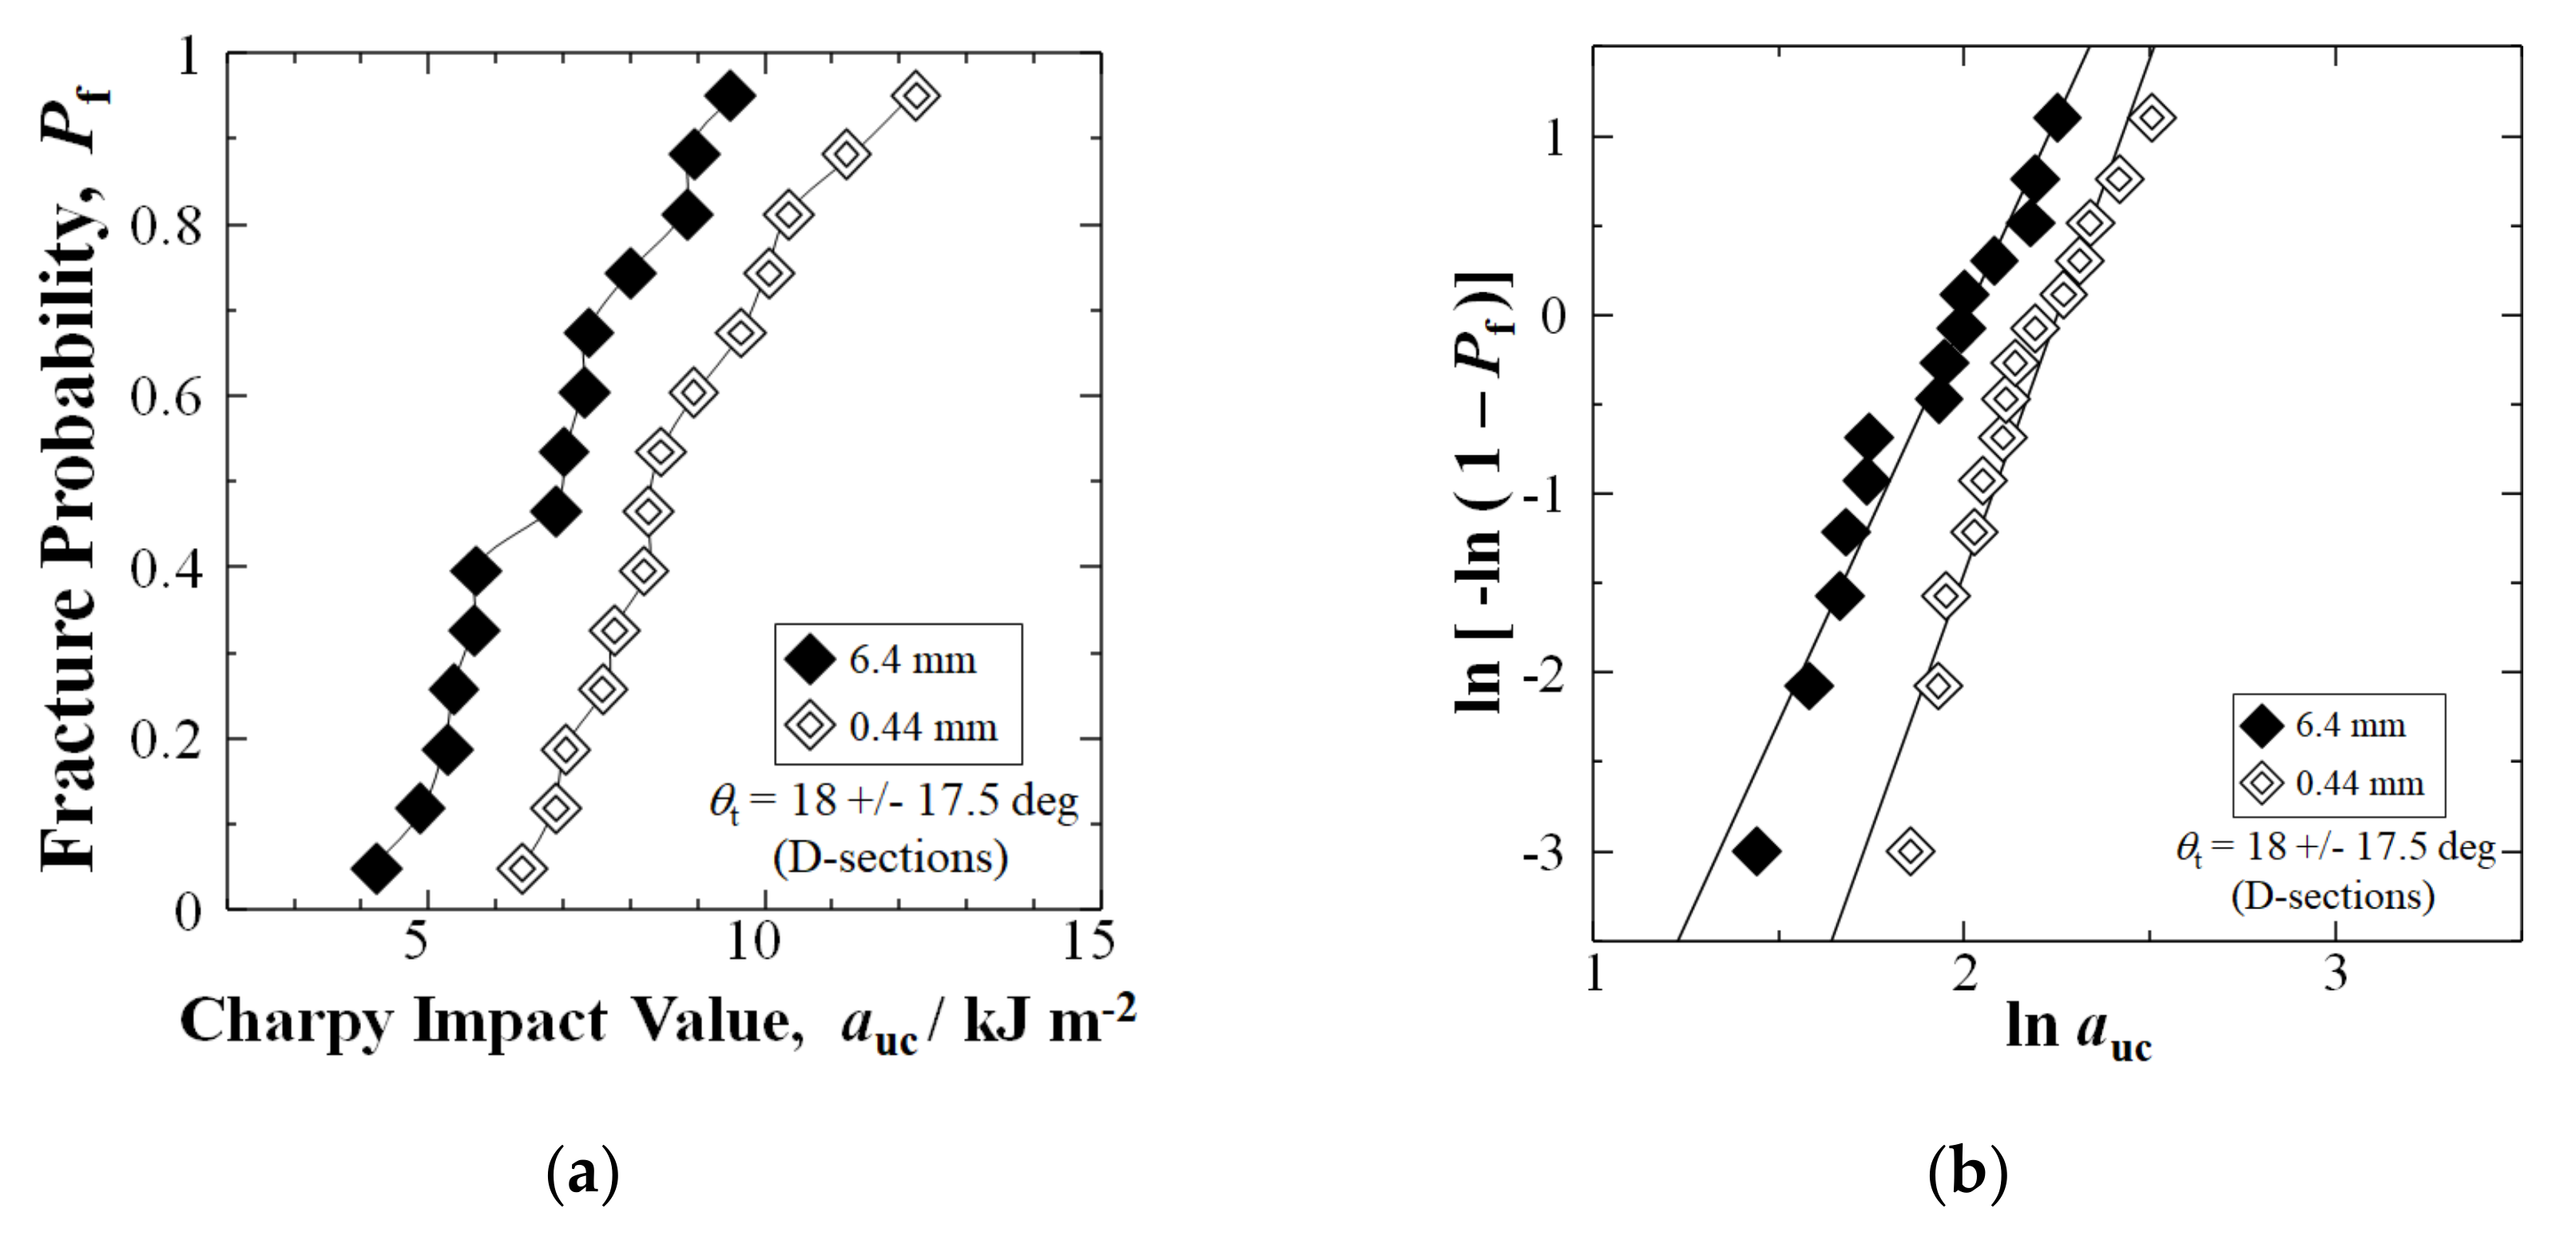
3.4.4. [θt = 18 ± 17.5 deg] D-Section

For the lowest solidification texture angle, namely, 18 ± 17.5 deg (D-sections), Figure 9a shows extended mixing improved the Charpy impact value auc by 20% over the 6.4 mm fiber length samples, from 6.96 to 8.36 kJm−2 at a median-Pf = 0.50; and at Pf = 0.88, the auc improved by 25%, from 8.95 to 11.21 kJm−2. In D-Section, the auc improved at all fracture probabilities, Pf.
Moreover, the average auc of D-Section improved due to extended mixing, being 29% above the 6.4 mm fiber length samples, from 6.79 (1.65) to 8.79 (1.72) kJm−2.
Figure 9b shows that the Weibull modulus, n, improved slightly by extended mixing, from 4.50 to 5.76.
Interestingly, Figure 6, Figure 7, Figure 8 and Figure 9 show that the highest increase in auc was at a high-Pf of 0.88 for A-, B-, and C-Sections (48, 25, 60%), respectively, with D-Section also showing a significant increase of 25%. This could be explained by higher fiber density, ρf., from the flows during compression and solidification.
Comparison of the four sections A, B, C, and D themselves is considered beyond the focus of this study, due to the large existing amount of data and explanation required.
In summary, shortening glass fibers in GFRP-BMC from 6.4 to 0.44 mm by 30 min of extended mixing increased the auc at all solidification texture angles of θt: 0 to 90 (random), 71, 45 and 18 deg (Sections A, B, C, D); in addition to the Sections A, B, C and D cumulatively.

3.5. Mechanism of Strengthening by CTE Difference

Figure 10 illustrates the action of the CTE difference between cured polyester resin matrix (55 to 100 × 10−6/K) [24] and E-glass fibers (5.4 × 10⁻⁶/K) [25] being the thermal residual stresses generated from the matrix to the fibers during cool down and shrinkage. As fiber length is shortened, the CTE difference acts in the increased number of spaces (Sf) between fibers with closer proximity, collectively stiffening the composite and raising impact strength. To calculate the increase in Sf by shortening 6.4 mm fibers to 0.44 mm, fiber density, ρf (mm−3) is calculated by the following equation [8]:
ρf = Vf/(πr2lfiber)
where r is mean fiber radius taken to be 14 μm (0.014 mm), and lfiber is mean fiber length (mm) [7]. This is assuming homogeneous fiber distribution and lengths. For 1 mm3 of composite, ρf designated |ρf| will equal fiber number density, |Nf| [8]:
f| = |Nf| = |Sf|
which in turn is equal to number of spaces: the |Nf| and |Sf| are dimensionless quantities. This would hold true for fibers oriented parallel (0 deg) or any angle, θ, with respect to specimen length [8]. From this, |Sf| increases in order of magnitude from 217 to 2950 mm−3, increasing the impact strength of the BMC.

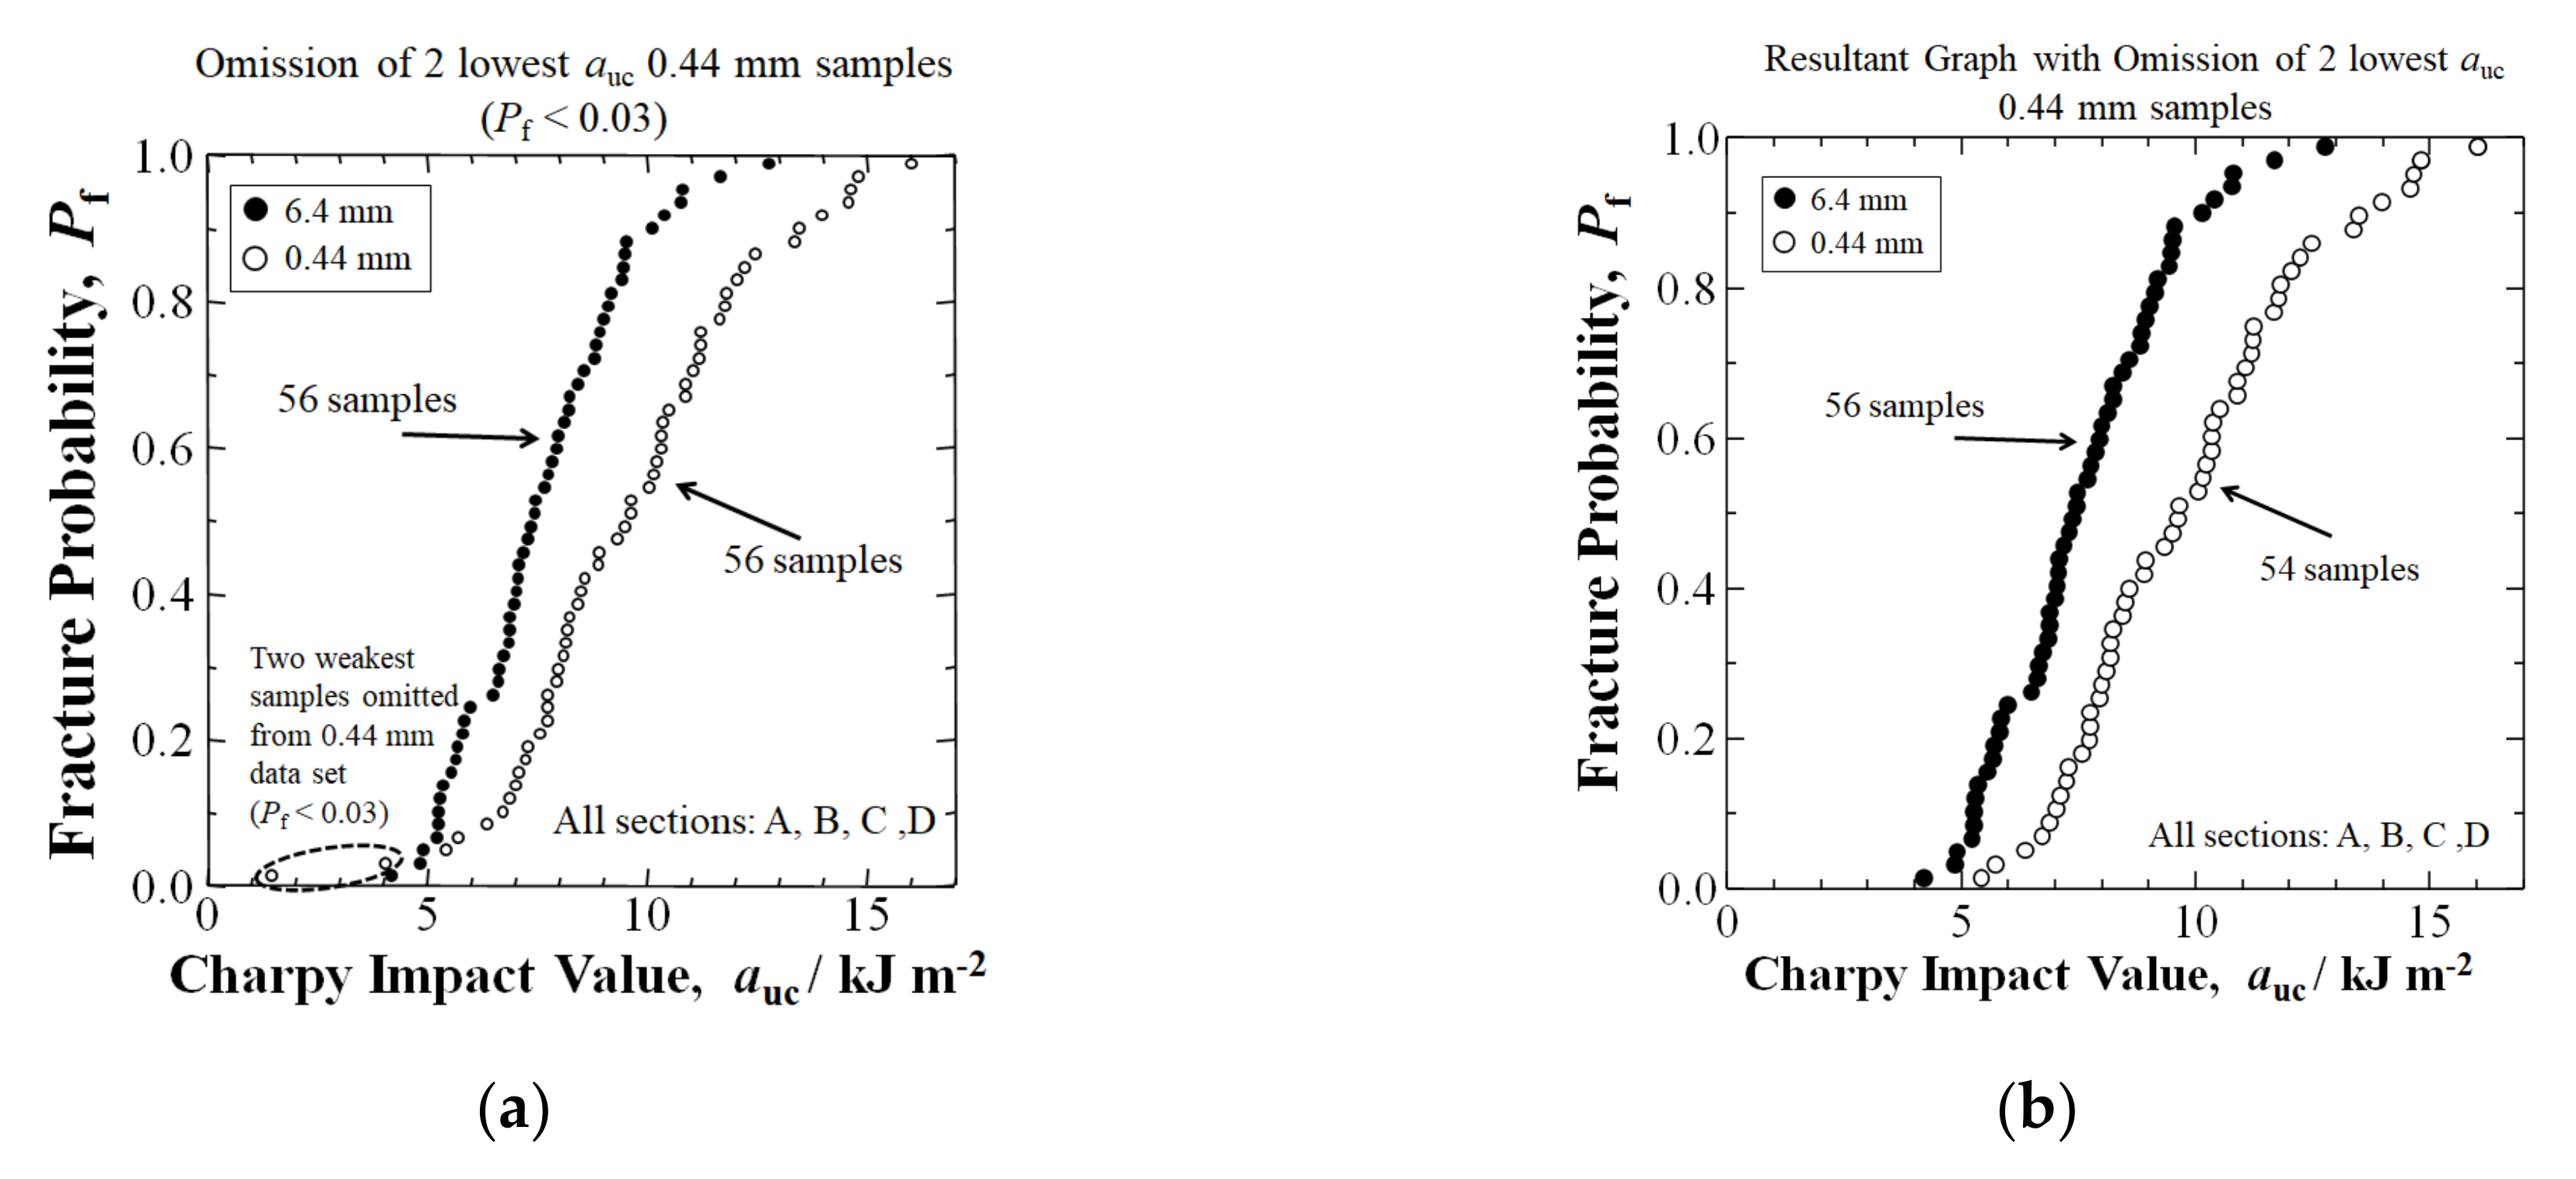
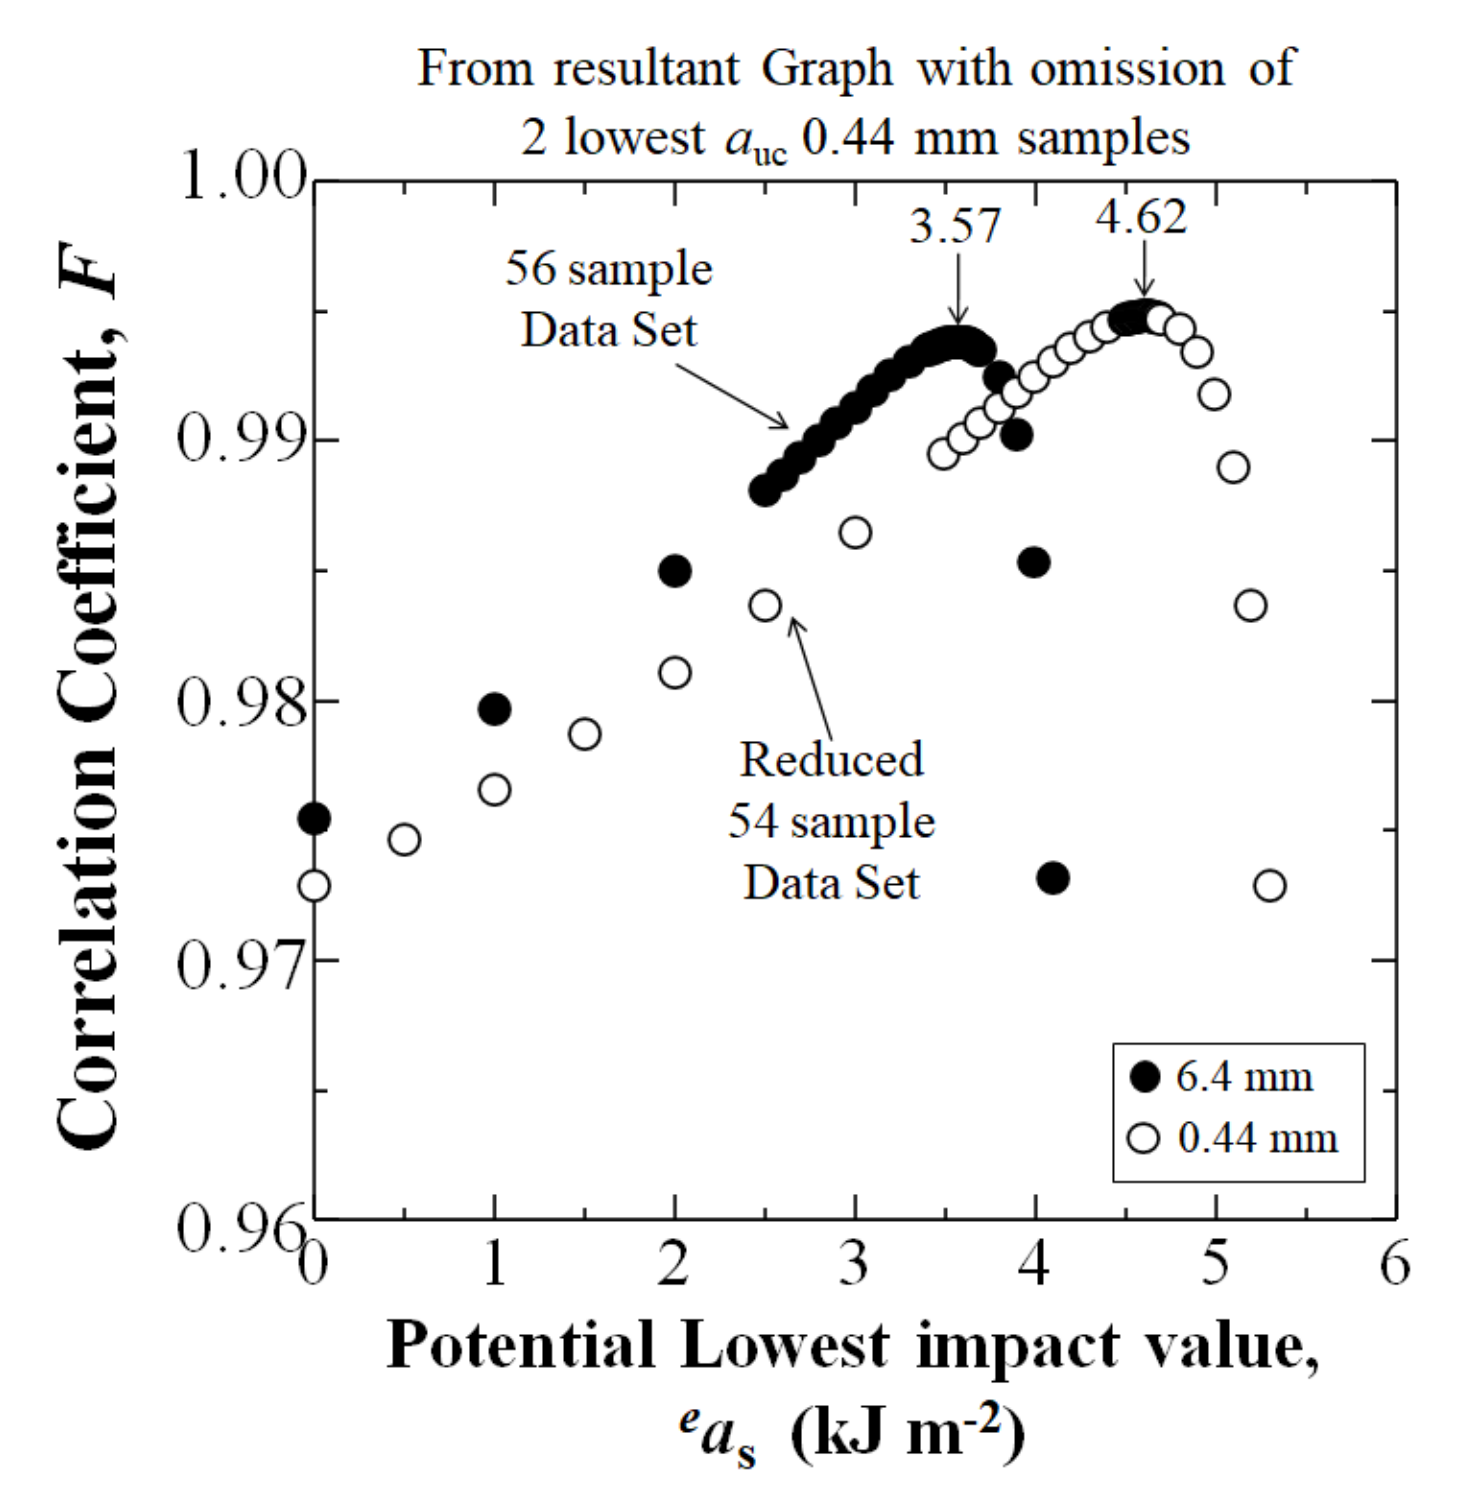
3.6. All Texture Angles, θt Cumulative: Evaluation of Statistically Lowest Impact Value as at Pf = 0 Omitting 2 Lowest auc 0.44 mm Samples of Pf < 0.03

In compression molding, complex flow patterns can result in the creation of high- and low- fiber density areas, the low fiber density area often lowering mechanical properties [27]. Figure 11a shows in the extended mixing 0.44 mm data set that there were two samples out of the total of 56 with a markedly lower auc (dotted oval) at the lowest Pf < 0.03, being evidence of significantly low fiber density areas. The two samples were omitted, thereby resulting in a 54 sample data set in Figure 11b. The number of nominal 6.4 mm fiber length samples remained unchanged at 56. The samples omitted from the 0.44 mm data set were C1′ and A2′ with an auc of 1.48 kJm−2 and 4.06 kJm−2, respectively. However, the adjoining specimens C2′ and A1′ had much higher auc at 8.19 and 9.35 kJm−2, respectively, being evidence of high density gradients created during the flow and solidification of the GFRP-BMC paste.
To assess safety, the statistically lowest as at Pf = 0 was calculated using 3-dimensional Weibull analysis. The as at Pf = 0 is useful for quality control (QC) of mass-produced parts. If the statistical equation is assumed to be applicable to the measured auc value, the Pf depends on the risk of rupture [35,37]. In predicting the required value for a new structural material, the as, the coefficient, m, and the constant, aIII, are key parameters. The equation is:
Pf = 1 − exp[−([auc − as]/aIII)m]
Rearranging in linear form yields:
ln(−ln(1 − Pf)) = mln(aucas) − mlnaIII
As shown in Figure 12, when the linear form in Equation (9) is iterated for the highest correlation coefficient, F, the as is obtained. When the two lowest auc samples were omitted from the 0.44 mm data set, the as at Pf = 0 for the adjusted 0.44 mm sample data set (4.62 kJm−2) was higher than the as of the commercial length of 6.4 mm (3.57 kJm−2), showing that an increased level of safety is possible.

4. Conclusions

This study demonstrates that in a highly CaCO3 filled 3-phase filler, fiber and polymer GFRP-BMC, impact strength can be increased by shortening glass fibers from the commercial fiber length of 6.4 mm (1/4 in) to 0.44 mm, by 30 min of extended mixture of the paste prior to compression molding, without any change in compression molding equipment. This has not been previously reported in the literature, and is opposite to 2-phase fiber and polymer systems where increasing the fiber length increases the mechanical properties. The strengthening can be explained by the homogeneous distribution of increased thermal compressive stress sites induced by the increased fiber number density generated by a difference in coefficient of thermal expansion (CTE) by the matrix on the glass fibers during cooling down and shrinkage. The higher number of spaces between fibers per mm3, |Sf|, generated, is increased by an order of magnitude enhancing the impact energy. These results can be applied to maximize the safety of BMC materials through the prevention of impact damage caused by bird strike, volcanic rock, hailstones, or in space, by micrometeoroids and debris.

Author Contributions

Conceptualization, M.C.F. and Y.N.; methodology, M.C.F. and Y.N.; software, M.C.F.; validation, M.C.F. and Y.N.; formal analysis, M.C.F. and Y.N.; investigation, M.C.F. and Y.N.; resources, Y.N. and M.S.; data curation, M.C.F. and Y.N.; writing—original draft preparation, M.C.F.; writing—review and editing, M.C.F. and Y.N.; visualization, M.C.F., Y.N. and M.S.; supervision, Y.N. and M.S.; project administration, Y.N. and M.S.; funding acquisition, M.C.F., Y.N. and M.S. All authors have read and agreed to the published version of the manuscript.

Funding

This research received no external funding.

Data Availability Statement

The data presented in this study are available on request from the corresponding author. At the time the project was carried out, there was no obligation to make the data publicly available.

Acknowledgments

The authors sincerely thank Shota Iizuka M.S., of Tokai University for his great assistance with the laboratory equipment. Michael Gruskiewicz with Citadel Plastics, Conneaut, Ohio is gratefully acknowledged for providing the BMC panels.

Conflicts of Interest

The authors declare no conflict of interest.

References

  1. Faudree, M.; Baer, E.; Hiltner, A.; Collister, J. Characterization of Damage and Fracture Processes in Short Fiber BMC Composites by Acoustic Emission. J. Compos. Mater. 1988, 22, 1170–1195. [Google Scholar] [CrossRef]
  2. Matykiewicz, D.; Barczewski, M.; Sterzyński, T. Morphology and thermomechanical properties of epoxy composites highly filled with waste bulk molding compounds (BMC). J. Polym. Eng. 2015, 35, 805–811. [Google Scholar] [CrossRef]
  3. DeRosa, R.; Telfeyan, E.; Gaustad, G.; Mayes, S. Strength and Microscopic Investigation of Unsaturated Polyester BMC Reinforced with SMC-Recyclate. J. Thermoplast. Compos. Mater. 2005, 18, 333–349. [Google Scholar] [CrossRef]
  4. Rajaee, P.; Ghasemi, F.A.; Fasihi, M.; Saberian, M. Experimental Analysis and Optimization of Mechanical and Physical Properties of Light-Weight Bulk Molding Compound by Design of Experiment. J. Macromol. Sci. Part B 2021, 60, 237–256. [Google Scholar] [CrossRef]
  5. Lee, T.; Jeong, K.; Kim, D. Development of a lightweight BMC material using fly ash. Adv. Compos. Mater. 2017, 26, 55–64. [Google Scholar] [CrossRef]
  6. Faudree, M.; Nishi, Y.; Gruskiewicz, M. Characterization of velocity profile of highly-filled GFRP-BMC through rectangular-duct shaped specimen during injection molding from SEM fiber orientation mapping. Mater. Trans. 2013, 54, 1877–1883. [Google Scholar] [CrossRef] [Green Version]
  7. Faudree, M.C.; Nishi, Y. Tensile Strength Enhancement by Shortening Glass Fibers with Sub-Millimeter Length in Bulk Molding Polymer Compound. Mater. Trans. 2010, 51, 2304–2310. [Google Scholar] [CrossRef] [Green Version]
  8. Faudree, M.C.; Nishi, Y.; Gruskiewicz, M. A Novel ‘Fiber Spacing’ Model of Tensile Modulus Enhancement by Shortening Fibers to Sub-Millimeter in an Injection-Molded Glass Fiber Reinforced Polymer Bulk Molding Compound (GFRP-BMC). Mater. Trans. 2014, 55, 1292–1298. [Google Scholar] [CrossRef] [Green Version]
  9. Singh, H.; Singh, T. Effect of fillers of various sizes on mechanical characterization of natural fiber polymer hybrid composites: A review. Mater. Today Proc. 2019, 18, 5345–5350. [Google Scholar] [CrossRef]
  10. Rajaee, P.; Ghasemi, F.A.; Fasihi, M.; Saberian, M. Effect of styrene-butadiene rubber and fumed silica nano-filler on the microstructure and mechanical properties of glass fiber reinforced unsaturated polyester resin. Compos. Part B Eng. 2019, 173, 106803. [Google Scholar] [CrossRef]
  11. Thomason, J.L.; Vlug, M.A. Influence on fibre length and concentration on the properties of glass fibre reinforced polypropylene: 1. Tensile and flexural modulus. Compos. Part A Appl. Sci. Manuf. 1996, 27, 477–484. [Google Scholar] [CrossRef]
  12. Thomason, J. The influence of fibre length, diameter and concentration on the modulus of glass fibre reinforced polyamide 6,6. Compos. Part A Appl. Sci. Manuf. 2008, 39, 1732–1738. [Google Scholar] [CrossRef] [Green Version]
  13. Thomason, J.L.; Vlug, M.A. Influence on fibre length and concentration on the properties of glass-fibre-reinforced polypropylene: 4. Impact properties. J. Compos Part A 1997, 28, 277–278. [Google Scholar] [CrossRef]
  14. Fu, S.-Y.; Lauke, B. Effects of fiber length and fiber orientation distributions on the tensile strength of short fiber reinforced polymers. Compos. Sci. Technol. 1996, 56, 1179–1190. [Google Scholar] [CrossRef]
  15. Huang, H.; Talreja, R. Numerical simulation of matrix micro-cracking in short fiber reinforced polymer composites: Initiation and propagation. Compos. Sci. Technol. 2006, 66, 2743–2757. [Google Scholar] [CrossRef]
  16. Thomason, J.L. The influence of fibre properties of the performance of glass fiber reinforced polyamide 6,6. Compos. Sci. Technol. 1999, 59, 2315–2328. [Google Scholar] [CrossRef]
  17. Rezaei, F.; Yunus, R.; Ibrahim, N.A.; Mahdi, E.S. Effect of fiber loading and fiber length on mechanical and thermal properties of short carbon fiber reinforced polypropylene composite. Malays. J. Anal. Sci. 2007, 11, 181–188. [Google Scholar]
  18. Maertens, R.; Hees, A.; Schöttl, L.; Liebig, W.; Elsner, P.; Weidenmann, K.A. Fiber shortening during injection molding of glass fiber-reinforced phenolic molding compounds: Fiber length measurement method development and validation. Polym. Technol. Mater. 2021, 60, 872–885. [Google Scholar] [CrossRef]
  19. Capela, C.; Oliveira, S.; Pestana, J.; Ferreira, J. Effect of fiber length on the mechanical properties of high dosage carbon reinforced. Procedia Struct. Integr. 2017, 5, 539–546. [Google Scholar] [CrossRef]
  20. Haghighatnia, T.; Abbasian, A.; Morshedianc, J. Hemp fiber reinforced thermoplastic polyurethane composite: An investigation in mechanical properties. Ind. Crops Prod. 2017, 108, 853–863. [Google Scholar] [CrossRef]
  21. Seol, K.; Krawitz, A.; Richardson, J.; Weisbrook, C. Effects of WC size and amount on the thermal residual stress in WC–Ni composites. Mater. Sci. Eng. A 2005, 398, 15–21. [Google Scholar] [CrossRef]
  22. Niihara, K. Overcoming the fragility of ceramics (Challenge to strengthen ceramics). Ceram. Kyoujinka Fract. Toughness Ceram. 1986, 21, 581–589. (In Japanese) [Google Scholar]
  23. Wu, C.; Shen, S.; Li, Y.; Luo, G.; Shen, Q.; Gan, Z.; Liu, J. Influence of coarse grain particles on mechanical properties and fracture behavior in multi-modal Al-based metal matrix composites. Powder Technol. 2021, 394, 901–908. [Google Scholar] [CrossRef]
  24. Starink, M.; Syngellakis, S. Shear lag models for discontinuous composites: Fibre end stresses and weak interface layers. Mater. Sci. Eng. A 1999, 270, 270–277. [Google Scholar] [CrossRef] [Green Version]
  25. Bauccio, M.L. (Ed.) ASM Engineered Materials Reference Book, 2nd ed.; ASM International: Novelty, OH, USA, 1994. [Google Scholar]
  26. Dragoi, D.; Üstündag, E.; Clausen, B.; Bourke, M.A. Investigation of thermal residual stresses in tungsten-fiber/bulk metallic glass matrix composites. Scr. Mater. 2001, 45, 245–252. [Google Scholar] [CrossRef]
  27. Faudree, M.; Nishi, Y.; Gruskiewicz, M. Effects of electron beam irradiation on Charpy impact value of short glass fiber (GFRP) samples with random distribution of solidification texture angles from zero to 90 degrees. Mater. Trans. 2012, 53, 1412–2310. [Google Scholar] [CrossRef] [Green Version]
  28. Faudree, M.; Nishi, Y.; Gruskiewicz, M.; Salvia, M. A new glass fibered reinforced composite with improved Charpy impact properties at low and high temperatures beyond the extremes of aircraft flight. Mater. Trans. 2018, 59, 1280–1287. [Google Scholar] [CrossRef]
  29. ASTM D 6110-02; Standard test methods for determining the Charpy impact resistance of notched specimens of plastics. American Society for Testing and Materials: West Conshohocken, PA, USA, 2002.
  30. JIS K 7077; Testing method for Charpy impact strength of carbon fiber reinforced plastics. Japanese Industrial Standards Committee: Tokyo, Japan, 1991. (In Japanese)
  31. Nishi, Y.; Inoue, K.; Salvia, M. Improvement of Charpy Impact of Carbon Fiber Reinforced Polymer by Low Energy Sheet Electron Beam Irradiation. Mater. Trans. 2006, 47, 2846–2851. [Google Scholar] [CrossRef] [Green Version]
  32. Splett, J.; Iyer, H.; Wang, C.; McCowan, C. National Institute of Standards and Technology (NIST) Recommended Practice Guide, Computing Uncertainty for Charpy Impact Test Machine Test Results; Special publication 960-18; US Department of Commerce: Boulder, CO, USA, 2008; pp. 27–29. [Google Scholar]
  33. Nishida, T.; Yasuda, E. Evaluation of Dynamic Properties of Ceramics (In Japanese, Ceramics no Rikigaku Tokusei Hyouka); Nikkan Kogaku Shimbun Sha: Tokyo, Japan, 1986; pp. 50–51. (In Japanese) [Google Scholar]
  34. Weibull, W. A Statistical Theory of the Strength of Materials; Ingeniörs vetenskaps akademien; nr. 151; (Generalstabens litografiska anstalts förlag); Engineer Science Academy, Lithographic Institution Publisher: Stockholm, Sweden, 1939; pp. 12–14. [Google Scholar]
  35. Weibull, W. A Statistical Theory of the Strength of Materials; Ingeniörs vetenskaps akademien; nr. 153; (Generalstabens litografiska anstalts förlag); Engineer Science Academy, Lithographic Institution Publisher: Stockholm, Sweden, 1939; pp. 16–22. [Google Scholar]
  36. Quinn, J.B.; Quinn, G.D. A practical and systematic review of Weibull statistics for reporting strengths of dental materials. Dent. Mater. 2010, 26, 135–147. [Google Scholar] [CrossRef] [Green Version]
  37. Nishi, Y.; Kobayashi, H.; Salvia, M. Effects of Electron Beam Irradiation on Charpy Impact Value of GFRP. Mater. Trans. 2007, 48, 1924–1927. [Google Scholar] [CrossRef] [Green Version]
Figure 1. Rational formulae of (a) thermoset polyester, and (b) styrene butadiene.
Materials 15 01145 g001
Figure 2. GFRP-BMC panel and specimen cutting configuration according to ASTM D 6110-02, taken from Faudree et al. (2018) [28].
Materials 15 01145 g002
Figure 3. Charpy impact tester.
Materials 15 01145 g003
Figure 4. (a) Relationship between Charpy impact value, auc, and fracture probability, Pf, for nominal 6.4 mm and extended mixing 0.44 mm samples in a GFRP-BMC compression-molded panel, with the cumulative of Sections A, B, C and D equaling 56 samples each of the 6.4 and 0.44 mm fiber length sample data sets, respectively; (b) Weibull 2-parameter plots of data in (a).
Materials 15 01145 g004
Figure 5. Optical microscope photos from center A-sections for: (a) nominal 6.4 mm, and (b) 0.44 mm BMC samples, respectively, and a diagram of optical microscopy direction.
Materials 15 01145 g005aMaterials 15 01145 g005b
Figure 6. (a) Relationship between auc and Pf for nominal 6.4 mm and extended mixed 0.44 mm fiber samples, respectively, for A-Sections with θt of random (45) 0 to 90 deg between mold flow and longitudinal direction of testing sample; (b) Weibull 2-parameter plots of data in (a).
Materials 15 01145 g006
Figure 7. (a) Relationship between auc and Pf for nominal 6.4 mm and extended mixed 0.44 mm fiber samples, respectively, for B-Sections with θt of random (45) 0 to 90 deg between mold flow and longitudinal direction of testing sample; (b) Weibull 2-parameter plots of data in (a).
Materials 15 01145 g007
Figure 8. (a) Relationships between auc and Pf for nominal 6.4 mm and extended mixed 0.44 mm fiber samples, respectively, for C-Sections with θt of 45 +/− 10 deg between mold flow and longitudinal direction of testing sample; (b) Weibull 2-parameter plots of data in (a).
Materials 15 01145 g008
Figure 9. (a) Relationship between auc and Pf for nominal 6.4 mm and extended mixed 0.44 mm fiber sample, respectively, for D-Sections with θt of 18 +/− 17.5 deg between mold flow and longitudinal direction of testing sample; (b) Weibull 2-parameter plots of data in (a).
Materials 15 01145 g009
Figure 10. Schematic of increase in spaces between fibers, Sf, showing closer fiber proximity. Total fiber length is illustrated as equal to represent a constant Vf.
Materials 15 01145 g010
Figure 11. (a) Depiction of Figure 4a (all sections cumulative) indicating the 2 lowest auc samples (Pf < 0.03) to be omitted from the 0.44 mm data set for re-evaluation. (b) Resultant graph with omission of 2 lowest auc 0.44 mm samples, showing relationships between auc and Pf.
Materials 15 01145 g011
Figure 12. Iteration of potential impact value (eas) to obtain the statistically lowest impact value as at Pf = 0 by 3-parameter Weibull analysis with the omission of the 2 lowest auc 0.44 mm samples for the data in Figure 11b.
Materials 15 01145 g012
Table 1. GFRP-BMC components.
ComponentMass %
propylene glycol maleate polyester13.75
styrene butadiene copolymer12.75
commercial E-glass fibers11
CaCO3 filler55
aluminum silicate filler3
magnesium hydroxide0.5
proprietary initiators and inhibitors4
Table 2. Compression molding parameters.
ParameterCondition
Mold Pressure5.5–6.9 MPa (800–1000 psi)
Temperature422 K (149 °C)
Cure Time2 min
Mold Typematched metal die compression mold
Panel Size304.8 × 304.8 × 2 mm
Vf (E-glass fibers)0.080
Vf (CaCO3 filler)0.377
Vf (remaining polymer mixture)0.543
Table 3. Fiber lengths.
Fiber LengthsMixing
6.4 mm (1/8 in)20 min
0.44 mm [7,8]20 min +additional 30 min
Table 4. Number of GFRP-BMC samples tested.
Fiber Length (mm)Total
A + B + C + D
ABCD
6.45614141414
0.445614141414
Table 5. Average Charpy impact values, auc, and standard deviations for all texture angles, θt cumulative (56 sample data set), and for each solidification texture angle sub-quadrant, A, B, C, and D. Standard deviations are in brackets.
Charpy Impact Values (kJm−2)
Fiber Length(mm)Total
A + B + C + D
ABCD
6.47.63 (1.85)6.41 (1.24)9.44 (1.61)7.89 (1.28)6.79 (1.64)
0.449.62 (2.80)8.18 (2.27)11.25 (2.11)10.25 (3.79)8.79 (1.72)
% imp26.127.619.129.929.5
Publisher’s Note: MDPI stays neutral with regard to jurisdictional claims in published maps and institutional affiliations.

