Abstract
Complex thermal cycles and stress fields commonly occur in the selective laser melting process for nickel-based superalloys, which are prone to generating cracks and decreasing the performance of forming parts. In this paper, the reasons for cracking were analyzed by combining the experiment with the evolution behavior of the temperature field/stress field during the solidification process of a nickel-based superalloy (FGH96) via a three-dimensional finite element thermo-mechanical coupling model. It showed that a radial temperature distribution of the melting pool led to a similar distributed stress; as a result, the value declined slowly along the scanning direction but declined quickly along the direction perpendicular to the scanning direction. A stress concentration with maximum stress up to 339 MPa was found at the center of the molten pool, easily causing a crack in SLM. It was found that both the initiation and propagation of the cracks were along the grain growth direction and were affected by the epitaxial growth of columnar crystals. For the case of process parameters with relatively high power or low scanning speed, the stress value of the molten pool during solidification was more than 370 MPa so as to form a large area of cracks. The adjustment of the rotation angle between the adjacent layers was effective at avoiding stress accumulation in the building direction and prevent the formation of long grain boundaries, thus avoiding crack propagation. The present study lays a foundation for the wide applications of selective laser melting technologies in nickel-based superalloys.
1. Introduction
With the development of manufacturing technology, the process requirements of existing nickel-based superalloy devices tend to be more integrated, complex, precise, and thin-walled. The traditional nickel-based superalloy manufacturing process is gradually failing to meet the requirements of the existing process [1,2,3]. The “Laser Additive Manufacturing” technology, which has emerged in recent decades, has attracted more and more attention [4]. It is an integrated manufacturing method that adds materials layer by layer in a continuous piling up. It can achieve precision manufacturing for some complex structural parts [5] (truss structure [6], ultra-thin grid [7], etc.). Selective laser melting (SLM) technology has a large temperature gradient and cooling speed [8]. At the same time, because nickel-based superalloys have a high melting point and are easy to crack, it is challenging to use SLM to form them. Consequently, it is crucial to investigate the evolution laws of the temperature field/stress field and its effect on the formation of a crack.
At present, in the research on the stress fields of the laser additive manufacturing of nickel-based superalloys, Mercelis et al. [9] explained the generation mechanism of residual stress by temperature gradients. Later, research on process parameters mainly focused on the influence of scanning strategies to process thermal behavior and stress [10,11,12,13]. The scanning strategy was found to play a significant role in stress distribution, which is anisotropic and has higher thermal stress along the direction of laser scanning. Roberts et al. [14] analyzed in greater detail the effects of process parameters, the scanway length, preheating temperature, and substrate characteristics on residual stress. Along with the effect of process parameters, other researchers also looked at where the overall concentration of residual stress was in the model on a larger scale. Other studies indicated that short distance scanning can effectively reduce stress [15,16]. Denlinger et al. [17] and Li et al. [18] investigated the stress distribution in the multi-layer and multi-pass forming process of superalloys, and their research demonstrated that the stress gradually increased along the deposition height during deposition. Vrancken et al. [19] analyzed the residual stress of the parts produced by SLM, and the results demonstrated that residual stresses significantly impacted the anisotropy of forming.
In addition to the influence of process parameters and building height on the stress field, other studies on thermodynamic coupling attribute cracking to stress [20]. Li et al. [21] studied the stress and crack distribution at different positions in the process of multi-channel scanning, but did not thoroughly study the relationship between them. Marcel et al. [22] discovered that decreasing the diameter of the spot increased the depth of fusion, which in turn reduced the number of cracks by remelting the cracks. The research of Gao et al. [23] demonstrated that the process parameters affect the structure and cracking sensitivity of materials by affecting the cooling rate. Sun et al. [24] found that increasing the scanning speed and scanning distance could reduce cracking sensitivity. It is evident from the studies on the thermal coupling that the effect of temperature field/stress field on cracking during solidification was not thoroughly investigated.
In this study, numerical simulation and experimental validation are merged to reveal the evolution law of the temperature field/stress field of nickel-based superalloys during SLM and to investigate the mechanism of crack formation and propagation. On the basis of the heat conduction theory of continuous mediums, a three-dimensional finite element thermal-mechanical coupling model was constructed, and the temperature field/stress field information, including the change in the temperature gradient and equivalent stress at different locations of the molten pool, were analyzed quantitatively. During solidification, the temperature distribution in the longitudinal section of the molten pool determined the radiant distribution of stress. Experimental results were compared to the simulation results. From the evolution of the temperature and stress fields, the cause of grain boundary cracking at large angles was determined. This lays the groundwork for the widespread application of selective laser melting technology in nickel-based superalloys.
2. Experimental and Computational Procedures
2.1. Experiment
Nickel-based superalloy powders of FGH96 were selected for the experiment, which have a high Ti/Al content, as shown in Table 1. FGH96 has rich elements, including Cr, Co, Mo, Ti, Al, etc., with a complex microstructure evolution that takes place during the solidification process, which has a certain representative in the nickel-base superalloy. Therefore, FGH96 was used as the research material in this study. The powders made using gas atomization had a good spherical shape and a size ranging from 15 to 53 μm, as shown in Figure 1a. SLM is an integrated manufacturing technology that uses a high-energy laser beam to selectively melt the metal powder and stack layer by layer. The XY plane is the laser scanning plane and Z is the building direction, as shown in Figure 1b. The SLM process was performed based on the EP-M260 machine. A reciprocating scanning scheme was used in the experiment. The process parameters of the experiment are shown in Table 2. After the SLM process, metallographic samples were ground, polished, and etched using a mixed chemical reagent of 7 mL HCl, 7 mL C2H5OH and 1.4 g CuSo4 liquids. The microstructure was then observed using an optical microscope (OM) and scanning electron microscope (SEM). The crystal orientation analysis was also performed using electron backscatter diffraction (EBSD).

Table 1.
Chemical composition of FGH96 superalloy powder.

Figure 1.
(a) SEM image of FGH96 powders; (b) Schematic diagram of selective laser melting; (c) Construction of the 3D finite element model.

Table 2.
The used processing parameters in this study.
2.2. Computational Procedures
In order to predict the evolution of the temperature field/stress field in SLM, in this paper, a three-dimensional finite element model was established based on the heat conduction theory of continuum. As shown in Figure 1c, the geometry of the established model was composed of three regions, namely the substrate, powder bed, and forming area. The size of the substrate area was 1500 μm × 600 μm × 260 μm, while that of the powder bed thickness was 40 μm. To save calculation time, non-uniform mesh division was carried out, as shown in Figure 1c. In the process of model construction, a free tetrahedral mesh was used. The suitable mesh sizes of the laser scanning area of the powder layer (12 μm) and substrate (52 μm) were obtained, respectively, using a convergence method of automatic control in the COMSOL Multiphysics software.
The evolution of the temperature field in the selective laser melting process is usually described by the Fourier equation [25] and is expressed as:
where ρ, C are the density and specific heat capacity. kx, ky, and kz are the spatial three thermal conductivity in the spatial coordinate system. T and t are temperature and time, respectively. Q is heat generation and heat per unit volume obtained by laser radiance. The penetration characteristics of laser radiation in the powder bed and the laser with Gaussian distribution in the experiment were considered; a semi-ellipsoidal Gaussian body heat source is, therefore, used as below [26]:
where q0 is the coefficient derived from the conservation of energy, given as:
where x, y, z are position coordinates; a, b, c are ellipsoidal semiaxis; β represents the laser absorption rate of the material; P represents the laser power input to the powder bed.
The boundary conditions, including convection and radiation, were considered in the model as follows:
where qc and qr represent the heat flux of convection and radiation. ω is the radiation coefficient (0.8), φ is the Stephen–Boltzmann constant (5.67 × 10⁻⁸ W/(m2·K4)), hc is the convective coefficient (80 W/(m2·K)), T1 is the material temperature, and T0 is the substrate temperature (80 °C).
The phase change was also considered in the simulation, and the enthalpy changes of the material, represented by heat capacity, can also be described below [27]:
where H is the latent heat of phase transformation, ΔTm is the melting range, Cp is the heat capacity, and Tm is the melting temperature (1553 K) [28].
Assuming FGH96 is an isotropic material, the stress–strain relationship in the Cartesian coordinate system can be expressed as [29]:
where E is the elastic modulus and α is the thermal expansion coefficient.
In the process of establishing the finite element model in this paper, the Von Mises yield criterion was used to analyze the deformation of the materials. The formula of the equivalent force is:
The formula of the equivalent strain is:
where σ1, σ2, σ3 are the principal stress in three directions and ε1, ε2, ε3 are the principal strain in three directions. μ is Poisson’s ratio.
3. Results and Discussion
3.1. Experiment Results
3.1.1. Experiment Results of Different Process Parameters
Figure 2 shows the macroscopic morphology characteristics of the samples under different process parameters. It can be seen from the figure that the influence of the scanning speed on the number of cracks is greater than that of the power. Under the same laser power, with the scanning speed increased from 800 mm/s to 1200 mm/s, the number and length of the cracks decreased. At the same time, incomplete fusion holes gradually appeared. In addition, under the same scanning speed and increased laser power from 260 W to 280 W, the remelting of the latter layer on the previous layer accumulated, and the length of the cracks gradually became shorter while the number of cracks gradually decreased. This is consistent with the research results of others [22]. However, when the laser power increased to 280 W, the heat input exceeded the requirement of crack fusion, which increased the temperature gradient and the internal stress between the layers leading to the emergence of a large number of cracks again.
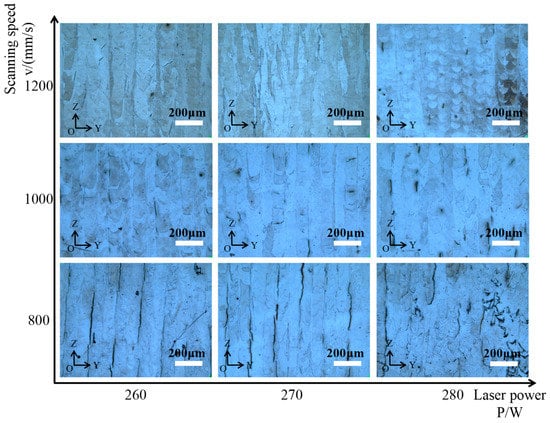
Figure 2.
Sample YOZ cross-section under different process parameters.
Figure 3 shows the molten pool morphology of the XOZ plane of samples prepared at rotation angles of 67° and 90° between the adjacent layers. At the interlayer rotation angle of 67°, the molten pool trajectories between the adjacent layers were not obviously regular, which led to the preferential growth of dendrites with different orientations, resulting in irregular columnar or equiaxed grain structures. The disorderly grain boundaries also inhibited the propagation of microcracks. At an interlayer angle of 90°, the molten pool trajectories of the two adjacent layers were perpendicular to each other, and the subsequent thermal cycling process of layer-by-layer scanning produced a relatively vertical and thick columnar grain structure, which also provided a continuous channel for the initiation and propagation of microcracks, making it easy to form long and straight cracks.

Figure 3.
Molten pool morphology of YOZ surface of samples prepared at different rotation angles between adjacent layers. (a) 67°; (b) 90°.
3.1.2. Crack Morphology
Figure 4 shows the microstructure variation with the EBSD analyses. It can be seen that most of the crystals are columnar and are mainly along the building direction. The growth of the columnar crystals is mainly along the <001> direction. More than 50% of the columnar crystals are longer than 80 μm, with the largest reaching 240 μm, as shown in Figure 4d. Figure 4e shows that most of the grain boundaries belong to the small angle boundaries and are mainly located between 3 and 6 degrees, except for a few large angle boundaries over 50 degrees. Additionally, cracks are also found along the large angle grain boundary, as seen in the red dashed circle in Figure 4b.
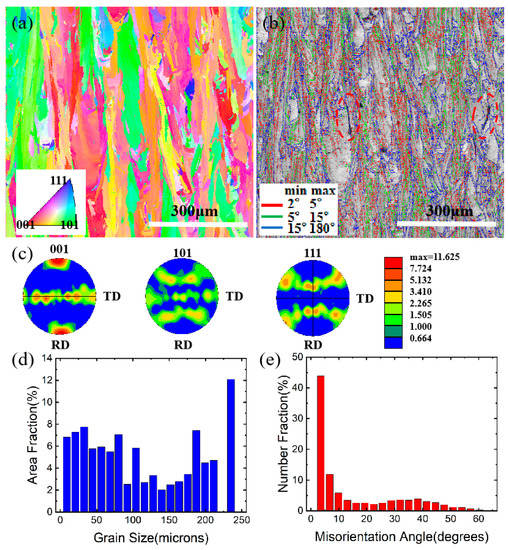
Figure 4.
EBSD analyses. (a) grain morphology; (b) grain boundary angle distribution; (c) inverse pole figure; (d) grain size statistical diagram; (e) grain boundary angle statistical diagram.
Figure 5a shows a typical solidification crack. Solidification cracks are generated in the solidification process of the molten pool, so there is nothing in common between the morphology of both sides of the cracks. It can be seen from Figure 5a that the crack originates in the cellular crystal zone, that is, in the central area of the molten pool in the previous layer. During the subsequent solidification process, the molten metal fed the cracks to a certain extent, but the accompanying thermal stress continued to act on both sides of the cracks, resulting in insufficient feeding and expanding of the cracks. At the same time, some solidified molten metal can be left in the cracks, as shown in Figure 5b.

Figure 5.
(a) Solidification crack; (b) Local amplification of the area inside the dotted box in (a); (c) Solid crack; (d) Local amplification of (c).
Figure 5c shows a typical solid crack. This is due to the continuous thermal influence of the forming area during the manufacturing process, which leads to stress concentration and directly tears the weak parts of the forming area. It can be seen from Figure 5d that there are some precipitates and holes around the crack source. Many studies [30,31,32] considered that the cracking of nickel-based superalloys was caused by liquefaction cracking due to the presence of the low melting point phase. A solid crack is a kind of crack formed in the solid region after complete solidification. Therefore, the shapes on both sides of the crack coincide to a high degree, and there are no impurities in the crack. As shown in Figure 5d, cracks occur along the grain boundaries under tensile stress. Remarkably, it was found that in addition to liquefaction cracks, solid cracks and solidification cracks exist simultaneously in the forming region, and all kinds of cracks do not exist alone but have a certain relationship. This is consistent with the experimental phenomenon observed in reference [33].
3.2. Simulation Results
3.2.1. Model Verification
Figure 6 depicts the molten pool morphology when the selective laser melting parameters are 270 W and 1200 mm/s. For the FGH96, its melting point is about 1553 K. The length, and width of the molten pool are the longest melting lines on the x and y axes, respectively; the depth of the molten pool is the melting line from the surface of the powder layer to the bottom of the molten pool along the z-axis. Figure 6a,b shows the profiles of the molten pool XOY and XOZ. The length of the molten pool is 216 μm and the width is 92 μm; Figure 6c shows the molten pool profile on the YOZ surface of the molten pool and the depth of the molten pool, which is 45 μm. Figure 6d shows the experimental results of the longitudinal section of the molten pool under the same process parameters. The width of the molten pool is 98 μm, and the depth is 42 μm. Therefore, although there is a certain error between the simulation and the experimental results, it is within the acceptable range. The accuracy of this model is verified.

Figure 6.
Model verification. (a) Temperature field simulation results of the XOY section; (b) Temperature field simulation results of the XOZ section; (c) Temperature field simulation results of the YOZ section; (d) Morphology of the molten pool in the experiment.
3.2.2. Quantitative Thermal Behavior within the Molten Pool
Figure 7 shows the distributions of the temperature gradient within the melting pool along the Y and Z directions. The temperature gradient at the bottom of the molten pool in the Gz direction was the largest, and the farther away from the bottom of the molten pool, the smaller the temperature gradient in the Gz direction became. In the Gy direction, the temperature gradient on both sides of the molten pool was the largest and had a certain symmetry. In order to study the evolution law of the temperature field in different positions of the molten pool, the temperature and temperature gradient changes of G1 and G2 points in the molten pool were selected, as shown in Figure 8a,c,d. The temperature gradient changes in the different directions from point A in the center of the molten pool to S1, S2, and S3 are shown in Figure 8b.

Figure 7.
Simulated temperature gradients along the (a) Y direction for the melting pool (Gy); (b) Z direction for the melting pool (Gz).
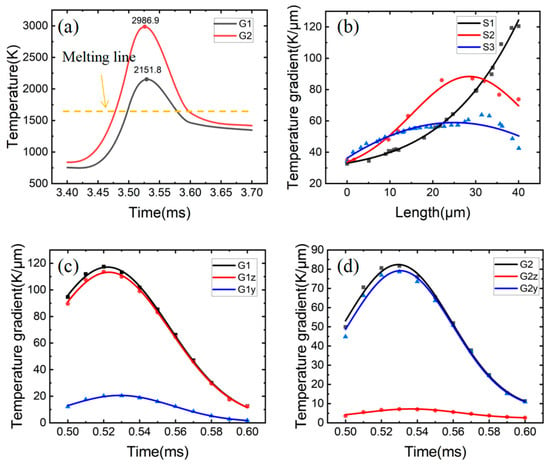
Figure 8.
Model verification. (a) Temperature change at different positions of molten pool; (b) Map of temperature gradient with location; (c) Temperature gradient at the bottom of molten pool; (d) Temperature gradient on both sides of molten pool.
Figure 8b shows the evolution of the temperature gradient at different positions of the molten pool, the position of which can be seen as the temperature gradient at the center line of the molten pool increases from 3.2 × 10⁷ K/m to 1.2 × 10⁸ K/m and further away from point A. Because the temperature gradient along the Z direction and at the center line is dominant, reaching the maximum at the bottom of the molten pool, the temperature gradient at both sides of the molten pool first increases to 8.7 × 10⁷ K/m and then decreases with the distance from point A. This is because the temperature gradient along the Y direction on both sides of the molten pool plays a dominant role, reaching the peak value of the temperature gradient along the Y direction first and then decreasing.
In the G2 point, a temperature gradient of about 8 × 10⁷ K/m is formed along the Y direction, which is much greater than G2z, and G2y plays a leading role, as shown in Figure 8d. At the bottom of the molten pool (G1), there was a huge temperature gradient (about 1.2 × 10⁸ K/m) along the Z direction, which was much larger than that of G1y and played a dominant role. It is easy to meet the dendrite growth conditions, resulting in the rapid epitaxial growth of dendrites along the Z direction, as shown in Figure 8c. From the temperature curve in Figure 8a, it can be seen that the temperature is the lowest, and the corresponding solidification time is the shortest at the bottom of the molten pool.
3.2.3. Stress Field Information within the Molten Pool
The stress field of the molten pool in the YOZ section is shown in Figure 9a. It can be seen that the stress value near the center of the molten pool is the highest and that the value decreases as one moves away from the center. The stress value varies in three directions, which is shown in Figure 9c: from 339 MPa to 173 MPa in the P1 (Y) direction, from 339 MPa to 245 MPa in the P3 (Z) direction, and from 339 MPa to 238 MPa in the P2 direction. The stress field of the molten pool in the XOZ section is depicted in Figure 9b. It can be concluded that the stress value at the front end of the molten pool is the highest and that the stress value decreases with the distance from the center of the molten pool. Correspondingly, the stress value of the molten pool decays the slowest at the tail of the pool (X direction). It is due to the residual temperature in the tail of the molten pool that results in thermal expansion. On both sides of the molten pool (Y direction), the reduction in stress is the quickest. During solidification, the temperature distribution in the longitudinal section of the molten pool determines the radiant distribution of stress.

Figure 9.
(a) Simulation results of YOZ section stress field; (b) Simulation results of XOZ section stress field; (c) Stress value distribution in different paths of YOZ section; (d) Stress value distribution in different paths of XOZ section.
3.3. Effect of the Process Parameter of SLM
Figure 10a,b shows the temperature change at the center of the molten pool under different process parameters. It is obvious that the temperature change trend is consistent regardless of the power or scanning speed. During the selective laser melting process, when the laser power remains constant and the scanning speed increases to 200 mm/s, the maximum temperature of the molten pool decreases by approximately 250 K. With a 10 W increase in laser power, the maximum temperature of the molten pool increases by approximately 170 K at a constant scanning speed.
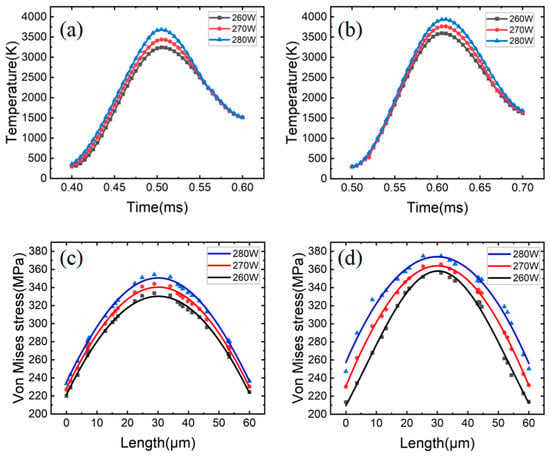
Figure 10.
Temperature variation under different process parameters (a) 1200 mm/s; (b) 1000 mm/s. Change in stress value under different process parameters (c) 1200 mm/s; (d) 1000 mm/s.
Figure 10c,d exhibits the variation in the Von Mises equivalent residual stress value in the center of the molten pool as a consequence of the process parameters. It can be noted that the stress value has a similar trend of variation across various process factors. With a constant laser power and a 200 mm/s increase in scanning speed, the maximum residual stress in the molten pool drops by approximately 21 MPa. With a 10 W increase in laser power and a constant scanning speed, the maximum residual stress in the molten pool falls by approximately 12 MPa.
Figure 11a depicts the fracture shape as a function of various process parameters. When the energy input per unit of time is high, the temperature differential in the molten pool is greater, and it is easier to build a developing columnar dendritic, which makes it harder for the molten metal to flow instantly and leaves gaps between the dendrites. Figure 10d demonstrates the simulation result that the higher the power, the higher the residual stress in the molten pool, and the easier it is to rip at the gap, leading to the creation of large-area solidification fissures, as depicted in Figure 11b.
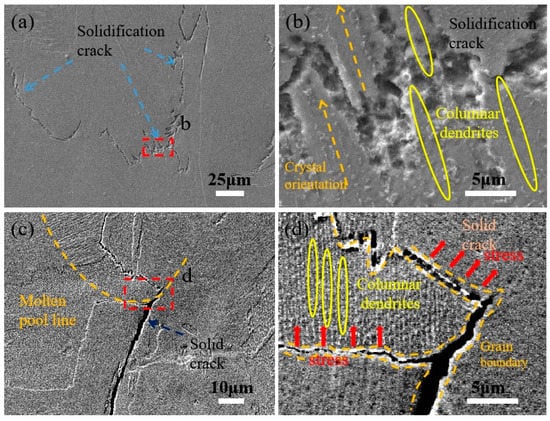
Figure 11.
Crack morphology at high power, low scanning speed, and 90° interlaminar angle. (a) Solidification crack; (b) Local amplification of the area inside the dotted box in (a); (c) Solid crack; (d) Local amplification of (c).
Figure 11c,d displays solid fractures with an interlaminar angle of 90°. The scanning traces of the molten pool are stacked parallel along the z-axis, one layer apart, at an interlaminar angle of 90°, which is more favorable to the epitaxial growth of the dendrites, and hence, generates a long grain boundary. Additionally, the crack will extend along the grain boundary. In the meantime, an increase in the power will cause an increase in stress, which causes cracks not only at the high-stress concentration area in the center of the molten pool but also along the grain boundary at the bottom of the molten pool.
3.4. Effect of Stress Distribution on Crack
During the solidification process of a molten pool, the stress is predominantly distributed in the pool’s core region, corresponding with Mukherjee’s results [34]. Figure 12a depicts the beginning of a central crack. The accumulation of the precipitated phase at the grain boundary, which tears under the influence of stress and creates the initial fracture, is responsible for the initiation of cracks. In the layer-by-layer manufacturing process, as the building height grows, the dendrites continue to develop following the dendrite direction of the preceding layer and ultimately form columnar crystals [35,36,37]. In addition, the lengthy grain boundaries traverse the multilayered molten pool. Similar to the findings of other studies [9,38,39], the tension at the center of the molten pool increases along the building’s longitudinal axis. Since the molten pool is in the same building direction, the stress direction in the center of each molten pool layer is identical. As demonstrated in Figure 12b, the crack propagates along the grain boundary when the stress exceeds the fracture strength.
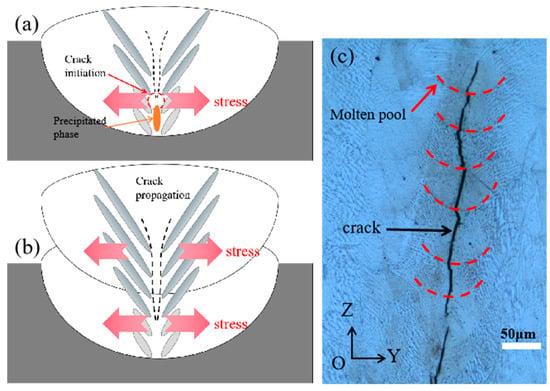
Figure 12.
(a) Initiation of crack; (b) Propagation of crack; (c) Crack in experiment.
4. Conclusions
In this research, a three-dimensional finite element coupled thermo-mechanical model was constructed, the temperature field/stress field information, including the change of temperature gradient and equivalent stress at different locations of the molten pool, was analyzed quantitatively. From the evolution of the temperature and stress fields, the cause of grain boundary cracking at large angles was determined. Finally, the process parameters were optimized based on the finite element simulation and experimental results. The major findings of the study are as follows:
- During the solidification of the molten pool, the highest temperature gradients on the pool’s bottom and both sides reached 1.2×10⁸ K/m and 8×10⁷ K/m, respectively. The temperature distribution in the longitudinal portion of the molten pool caused the radiant distribution of stress. The stress value decreases slowly in the direction of scanning but rapidly in the direction perpendicular to scanning. The maximum stress of approximately 339 MPa.
- The stress concentration and precipitated phase enrichment in the middle of the molten pool of each layer caused crack initiation. The stress increased along the building direction. When the stress exceeded the fracture strength, the crack propagated along the grain boundary.
- For the case of process parameters with relatively high power or low scanning speed, the stress value of the molten pool during solidification was more than 370 MPa so as to form a large area of cracks. The adjustment of the rotation angle between the adjacent layers was effective at avoiding stress accumulation in the building direction and prevent the formation of long grain boundaries, thus avoiding crack propagation.
Author Contributions
Methodology, investigation, validation, writing—original draft, S.N.; data curation, L.L.; investigation, validation, writing—review and editing, Q.W.; validation, data curation, R.Z.; funding acquisition, supervision, X.L.; supervision, writing—original draft, writing—review and editing, F.L. All authors have read and agreed to the published version of the manuscript.
Funding
This work was supported by the fund of the state Key Laboratory of Solidification Processing in NWPU, (Grant No. SKLSP202112).
Institutional Review Board Statement
Not applicable.
Informed Consent Statement
Not applicable.
Data Availability Statement
Data are contained within the article.
Acknowledgments
The authors acknowledge the fund of the state Key Laboratory of Solidification Processing in NWPU, (Grant No. SKLSP202112).
Conflicts of Interest
The authors declare no conflict of interest.
References
- Attia, H.; Tavakoli, S.; Vargas, R.; Thomson, V. Laser-assisted high-speed finish turning of superalloy Inconel 718 under dry conditions. CIRP Ann. Manuf. 2010, 59, 83–88. [Google Scholar] [CrossRef]
- Li, A.; Pang, J.; Zhao, J.; Zang, J.; Wang, F. FEM-simulation of machining induced surface plastic deformation and microstructural texture evolution of Ti-6Al-4V alloy. Int. J. Mech. Sci. 2017, 123, 214–223. [Google Scholar] [CrossRef]
- Revuru, R.; Posinasetti, N.; Ramana, V.; Amrita, M. Application of cutting fluids in machining of titanium alloys-a review. Int. J. Adv. Des. Manuf. Technol. 2017, 91, 2477–2498. [Google Scholar] [CrossRef]
- Sun, F.; Qu, S.; Li, G.; Pan, Y.; Li, X. Comparison of the machinability of titanium alloy forging and powder metallurgy materials. Int. J. Adv. Des. Manuf. Technol. 2016, 85, 1529–1538. [Google Scholar] [CrossRef]
- Leuders, S.; Thone, M.; Riemer, A.; Niendorf, T.; Troster, T.; Richard, H.; Maier, H. On the mechanical behaviour of titanium alloy TiAl6V4 manufactured by selective laser melting: Fatigue resistance and crack growth performance. Int. J. Fatigue. 2013, 48, 300–307. [Google Scholar] [CrossRef]
- Markhoff, J.; Wieding, J.; Weissmann, V.; Pasold, J.; Jonitz, A.; Bader, R. Influence of Different Three-Dimensional Open Porous Titanium Scaffold Designs on Human Osteoblasts Behavior in Static and Dynamic Cell Investigations. Materials 2015, 8, 5490–5507. [Google Scholar] [CrossRef]
- Dittrich, T.; Sieber, I.; Henrion, W.; Rauseher, S.; Wanderka, N.; Rappich, J. Selective laser induced melting of ultrathin nanoporous silicon layers. Appl. Phys. A 1996, 63, 467–470. [Google Scholar] [CrossRef]
- Gan, Z.; Liu, H.; Li, S.; He, X.; Yu, G. Modeling of thermal behavior and mass transport in multi-layer laser additive manufacturing of Ni-based alloy on cast iron. Int. J. Heat Mass Transfer. 2017, 111, 709–722. [Google Scholar] [CrossRef]
- Mercelis, P.; Jean-Pierre Kruth, J. Residual stresses in selective laser sintering and selective laser melting. Rapid. Prototyp. J. 2006, 12, 254–265. [Google Scholar] [CrossRef]
- Bian, P.; Shi, J.; Liu, Y.; Xie, Y. Influence of laser power and scanning strategy residual stress distribution in additively manufactured 316L steel. Opt. Laser. Technol. 2020, 132, 106477. [Google Scholar] [CrossRef]
- Ali, H.; Ghadbeigi, H.; Mumtaz, K. Effect of scanning strategies on residual stress and mechanical properties of Selective Laser Melted Ti6A14V. Mater. Sci. Eng. A 2018, 712, 175–187. [Google Scholar] [CrossRef]
- Song, J.; Wu, W.; Zhang, L.; He, B.; Lu, L.; Ni, X.; Long, Q.; Zhu, G. Role of scanning strategy on residual stress distribution in Ti-6Al-4V alloy prepared by selective laser melting. Optik 2018, 170, 342–352. [Google Scholar] [CrossRef]
- Yadroitsev, I.; Yadroitsava, I. Evaluation of residual stress in stainless steel 316L and Ti6Al4V samples produced by selective laser melting. Virtual Phys. Prototyp. 2015, 10, 67–76. [Google Scholar] [CrossRef]
- Roberts, I.; Wang, C. Investigation of Residual Stresses in the Laser Melting of Metal Powders in Additive layer Manufacturing. Ph.D. Thesis, University of Wolverhampton, Wolverhampton, England, 2012; pp. 134–177. [Google Scholar]
- Wu, A.; Brown, D.; Kumar, M.; Gallegos, G.; King, W. An experimental investigation into additive manufacturing-induced residual stresses in 316L stainless steel. Metall. Mater. Trans. A 2014, 45, 6260–6270. [Google Scholar] [CrossRef]
- Parry, L.; Ashcroft, I.; Wildman, R. Understanding the effect of laser scan strategy residual stress in selective laser melting through thermo-mechanical simulation. Addit. Manuf. 2016, 12, 1–15. [Google Scholar] [CrossRef]
- Denlinger, E.; Gouge, M.; Irwin, J.; Michaleris, P. Thermomechanical model development and in situ experimental validation of the Laser Powder-Bed Fusion process. Addit. Manuf. 2017, 16, 73–80. [Google Scholar] [CrossRef]
- Li, Y.; Zhou, K.; Tan, P.; Tor, S.; Chua, C.; Leong, K. Modeling temperature and residual stress fields in selective laser melting. Int. J. Mech. Sci. 2018, 136, 24–35. [Google Scholar] [CrossRef]
- Vrancken, B.; Cain, V.; Knutsen, R. Residual stress via the contour method in compact tension specimens produced via selective laser melting. Scr. Mater. 2014, 87, 29–32. [Google Scholar] [CrossRef]
- Zhao, Z.; Li, L.; Tan, L.; Bai, P.; Li, J.; Wu, L.; Liao, H.; Cheng, Y. Simulation of Stress Field during the Selective Laser Melting Process of the Nickel-Based Superalloy, GH4169. Materials 2018, 11, 1525. [Google Scholar] [CrossRef]
- Li, Z.; Yang, S.; Liu, B.; Liu, W.; Kuai, Z.; Nie, Y. Simulation of temperature field and stress field of selective laser melting of multi-layer metal powder. Opt. Laser. Technol. 2021, 140, 106782. [Google Scholar] [CrossRef]
- Marcel, G.; Michael, C.; Josef, S.; Konrad, W. Focus shift analysis, to manufacture dense and crack-free SLM-processed CM247LC samples. J. Mater. Process. Technol. 2021, 289, 116948. [Google Scholar]
- Gao, P.; Huang, W.; Yang, H.; Jing, G.; Liu, Q.; Wang, G.; Wang, Z.; Zeng, X. Cracking behavior and control of β-solidifying Ti-40Al-9V-0.5Y alloy produced by selective laser melting. J. Mater. Sci. Technol. 2020, 39, 144–154. [Google Scholar] [CrossRef]
- Sun, S.; Zhang, L.; Liu, J.; Zhang, H. Microstructure, cracking behavior and control of Al–Fe–V–Si alloy produced by selective laser melting. Rare. Met. 2017, 1–10. [Google Scholar] [CrossRef]
- Li, Y.; Gu, D. Thermal behavior during selective laser melting of commercially pure titanium powder:Numerical simulation and experimental study. Addit. Manuf. 2014, 1, 99–109. [Google Scholar]
- Fu, C.; Guo, Y. Three-Dimensional Temperature Gradient Mechanism in Selective Laser Melting of Ti-6Al-4V. J. Manuf. Syst. 2014, 136, 061004. [Google Scholar] [CrossRef]
- Hosaeus, H.; Seifter, A.; Kaschnitz, E.; Pottlacher, G. Thermophysical properties of solid and liquid Inconel 718 alloy. Scand. J. Metall. 2002, 31, 161–168. [Google Scholar] [CrossRef]
- Chen, S.; Wei, D.; Wang, J.; Wang, Y.; Jiang, X. Experimental and modeling investigation of the creep-fatigue interactive deformation behavior of PM super alloy FGH96 at evaluated temperature. Mater. Sci. Eng. A 2019, 749, 106–117. [Google Scholar] [CrossRef]
- Hussein, A.; Hao, L.; Yan, C.; Everson, R. Finite element simulation of the temperature and stress fields in single layers built without-support in selective laser melting. Mater. Des. 2013, 52, 638–647. [Google Scholar] [CrossRef]
- Ojo, O.; Richards, N.; Chaturvedi, M. Contribution of constitutional liquation of gamma prime precipitate to weld HAZ cracking of cast Inconel 738 superalloy. Scr. Mater. 2004, 50, 641–646. [Google Scholar] [CrossRef]
- Ojo, O.; Chaturvedi, M. On the role of liquatedyprecipitates in weld heat affected zone microfissuring of a nickel-based superalloy. Mater. Sci. Eng.A 2005, 403, 77–86. [Google Scholar] [CrossRef]
- Rush, M.; Colegrove, P.; Zhang, Z. Liquation and post-weld heat treatment cracking in Rene 80 laser repair welds. J. Mater. Process. Technol. 2012, 212, 188–197. [Google Scholar] [CrossRef]
- Zhong, M.; Sun, H.; Liu, W.; Zhu, X.; He, J. Boundary liquation and interface cracking characterization in laser deposition of Inconel 738 on directionally solidified Ni-based superalloy. Scr. Mater. 2005, 53, 159–164. [Google Scholar] [CrossRef]
- Mukherjee, T.; Zhang, W.; DebRoy, T. An improved prediction of residual stresses and istortion in additive manufacturing. Comp. Mater. Sci. 2017, 126, 360–372. [Google Scholar] [CrossRef]
- Liu, Z.; Qi, H. Effects of processing parameters on crystal growth and microstructure formation in laser powder deposition of single-crystal superalloy. J. Mater. Process. Technol. 2014, 216, 19–27. [Google Scholar] [CrossRef]
- Liu, Z.; Wang, Z. Effect of substrate preset temperature on crystal growth and microstructure formation in laser powder deposition of single-crystal superalloy. J. Mater. Sci. Technol. 2018, 34, 2116–2124. [Google Scholar] [CrossRef]
- Liu, Z.; Shu, J. Control of the microstructure formation in the near-net-shape laser additive tip-remanufacturing process of single-crystal superalloy. Opt. Laser Technol. 2021, 133, 106537. [Google Scholar] [CrossRef]
- Frenk, A.; Marsden, C.; Wagniere, J.; Vannes, A.; Laracine, M.; Lormand, M. Influence of an intermediate layer on the residual-stress field in a laser clad. Surf. Coat. Technol. 1991, 45, 435–441. [Google Scholar] [CrossRef]
- Eskin, D.; Suyitno; Katgerman, L. Mechanical properties in the semi-solid state and hot tearing of aluminium alloys. Prog. Mater. Sci. 2004, 49, 629–711. [Google Scholar] [CrossRef]
Publisher’s Note: MDPI stays neutral with regard to jurisdictional claims in published maps and institutional affiliations. |
© 2022 by the authors. Licensee MDPI, Basel, Switzerland. This article is an open access article distributed under the terms and conditions of the Creative Commons Attribution (CC BY) license (https://creativecommons.org/licenses/by/4.0/).