


Effect of h-BN Support on Photoluminescence of ZnO Nanoparticles: Experimental and Theoretical Insight

 , , , , and
Abstract
1. Introduction
2. Materials and Methods
2.1. Materials
2.2. Synthesis
2.3. Characterization
2.4. Quantum-Chemical Calculations
3. Results
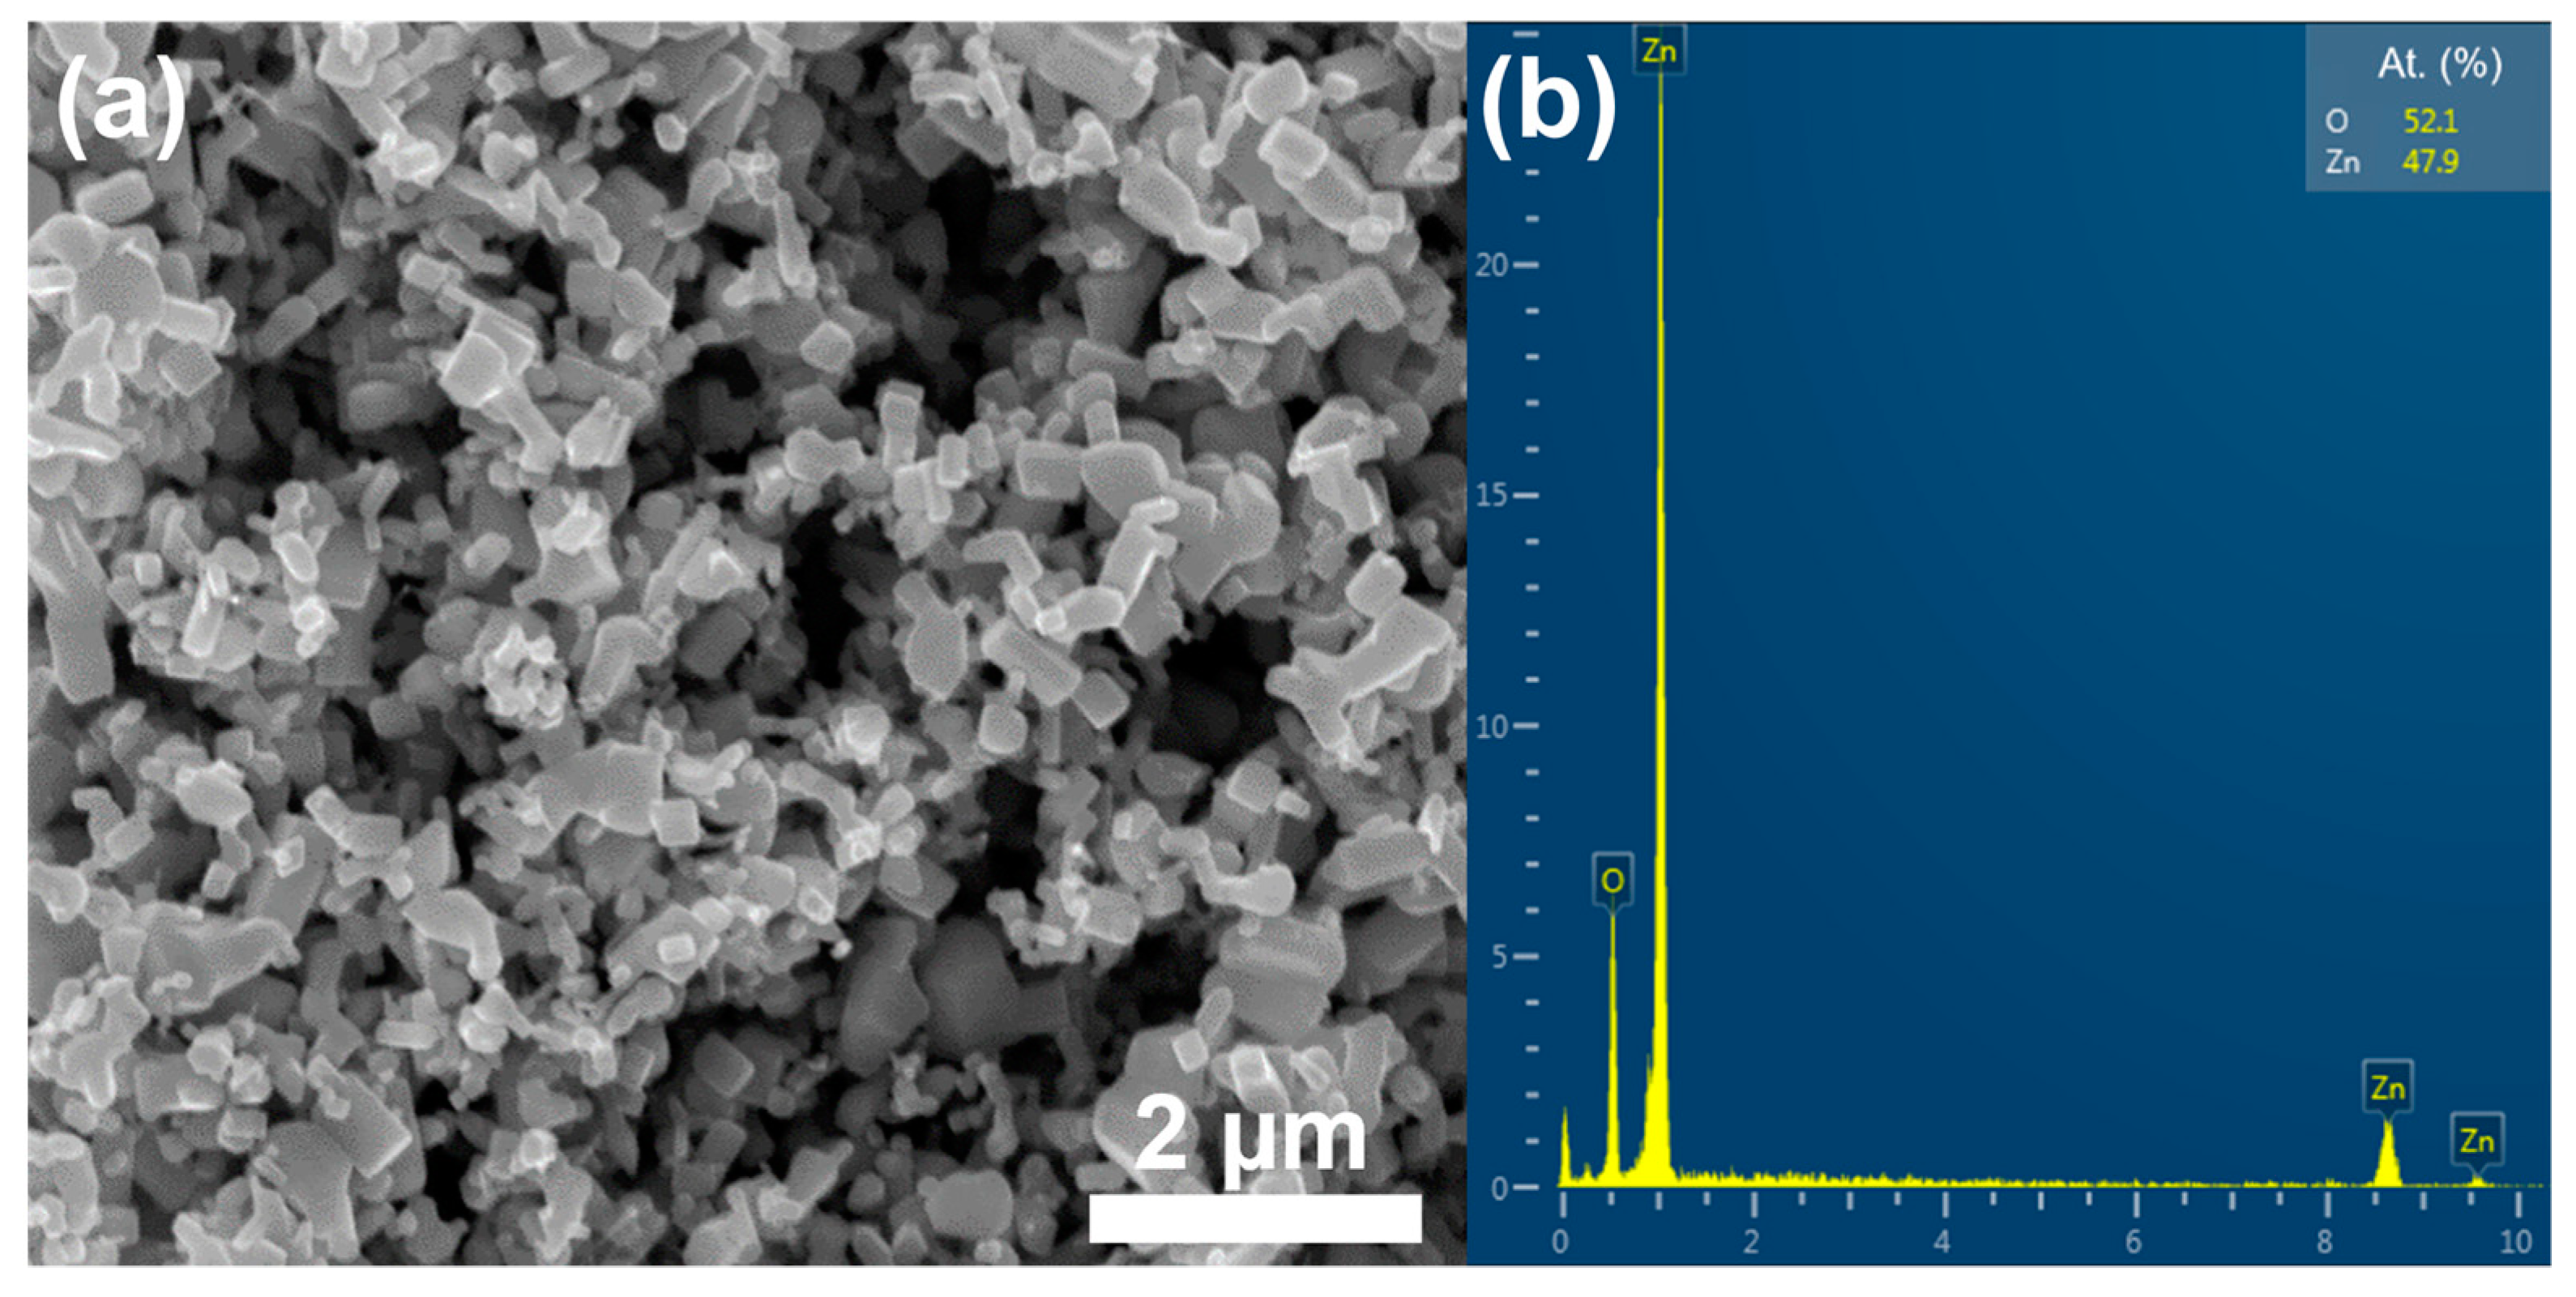
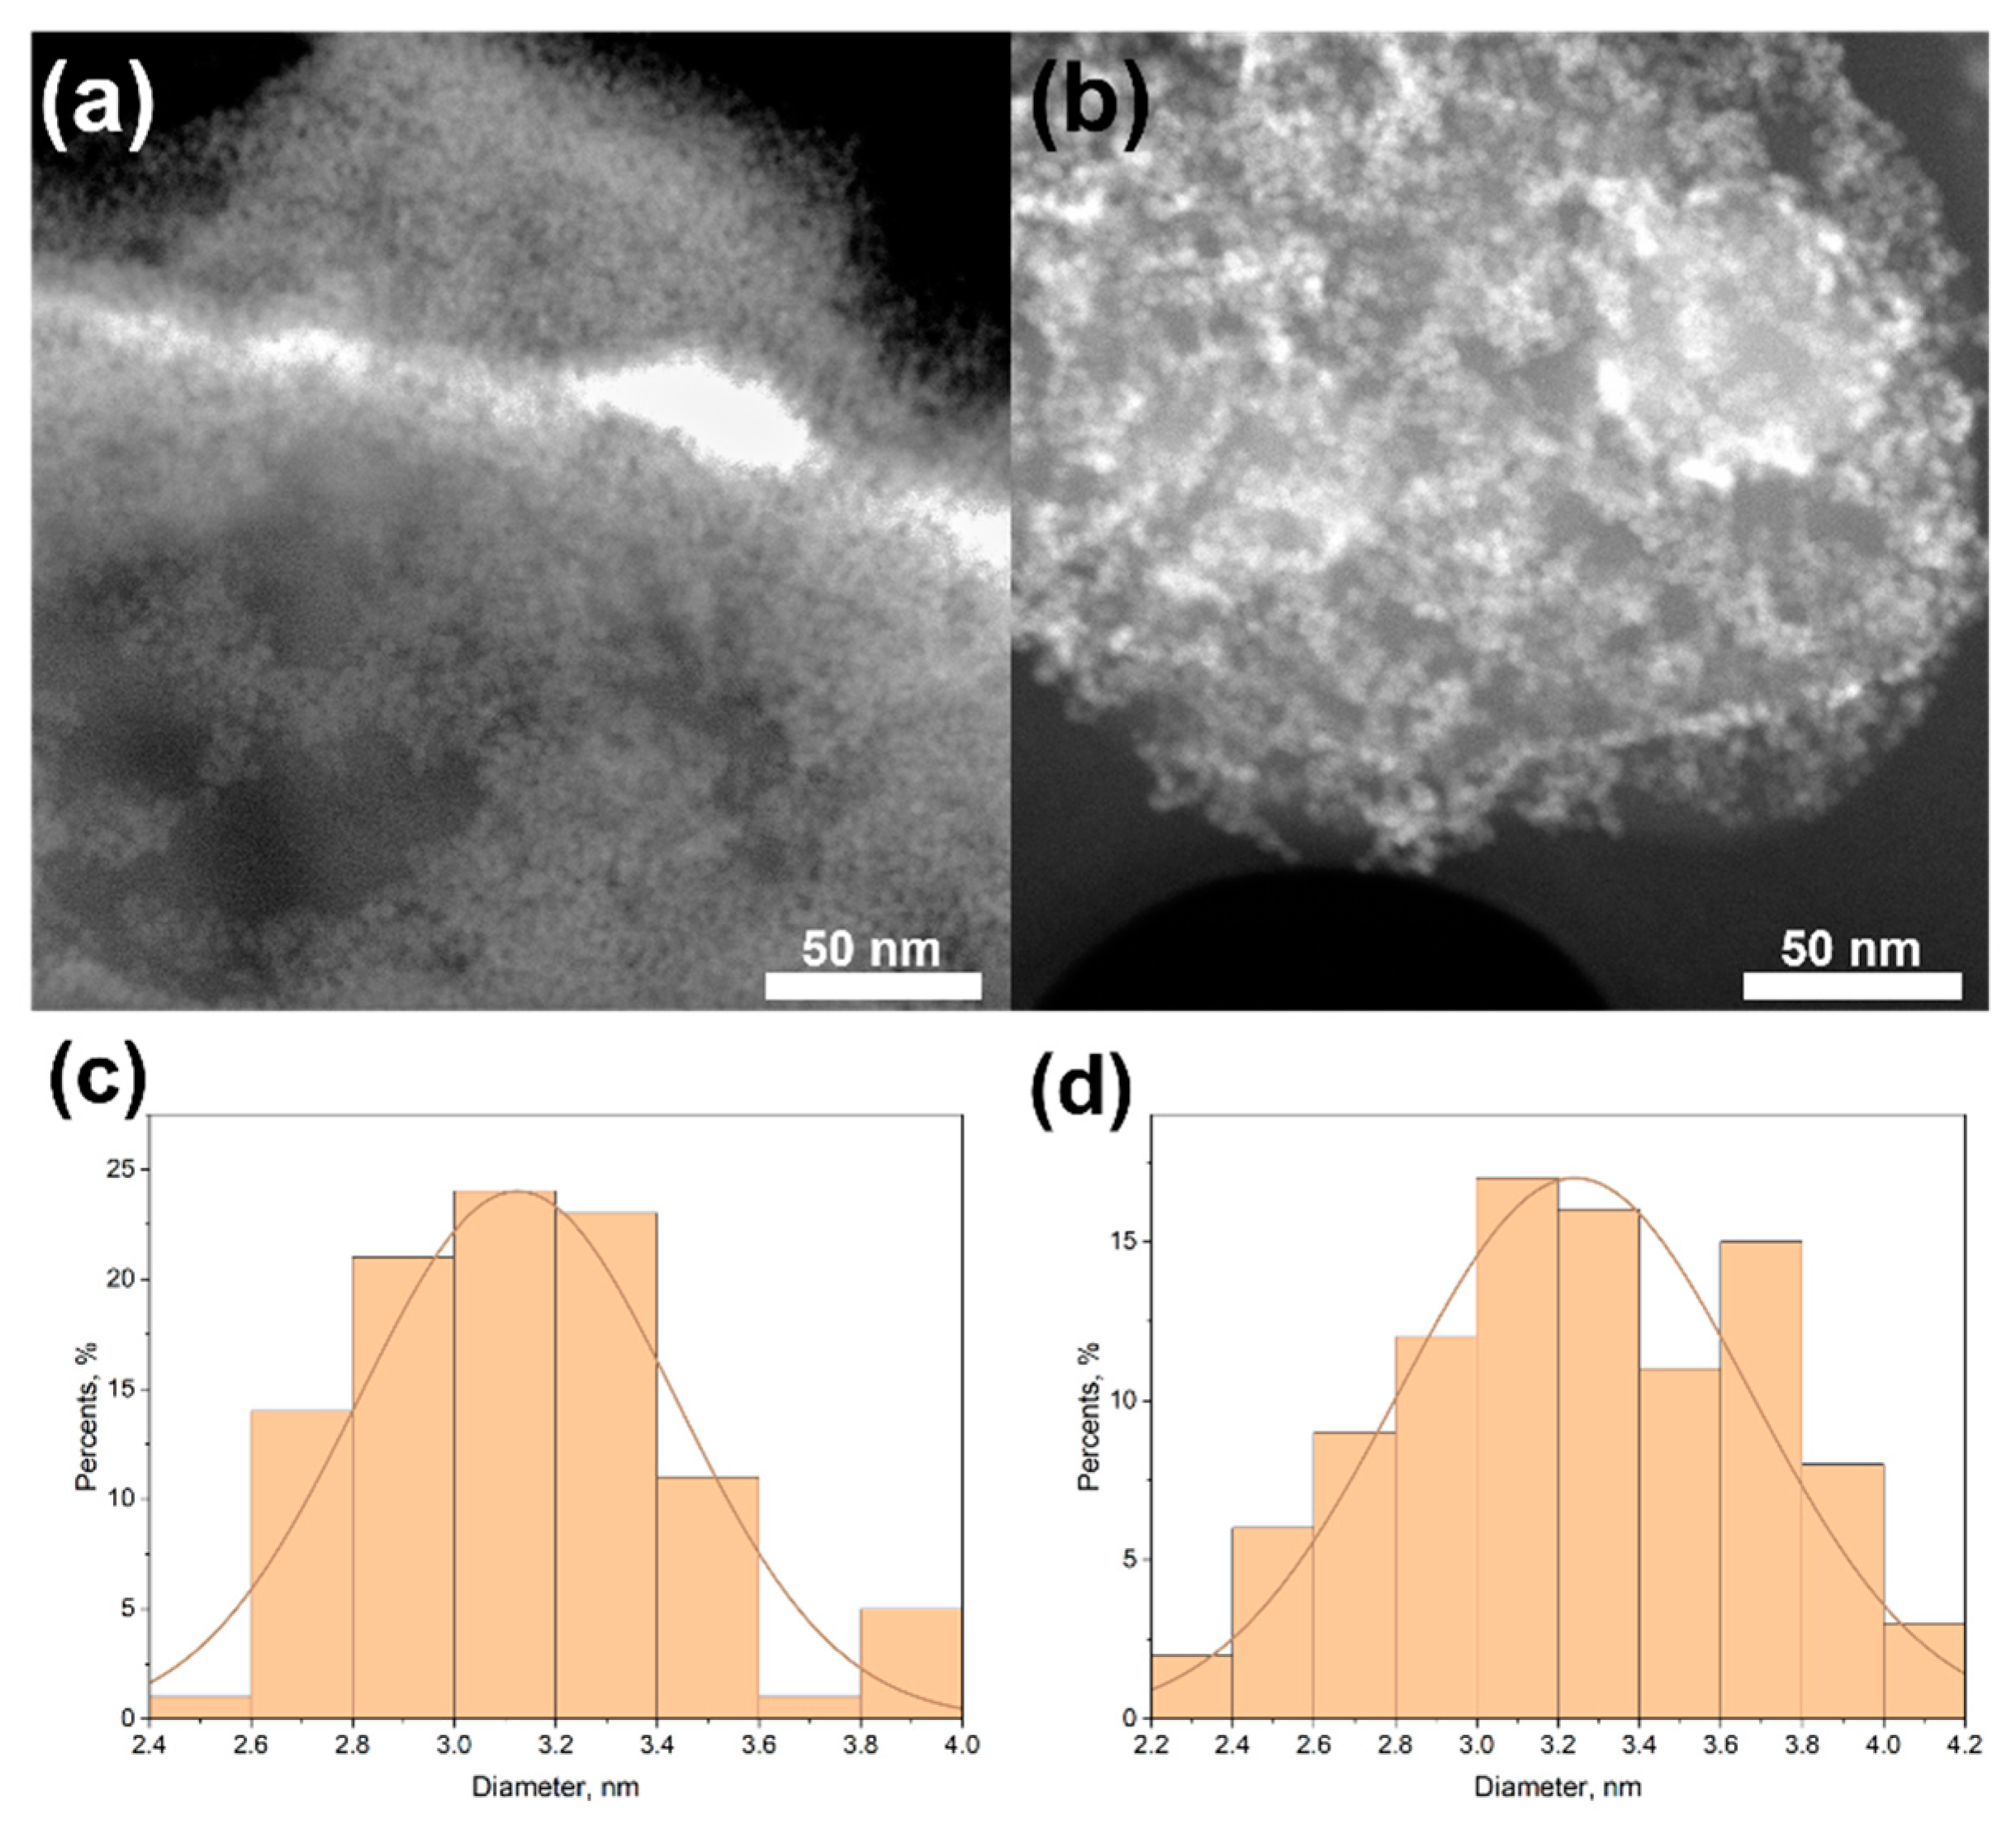
3.1. TEM
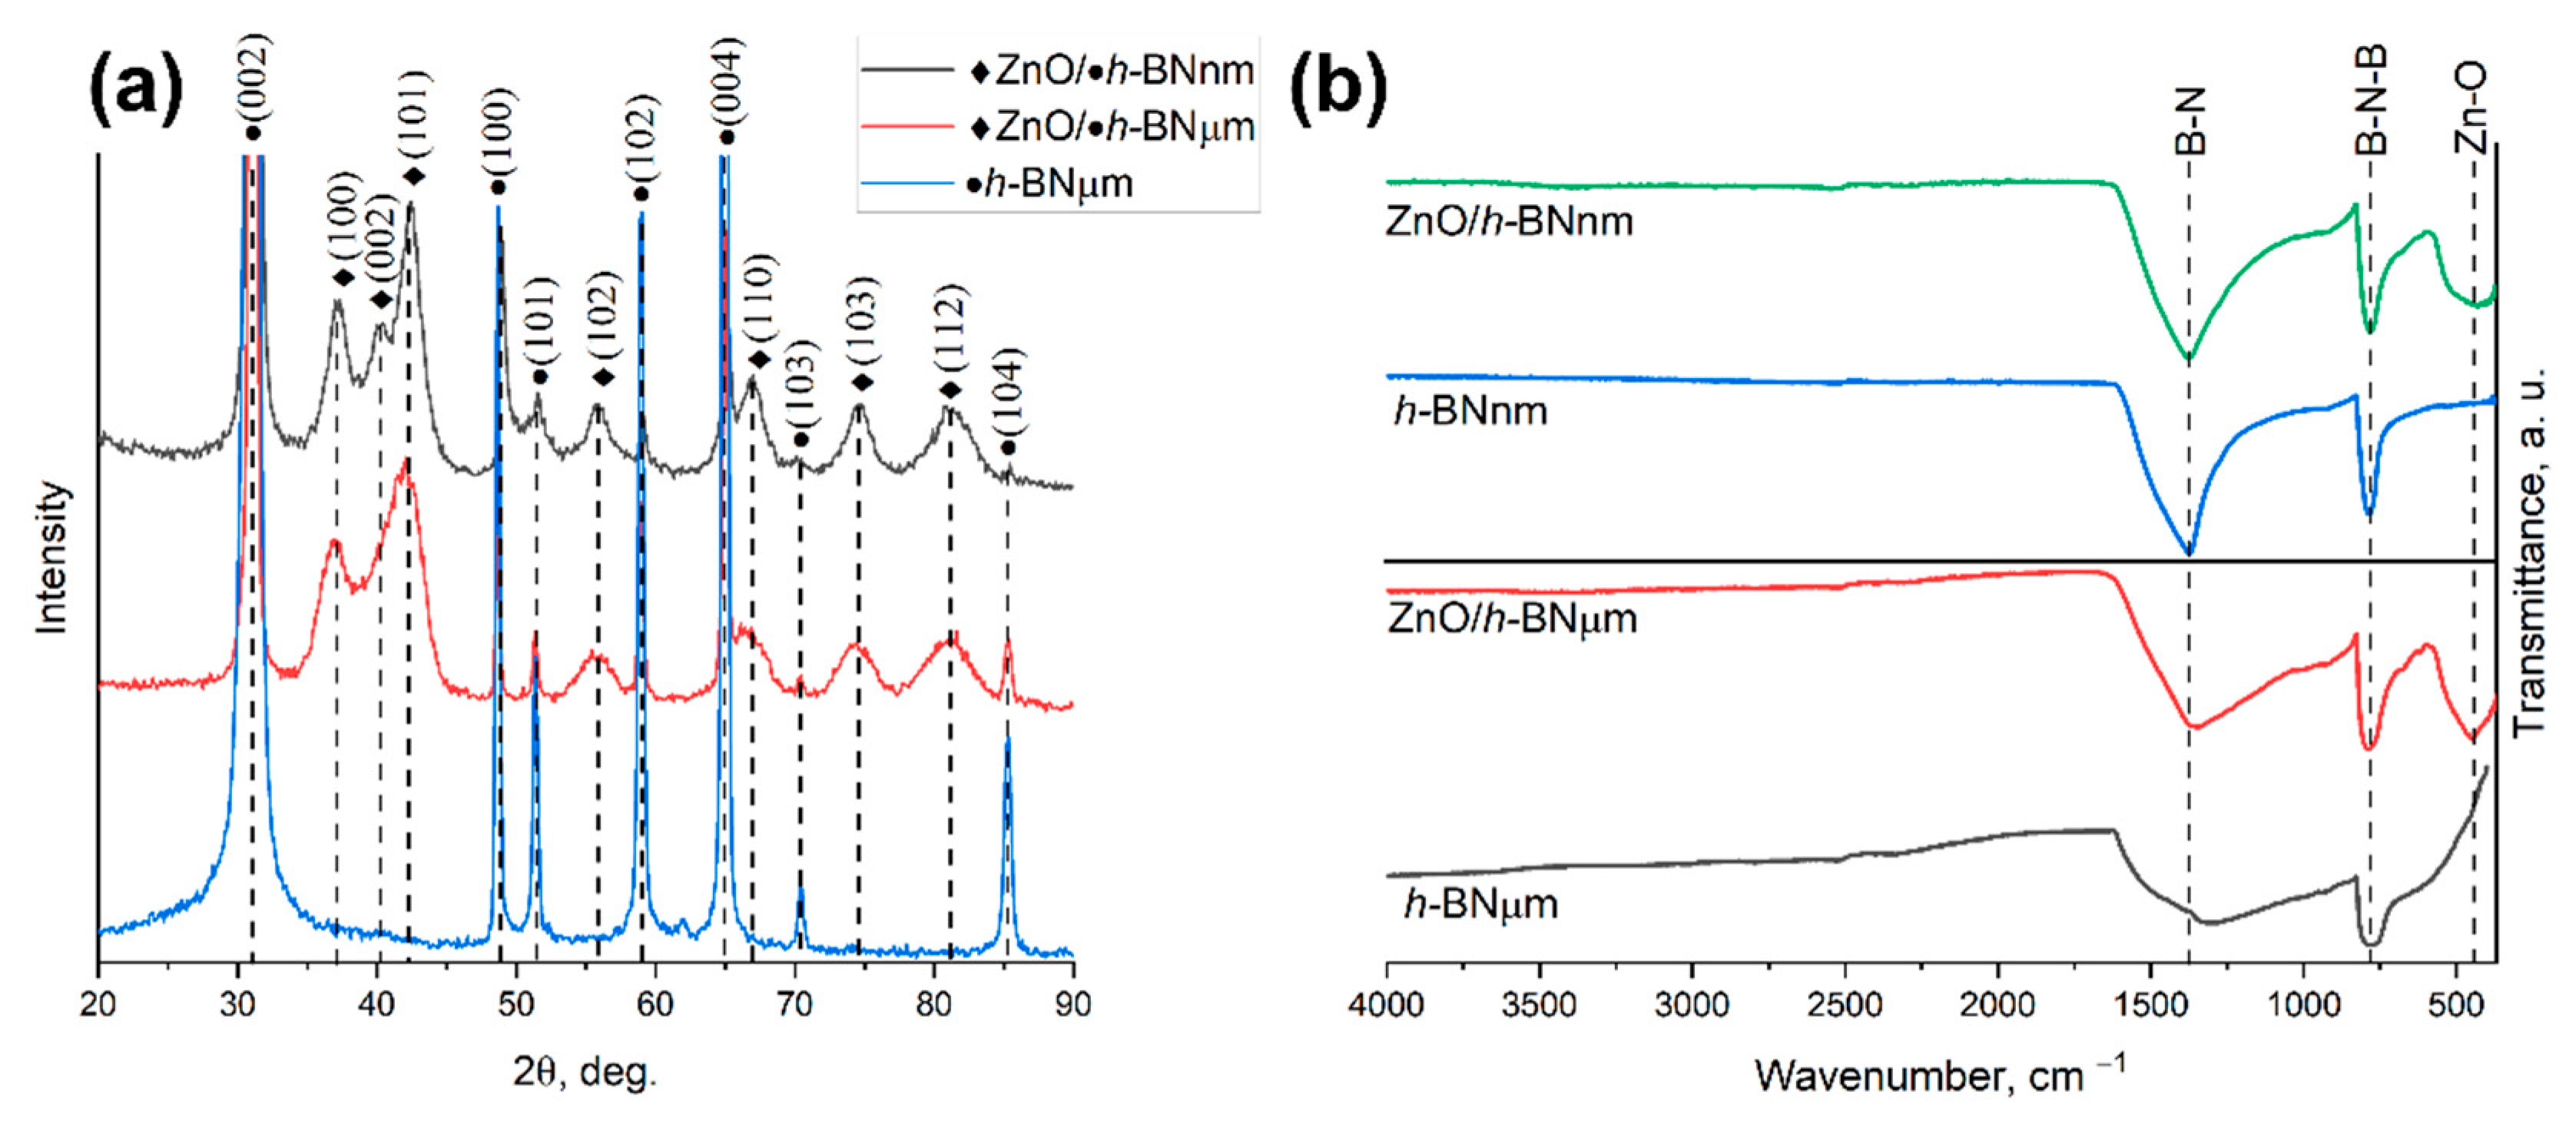
3.2. XRD and FTIR
3.3. Photoluminescence
4. Discussion
5. Conclusions
Author Contributions
Funding
Institutional Review Board Statement
Informed Consent Statement
Data Availability Statement
Conflicts of Interest
References
- Singh, P.; Singh, R.K.; Kumar, R. Journey of ZnO Quantum Dots from Undoped to Rare-Earth and Transition Metal-Doped and Their Applications. RSC Adv. 2021, 11, 2512–2545. [Google Scholar] [CrossRef]
- Galdámez-Martinez, A.; Santana, G.; Güell, F.; Martínez-Alanis, P.R.; Dutt, A. Photoluminescence of ZnO Nanowires: A Review. Nanomaterials 2020, 10, 857. [Google Scholar] [CrossRef] [PubMed]
- Richters, J.-P.; Voss, T.; Kim, D.S.; Scholz, R.; Zacharias, M. Enhanced Surface-Excitonic Emission in ZnO/Al2O3 Core–Shell Nanowires. Nanotechnology 2008, 19, 305202. [Google Scholar] [CrossRef] [PubMed]
- Richters, J.-P.; Voss, T.; Wischmeier, L.; Rückmann, I.; Gutowski, J. Influence of Polymer Coating on the Low-Temperature Photoluminescence Properties of ZnO Nanowires. Appl. Phys. Lett. 2008, 92, 011103. [Google Scholar] [CrossRef]
- Boukhoubza, I.; Khenfouch, M.; Achehboune, M.; Leontie, L.; Galca, A.C.; Enculescu, M.; Carlescu, A.; Guerboub, M.; Mothudi, B.M.; Jorio, A.; et al. Graphene Oxide Concentration Effect on the Optoelectronic Properties of ZnO/GO Nanocomposites. Nanomaterials 2020, 10, 1532. [Google Scholar] [CrossRef] [PubMed]
- Sarkar, S.; Debnath, S.K.; Srivastava, R.; Kulkarni, A.R. Continuous Flow Scale-up of Biofunctionalized Defective ZnO Quantum Dots: A Safer Inorganic Ingredient for Skin UV Protection. Acta Biomater. 2022, 147, 377–390. [Google Scholar] [CrossRef]
- Li, X.-L.; Han, W.-P.; Wu, J.-B.; Qiao, X.-F.; Zhang, J.; Tan, P.-H. Layer-Number Dependent Optical Properties of 2D Materials and Their Application for Thickness Determination. Adv. Funct. Mater. 2017, 27, 1604468. [Google Scholar] [CrossRef]
- Villaos, R.A.B.; Crisostomo, C.P.; Huang, Z.-Q.; Huang, S.-M.; Padama, A.A.B.; Albao, M.A.; Lin, H.; Chuang, F.-C. Thickness Dependent Electronic Properties of Pt Dichalcogenides. Npj 2D Mater. Appl. 2019, 3, 2. [Google Scholar] [CrossRef]
- Isakin, O.; Schneider, R.; Ringl, M.; Struck, O.; Gerdes, T.; Willert-Porada, M.; Moos, R. High-Yield Synthesis of ZnO Nanoparticles Homogeneously Coated on Exfoliated Graphite and Simplified Method to Determine the Surface Coverage. Surf. Coat. Technol. 2017, 325, 445–453. [Google Scholar] [CrossRef]
- Roy, S.; Zhang, X.; Puthirath, A.B.; Meiyazhagan, A.; Bhattacharyya, S.; Rahman, M.M.; Babu, G.; Susarla, S.; Saju, S.K.; Tran, M.K.; et al. Structure, Properties and Applications of Two-Dimensional Hexagonal Boron Nitride. Adv. Mater. 2021, 33, 2101589. [Google Scholar] [CrossRef]
- Oh, H.; Hong, Y.J.; Kim, K.-S.; Yoon, S.; Baek, H.; Kang, S.-H.; Kwon, Y.-K.; Kim, M.; Yi, G.-C. Architectured van Der Waals Epitaxy of ZnO Nanostructures on Hexagonal BN. NPG Asia Mater. 2014, 6, e145. [Google Scholar] [CrossRef]
- Hale, P.S.; Maddox, L.M.; Shapter, J.G.; Voelcker, N.H.; Ford, M.J.; Waclawik, E.R. Growth Kinetics and Modeling of ZnO Nanoparticles. J. Chem. Educ. 2005, 82, 775. [Google Scholar] [CrossRef]
- Hohenberg, P.; Kohn, W. Inhomogeneous Electron Gas. Phys. Rev. 1964, 136, B864–B871. [Google Scholar] [CrossRef]
- Kohn, W.; Sham, L.J. Self-Consistent Equations Including Exchange and Correlation Effects. Phys. Rev. 1965, 140, A1133–A1138. [Google Scholar] [CrossRef]
- Kresse, G.; Furthmüller, J. Efficient Iterative Schemes for Ab Initio Total-Energy Calculations Using a Plane-Wave Basis Set. Phys. Rev. B 1996, 54, 11169–11186. [Google Scholar] [CrossRef]
- Kresse, G.; Furthmüller, J. Efficiency of Ab-Initio Total Energy Calculations for Metals and Semiconductors Using a Plane-Wave Basis Set. Comput. Mater. Sci. 1996, 6, 15–50. [Google Scholar] [CrossRef]
- Kresse, G.; Hafner, J. Ab Initio Molecular-Dynamics Simulation of the Liquid-Metal–Amorphous-Semiconductor Transition in Germanium. Phys. Rev. B 1994, 49, 14251–14269. [Google Scholar] [CrossRef] [PubMed]
- Perdew, J.P.; Burke, K.; Ernzerhof, M. Generalized Gradient Approximation Made Simple. Phys. Rev. Lett. 1996, 77, 3865–3868. [Google Scholar] [CrossRef] [PubMed]
- Blöchl, P.E. Projector Augmented-Wave Method. Phys. Rev. B 1994, 50, 17953–17979. [Google Scholar] [CrossRef] [PubMed]
- Dudarev, S.L.; Botton, G.A.; Savrasov, S.Y.; Humphreys, C.J.; Sutton, A.P. Electron-Energy-Loss Spectra and the Structural Stability of Nickel Oxide: An LSDA+U Study. Phys. Rev. B 1998, 57, 1505–1509. [Google Scholar] [CrossRef]
- Ma, X.; Wu, Y.; Lv, Y.; Zhu, Y. Correlation Effects on Lattice Relaxation and Electronic Structure of ZnO within the GGA+ U Formalism. J. Phys. Chem. C 2013, 117, 26029–26039. [Google Scholar] [CrossRef]
- Monkhorst, H.J.; Pack, J.D. Special Points for Brillouin-Zone Integrations. Phys. Rev. B 1976, 13, 5188–5192. [Google Scholar] [CrossRef]
- Grimme, S.; Antony, J.; Ehrlich, S.; Krieg, H. A Consistent and Accurate Ab Initio Parametrization of Density Functional Dispersion Correction (DFT-D) for the 94 Elements H-Pu. J. Chem. Phys. 2010, 132, 154104. [Google Scholar] [CrossRef] [PubMed]
- Shiraishi, K. A New Slab Model Approach for Electronic Structure Calculation of Polar Semiconductor Surface. J. Phys. Soc. Jpn. 1990, 59, 3455–3458. [Google Scholar] [CrossRef]
- Yoo, S.-H.; Todorova, M.; Wickramaratne, D.; Weston, L.; de Walle, C.G.V.; Neugebauer, J. Finite-Size Correction for Slab Supercell Calculations of Materials with Spontaneous Polarization. Npj Comput. Mater. 2021, 7, 58. [Google Scholar] [CrossRef]
- Momma, K.; Izumi, F. VESTA 3 for Three-Dimensional Visualization of Crystal, Volumetric and Morphology Data. J. Appl. Crystallogr. 2011, 44, 1272–1276. [Google Scholar] [CrossRef]
- Martínez Julca, M.A.; Rivera, I.; Perales-Pérez, O.; Bailón, S.; Pérez, M. Li-Doped ZnO Nanoparticles as Novel Direct Generator of Singlet Oxygen for Potential Photodynamic Therapy Applications. MRS Proc. 2015, 1784, 15213656501. [Google Scholar] [CrossRef]
- Jeong, E.-S.; Yu, H.-J.; Kim, Y.-J.; Yi, G.-C.; Choi, Y.-D.; Han, S.-W. Local Structural and Optical Properties of ZnO Nanoparticles. J. Nanosci. Nanotechnol. 2010, 10, 3562–3565. [Google Scholar] [CrossRef]
- Biroju, R.K.; Giri, P.K.; Dhara, S.; Imakita, K.; Fujii, M. Graphene-Assisted Controlled Growth of Highly Aligned ZnO Nanorods and Nanoribbons: Growth Mechanism and Photoluminescence Properties. ACS Appl. Mater. Interfaces 2014, 6, 377–387. [Google Scholar] [CrossRef] [PubMed]
- Chen, C.; He, H.; Lu, Y.; Wu, K.; Ye, Z. Surface Passivation Effect on the Photoluminescence of ZnO Nanorods. ACS Appl. Mater. Interfaces 2013, 5, 6354–6359. [Google Scholar] [CrossRef]
- Ahmed, G.; Hanif, M.; Zhao, L.; Hussain, M.; Khan, J.; Liu, Z. Defect Engineering of ZnO Nanoparticles by Graphene Oxide Leading to Enhanced Visible Light Photocatalysis. J. Mol. Catal. Chem. 2016, 425, 310–321. [Google Scholar] [CrossRef]
- Damberga, D.; Viter, R.; Fedorenko, V.; Iatsunskyi, I.; Coy, E.; Graniel, O.; Balme, S.; Miele, P.; Bechelany, M. Photoluminescence Study of Defects in ZnO-Coated Polyacrylonitrile Nanofibers. J. Phys. Chem. C 2020, 124, 9434–9441. [Google Scholar] [CrossRef]
- Laturia, A.; Van de Put, M.L.; Vandenberghe, W.G. Dielectric Properties of Hexagonal Boron Nitride and Transition Metal Dichalcogenides: From Monolayer to Bulk. npj 2D Mater. Appl. 2018, 2, 6. [Google Scholar] [CrossRef]
- Gorbachev, R.V.; Riaz, I.; Nair, R.R.; Jalil, R.; Britnell, L.; Belle, B.D.; Hill, E.W.; Novoselov, K.S.; Watanabe, K.; Taniguchi, T.; et al. Hunting for Monolayer Boron Nitride: Optical and Raman Signatures. Small 2011, 7, 465–468. [Google Scholar] [CrossRef] [PubMed]
- Gilbert, S.M.; Pham, T.; Dogan, M.; Oh, S.; Shevitski, B.; Schumm, G.; Liu, S.; Ercius, P.; Aloni, S.; Cohen, M.L.; et al. Alternative Stacking Sequences in Hexagonal Boron Nitride. 2D Mater. 2019, 6, 021006. [Google Scholar] [CrossRef]
- Constantinescu, G.; Kuc, A.; Heine, T. Stacking in Bulk and Bilayer Hexagonal Boron Nitride. Phys. Rev. Lett. 2013, 111, 036104. [Google Scholar] [CrossRef]
- Gajdoš, M.; Hummer, K.; Kresse, G.; Furthmüller, J.; Bechstedt, F. Linear Optical Properties in the Projector-Augmented Wave Methodology. Phys. Rev. B 2006, 73, 045112. [Google Scholar] [CrossRef]
- Eberlein, T.; Bangert, U.; Nair, R.R.; Jones, R.; Gass, M.; Bleloch, A.L.; Novoselov, K.S.; Geim, A.; Briddon, P.R. Plasmon Spectroscopy of Free-Standing Graphene Films. Phys. Rev. B 2008, 77, 233406. [Google Scholar] [CrossRef]
- Wickramaratne, D.; Weston, L.; Van de Walle, C.G. Monolayer to Bulk Properties of Hexagonal Boron Nitride. J. Phys. Chem. C 2018, 122, 25524–25529. [Google Scholar] [CrossRef]
- Laleyan, D.A.; Mengle, K.; Zhao, S.; Wang, Y.; Kioupakis, E.; Mi, Z. Effect of Growth Temperature on the Structural and Optical Properties of Few-Layer Hexagonal Boron Nitride by Molecular Beam Epitaxy. Opt. Express 2018, 26, 23031. [Google Scholar] [CrossRef]


| nm(eV) | Electron Transition | References |
|---|---|---|
| ~363(~3.4) | CB 1→VB | [27,28] |
| ~375(~3.3) | [29] | |
| ~383(~3.2) | [30,31] | |
| ~425(~2.9) | Zni→VB | [5] |
| ~445(~2.8) | VZn++ 2→VB | [32] |
| ~545(~2.3) | CB→VO++ 3 | [29] |
Publisher’s Note: MDPI stays neutral with regard to jurisdictional claims in published maps and institutional affiliations. |
© 2022 by the authors. Licensee MDPI, Basel, Switzerland. This article is an open access article distributed under the terms and conditions of the Creative Commons Attribution (CC BY) license (https://creativecommons.org/licenses/by/4.0/).
Share and Cite
Barilyuk, D.V.; Sukhanova, E.V.; Popov, Z.I.; Korol, A.A.; Konopatsky, A.S.; Shtansky, D.V. Effect of h-BN Support on Photoluminescence of ZnO Nanoparticles: Experimental and Theoretical Insight. Materials 2022, 15, 8759. https://doi.org/10.3390/ma15248759
Barilyuk DV, Sukhanova EV, Popov ZI, Korol AA, Konopatsky AS, Shtansky DV. Effect of h-BN Support on Photoluminescence of ZnO Nanoparticles: Experimental and Theoretical Insight. Materials. 2022; 15(24):8759. https://doi.org/10.3390/ma15248759
Chicago/Turabian StyleBarilyuk, Danil V., Ekaterina V. Sukhanova, Zakhar I. Popov, Artem A. Korol, Anton S. Konopatsky, and Dmitry V. Shtansky. 2022. "Effect of h-BN Support on Photoluminescence of ZnO Nanoparticles: Experimental and Theoretical Insight" Materials 15, no. 24: 8759. https://doi.org/10.3390/ma15248759
APA StyleBarilyuk, D. V., Sukhanova, E. V., Popov, Z. I., Korol, A. A., Konopatsky, A. S., & Shtansky, D. V. (2022). Effect of h-BN Support on Photoluminescence of ZnO Nanoparticles: Experimental and Theoretical Insight. Materials, 15(24), 8759. https://doi.org/10.3390/ma15248759