Article

Physicochemical Properties of Water-Based Copolymer and Zeolite Composite Sustained-Release Membrane Materials

1
College of Water Resource Science and Engineering, Taiyuan University of Technology, Taiyuan 030024, China
2
College of Chemical Engineering and Technology, Taiyuan University of Technology, Taiyuan 030024, China
*
Author to whom correspondence should be addressed.
Materials 2022, 15(23), 8553; https://doi.org/10.3390/ma15238553
Submission received: 24 October 2022 / Revised: 25 November 2022 / Accepted: 25 November 2022 / Published: 1 December 2022

Abstract

:
A nitrogen fertilizer slow-release membrane was proposed using polyvinyl alcohol (PVA), polyvinylpyrrolidone (PVP), epoxy resin, and zeolite as raw materials. The effects of the water-based copolymer (PVA:PVP) solution ratio A (A1–A4) and zeolite amount B (B1–B4) on the water absorption rate (XS), water permeability (TS), fertilizer permeability (TF), tensile strength (KL), elongation at break (DSL), and viscosity (ND) of the membrane were explored using the swelling method, a self-made device, and a universal testing machine. The optimal combination of the water-based copolymer and zeolite amount was determined by the coefficient-of-variation method. The results show that the effects of the decrease in A on KL and the increase in B on KL and DSL are promoted first and then inhibited. DSL and ND showed a negative response to the A decrease, whereas XS, TS, and TF showed a positive response. The effect of increasing B on ND, TS, and TF showed a zigzag fluctuation. In the condition of A1–A3, XS showed a negative response to the B increase, whereas in the condition of A4, XS was promoted first and then inhibited. Adding PVP and zeolite caused the hydroxyl stretching vibration peak of PVA at 3300 cm−1 to widen; the former caused the vibration peak to move to low frequencies, and the latter caused it to move to high frequencies. The XRD pattern shows that the highest peak of zeolite is located at 2θ = 7.18° and the crystallization peak of the composite membrane increases with the rise in the proportion of zeolite. Adding PVP made the surface of the membrane smooth and flat, and adding a small amount of zeolite improved the mechanical properties of the membrane and exhibited good compatibility with water-based copolymers. In the evaluation model of the physicochemical properties of sustained-release membrane materials, the weight of all indicators was in the following order: TF > ND > TS > KL > XL > DSL. The optimal membrane material for comprehensive performance was determined to be A2B3.

1. Introduction

With the extensive use of traditional fertilizers, economic issues [1], environmental issues [2], and food safety [3] are becoming increasingly obvious. Slow- and controlled-release fertilizers could reduce the nutrient release rate, greatly improve the utilization rate, and then reduce environmental pollution and economic loss [4,5]. The selection and preparation of membrane materials are keys to the performance of slow- and controlled-release fertilizers. High-quality membrane materials have the advantages of wide sources, low cost, and biodegradability [6,7,8]. In particular, zeolite has wide sources, low cost, good water retention capacity in soil, and a promoting effect on plant growth [9,10]. Polyvinyl alcohol (PVA) and polyvinylpyrrolidone (PVP) have good membrane formation and biodegradability [11,12]. An improved method for coupling multiple materials, including PVA and PVP chemical crosslinking, zeolite physical recombination to form a three-dimensional copolymerization network, and epoxy resin plasticization, was proposed in the present work.
The comprehensive performance of a single PVA membrane is not good. Water resistance could be improved via crosslinking with citrate [13], thermoplasticity could be improved via reacting with formaldehyde [14], and degradability could be improved via blending with SiO2 [15]. However, most of these methods focus on a single approach to modification, and the response of various indicators to modification is not consistent. For example, hyaluronic acid modification strategies could improve PVA hydrophilicity and biocompatibility but reduce mechanical properties [16]. The modification strategy of piperic acid could improve the tensile strength (KL) and water resistance of PVA but reduce its elongation at break (DSL) [17]. Membranes with good performance should have good degradation [18], mechanical properties [19], and other characteristics at the same time. The coupling modification method adopted in the present paper, which includes using PVA and PVP chemical crosslinking, zeolite physical recombination to form a three-dimensional copolymerization network, and epoxy resin plasticization, has not been reported. The effects of the group allocation ratio among PVA, PVP, and zeolite on the physical and chemical properties of membrane materials are still unclear and need to be further explored.
Research reports showed that the response strength and trend of each index of the membrane to the same factor are different, and the optimal treatment of each index lacks consistency. For example, adding the crosslinker glutaraldehyde at 0.3 mL brought Young’s modulus of the membrane to an optimal value of 30.94 MPa, whereas the DSL was reduced to a lower level of 16.27% [20]. With 0.5 mL glycerol, the DSL of the membrane reached the best value, and the KL reached the lowest level of 0.47 Mpa [21]. If the optimal treatment evaluation method based on a single index could have subjective one-sidedness, the multi-index objective comprehensive evaluation method based on the distribution weight–coefficient-of-variation method must be adopted. This method has been mainly applied in the fields of mechanical design and manufacturing [22], data envelopment analysis [23], and economic evaluation of wind power plants [24], proving reasonable feasibility. However, the application of a comprehensive evaluation of sustained-release membranes has not been reported and needs to be deeply researched.
This paper aimed to elucidate the effects of zeolite, the water-based copolymer ratio, and its coupling effect on the physicochemical properties of XS, TS, TF, KL, DSL, and ND. A comprehensive evaluation model of the physicochemical properties of membranes was constructed, and the optimal water-based copolymer–zeolite ratio was determined, providing a theoretical basis for the development of new environmentally friendly degradable membranes.

2. Materials and Methods

2.1. Materials

PVA 1799 (analytically pure) and PVP K30 (analytically pure) were purchased from Sinopharm Chemical Reagent Co., Ltd. (Shanghai, China). Epoxy resin (industrial grade) was purchased from China Shandong Yousuo Chemical Technology Co., Ltd. (Linyi, China). 4A zeolite (industrial grade) was purchased from China Shanxi Taiheng Technology Co., Ltd. (Jinzhong, China). Industrial 4A zeolite is a cage-connected structure consisting of 8 cubic octahedrons and 12 regular tetrahedrons formed by silicon-aluminum oxygen tetrahedral units, belonging to the cubic crystal system. The parameters of 4A zeolite were as follows: Specific surface area 510 m2/g; whiteness > 95%; apparent density, 0.3~0.5 g/cm3; average particle size, 2 μm.

2.2. Fabrication of Membrane

We weighed a certain amount of PVA and deionized water in a three-necked flask, which was in the oil bath pan. At the beginning of the experiment, the temperature of the oil bath pan was kept at 95 °C and the PVA was completely dissolved after approximately 1.5 h. Then, PVP was added when the solution was cooled to 60 °C, and the solution was stirred at a constant temperature until completely dissolved. Zeolite was added to the water-based copolymer solution for mixing and stirring for 1 h. Finally, the epoxy resin was added to the mixed solution and reacted for 2 h to obtain the membrane solution. We then extracted a certain amount of membrane solution and dried it in a calorstat to form a membrane.

2.3. Experimental Design

Four levels of A (PVA:PVP) were designated as A1–A4, with proportions of 8:0%, 7.3:0.7%, 6.6:1.4%, and 5.9:2.1%, respectively. Four levels of B were also designated as B1–B4 and the ratios in the solution were 0%, 0.25%, 0.5%, and 1%, respectively. The amount of epoxy resin added was 14 g, equal to 2% in the solution. A two-factor four-level comprehensive experimental design with 16 groups was adopted.

2.4. Experimental Methods

XS and TS were calculated by Formulas (1) and (2) in accordance with the methods of Han [25]. TF was calculated by Formula (3) in accordance with the method of Huang [26]. KL and DLS were calculated by Formulas (4) and (5) and measured using the C45 universal testing machine (Shenzhen Wanjian Test and Design Co., Ltd., Shenzhen, China). ND was measured using the NDJ-8S digital display rotational viscometer (Shanghai Lichen Bangxi Instrument Co., Ltd., Shanghai, China). The nitrogen release rate (K) of the membrane fertilizer was determined by the Bertalanffy model (Formula (6)).
X S = M 1 M 2 × 100 %
T S = Δ M tS
T F = C × V C 0 × V × 100 %
K L = F N S
D L S = L a L 0 L 0 × 100 %
N = N 0 ( 1 be kt ) 3
where XS is the water absorption of the membrane (%), M1 is the saturation mass of the membrane material, M2 is the original quality of membrane material, TS is the water permeability of the membrane, ΔM is the mass change of silica gel (g), t is the water absorption time of the membrane (h), S is the permeable area of the membrane (cm2), TF is the fertilizer permeability of the membrane (%), C0 is the initial concentration of urea (g/L), V is the volume of distilled water and the volume of urea solution (L), C is the urea concentration (g/L), KL is the tensile strength of the sample (MPa), FN indicates the maximum tension that the sample could withstand (N), S is the cross-sectional area of the sample (m2), DLS is the elongation at break of the sample (%), La indicates the length of the sample before breaking (cm), L0 is the length of the sample after breakage (cm), N is the cumulative release rate of urea, t is the release time, and K is the nitrogen release rate.

2.5. Data Processing and Statistical Analysis

IBM SPSS Statistics 22 data analysis software was used for the analysis of variance. Microsoft Office 2019 was used for data processing and table drawing. Origin2019b was used for graphical drawing. SPSSPRO 1.1.7 was used to determine the index weight and construct the comprehensive evaluation model of the membrane material.

3. Results and Analysis

3.1. Effect of Water-Based Copolymer Ratio and Zeolite Amount on the Hydrophilicity of Membrane Materials

Figure 1 shows the hydrophilic characteristics of the membrane materials under different water-based copolymer ratios and zeolite amounts. Figure 1a shows that in the condition of A1–A3, XS was monotonically decreased by 22.64%, 10.32%, and 17.22% with the increase in B, respectively. XS presented a negative response to the B increase. In the A4 condition, when B increased from B1 to B3, XS increased by 10.4%; when B increased from B3 to B4, XS decreased by 5.0%. This finding showed that the increase in B on XS was first promoted and then inhibited. As shown in Figure 1a, XS produced jagged fluctuations when A decreased, but the overall XS with the A decrease presented a positive response. A, B, and A*B exhibited a significant effect on XS (p ˂ 0.01), and the size of the influence was as follows: A > A*B > A. Figure 1b shows a slight fluctuation in TS when B was increased, and the effect of such an increase on TS was not significant (p > 0.05). In the condition of B1–B4, when A decreased from A1 to A4, TS significantly increased by 90.02%, 136.24%, 116.56%, and 61.56%, respectively. Thus, the decrease in A showed a significant positive response on TS (p ˂ 0.01). The response of TS to A was the most significant at B2. The influence of A, B, and A*B on TS was in the order A > A*B > B.

3.2. Effect of Water-Based Copolymer Ratio and Zeolite Amount on the Mechanical Properties of Membrane Materials

Figure 2a shows that when B increased from B1 to B3, KL increased by 13.72–43.31%, and when B increased from B3 to B4, KL decreased by 3.31–12.22%. This finding showed that the increase in B on KL was first promoted and then suppressed. When A decreased from A1 to A2, KL increased by 8.97–25.16%, and when A decreased from A2 to A4, KL decreased by 38.03–44.21%. This finding showed that the decrease in A on KL was first promoted and then suppressed. Figure 2b shows that when B increased from B1 to B2 and from B2 to B4, DLS increased by 2.75–44.74% and 4.64%–17.26%, respectively. This finding revealed that the increase in B on DLS was first promoted and then inhibited. In the condition of B1–B4, when A decreased from A1 to A4, DLS significantly increased by 6.72%, 23.08%, 21.58%, and 11.34%, respectively. The inhibitory effect was the most obvious under the B2 condition. A, B, and A*B all showed a significant effect on KL (p ˂ 0.01), and B had a significant effect on DLS (p < 0.05). On the contrary, A and A*B had no significant effect on DLS. The influences of A, B, and A*B on KL and DLS were A > B > A*B and B > A > A*B, respectively.

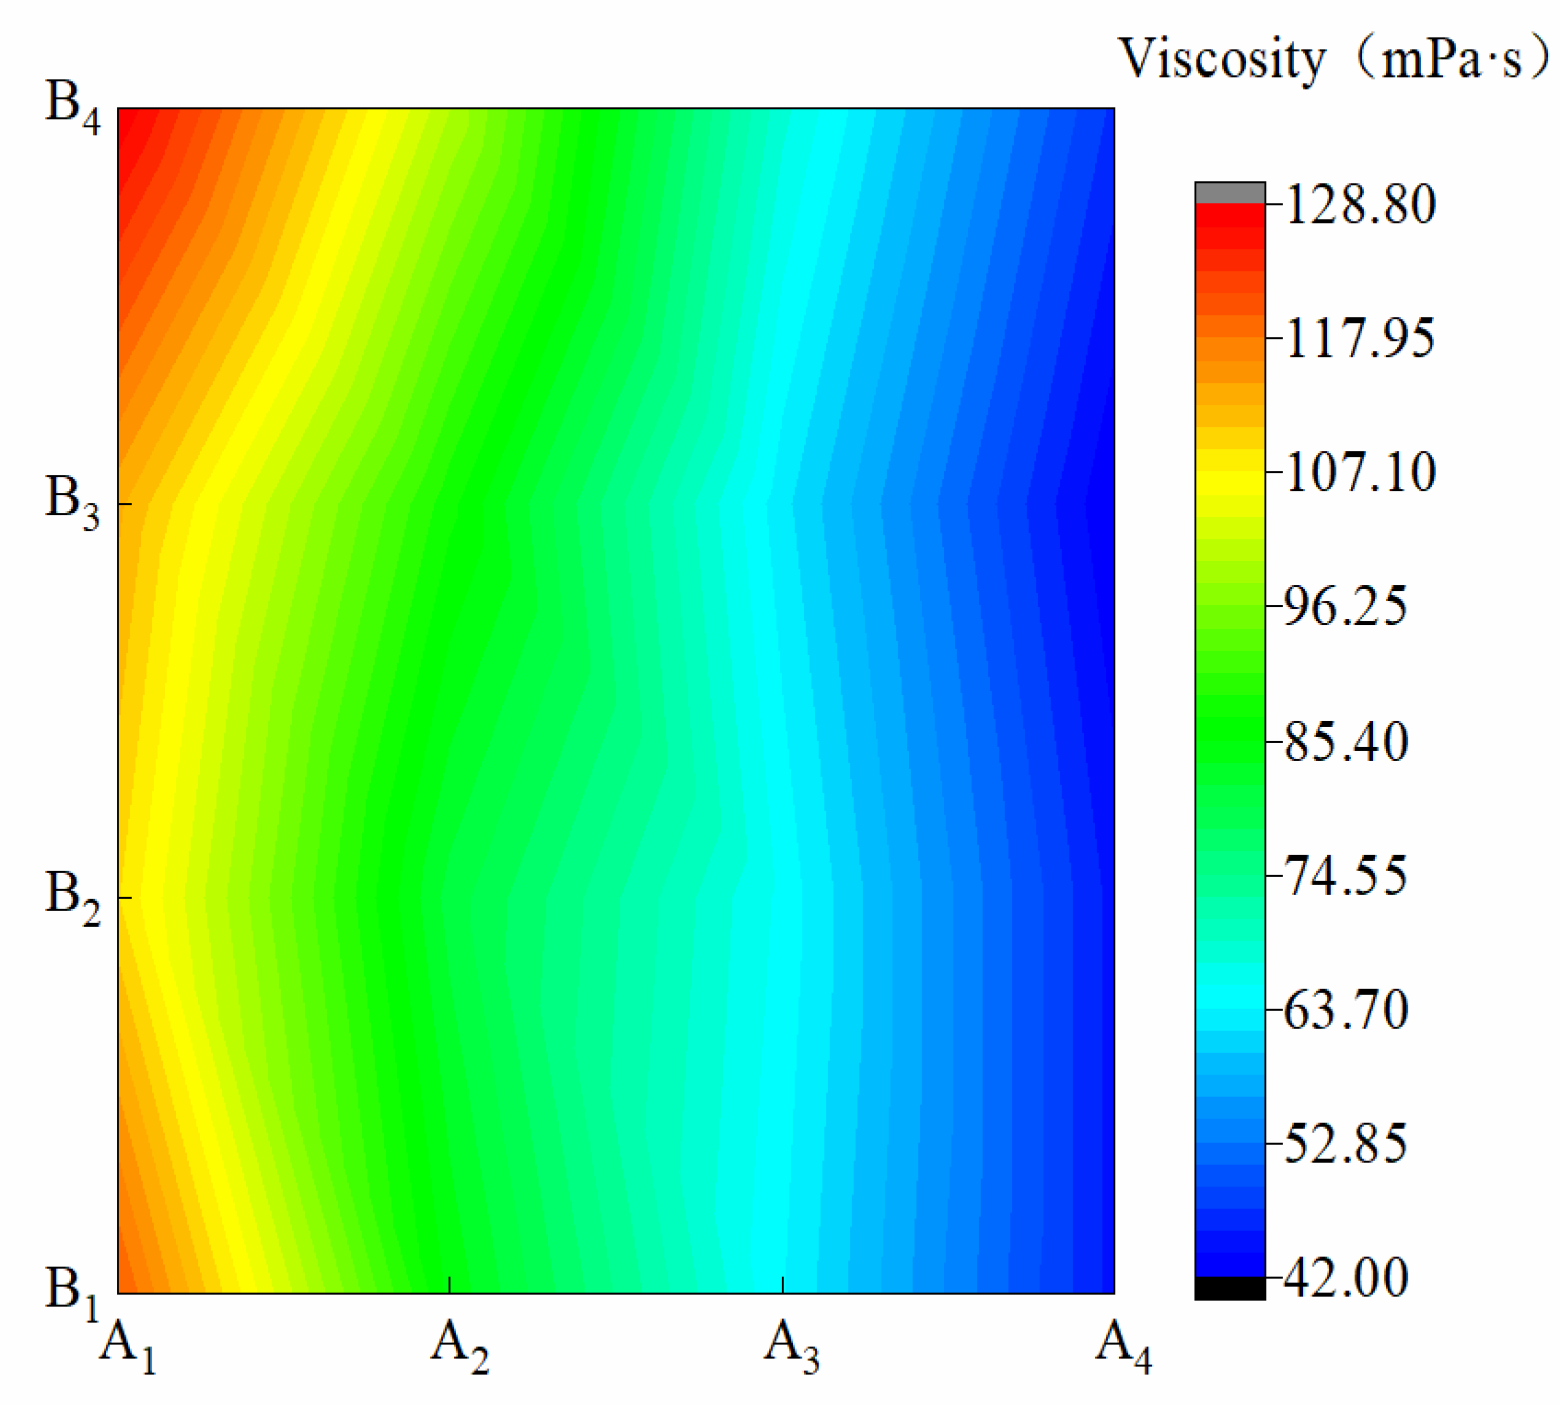
3.3. Effect of Water-Based Copolymer Ratio and Zeolite Amount on the Viscosity of Membrane Materials

Figure 3 shows the viscosity of membrane materials under different water-based copolymer ratios and zeolite amounts. In the condition of A1–A4, the ND variations caused by B were 5.52%, 6.16%, 2.55%, and 3.08%, respectively, suggesting that the B increase had less effect on ND with the water-based copolymer at the same level. In the condition of B1–B4, when A decreased from A1 to A4, ND significantly decreased by 81.8, 75, 68, and 67 mPa·s, respectively. This finding showed that the A decrease inhibited ND, and this inhibition was most obvious under the B1 condition. A, B, and A*B had a significant effect on ND (p ˂ 0.01), and their influence on TS was in the following order: A > B > A*B.

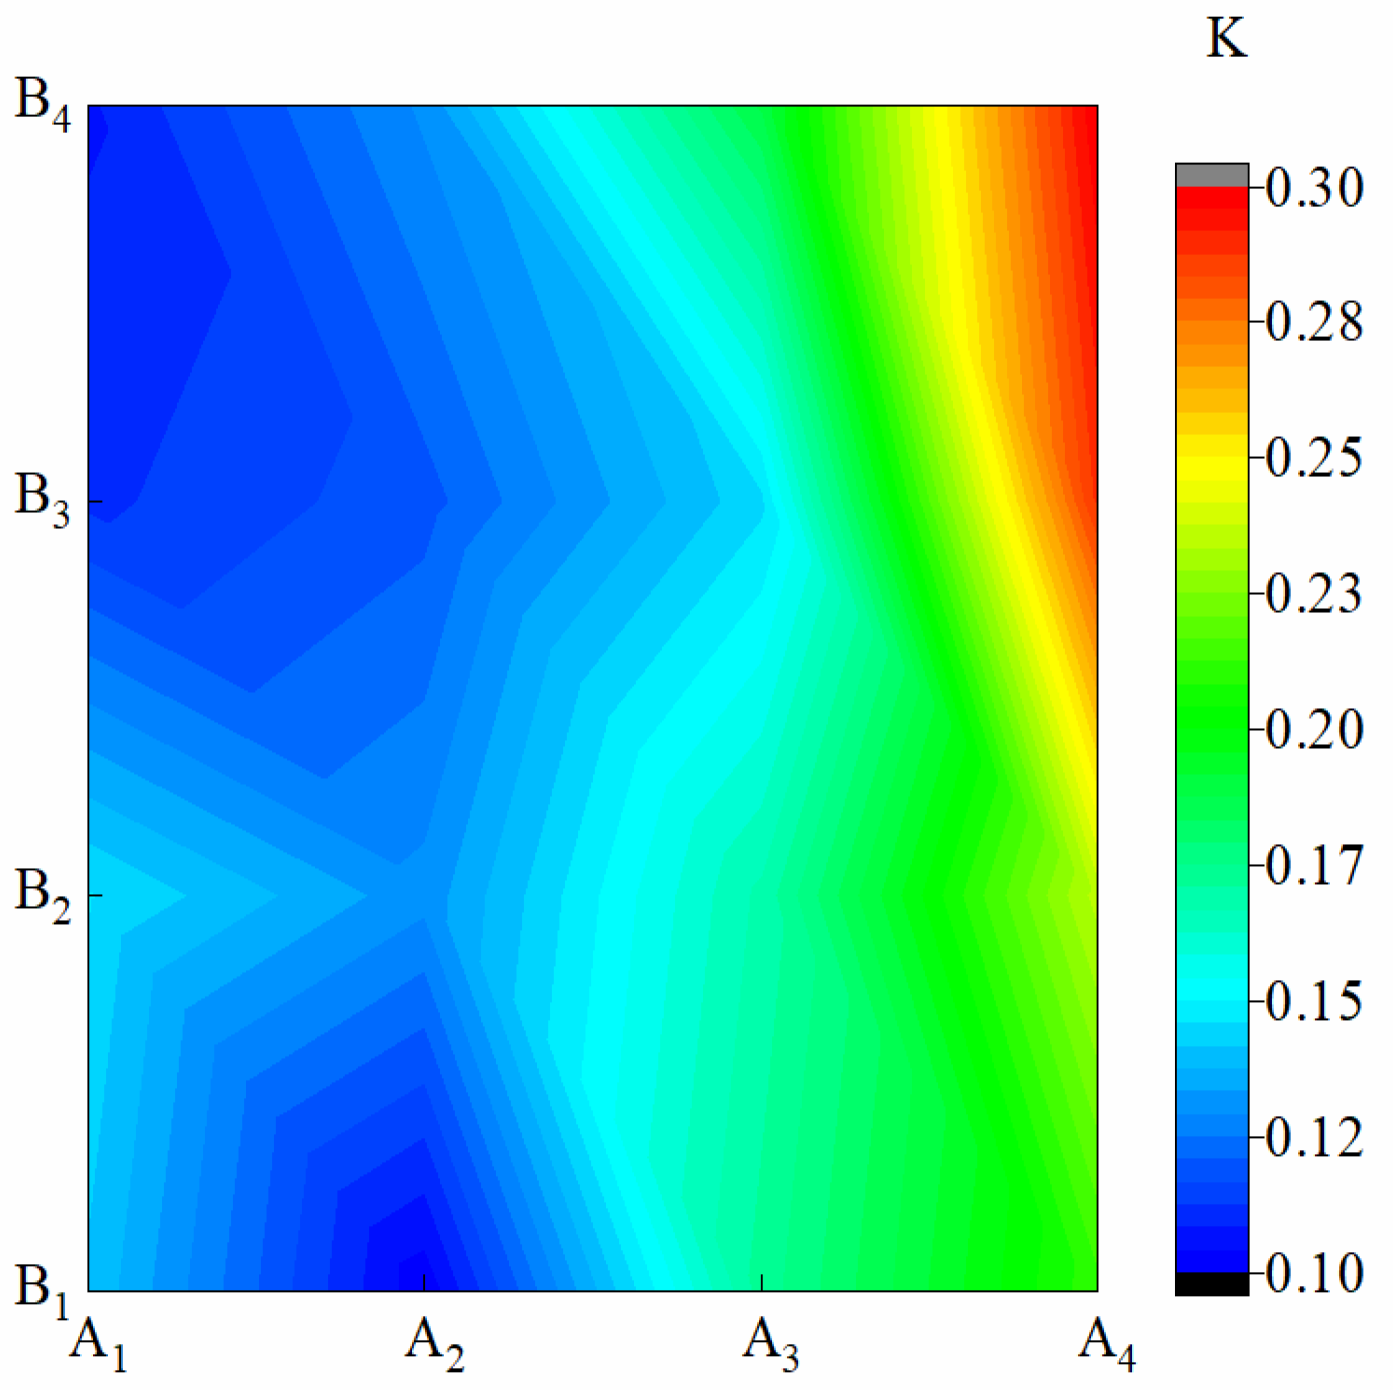
3.4. Effect of Water-Based Copolymer Ratio and Zeolite Amount on the Fertilizer Permeability of Membrane Materials

Figure 4 shows the K of membrane materials under different water-based copolymer ratios and zeolite amounts. In the condition of A1–A3, the amplitude of variations of K caused by B were 13.67%, 15.60%, and 7.27%, respectively, and a jagged fluctuation in K was observed. Under the A4 condition, when B increased from B2 to B3, K increased by 18.64%. This finding showed that when the proportion of PVA in A dropped to a certain extent, the addition of B could have a greater effect on the sustained-release performance of the membrane. In the condition of B1–B4, when A decreased from A1 to A4, K monotonically increased by 33.60%, 38.08%, 61.79%, and 64.54%, respectively. K presented a significant negative response to the A decrease (p ˂ 0.01). B and A*B also showed a significant effect on TF (p ˂ 0.01). The influence of A, B, and A*B on TF was as follows: A > A*B > B.

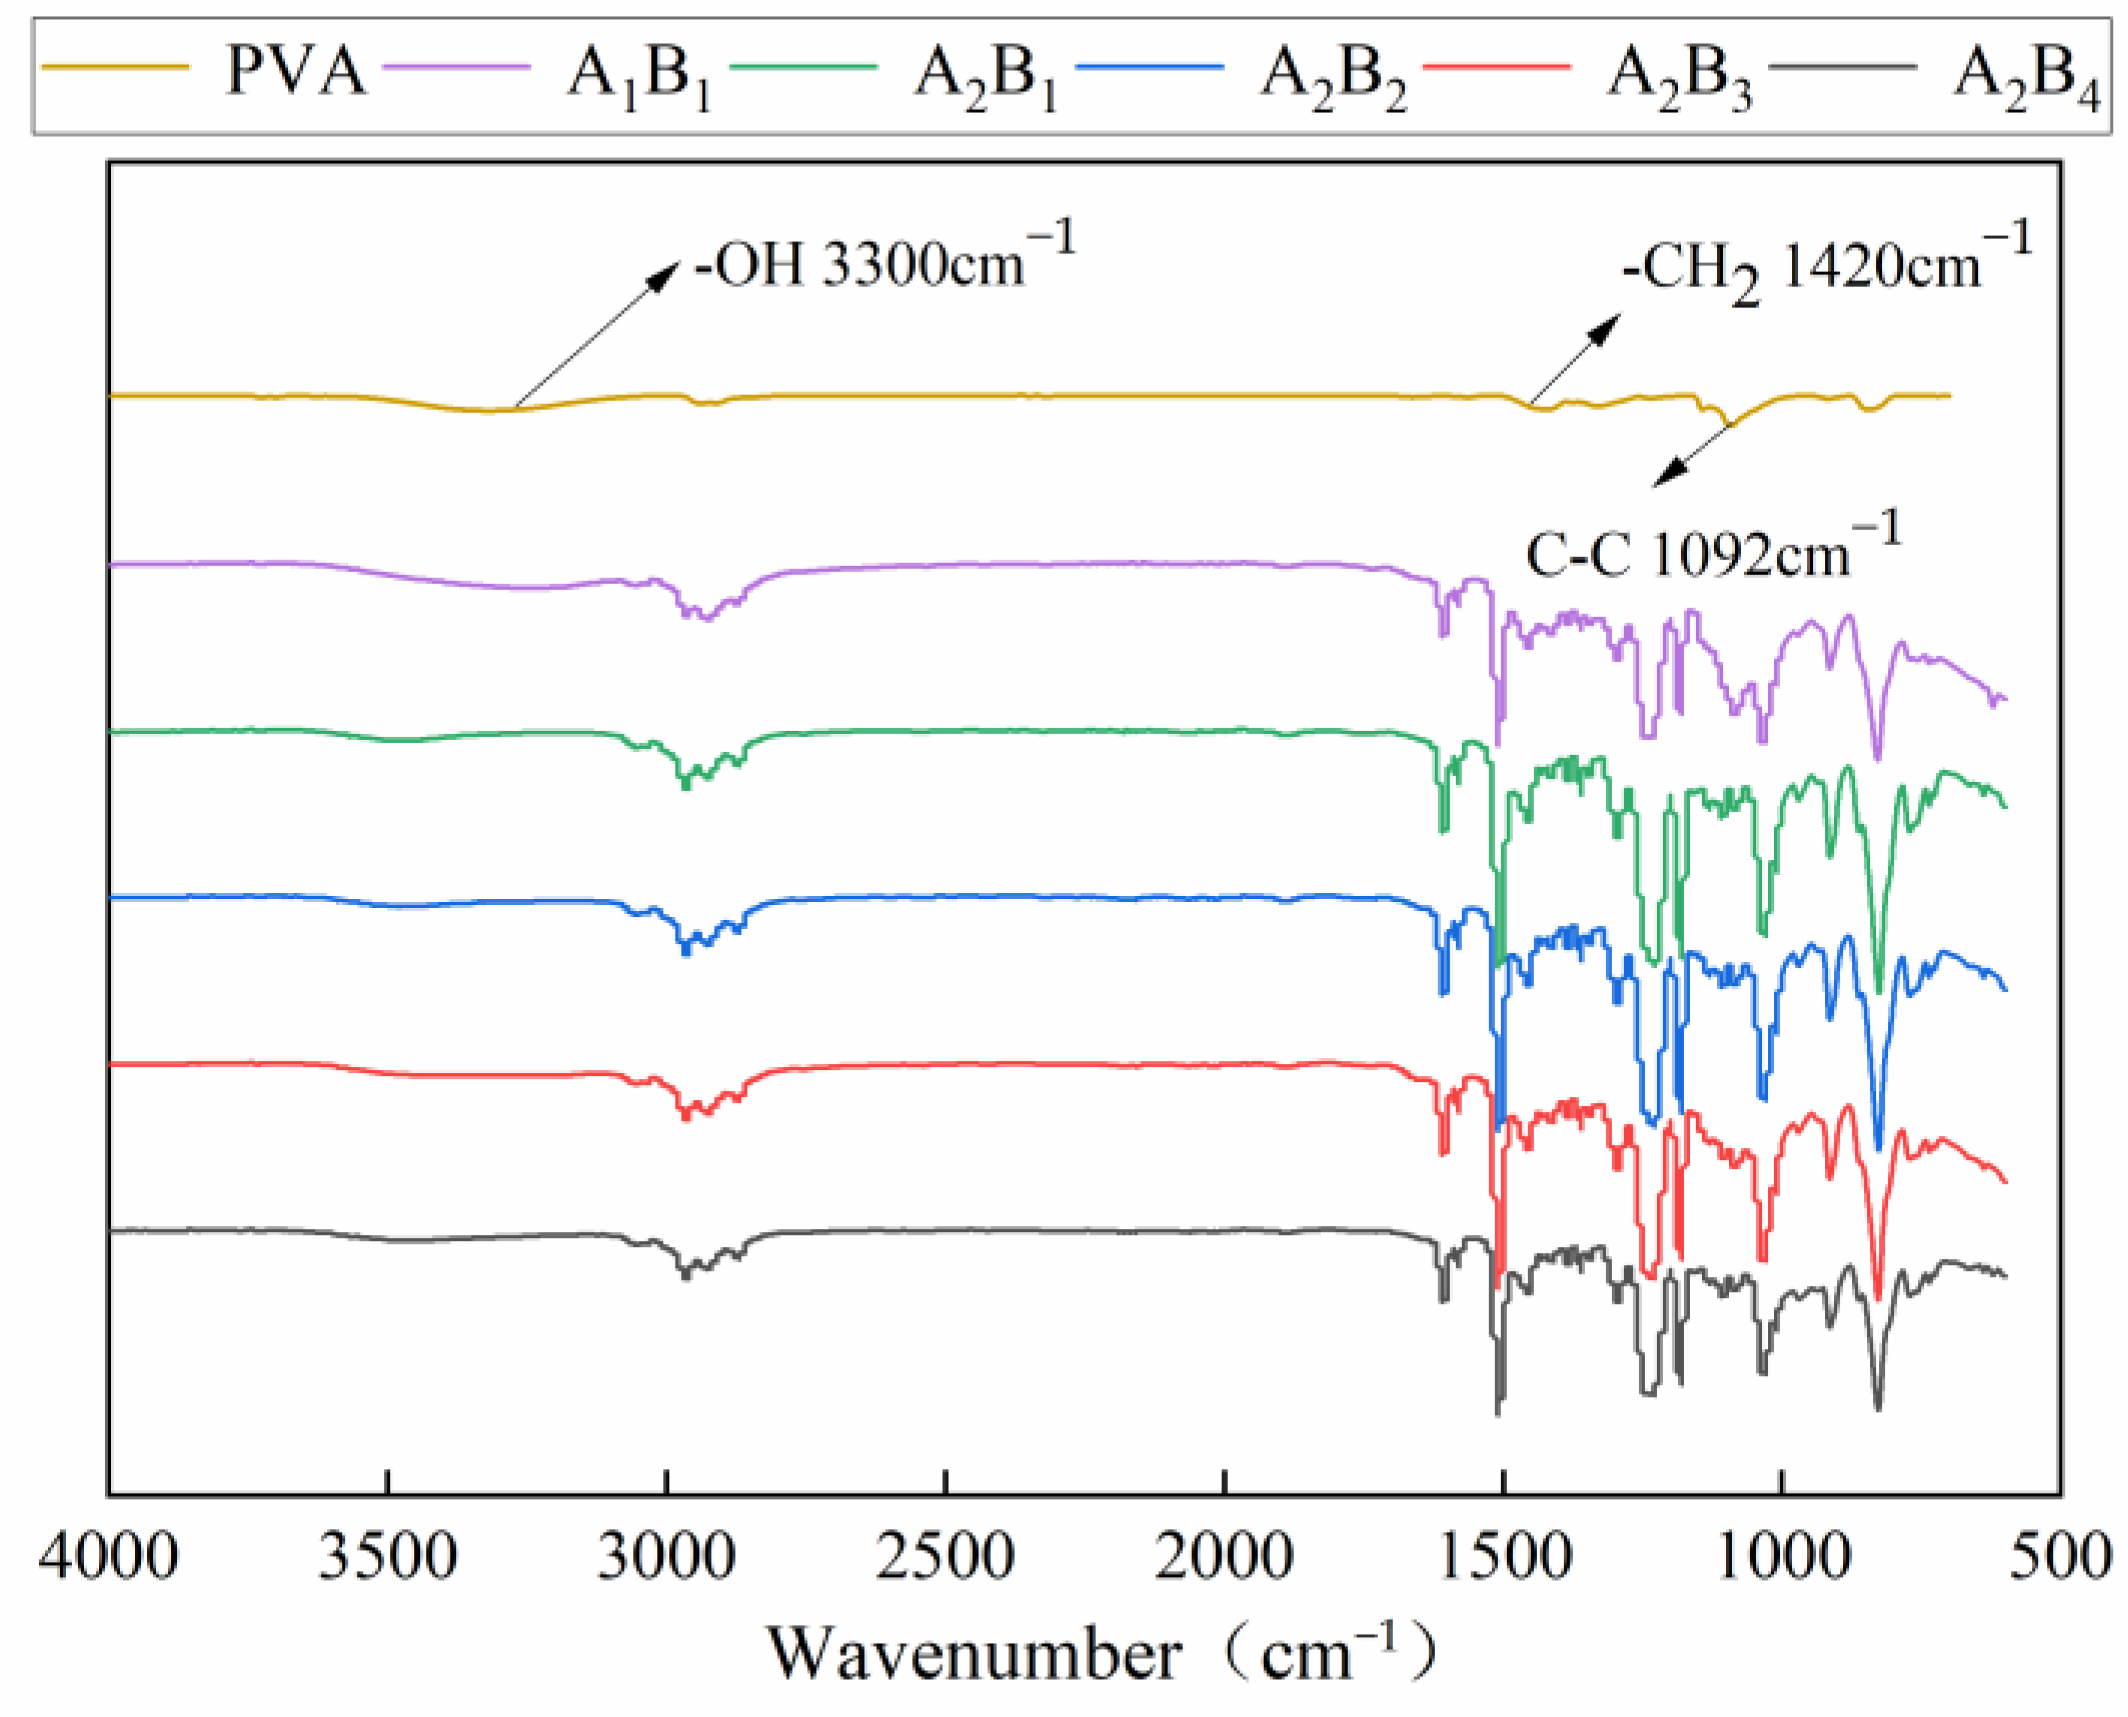
3.5. Infrared Spectroscopic Analysis

Figure 5 shows the infrared spectra of the membrane material under different water-based copolymer ratios and zeolite amounts. The typical peaks in the PVA spectrum mainly include the stretching vibration absorption peak of the -OH bond near 3300 cm−1 [27], the bending vibration peak of the -CH2 bond at 1420 cm−1, and the vibration absorption peak of the C-C skeleton at 1092 cm−1 [28]. A comparison of the spectra of A1B1 and PVA showed that the hydroxyl stretching vibration peak at 3300 cm−1 in the infrared spectrum of the membrane material widened and moved to the direction of a low wave number after adding PVP and epoxy resin. The bending vibration peak of the -CH2 bond at 1420 cm−1 and the vibration absorption peak of the C-C skeleton at 1092 cm−1 of PVA were considerably enhanced, indicating that more excited electrons were generated in the atoms of the membrane material and the absorption of infrared light was significantly enhanced. The formation of a hydrogen bond could weaken the -OH bond, resulting in the reduction in -OH bond vibration frequency, which is a typical athochromic-shift phenomenon [29]. A comparison of the spectra of A1B1 and A2B1 revealed that the stretching vibration peak of the -OH bond further widened and extended to the low band after the addition of PVP, and the peak intensity showed an enhancement trend. A2B1, A2B2, A2B3, and A2B4 had obvious absorption peaks in the 2500–3000 cm−1 band, indicating that the complexation reaction occurred in PVA and PVP molecules through positive and negative charge attraction, and the two molecules formed intermolecular hydrogen bonds.

3.6. X-Ray Diffractive Analysis

Figure 6 shows the XRD pattern of membrane materials under different water-based copolymer and zeolite amounts. It can be seen from Figure 6 that the main characteristic peaks of zeolite are 2θ = 7.18°, 9.52°, 16.24°, 26.18°, which belong to the crystal plane of (2 0 0), (3 0 0), (2 2 1), (2 1 4) of 4A zeolite, respectively, and the strongest diffraction peak of (2 0 0) crystal plane appears at 2θ = 7.18°. PVA has a typical crystallization peak at 2θ = 19.35°. The composite membrane also has a typical crystallization peak at 2θ = 19.35°, because PVA is the main component of the composite membrane. Comparing the XRD diffractograms of the zeolite with the zeolite-modified water-based copolymer composite membranes, some crystalline peaks related to the zeolite disappeared in the composite membranes, and the intensity of the crystalline peaks was lower in the composite membranes than in the zeolite. This indicates that some reactions occurred between the zeolite and the water-based copolymer. Comparing the typical peaks of composite membranes, it can be seen that with the increase in the proportion of zeolite in the composite membrane, the typical peaks show a rising trend. This indicates that zeolite has an obvious modification effect on composite membranes.

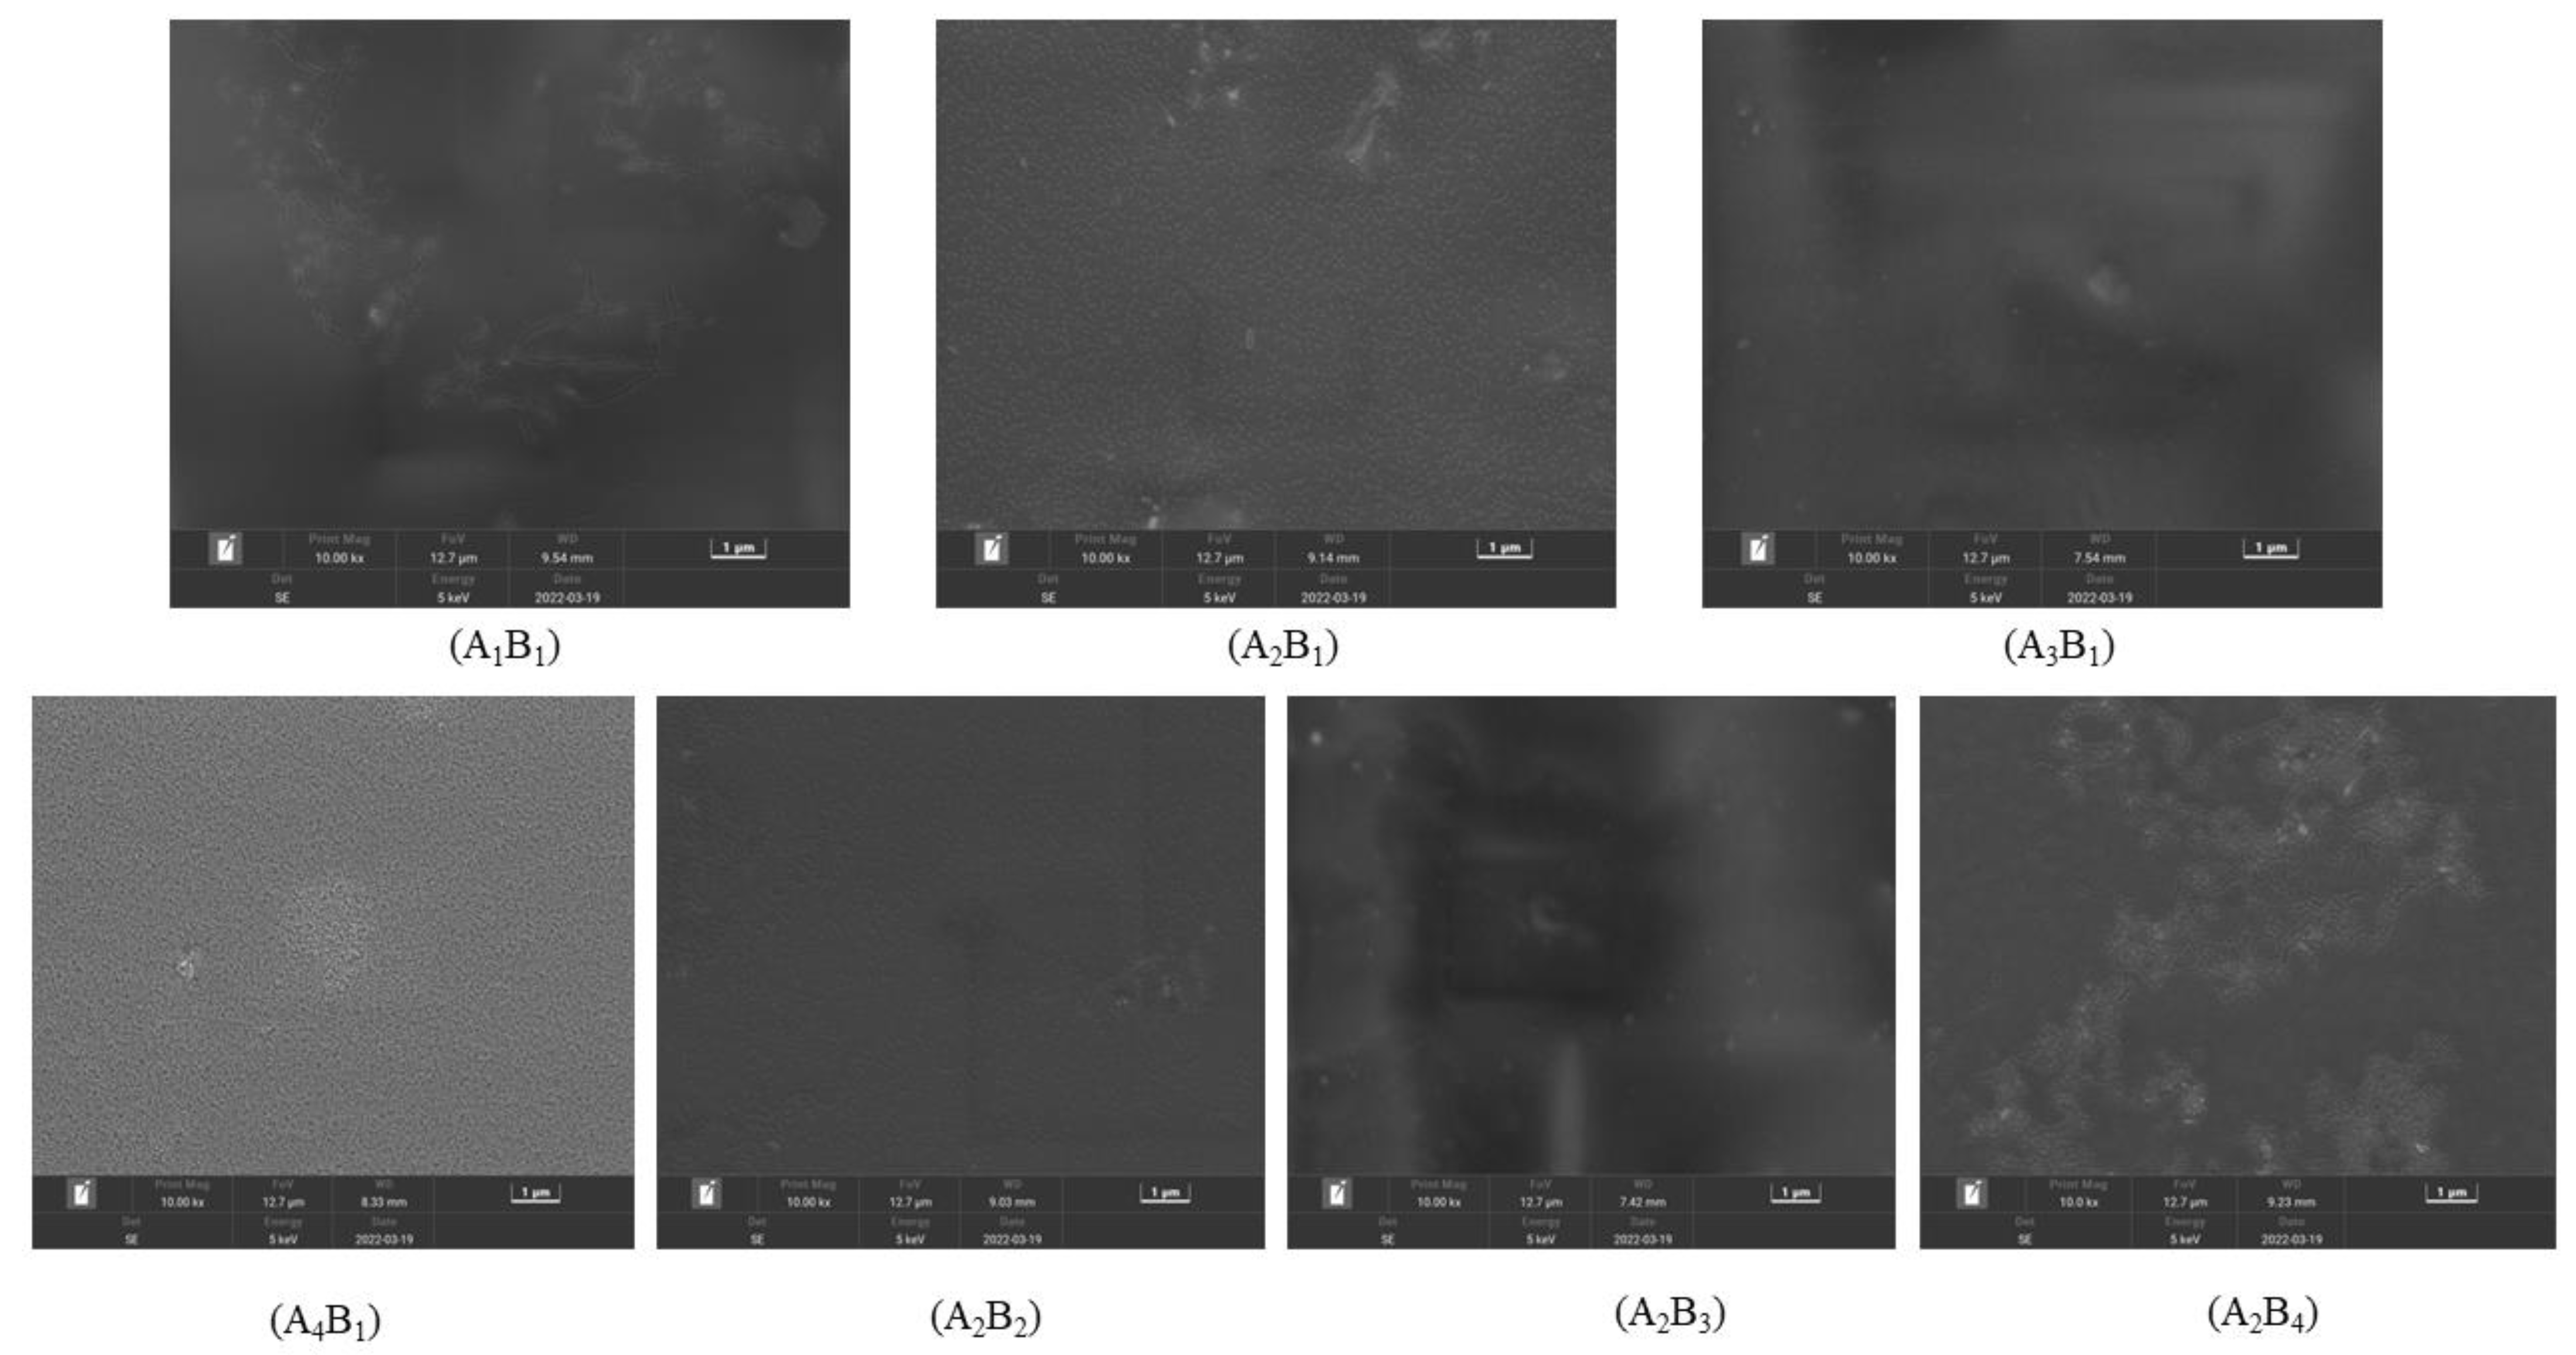
3.7. Effect of Water-Based Copolymer Ratio and Zeolite Amount on the Surface Property of Membrane Materials

Figure 7 shows the SEM photos of the membrane surface structure. Without the addition of PVP, the surface of A1B1 increased and cracked. After PVP was added, the surfaces of A2B1, A3B1, and A4B1 became flat and smooth, and the cracks disappeared. However, with the increase in the PVP ratio, a slight agglomeration phenomenon occurred on the membrane surface, which may be related to the reaction temperature and time of the test. When the addition amount of B was 0, the surface of A2B1 was smooth and flat, indicating that PVA and PVP were well combined and compact. When the B addition amount was 1.75 g, the surface of A2B2 was also smooth and flat, indicating that a small amount of B addition exhibited good compatibility with A. With the continuous addition of B, the surface flatness and uniformity of A2B3 and A2B4 worsened, and the surface of the membrane material increased. These findings showed that the ratio of A2 and B2 could obtain a membrane with excellent surface properties.

3.8. Comprehensive Evaluation

The previous analysis showed that A and B had different effects on TF, ND, TS, KL, XL, and DSL. The results of the optimal water-based copolymer–zeolite amount combination based on a single indicator were not consistent. Objectively and comprehensively selecting the optimal treatment of comprehensive performance was found to be difficult, so a comprehensive evaluation of various indicators of the membrane materials must be conducted. First, the coefficient-of-variation method was used to determine the weight coefficients of various indicators, and the results are shown in Table 1. The weight of each indicator was in the following order: TF > ND > TS > KL > XL > DSL. TF had the largest weighting proportion (24.20%), whereas DSL had the smallest (6.06%). This finding showed that TF was the most important index of the membrane material, and DSL was a relatively minor indicator. By establishing the weights, typical indicators that reflect the properties of the membrane could be selected. It also helps build a more reasonable model evaluation system and obtain more reasonable evaluation results. Then, the Z-score standardization method was used to standardize the data of each indicator. Finally, the standardized data were combined with the weight coefficients to obtain the comprehensive score of the membrane, and the result is shown in Figure 8. The comprehensive score could be used as an objective evaluation index to judge the quality of membrane materials. The results showed that A2B3 had the best comprehensive performance, with a score of 0.57, whereas A4B3 had the worst comprehensive performance, with a score of −0.95.

4. Discussion

4.1. Properties of Membrane Materials

XS is an important index for evaluating the properties of membrane materials. Studies have shown that the lower the XS is, the better the sustained-release performance of the membrane [30]. The results in the present paper showed that adding zeolite could inhibit XS, and this inhibition effect was most obvious at the A2 level of the water-based copolymer. This finding is mainly related to the internal configuration of zeolite [31]. Previous studies have found that the addition of biochar modification to water-based copolymers achieved good results [32]. Similar to biochar [33], the porous zeolite used in the present paper has a unique “tetrahedral” structure [34], physical adsorption, and ion exchange characteristics [35]. It blends with polymers to form three-dimensional network structures and change the properties of membrane materials.
The results of this study showed that the K values varied under different treatments, but the sustained-release performance reached the optimum under the A2B1 treatment. This finding is mainly closely related to the chemical crosslinking density and compatibility between materials [36]. As shown in Figure 6, the surface of A2B1 was smooth. Under this treatment, the compatibility between PVA and PVP was the best, and the chemical crosslinking density between materials was the largest. So, the diffusion rate of water and urea molecules through the crosslinked polymer was low [37,38,39]. With the formation of hydrogen bonds between the carbonyl group of PVP and the hydroxyl group of PVA, the -OH stretching vibration peak shifted. The results of the present study also showed that the nutrient release curve of the membrane material was rapid in the initial stage, and the release rate slowed down after reaching the inflection point at a certain period. This phenomenon is due to the fast membrane material initial water swelling of urea molecules through the polymer network. After a certain period, the membrane gradually expanded to saturation, and the diffusion channel became narrow. The permeability coefficient of water and urea molecules through the polymer membrane decreased, and the rate of fertilizer penetration slowed down [40].
By constructing the model, Hennepe [41] concluded that zeolite had a significant effect on polymer properties. In the present paper, the effect of zeolite addition on the mechanical properties of the membrane was shown to be promoted first and then inhibited. Chang [42] found that the increase in zeolite content did not significantly improve the mechanical properties of the material. The DLS of UHMWPE material increased first and was then inhibited, whereas the KL gradually decreased. The membrane materials constructed in the present paper could form a three-dimensional network structure, which could help reduce the twisting of molecular chains [43]. An appropriate increase in zeolite could improve the membrane’s crosslinking density. As the number of nodes per unit volume in the network structure increased, the free volume in the polymer decreased. The molecular chain torsion was reduced, and the KL of the membrane increased [44]. However, when excessive zeolite was added, the free volume of the water-based copolymer decreased continuously, and the addition of zeolite destroyed the original crosslinking node, thus leading to decreased KL.

4.2. Optimization of Evaluation Method

In the comprehensive evaluation system, the establishment of reasonable weights is crucial to whether the decision-making problem could be solved, and it is a key factor in evaluation accuracy [45]. Zou [46] concluded that the mechanical properties and water resistance of the composite membrane reached the optimum when the additional amount of KGM was 0.3%. If the evaluation method, which was based on the mechanical properties and water resistance indices, reached the optimum and was adopted in this paper, the optimal treatment would be A1B2, different from the result after the index weight was reasonably established in this paper. The reason for the above difference is that the importance degree of indicators differed, and the corresponding optimal treatment of different indicators was inconsistent. Selecting the optimal treatment by only using some indicators to achieve the optimum was difficult. Although A1B2 had excellent mechanical properties and water resistance, its ND and TF indicators were poor. Thus, it could not be used as an optimal treatment. In this paper, the coefficient-of-variation method was used to determine the importance of the membrane material indicators. In the membrane material score calculation of comprehensive consideration of all indicators, the results could be more objective and reasonable.
Previous research used principal component analysis [47] to determine the optimal membrane ratio, providing theoretical guidance for the optimization of membrane material and the ratio between components. The principal components extracted by a principal component analysis were at least two, and the cumulative contribution rate of variance was more than 85%, which could better reflect the original variable information [48,49]. When a principal component analysis was used for a comprehensive evaluation in the present paper, the extraction criteria with an eigenvalue greater than 1 [50] were adopted, and only one principal component with a variance contribution rate of 80.179% was extracted (Table 2). Principal component analysis was used to determine that a principal component with a low variance contribution rate does not better reflect the original variable information. It could not specifically obtain the weight of each index, and partial one-sidedness could occur. In this paper, the coefficient of variation and standard deviation of the indicators were obtained using the coefficient-of-variation method, and the weights of all the indicators were determined. The method could objectively and accurately describe the original variable information (Table 1). Therefore, the reasonable choice of method in comprehensive evaluation is conducive to building a more reasonable model evaluation system and obtaining more reasonable evaluation results.

5. Conclusions

The effects of the A decrease on KL and the B increase on KL and DSL were promoted first and then inhibited. DSL and ND showed a negative response to the A decrease, whereas XS, TS, and TF showed a positive response. The effect of increasing B on ND, TS, and TF showed a zigzag fluctuation. Under the condition of A1–A3, XS showed a negative response to the B increase, and under the A4 condition, XS was promoted first and then inhibited. The addition of PVP and zeolite could cause the hydroxyl expansion vibration peak of PVA at 3300 cm−1 to widen and move. The XRD pattern shows that the highest peak of zeolite is located at 2θ = 7.18°, and the crystallization peak of the composite membrane increases with the rise of the proportion of zeolite. The addition of PVP made the surface of the membrane flat and smooth. The addition of a small amount of zeolite improved the mechanical properties of the membrane and exhibited good compatibility with water-based copolymers. Meanwhile, adding excessive zeolite could lead to poor flatness and smoothness of the membrane. The influence of different factors on the XS, TS, and TF of the membrane materials was as follows: A > A*B > B; the influence on the KL and ND of the membrane materials was as follows: A > B > A*B; and the influence on the DSL was B > A > A*B. The weight of all indicators was in the order TF > ND > TS > KL > XL > DSL. The best performance was found in the A2B3 treatment, and the worst was in the A4B3 treatment.

Author Contributions

Conceptualization, H.S.; methodology, X.G.; software, J.L. (Jiangjian Lv); validation, H.S., T.L. and J.L. (Jianxin Liu); formal analysis, X.G.; investigation, J.L. (Jiangjian Lv); resources, T.L.; data curation, J.L. (Jianxin Liu); writing—original draft preparation, H.S.; writing—review and editing, T.L.; data analysis and visualization, J.L. (Jianxin Liu); supervision, T.L.; project administration, T.L.; funding acquisition, T.L. All authors have read and agreed to the published version of the manuscript.

Funding

This research was funded by the National Natural Science Foundation Program (51909184) and the China Postdoctoral Science Foundation (2020M670693).

Institutional Review Board Statement

Not applicable.

Informed Consent Statement

Not applicable.

Data Availability Statement

Not applicable.

Acknowledgments

We appreciate that postgraduates from the university of the first author investigated and collected data. We are also grateful to the editors and anonymous reviewers for their suggestions and comments.

Conflicts of Interest

The authors declare no conflict of interest.

References

  1. Zhao, J.; Luo, Q.; Deng, H.; Yan, Y. Opportunities and challenges of sustainable agricultural development in China. Philos. Trans. R. Soc. B Biol. Sci. 2008, 363, 893–904. [Google Scholar] [CrossRef] [Green Version]
  2. Zhu, Z.L.; Chen, D. Nitrogen fertilizer use in China–Contributions to food production, impacts on the environment and best management strategies. Nutr. Cycl. Agroecosyst. 2002, 63, 117–127. [Google Scholar] [CrossRef]
  3. Li, Y.; Zhang, W.; Ma, L.; Huang, G.; Oenema, O.; Zhang, F.; Dou, Z. An analysis of China’s fertilizer policies: Impacts on the industry, food security, and the environment. J. Environ. Qual. 2013, 42, 972–981. [Google Scholar] [CrossRef]
  4. Nabila, E.; Abourayya, M.; Mahmoud, T.S.M.; Eisa, R.; Rakha, A.M.; Amin, O. Evaluation of almond young trees growth and nutritional status under different slow-release compound fertilizer types and doses at Nubaria region. Bull. Natl. Res. Cent. 2019, 43, 188. [Google Scholar] [CrossRef]
  5. Vejan, P.; Khadiran, T.; Abdullah, R.; Ahmad, N. Controlled release fertilizer: A review on developments, applications and potential in agriculture. J. Control. Release 2021, 339, 321–334. [Google Scholar] [CrossRef]
  6. Chen, J.; Lv, S.; Zhang, Z.; Zhao, X.; Li, X.; Ning, P.; Liu, M. Environmentally friendly fertilizers: A review of materials used and their effects on the environment. Sci. Total Environ. 2018, 613, 829–839. [Google Scholar] [CrossRef] [PubMed]
  7. Davidson, D.; Gu, F.X. Materials for sustained and controlled release of nutrients and molecules to support plant growth. J. Agric. Food Chem. 2012, 60, 870–876. [Google Scholar] [CrossRef] [PubMed]
  8. Kassem, I.; Ablouh, E.-H.; El Bouchtaoui, F.-Z.; Kassab, Z.; Hannache, H.; Sehaqui, H.; El Achaby, M. Biodegradable all-cellulose composite hydrogel as eco-friendly and efficient coating material for slow-release MAP fertilizer. Prog. Org. Coat. 2022, 162, 106575. [Google Scholar] [CrossRef]
  9. Ippolito, J.A.; Tarkalson, D.D.; Lehrsch, G.A. Zeolite soil application method affects inorganic nitrogen, moisture, and corn growth. Soil Sci. 2011, 176, 136–142. [Google Scholar] [CrossRef]
  10. Van Speybroeck, V.; Hemelsoet, K.; Joos, L.; Waroquier, M.; Bell, R.G.; Catlow CR, A. Advances in theory and their application within the field of zeolite chemistry. Chem. Soc. Rev. 2015, 44, 7044–7111. [Google Scholar] [CrossRef] [PubMed]
  11. Luo, Y.; Hong, Y.; Shen, L.; Wu, F.; Lin, X. Multifunctional role of polyvinylpyrrolidone in pharmaceutical formulations. AAPS PharmSciTech 2021, 22, 34. [Google Scholar] [CrossRef] [PubMed]
  12. Nagarkar, R.; Patel, J. Polyvinyl alcohol: A comprehensive study. Acta Sci. Pharm. Sci. 2019, 3, 34–44. [Google Scholar]
  13. Shi, R.; Bi, J.; Zhang, Z.; Zhu, A.; Chen, D.; Zhou, X.; Tian, W. The effect of citric acid on the structural properties and cytotoxicity of the polyvinyl alcohol/starch films when molding at high temperature. Carbohydr. Polym. 2008, 74, 763–770. [Google Scholar] [CrossRef]
  14. Sajjan, A.M.; Naik, M.L.; Kulkarni, A.S.; Rudgi, U.F.-E.-H.; Ashwini, M.; Shirnalli, G.G.; Kalahal, P.B. Preparation and characterization of PVA-Ge/PEG-400 biodegradable plastic blend films for packaging applications. Chem. Data Collections. 2020, 26, 100338. [Google Scholar] [CrossRef]
  15. Yu, Z.; Li, B.; Chu, J.; Zhang, P. Silica in situ enhanced PVA/chitosan biodegradable films for food packages. Carbohydr. Polym. 2018, 184, 214–220. [Google Scholar] [CrossRef]
  16. Liu, Y.; Hu, H.; Yang, X.; Lv, J.; Zhou, L.; Luo, Z. Hydrophilic modification on polyvinyl alcohol membrane by hyaluronic acid. Biomed. Mater. 2019, 14, 055009. [Google Scholar] [CrossRef]
  17. Gowsia, I.; Mir, F.A.; Banday, J.A. Preparation and characterization of polyvinyl alcohol–piperic acid composite film for potential food packaging applications. Prog. Biomater. 2022, 11, 281–295. [Google Scholar] [CrossRef]
  18. Wang, Y.; Meng, Y.; Ji, Z.; Meng, X.; Song, X.; Lu, P.; Chen, F. Bioinspired colored degradable starch-based films with excellent tensile strength. Ind. Crops Prod. 2021, 167, 113525. [Google Scholar] [CrossRef]
  19. Miles, K.B.; Ball, R.L.; Matthew HW, T. Chitosan films with improved tensile strength and toughness from N-acetyl-cysteine mediated disulfide bonds. Carbohydr. Polym. 2016, 139, 1–9. [Google Scholar] [CrossRef]
  20. Sari, M.; Tamrin Kaban, J.; Alfian, Z. The effect of glutaraldehyde on the properties of Chi-Pec-PVA membrane. Pap. Presented AIP Conf. Proc. 2020, 2267, 020049. [Google Scholar]
  21. Shaari, N.; Kamarudin, S.; Basri, S.; Shyuan, L.; Masdar, M.; Nordin, D. Enhanced mechanical flexibility and performance of sodium alginate polymer electrolyte bio-membrane for application in direct methanol fuel cell. J. Appl. Polym. Sci. 2018, 135, 46666. [Google Scholar] [CrossRef]
  22. He, X.; Oyadiji, S. Application of coefficient of variation in reliability-based mechanical design and manufacture. J. Mater. Processing Technol. 2001, 119, 374–378. [Google Scholar] [CrossRef]
  23. Lotfi, F.H.; Nematollahi, N.; Behzadi, M.; Mirbolouki, M. Ranking decision making units with stochastic data by using coefficient of variation. Math. Comput. Appl. 2010, 15, 148–155. [Google Scholar] [CrossRef] [Green Version]
  24. Zheng, H.P.; Xue, M.; Han, Y.; Zhang, W.C. Application of the Variation Coefficient Method to Comprehensive Evaluation of Wind Farms. Int. Conf. Adv. Eng. Mater. Archit. Sci. 2014, 488, 1447–1453. [Google Scholar] [CrossRef]
  25. Han, Y.; Chen, S.; Yang, M.; Zou, H.; Zhang, Y. Inorganic matter modified water-based copolymer prepared by chitosan-starch-CMC-Na-PVAL as an environment-friendly coating material. Carbohydr. Polym. 2020, 234, 115925. [Google Scholar] [CrossRef] [PubMed]
  26. Huang, X.X.; Ma, H.H.; Sun, C.; Xu, W.B.; Zhou, Z.F. Preparation and characterization of modified acylated chitosan slow-release fertilizer coating materials. Polym. Mater. Sci. Eng. 2016, 32, 133–137. (In Chinese) [Google Scholar]
  27. Hemalatha, K.; Somashekarappa, H.; Somashekar, R. Micro-structure, AC conductivity and spectroscopic studies of cupric sulphate doped PVA/PVP polymer composites. Adv. Mater. Phys. Chem. 2015, 5, 408. [Google Scholar] [CrossRef] [Green Version]
  28. Choudhary, S. Characterization of amorphous silica nanofiller effect on the structural, morphological, optical, thermal, dielectric and electrical properties of PVA–PVP blend based polymer nanocomposites for their flexible nanodielectric applications. J. Mater. Sci. Mater. Electron. 2018, 29, 10517–10534. [Google Scholar] [CrossRef]
  29. He, Y.; Zhu, B.; Inoue, Y. Hydrogen bonds in polymer blends. Prog. Polym. Sci. 2004, 29, 1021–1051. [Google Scholar] [CrossRef]
  30. Han, X.; Chen, S.; Hu, X. Controlled-release fertilizer encapsulated by starch/polyvinyl alcohol coating. Desalination 2009, 240, 21–26. [Google Scholar] [CrossRef]
  31. He, X.; Chan, W.H.; Ng, C.F. Water–alcohol separation by pervaporation through zeolite-modified poly (amidesulfonamide). J. Appl. Polym. Sci. 2001, 82, 1323–1329. [Google Scholar] [CrossRef]
  32. Chen, S.; Yang, M.; Ba, C.; Yu, S.; Jiang, Y.; Zou, H.; Zhang, Y. Preparation and characterization of slow-release fertilizer encapsulated by biochar-based waterborne copolymers. Sci. Total Environ. 2018, 615, 431–437. [Google Scholar] [CrossRef] [PubMed]
  33. Ge, Q.L.; Feng, K.Q.; Wang, S.F.; Hou, R. Effect of Co-Application of Phosphorus-Modified Hydrochar and Zeolite on Release of Soil Available Phosphorus. Res. Environ. Sci. 2022, 35, 219–229. (In Chinese) [Google Scholar]
  34. Zagho, M.M.; Hassan, M.K.; Khraisheh, M.; Al-Maadeed MA, A.; Nazarenko, S. A review on recent advances in CO2 separation using zeolite and zeolite-like materials as adsorbents and fillers in mixed matrix membranes (MMMs). Chem. Eng. J. Adv. 2021, 6, 100091. [Google Scholar] [CrossRef]
  35. Inglezakis, V.J. The concept of “capacity” in zeolite ion-exchange systems. J. Colloid Interface Sci. 2005, 281, 68–79. [Google Scholar] [CrossRef]
  36. Zidan, H.M.; Abdelrazek, E.M.; Abdelghany, A.M.; Tarabiah, A.E. Characterization and some physical studies of PVA/PVP filled with MWCNTs. J. Mater. Res. Technol. 2019, 8, 904–913. [Google Scholar] [CrossRef]
  37. Beppu, M.; Vieira, R.; Aimoli, C.; Santana, C. Crosslinking of chitosan membranes using glutaraldehyde: Effect on ion permeability and water absorption. J. Membr. Sci. 2007, 301, 126–130. [Google Scholar] [CrossRef]
  38. Weber, L.M.; Lopez, C.G.; Anseth, K.S. Effects of PEG hydrogel crosslinking density on protein diffusion and encapsulated islet survival and function. J. Biomed. Mater. Res. Part A Off. J. Soc. Biomater. Jpn. Soc. Biomater. Aust. Soc. Biomater. Korean Soc. Biomater. 2009, 90, 720–729. [Google Scholar] [CrossRef] [Green Version]
  39. Wu, Y.; Joseph, S.; Aluru, N. Effect of cross-linking on the diffusion of water, ions, and small molecules in hydrogels. J. Phys. Chem. B 2009, 113, 3512–3520. [Google Scholar] [CrossRef] [Green Version]
  40. Yang, L.; An, D.; Wang, T.-J.; Kan, C.; Jin, Y. Swelling and diffusion model of a hydrophilic film coating on controlled-release urea particles. Particuology 2017, 30, 73–82. [Google Scholar] [CrossRef]
  41. Te Hennepe, H.; Bargeman, D.; Mulder, M.; Smolders, C. Zeolite-filled silicone rubber membranes: Part 1. Membrane preparation and pervaporation results. J. Membr. Sci. 1987, 35, 39–55. [Google Scholar] [CrossRef] [Green Version]
  42. Chang, B.P.; Akil, H.M.; Nasir, R.M. Mechanical and tribological properties of zeolite-reinforced UHMWPE composite for implant application. Procedia Eng. 2013, 68, 88–94. [Google Scholar] [CrossRef]
  43. Reinhart, C.T.; Peppas, N.A. Solute diffusion in swollen membranes. Part II Influ. Crosslink. Diffus. Prop. J. Membr. Sci. 1984, 18, 227–239. [Google Scholar]
  44. Chen, X.; Wang, Y.; Cheng, Z.; Wei, J.; Shi, Y.; Qian, J. Diffusion behavior of drug molecules in acrylic pressure-sensitive adhesive. ACS Omega 2020, 5, 9408–9419. [Google Scholar] [CrossRef] [PubMed]
  45. Wang, J.; Tian, P.; Li, N.-F. The combination determining weights method of factors affecting software reliability. Presented at the 2016 5th International Conference on Computer Science and Network Technology (ICCSNT), Changchun, China, 10–11 December 2016; pp. 121–124. [Google Scholar]
  46. Zou, Y.; Yuan, C.; Cui, B.; Liu, P.; Wu, Z.; Zhao, H. Formation of high amylose corn starch/konjac glucomannan composite film with improved mechanical and barrier properties. Carbohydr. Polym. 2021, 251, 117039. [Google Scholar] [CrossRef] [PubMed]
  47. Niu, X.; Ma, Q.; Li, S.; Wang, W.; Ma, Y.; Zhao, H.; Wang, J. Preparation and characterization of biodegradable composited films based on potato starch/glycerol/gelatin. J. Food Qual. 2021, 2021, 6633711. [Google Scholar] [CrossRef]
  48. Ju, X.; Lei, T.; Guo, X.; Sun, X.; Ma, J.; Liu, R.; Zhang, M. Evaluation of Suitable Water–Zeolite Coupling Regulation Strategy of Tomatoes with Alternate Drip Irrigation under Mulch. Horticulturae 2022, 8, 536. [Google Scholar] [CrossRef]
  49. Lee, I.; Park, J. Assessment and classification of Korean indigenous corn lines by application of principal component analysis. Korean J. Life Sci. 2003, 13, 343–348. [Google Scholar]
  50. Wang, X.; Cui, S.; Sun, Z.; Mu, G.; Cui, S.; Wang, P.; Liu, L. Ecological adaptability evaluation of peanut cultivars based on biomass and nutrient accumulation. Ying Yong Sheng Tai Xue Bao. J. Appl. Ecol. 2015, 26, 2023–2029. [Google Scholar]
Figure 1. Hydrophilicity of membrane materials under different ratios of water-based copolymer and zeolite amounts. (a) Water absorption, (b) Water permeability.
Materials 15 08553 g001
Figure 2. Mechanical properties of membrane materials under different ratios of water-based copolymer and zeolite amounts. (a)Tensile strength, (b) Elongation at break.
Materials 15 08553 g002
Figure 3. Viscosity of membrane materials under different ratios of water-based copolymer and zeolite amounts.
Materials 15 08553 g003
Figure 4. Release rate of membrane materials under different ratios of water-based copolymer and zeolite amounts.
Materials 15 08553 g004
Figure 5. IR spectra of membrane materials under different ratios.
Materials 15 08553 g005
Figure 6. XRD of membrane materials under different ratios.
Materials 15 08553 g006
Figure 7. Electron microscopic photo of the membrane material surface.
Materials 15 08553 g007
Figure 8. Comprehensive score for different treatments.
Materials 15 08553 g008
Table 1. Weight coefficient of different indices.
IndexAverage ValueStandard DeviationCV ValueWeight (%)
Water absorption127.5225.390.2013.00
Water permeability94.6226.710.2818.44
Viscosity78.9328.640.3623.71
Fertility permeability0.170.060.3724.20
Tensile strength62.4613.940.2214.58
Elongation at break181.9716.880.096.06
Table 2. Eigenvalues and cumulative variance contribution rates of membrane evaluation factors.
IngredientEigenvaluesVariance Contribution Rate (%)Cumulative Variance Contribution Rate (%)
14.81180.17980.179
20.5579.28589.464
30.4307.16596.629
40.1342.23798.866
50.0681.134100.00
60.0000.000100.00
Publisher’s Note: MDPI stays neutral with regard to jurisdictional claims in published maps and institutional affiliations.

