
Impact of Shredded Rubber Waste (SRW) on the Range of Elastic Work of Road Construction Mixtures Containing Industrial Waste Bound with a Binder


Abstract
1. Introduction
- Energy recycling
- Product recycling
- Raw material recycling
- Material recycling
- Construction of road embankments
- Improving slope stability
- Retaining wall construction
- Construction of drainage and cut-off layers
- Construction of membranes and drainage layers
- Construction of road culverts
- For the modification of bituminous binders and mineral-asphalt mixtures
- As an additive to reinforce the subsoil
- Concrete additive
- Clay slates
- Mudstones
- Carbonaceous slates
- Sandstones
- Pebbles
- Mules
- Siderite
- Sphero-siderites
- Coal crumbs
2. Materials and Methods
2.1. Materials
2.2. Preparation of the Composite Mix
- Drying of all ingredients to constant weight at 105 °C
- Weighing the contents of the individual ingredients into separate containers
- Mixing together of shredded rubber waste, fly ash and CEM I 42.5 cement
- Adding to the mixture of shredded rubber waste, fly ash and cement about half of the water content needed to achieve optimum moisture content and mixing until a homogeneous mass is obtained
- Then the above mixture is added to the unburnt coal-mining slate with constant stirring. Mixing is carried out until the mixture becomes homogeneous, but not for longer than 5 min in order not to break up the aggregate grains too much.
- Once a homogeneous mass is obtained, the remaining water content is gradually added and mixed until homogeneous (no more than 2 min).
2.3. Preparation of Samples
2.4. Research Plan
- At the end of the treatment period the sample is placed in the testing machine
- We preload the specimen with a force of approximately 1.5 kN in order to align the contact surfaces of the specimen and to compensate for play in the compression fixtures.
- The specimen shall be subjected to 20 cycles of loading and unloading or until failure at a speed of 1.27 mm/min.
- During cyclic loading and unloading of the specimen, the compressive force and deformation of the specimen must be continuously monitored.
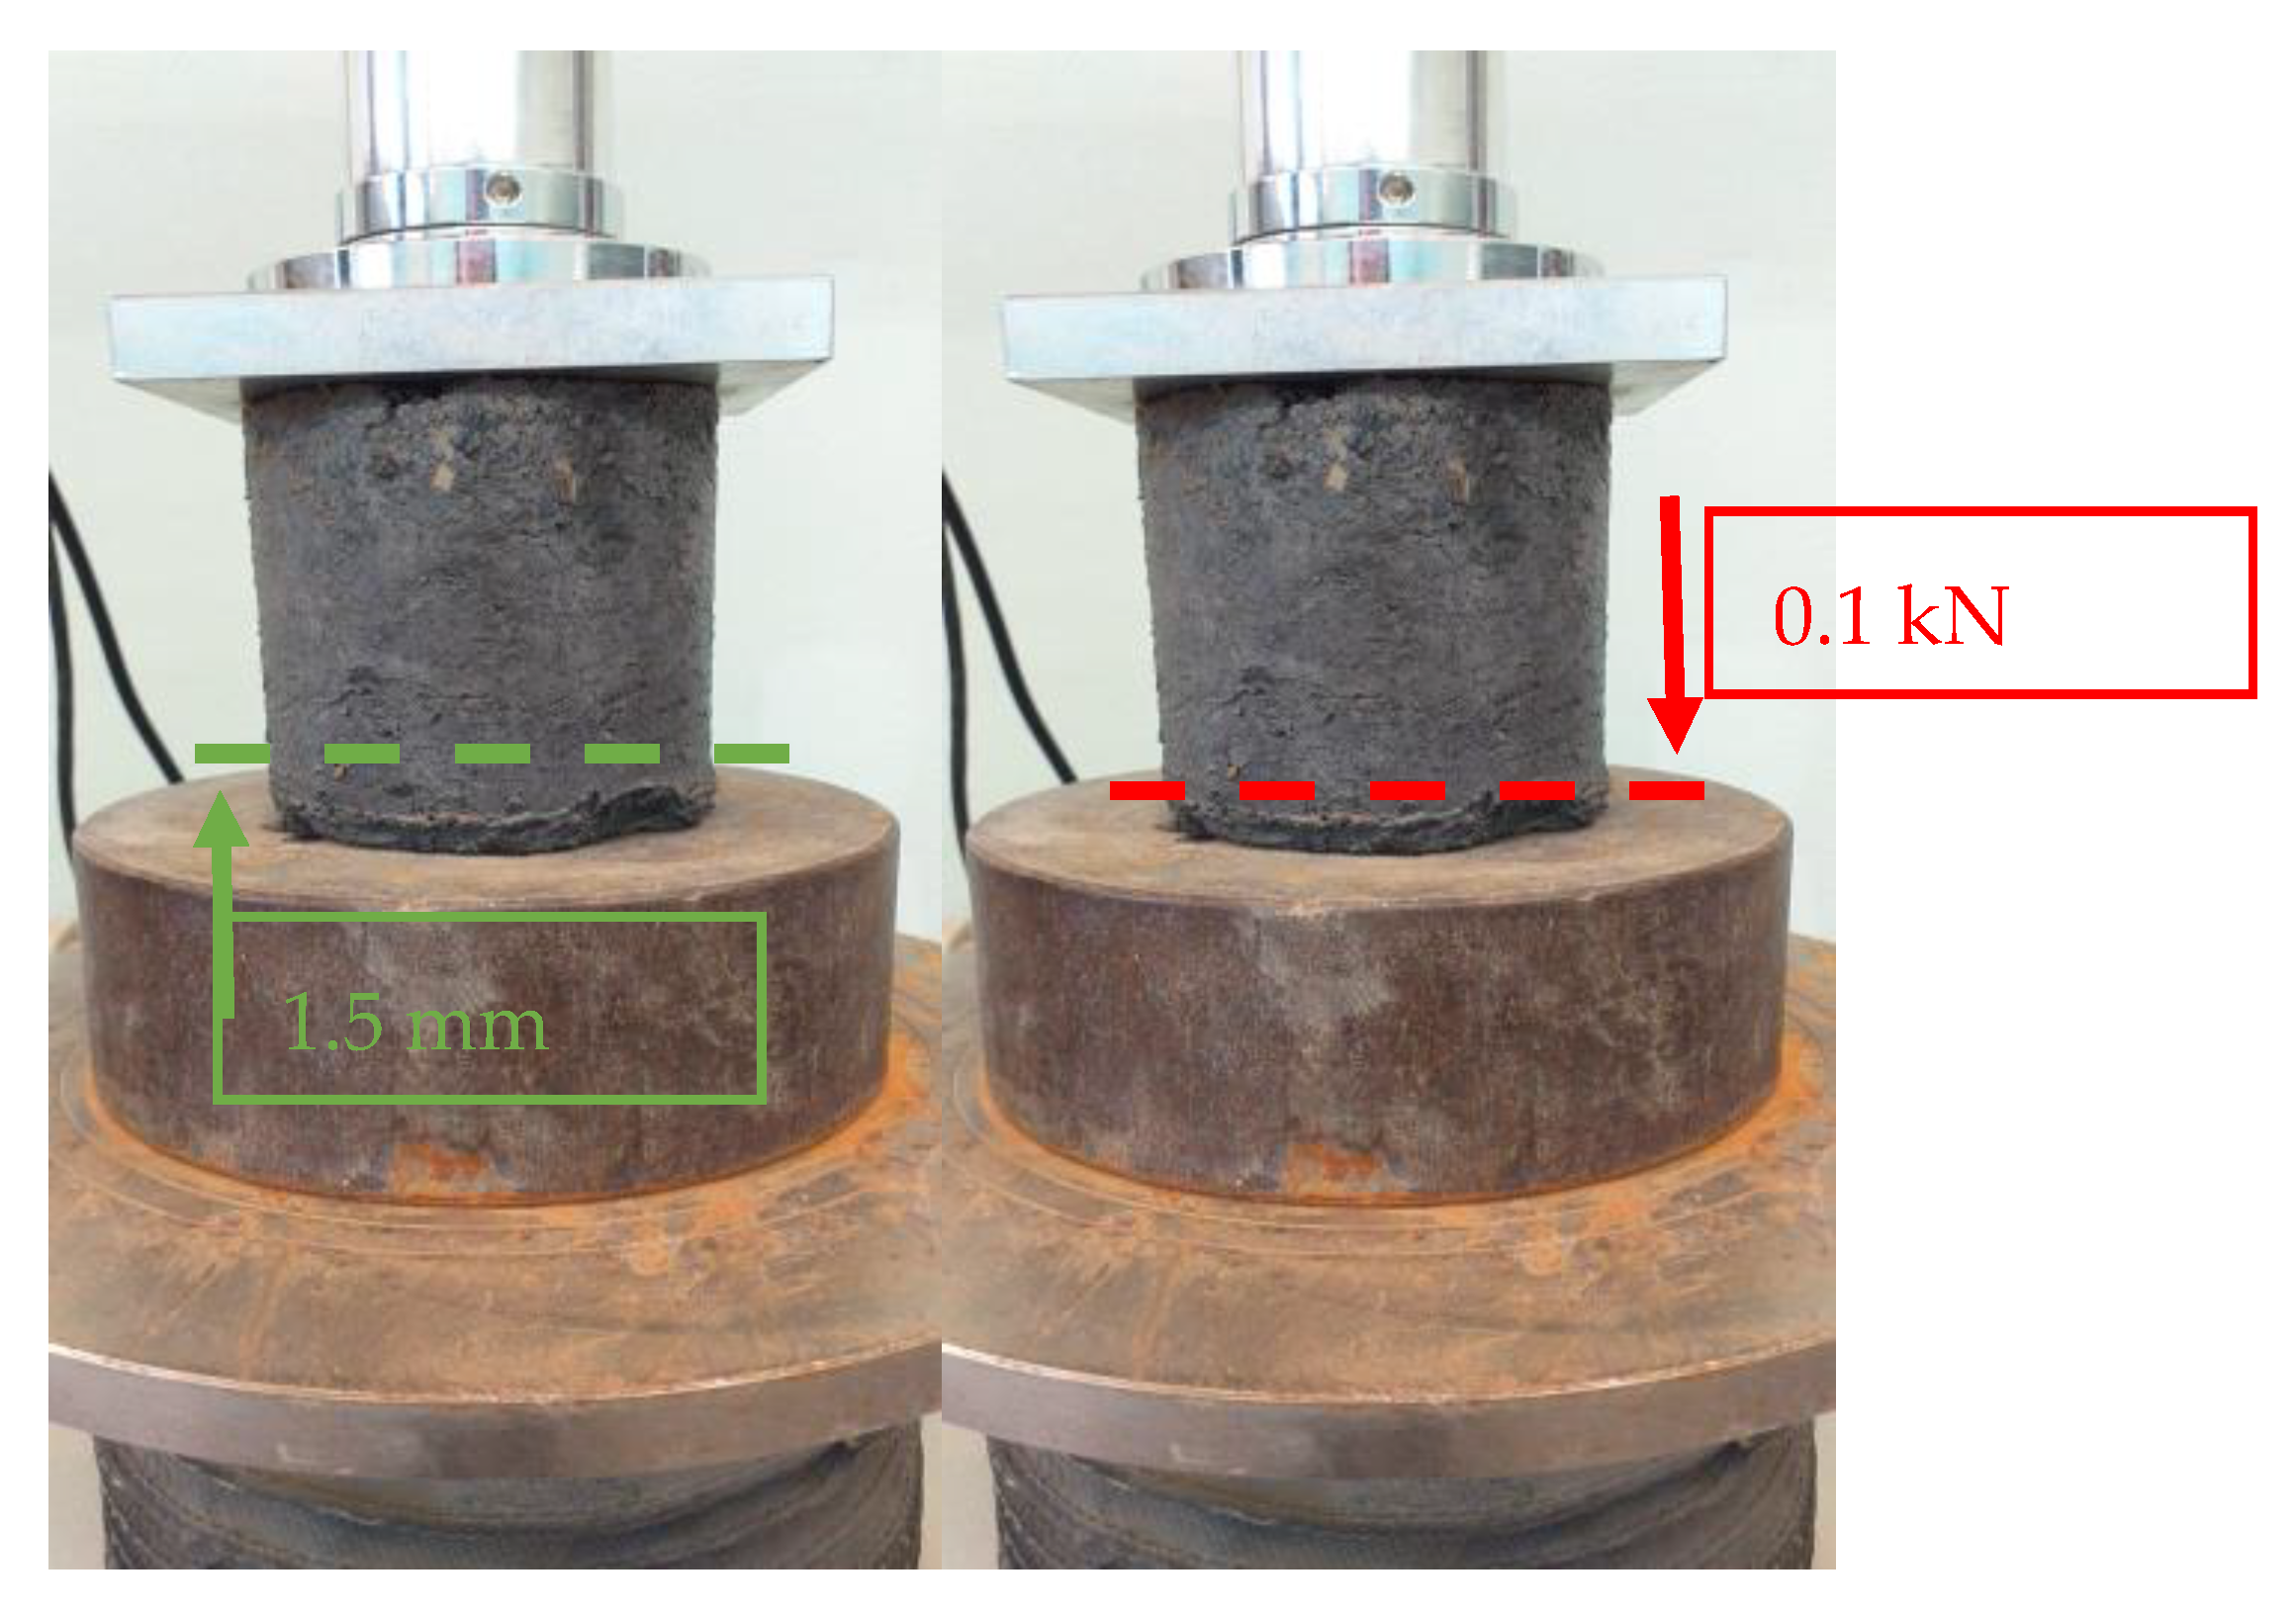
- Each of the loading and unloading cycles should consist of (Figure 5):
- ○
- Forcing a deformation of 1.5 mm on the specimen
- ○
- Relieving the specimen to a compressive force not exceeding 0.1 kN
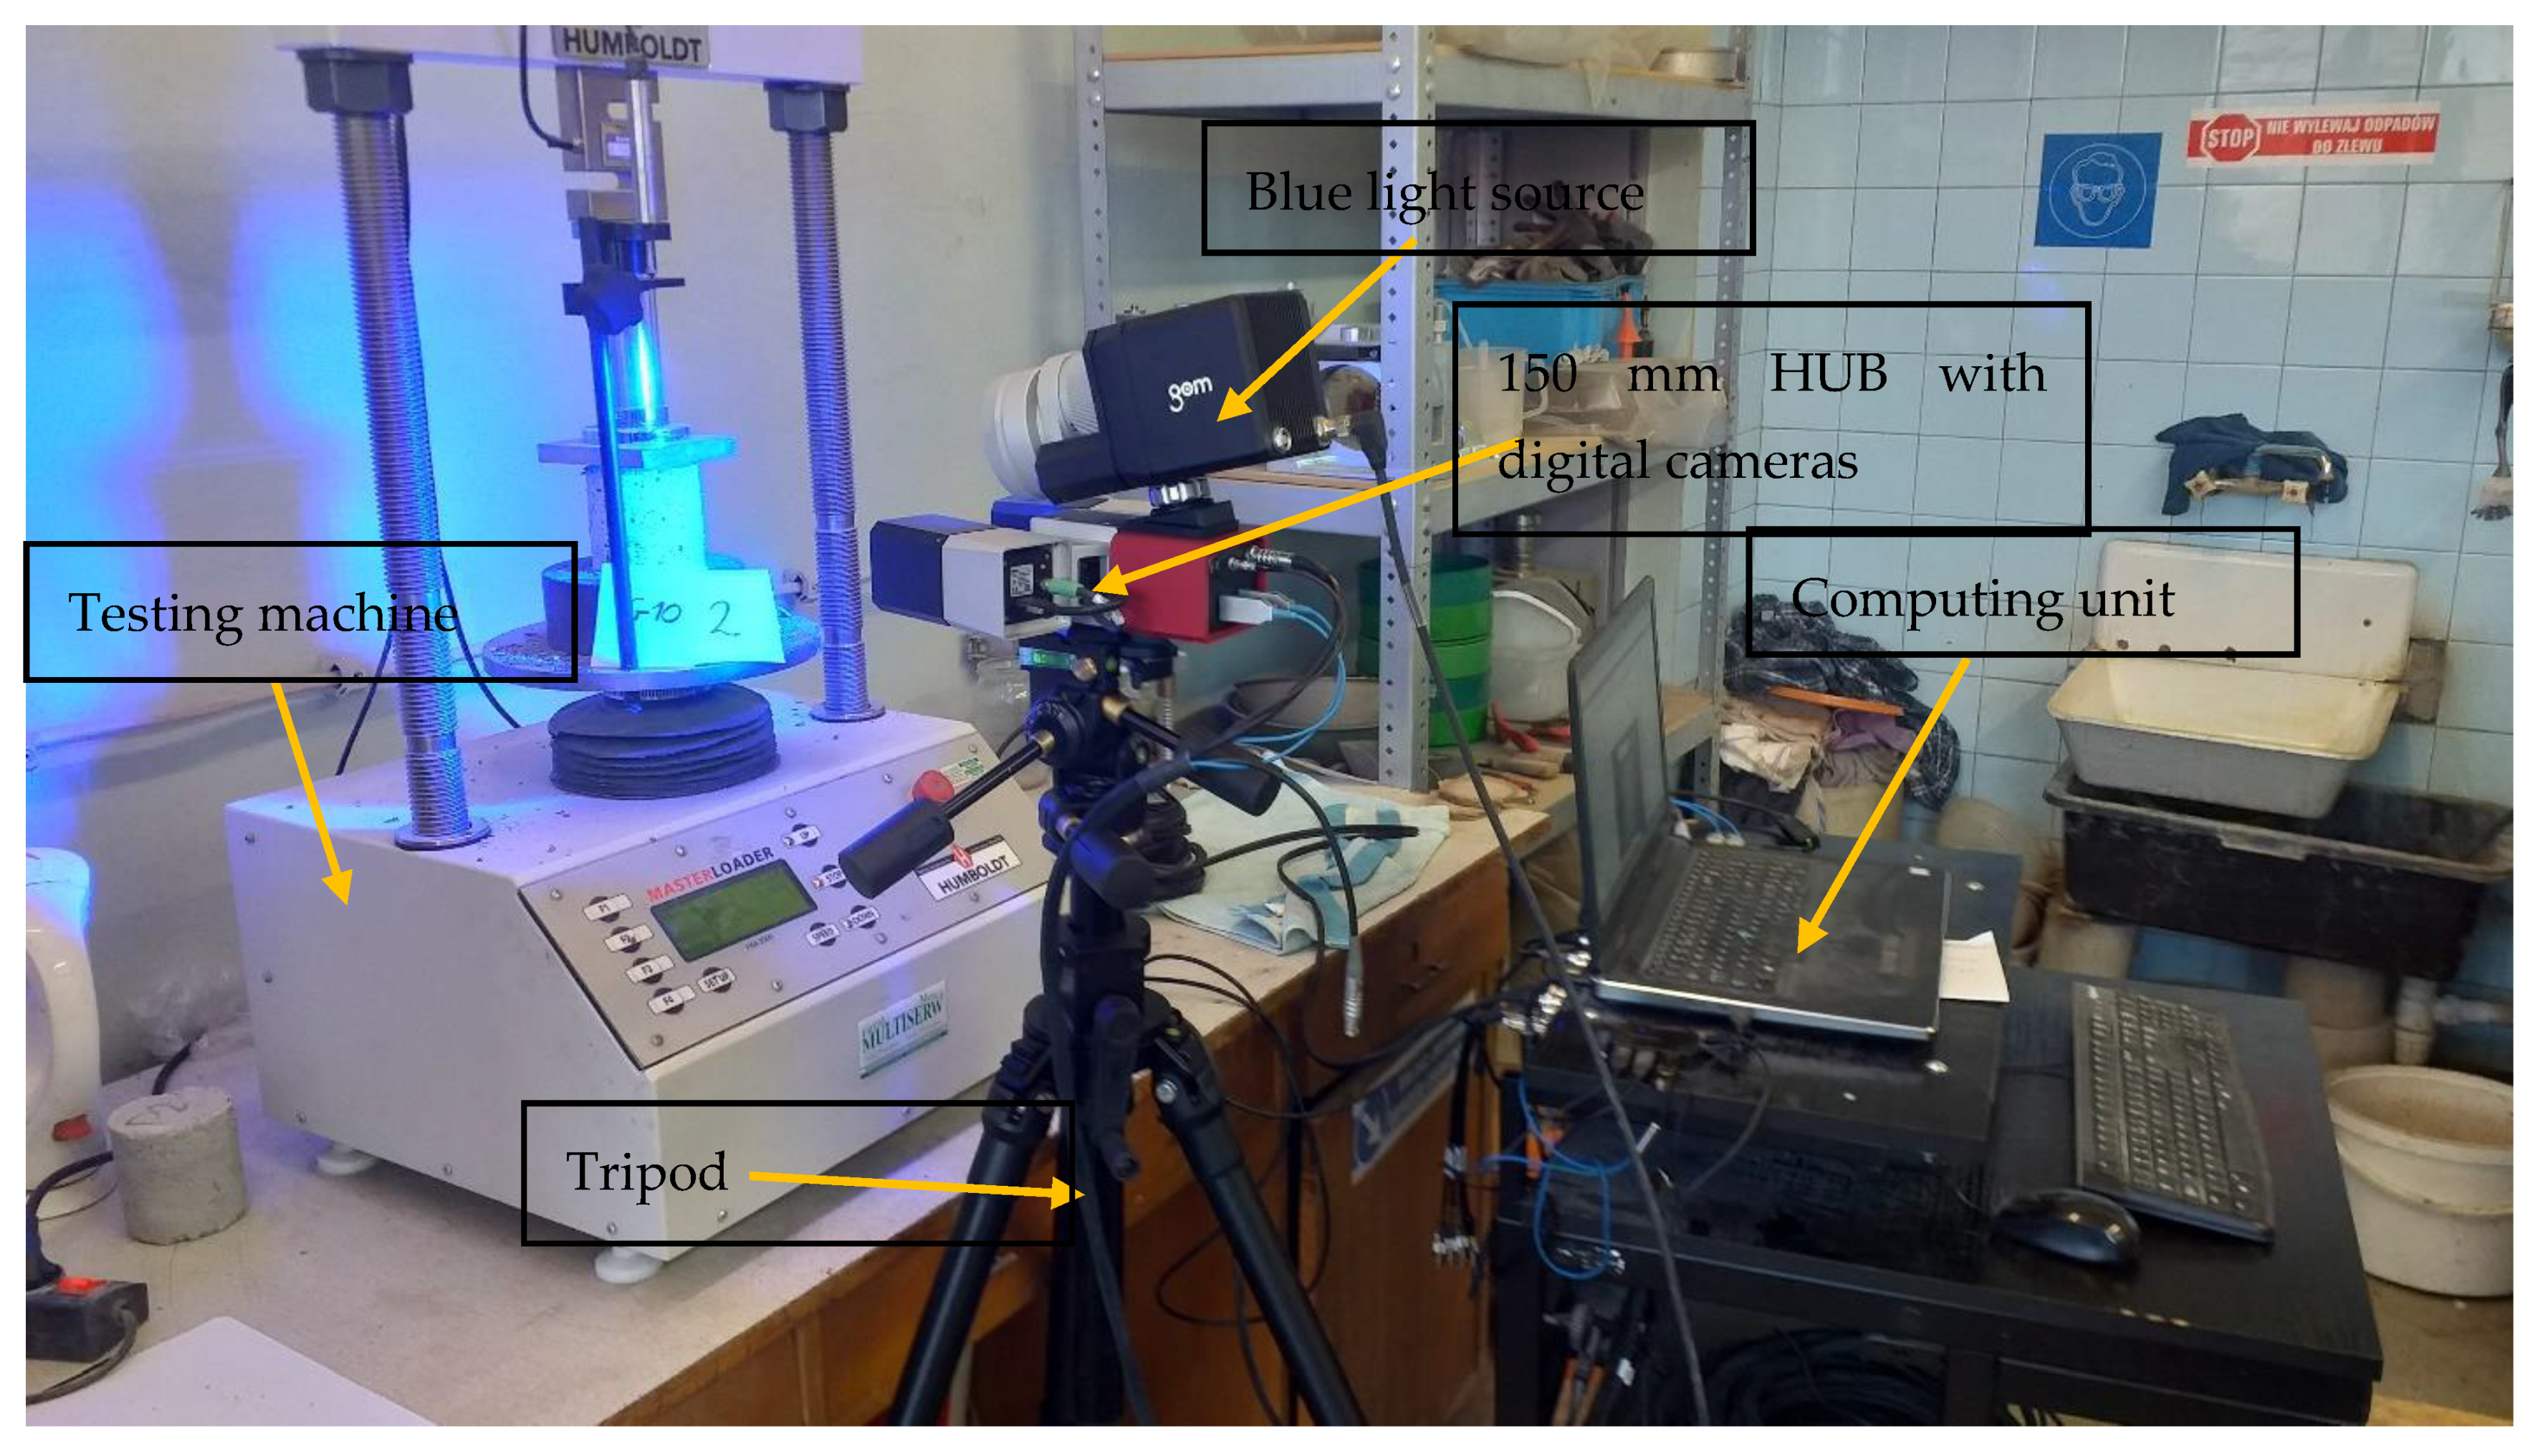
- Computing unit (laptop computer) with installed GOM Correlate Professional 2020 software
- Tripod
- A Humboldt HM-3000 testing machine with a maximum load of 50 kN and a maximum speed of 70 mm/min. The testing machine was coupled with a calculating unit to read and record the forces and deformations acting on the specimen
- 150 mm HUB with two digital cameras, 350 mm focal length and 150 × 120 × 90 mm research area
- Sources of blue light illuminating the test object
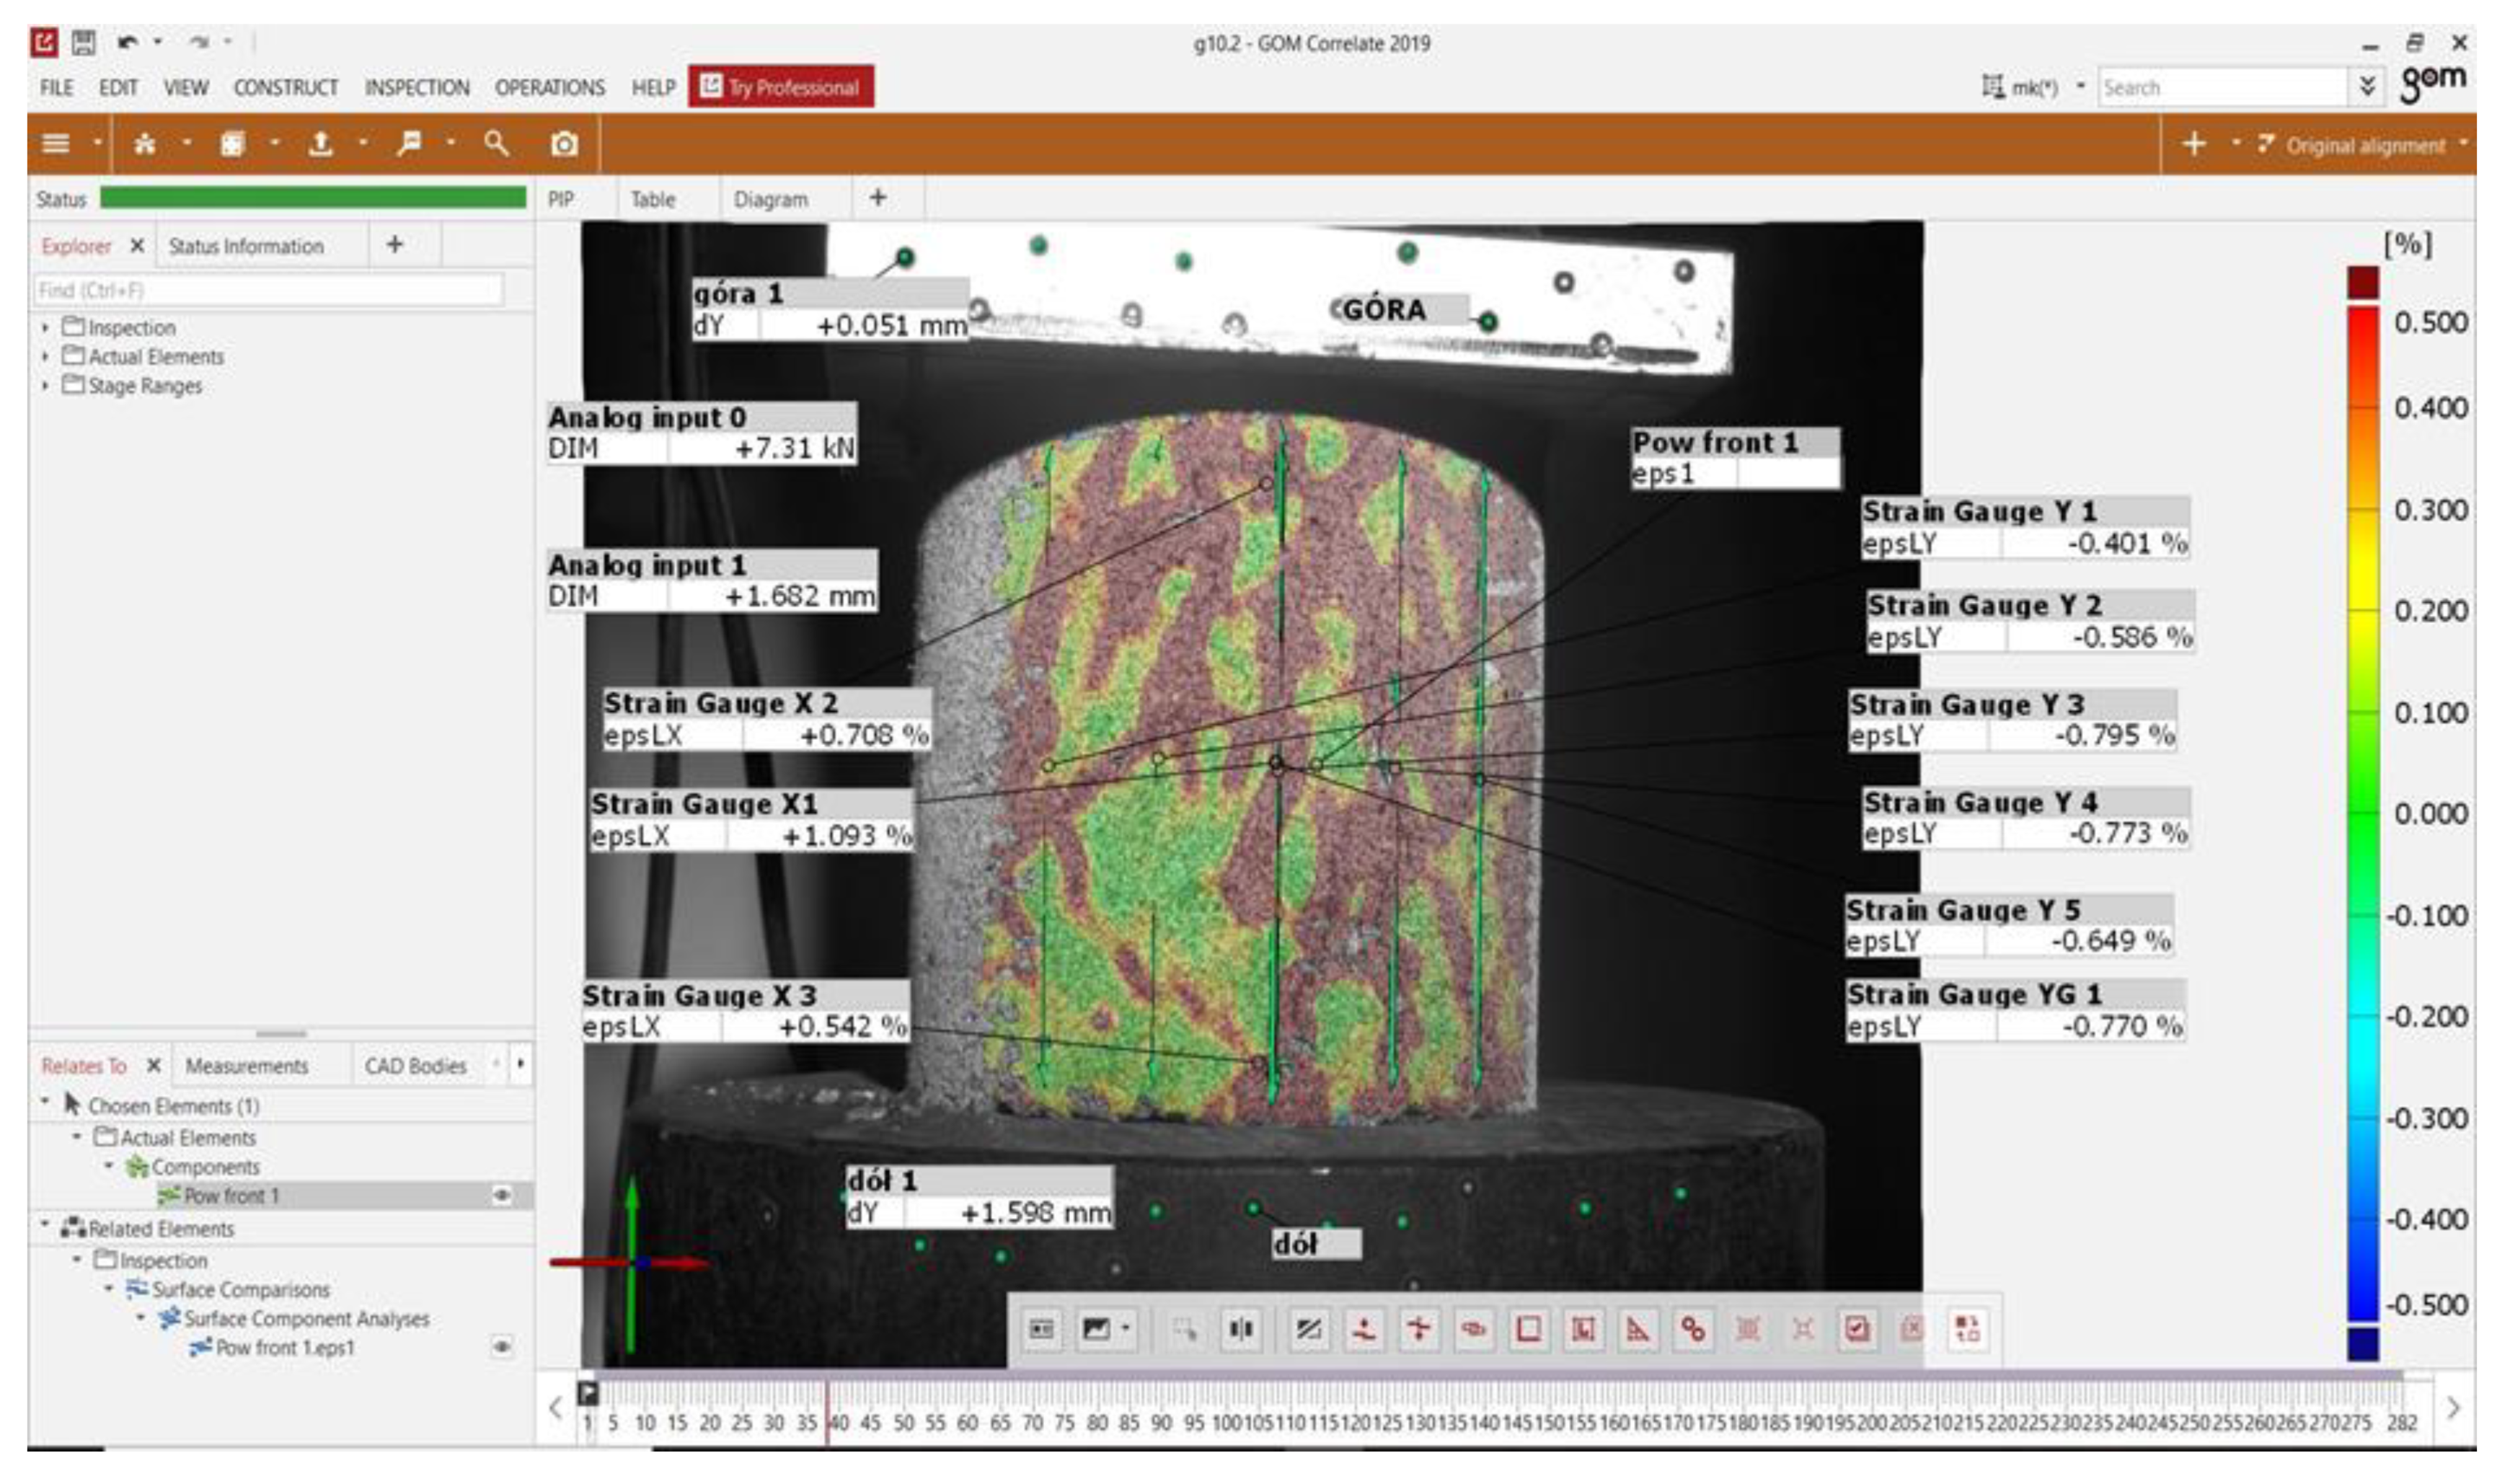
- Analog input 0—a combination of a computational unit and a test press used to provide a constant reading of the compressive force acting on the test specimen. Due to the noisy nature of the readings from the test press, the values were corrected using a temporary binomial filter with a value of 2 (the value of “2” corresponds to the number of adjacent frames of the recording that are taken into account when averaging the force readings).
- Analog input 1—connection between the computing unit and the testing press, used for constant reading of the displacement value realized by the press. Due to the high “noise” of the readout values, the reading had the following control function
- Bottom 1—Fixed points marked on the lower (movable) platen of the testing machine. They were used for precise measurement of vertical deformation of the specimen, forced by the testing press
- Top 1—Fixed points marked on the top (stationary) shelf of the testing machine. They were used to control the deflection of the articulated specimen compression attachment
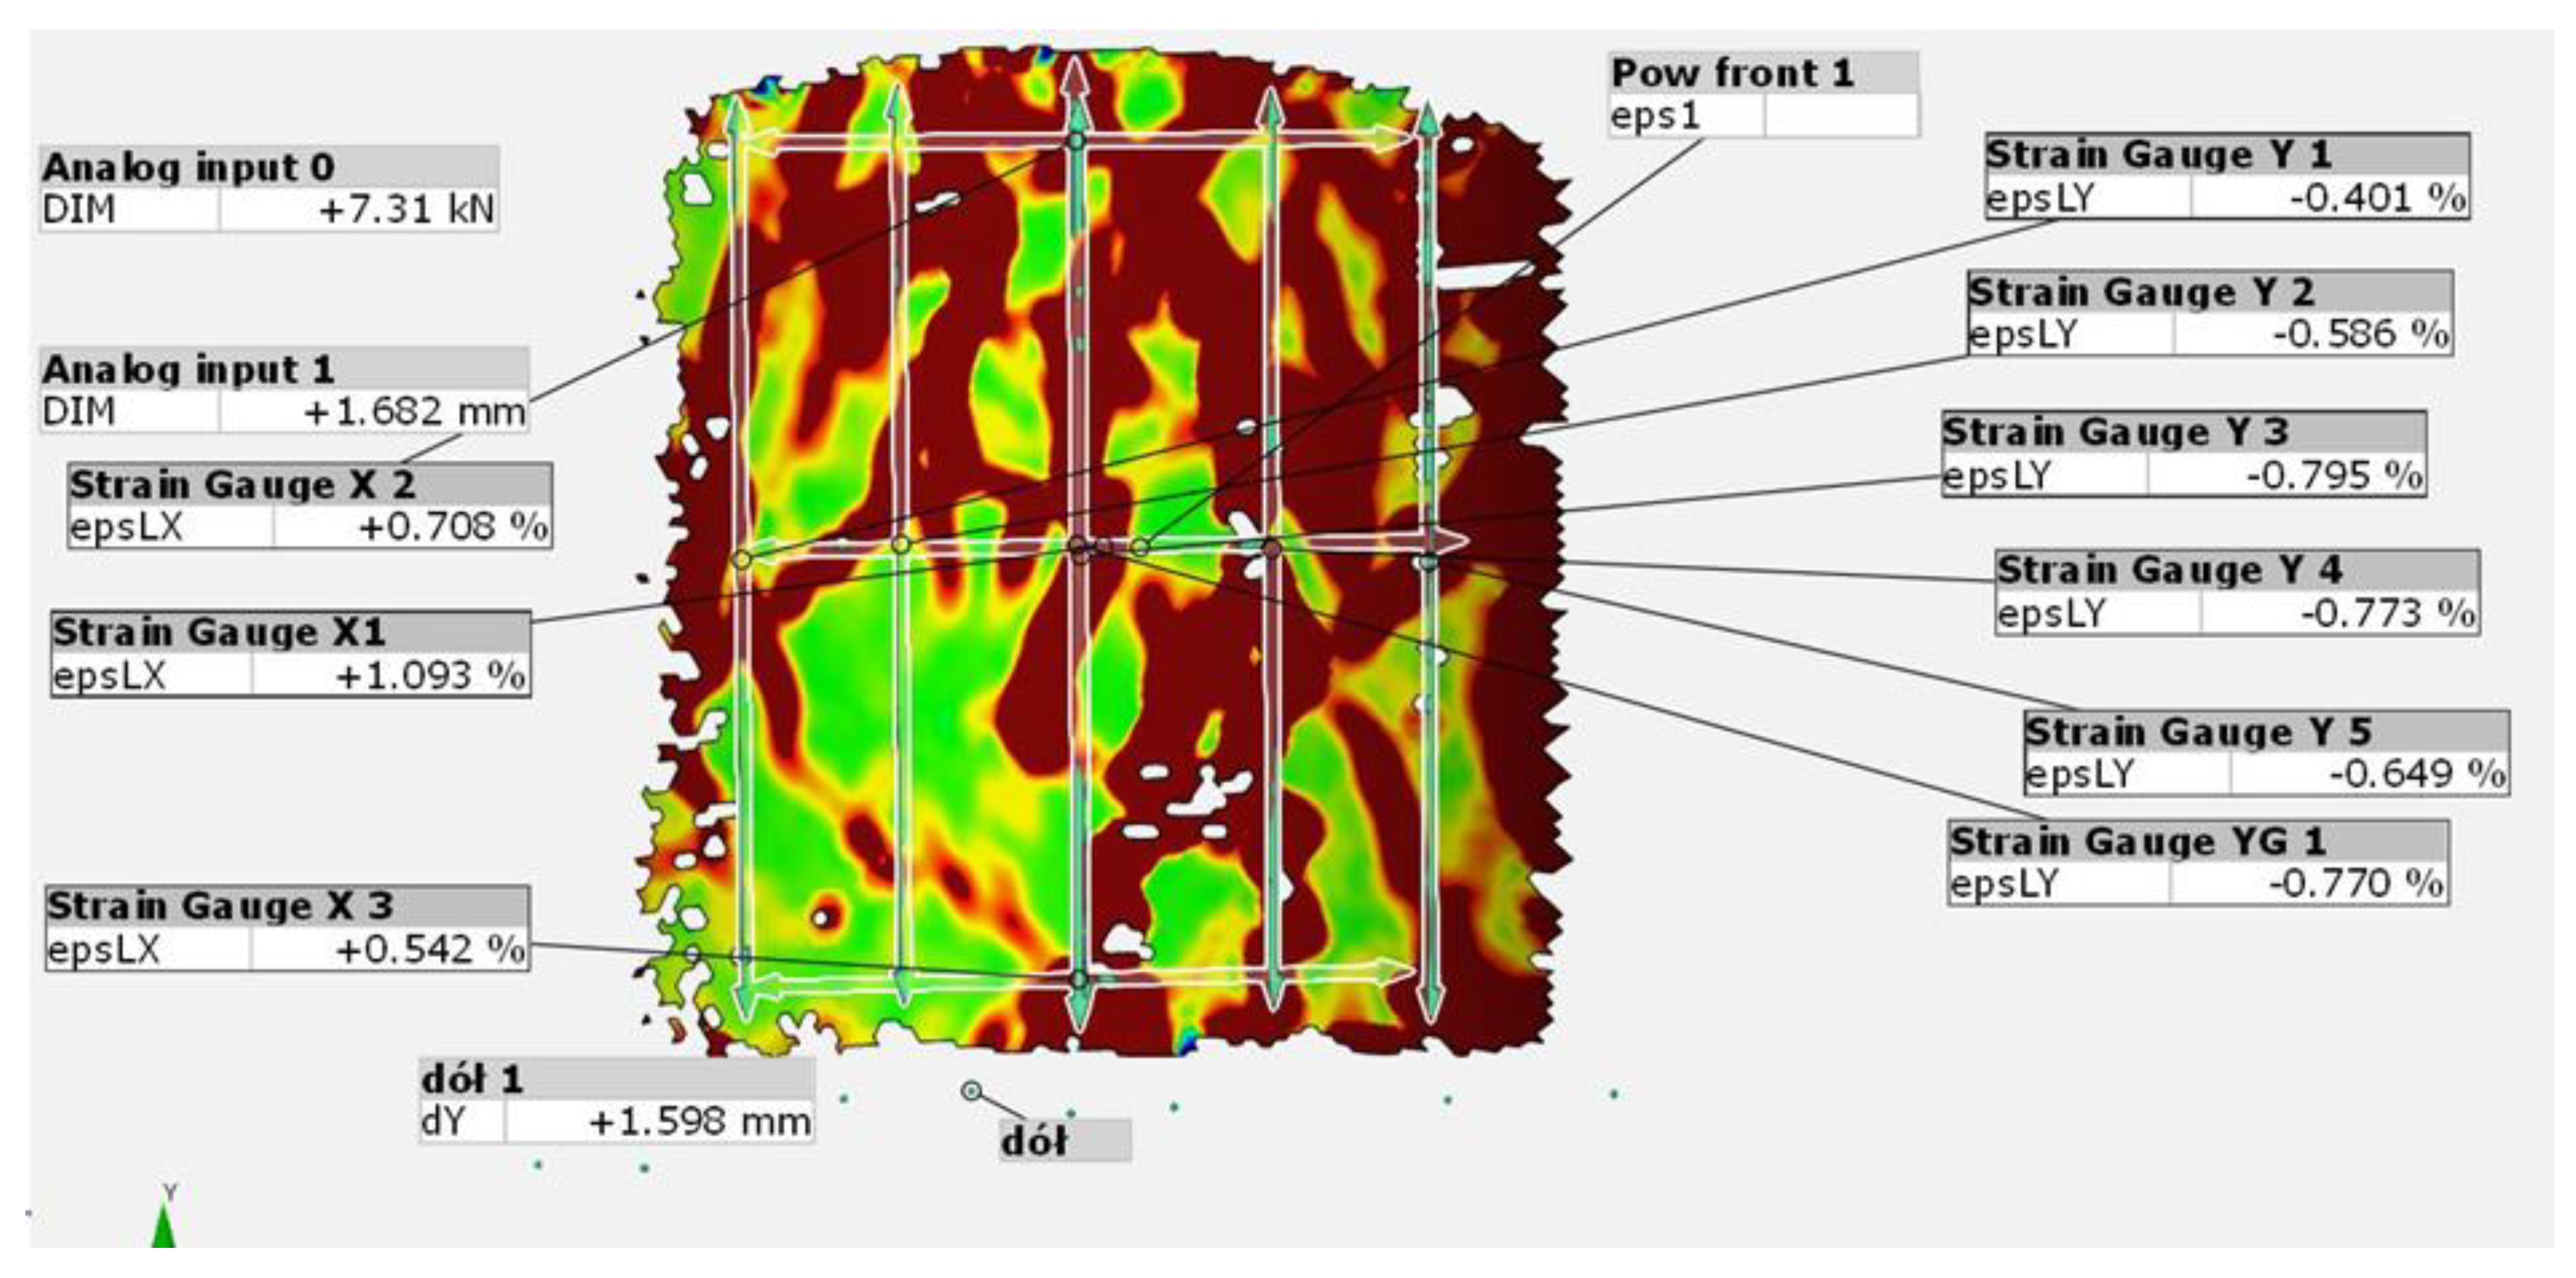
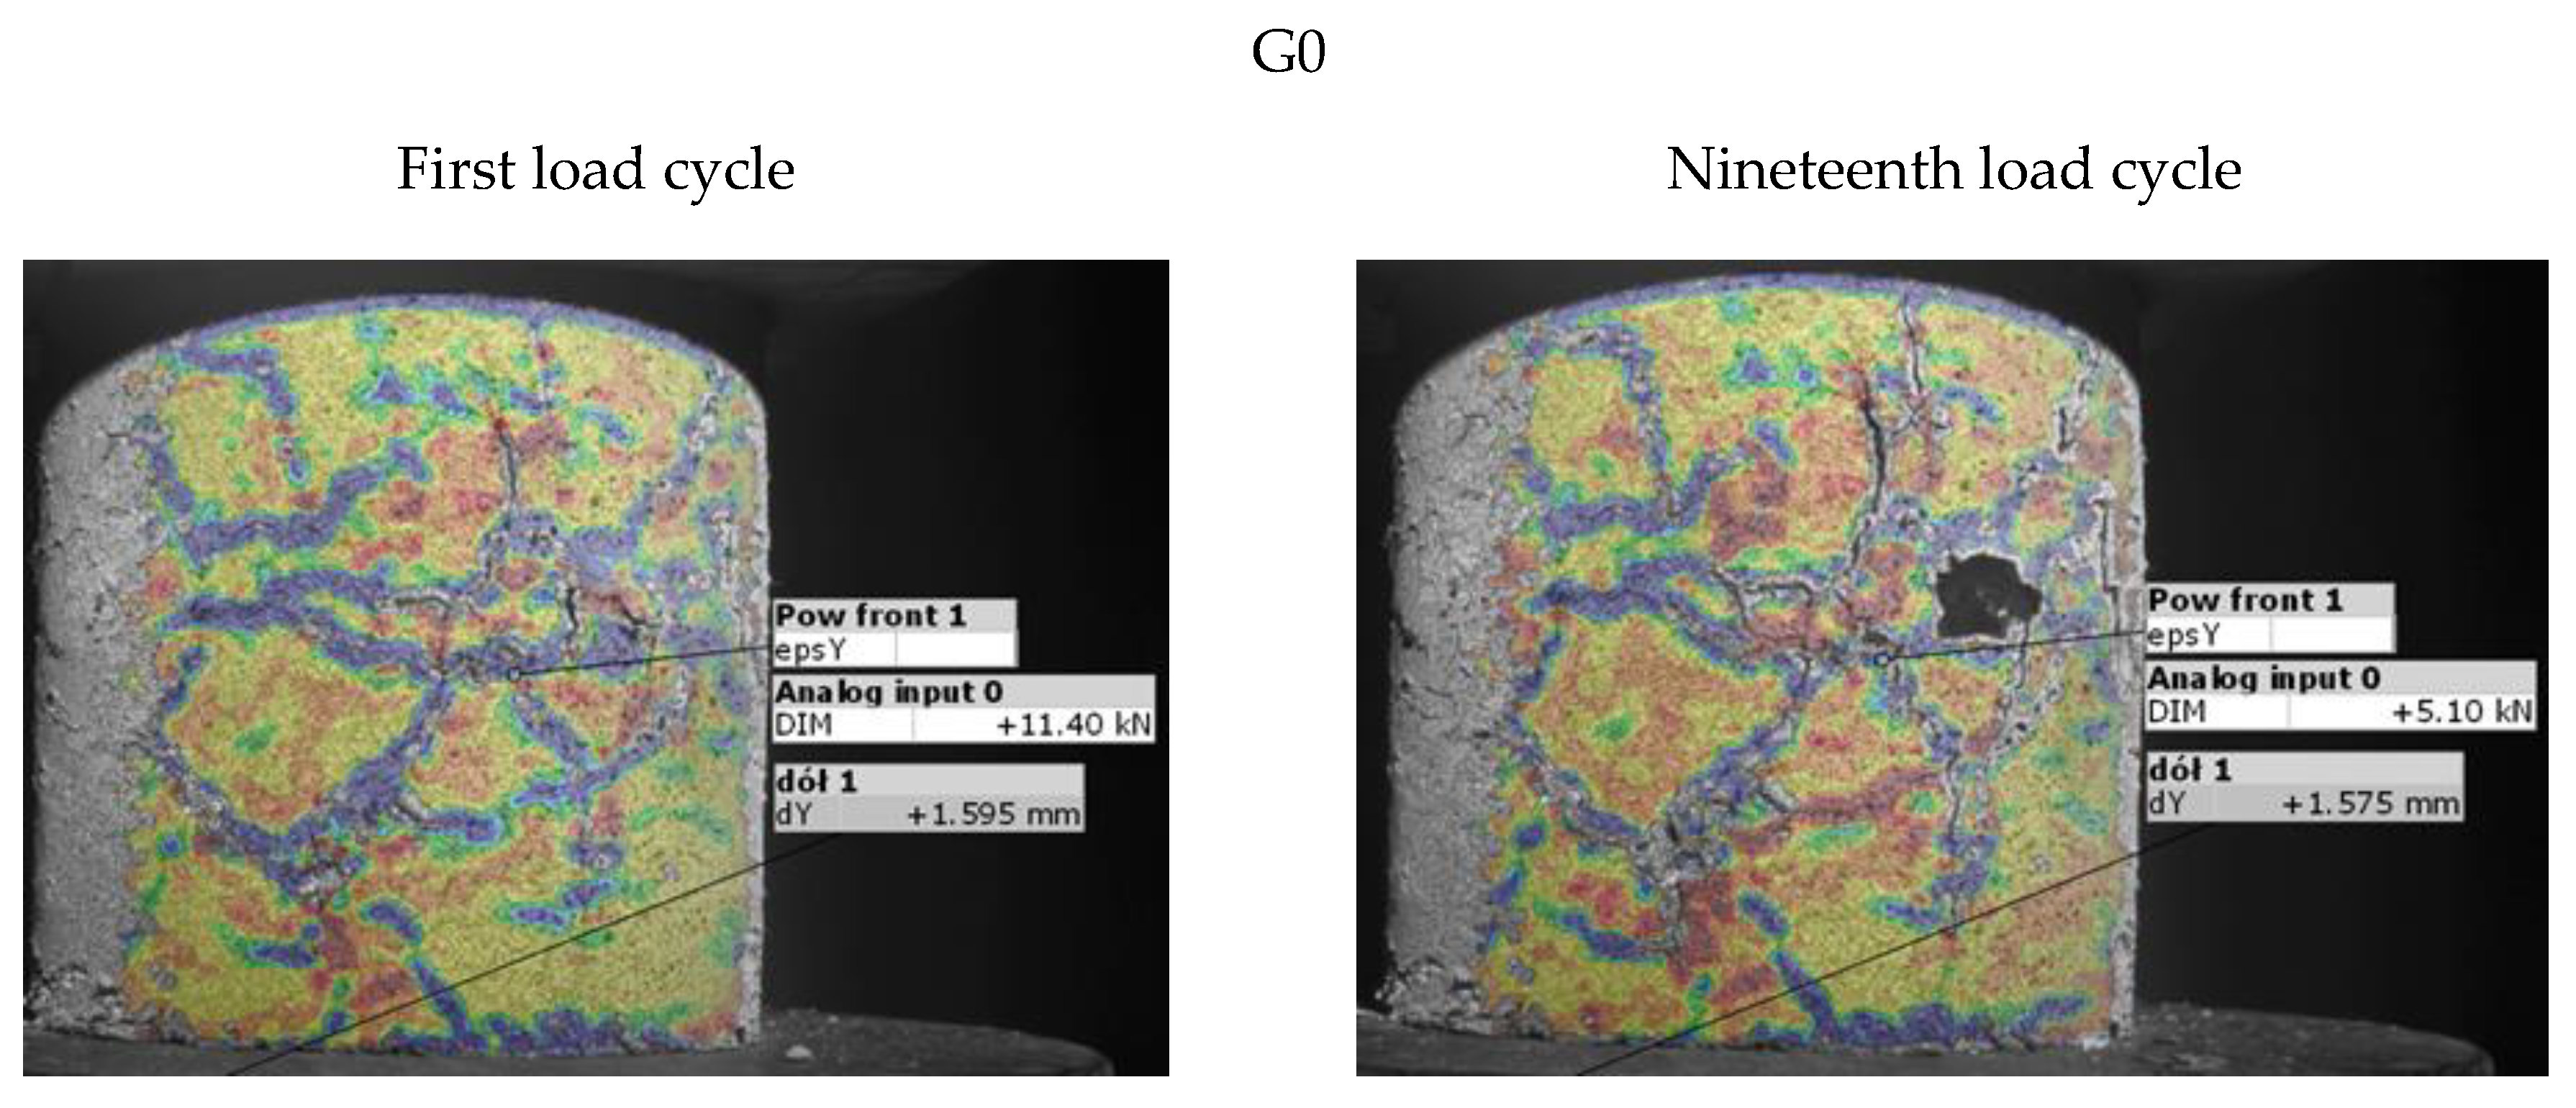
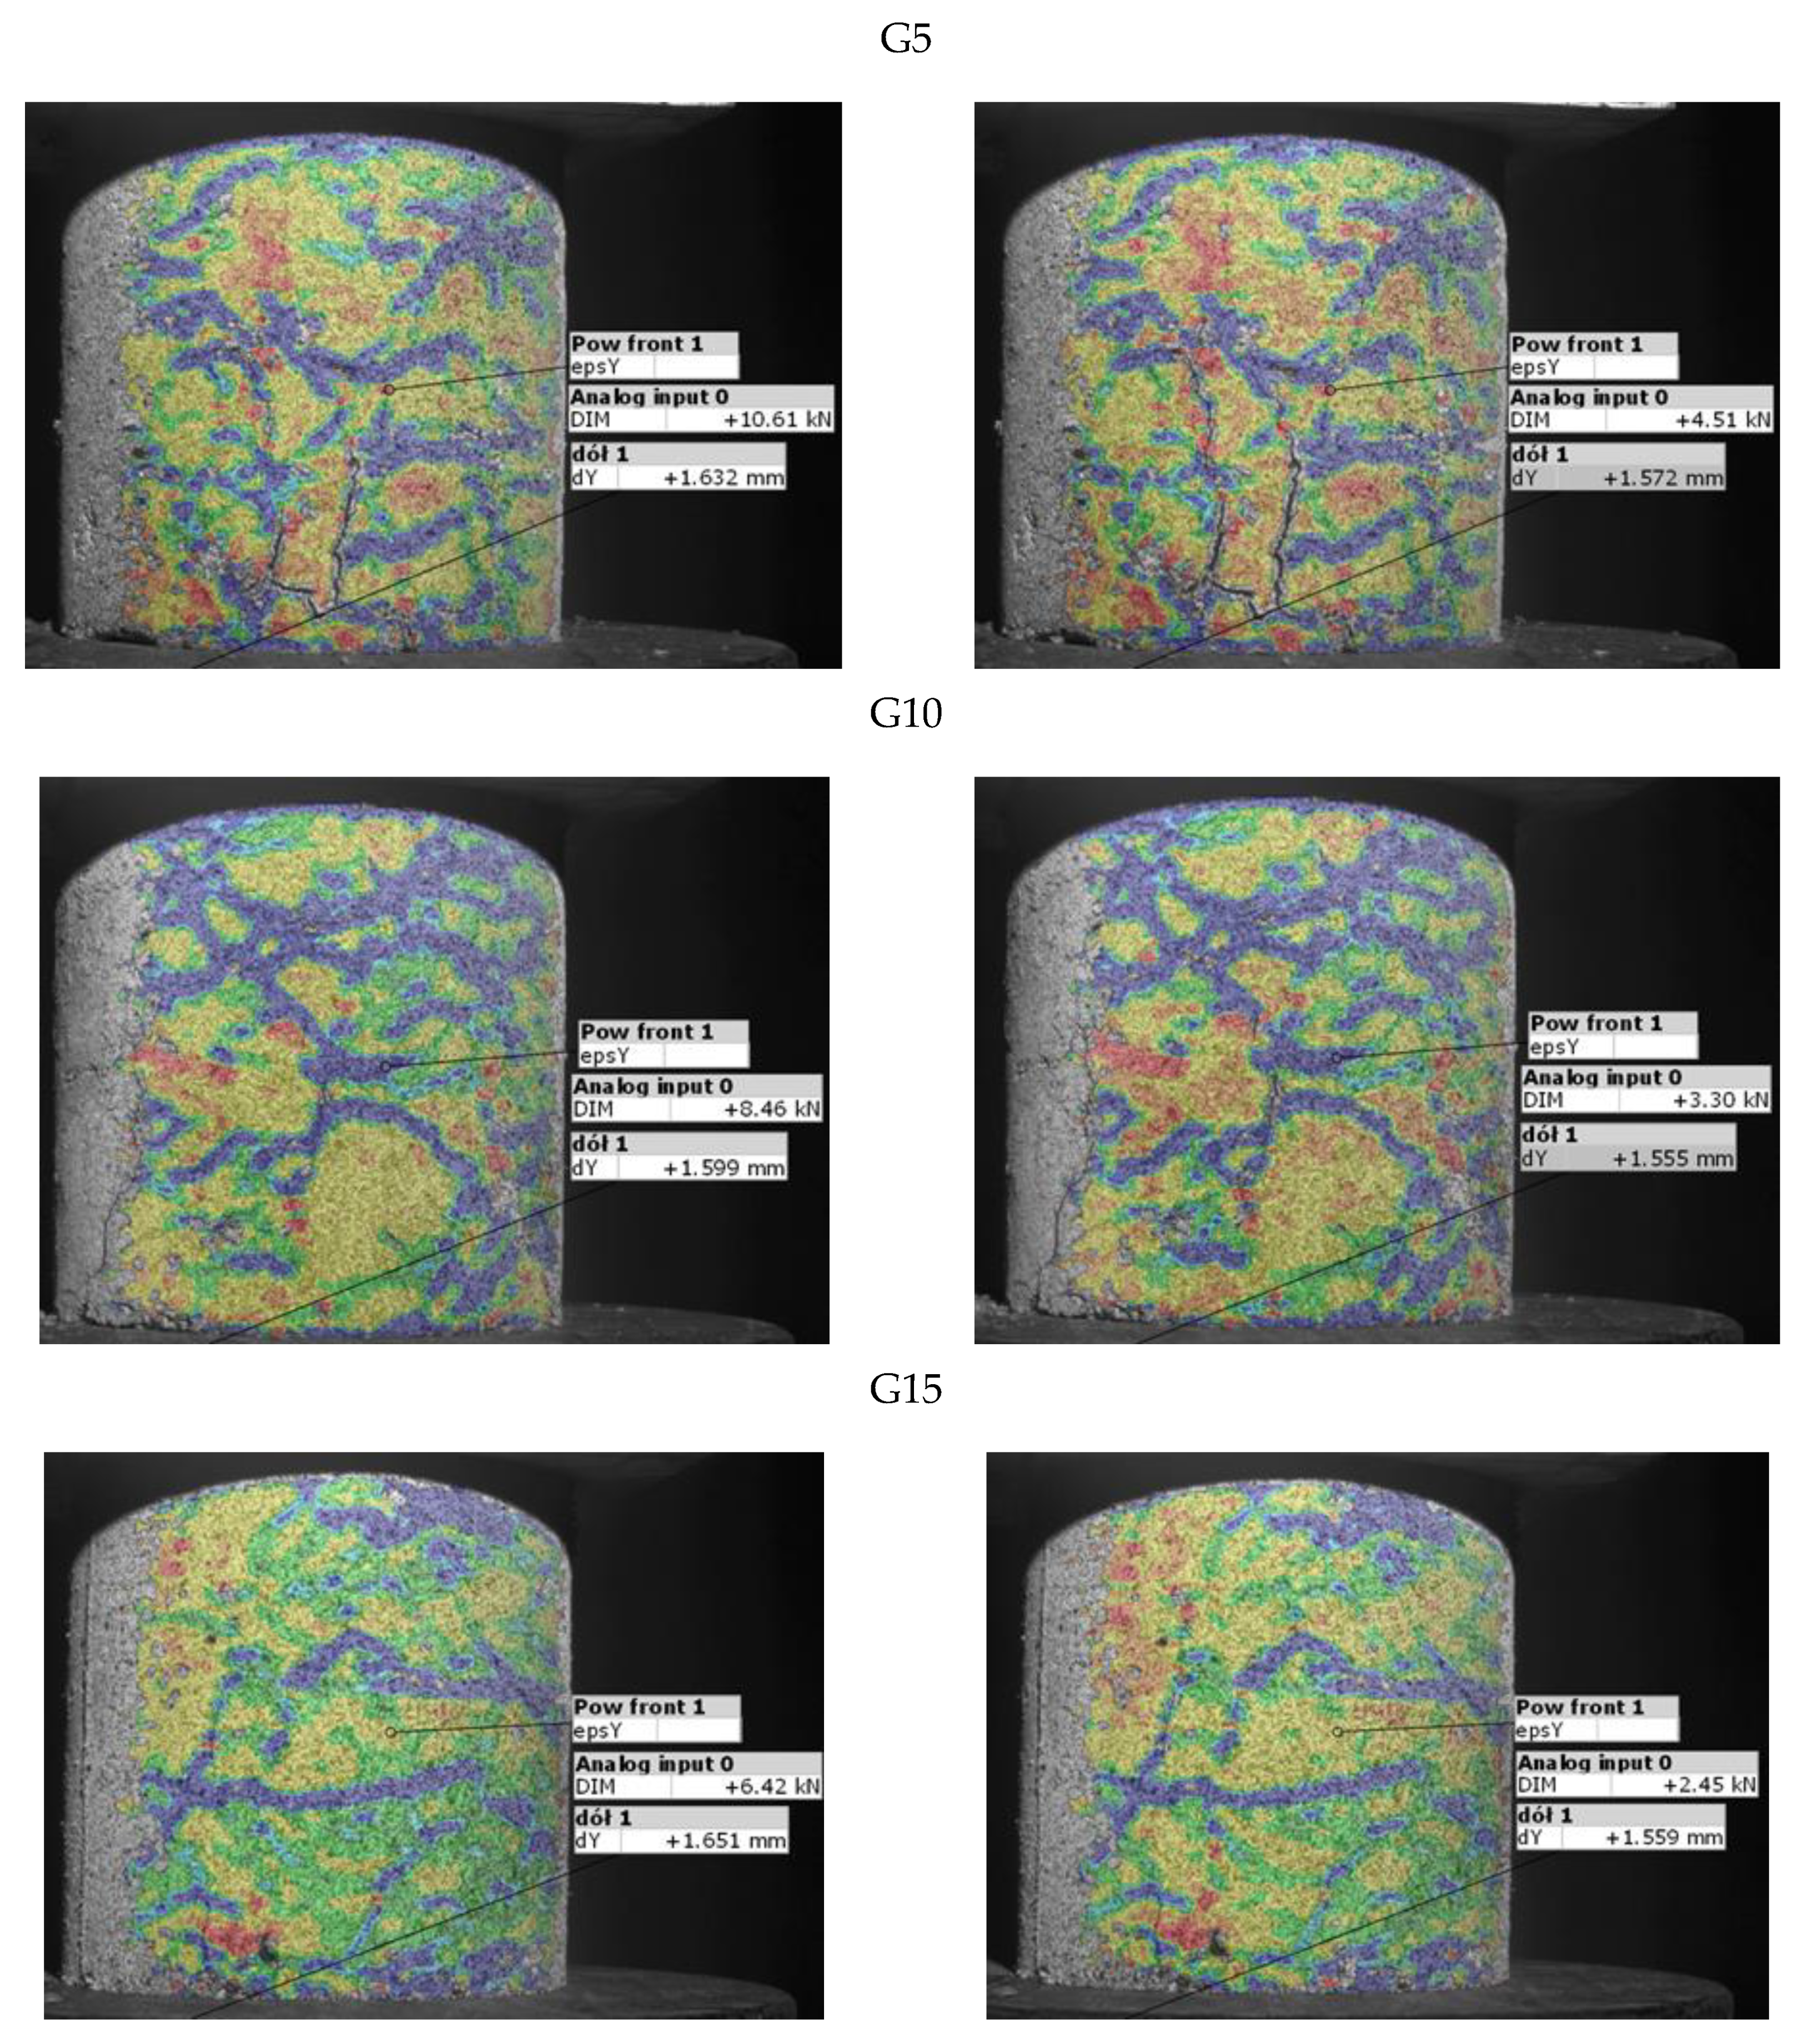
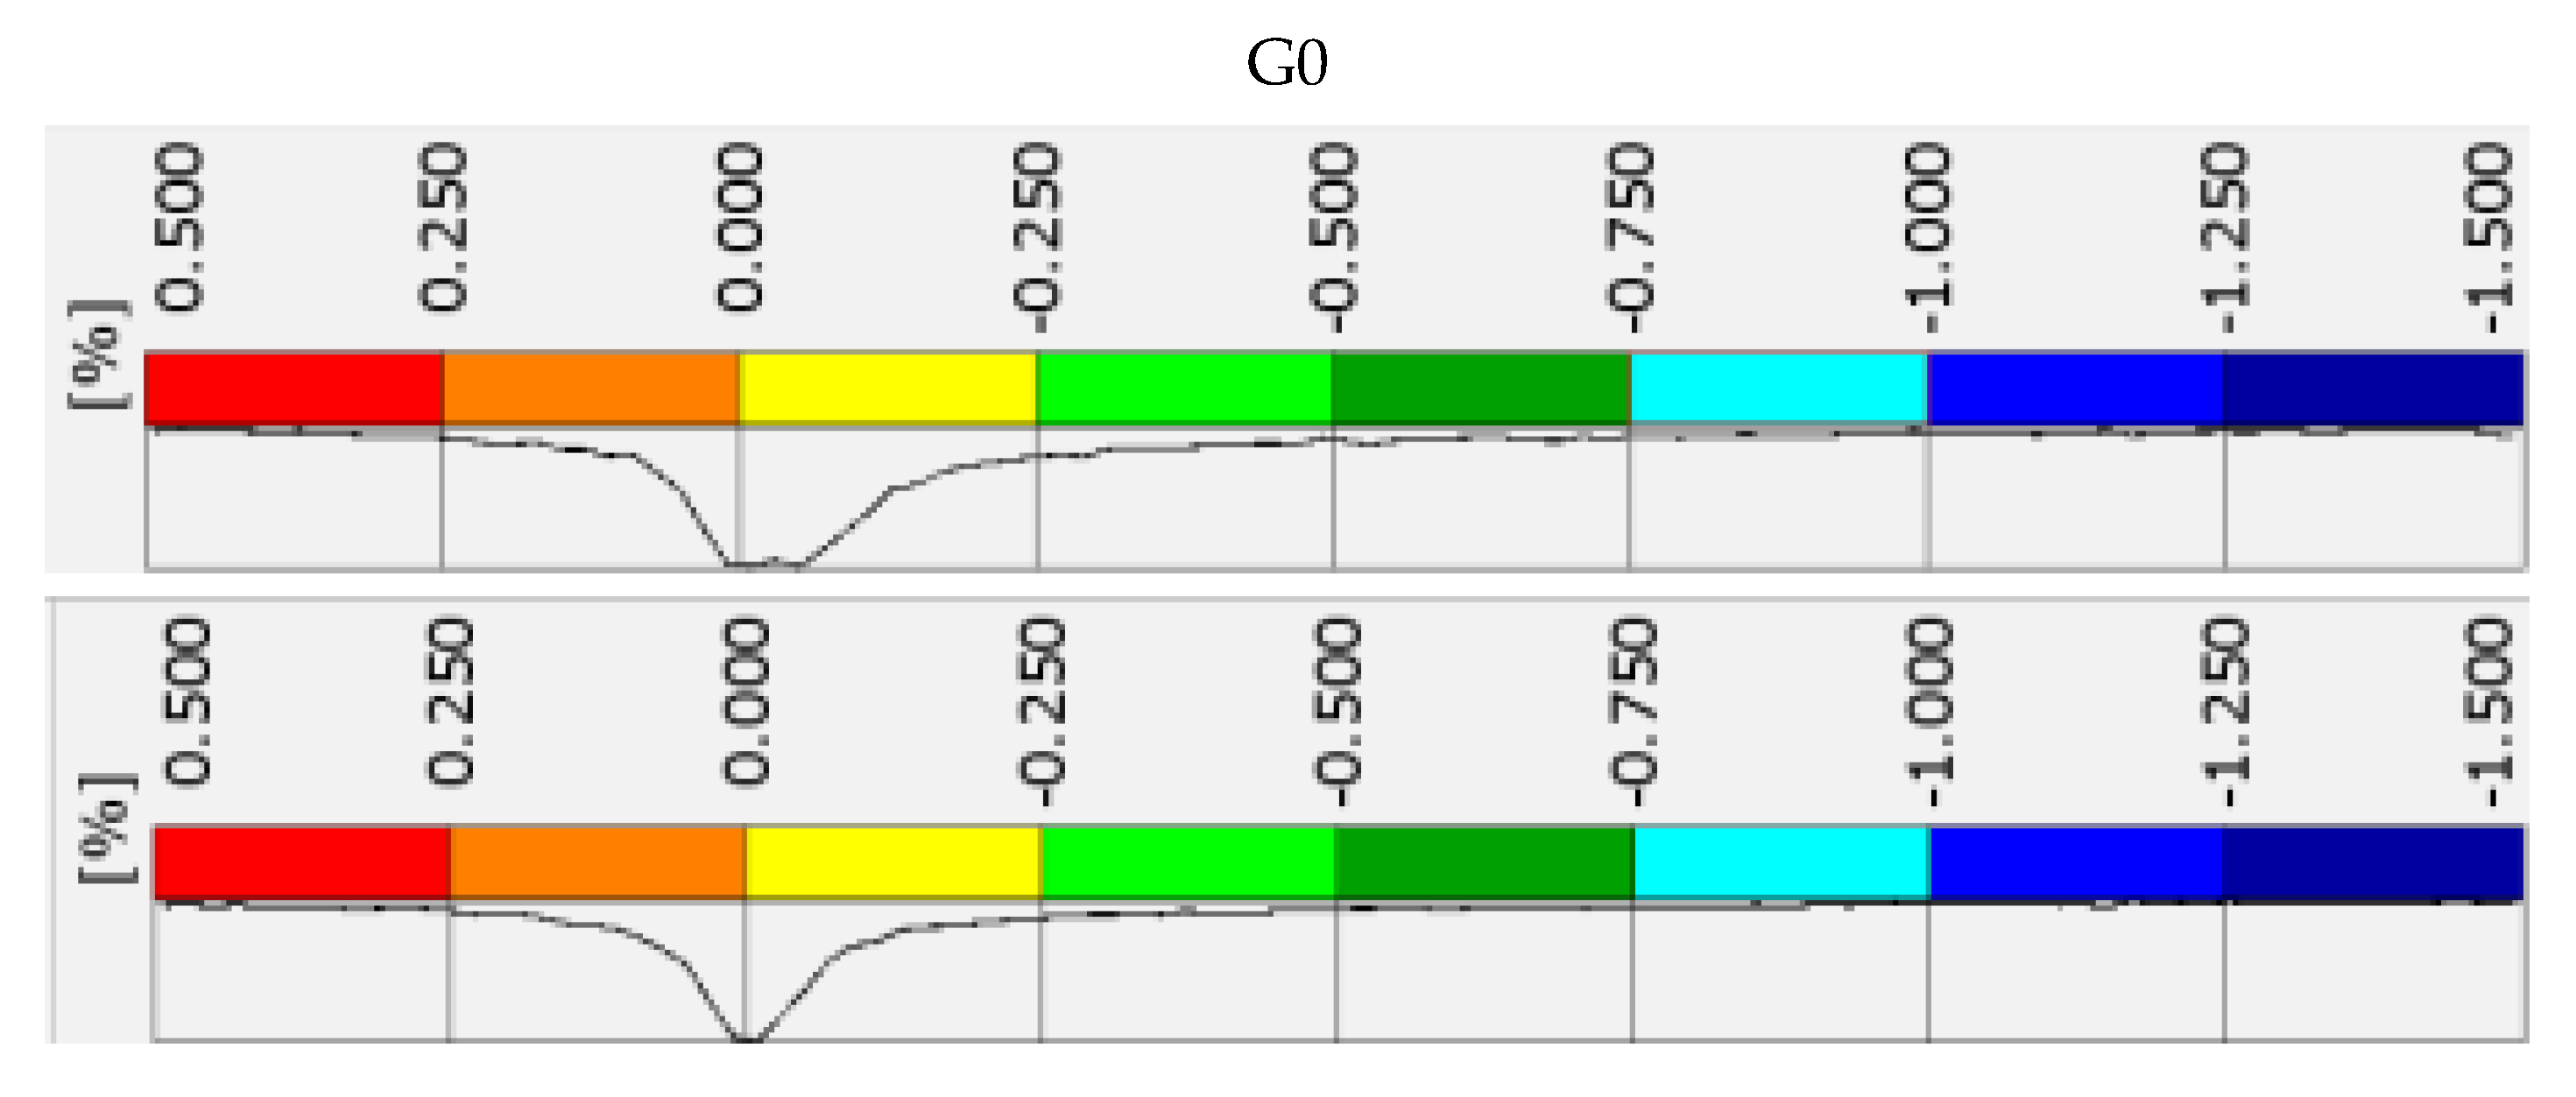
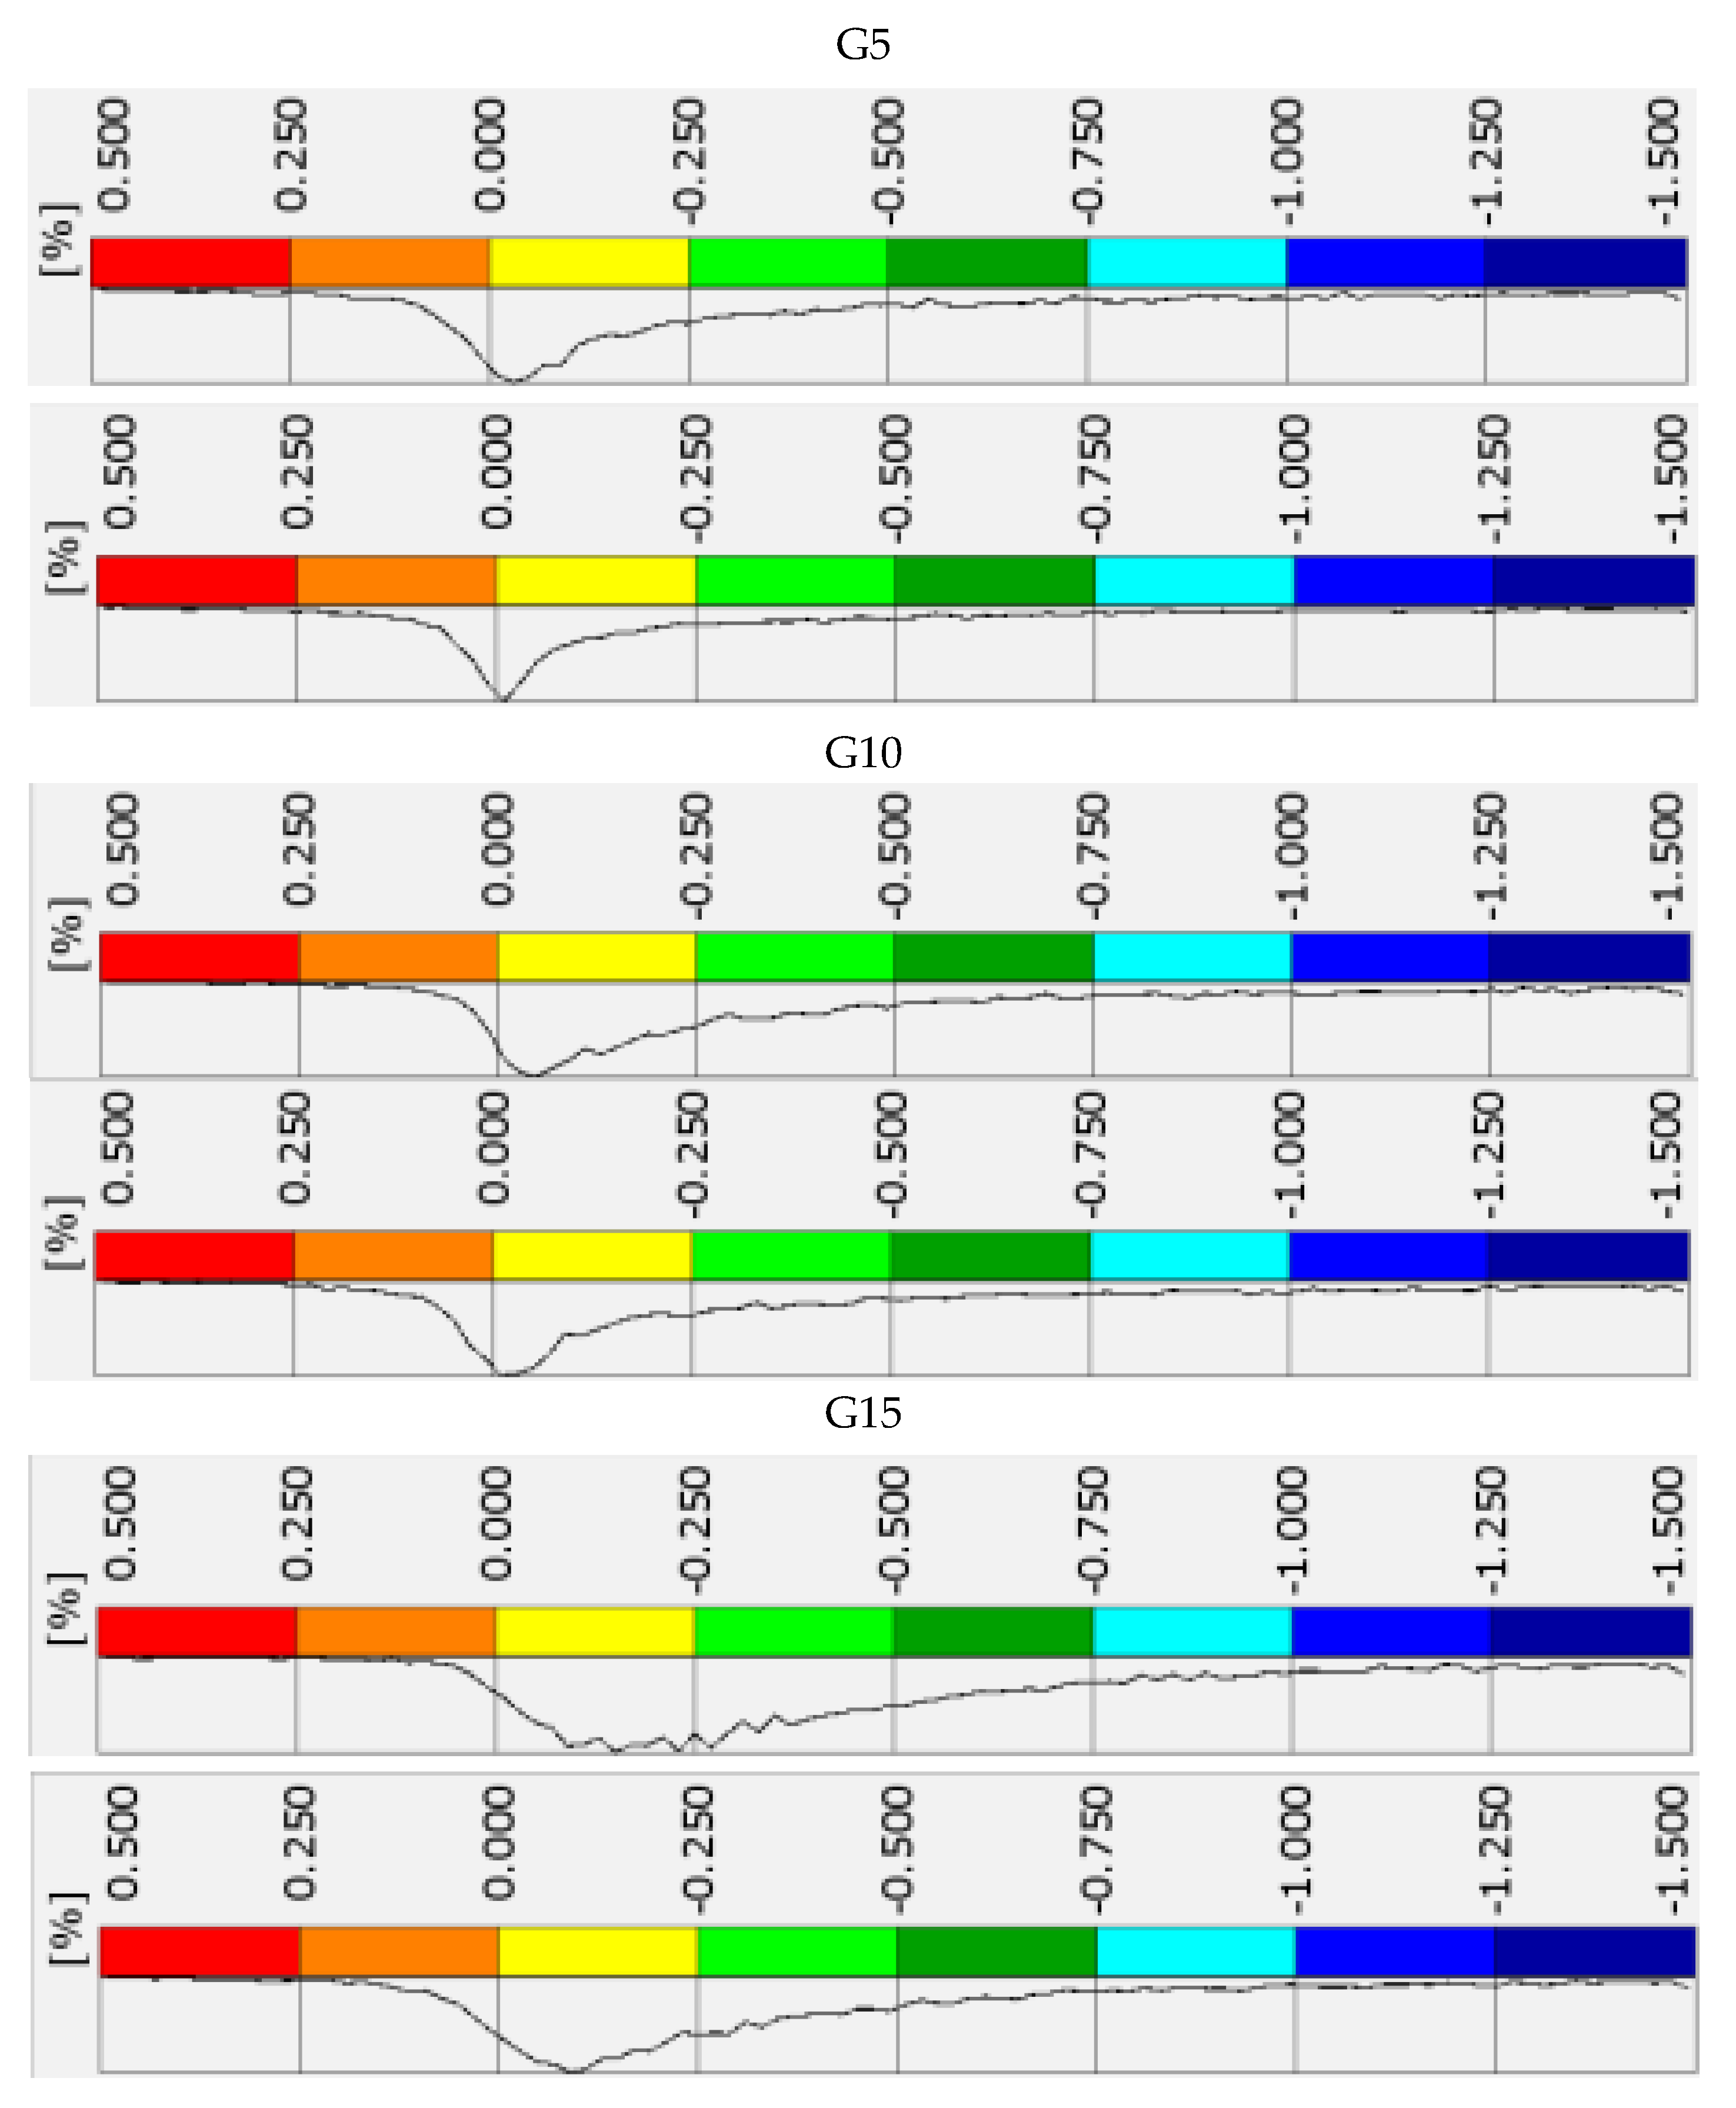
- Pow.Front.1—a surface element built on the basis of stochastic painting of specimens, used for measurement of main strains occurring on the specimen surface, according to the colour legend shown on the right side of the figure (range of principal deformations from +0.5% to −0.5%)
- Strain Gauge Xi (i = 1, 2, 3)—virtual strain gauges applied on the front surface of the specimen allowing for determination of transverse strain caused by compression of the specimen at various heights of the tested object. The strain gauges had a length of about 55 mm, the choice of such a large measuring system resulting from the attempt to measure, as precisely as possible, the global transverse strain of the specimen. The strain gauges were distributed as follows:
- ○
- Strain Gauge X1—transverse strain gauge located at the centre of specimen height to measure maximum transverse strain of the specimen
- ○
- Strain Gauge X2—a transverse strain gauge located in the upper visible area of the specimen to measure transverse strain at the top of the compression fixture.
- ○
- Strain Gauge X3—a transverse strain gauge located in the lower visible portion of the specimen to measure transverse strain at the lower compression attachment
- Strain Gauge Yi, and ϵ <1;5>—virtual strain gauges applied to the front surface of the specimen to determine the vertical strain due to compression of the specimen. These strain gauges had a length of about 70 mm. The choice of such a large measuring base resulted from the attempt to measure the global vertical strain of the specimen as accurately as possible. The strain gauges were positioned from left to right of the visible side of the specimen. The number of strain gauges depended on the quality of the gradient painted on the surface of the specimen and ranged from 4 to 6. The values of vertical strain were then averaged for the whole specimen.
3. Results
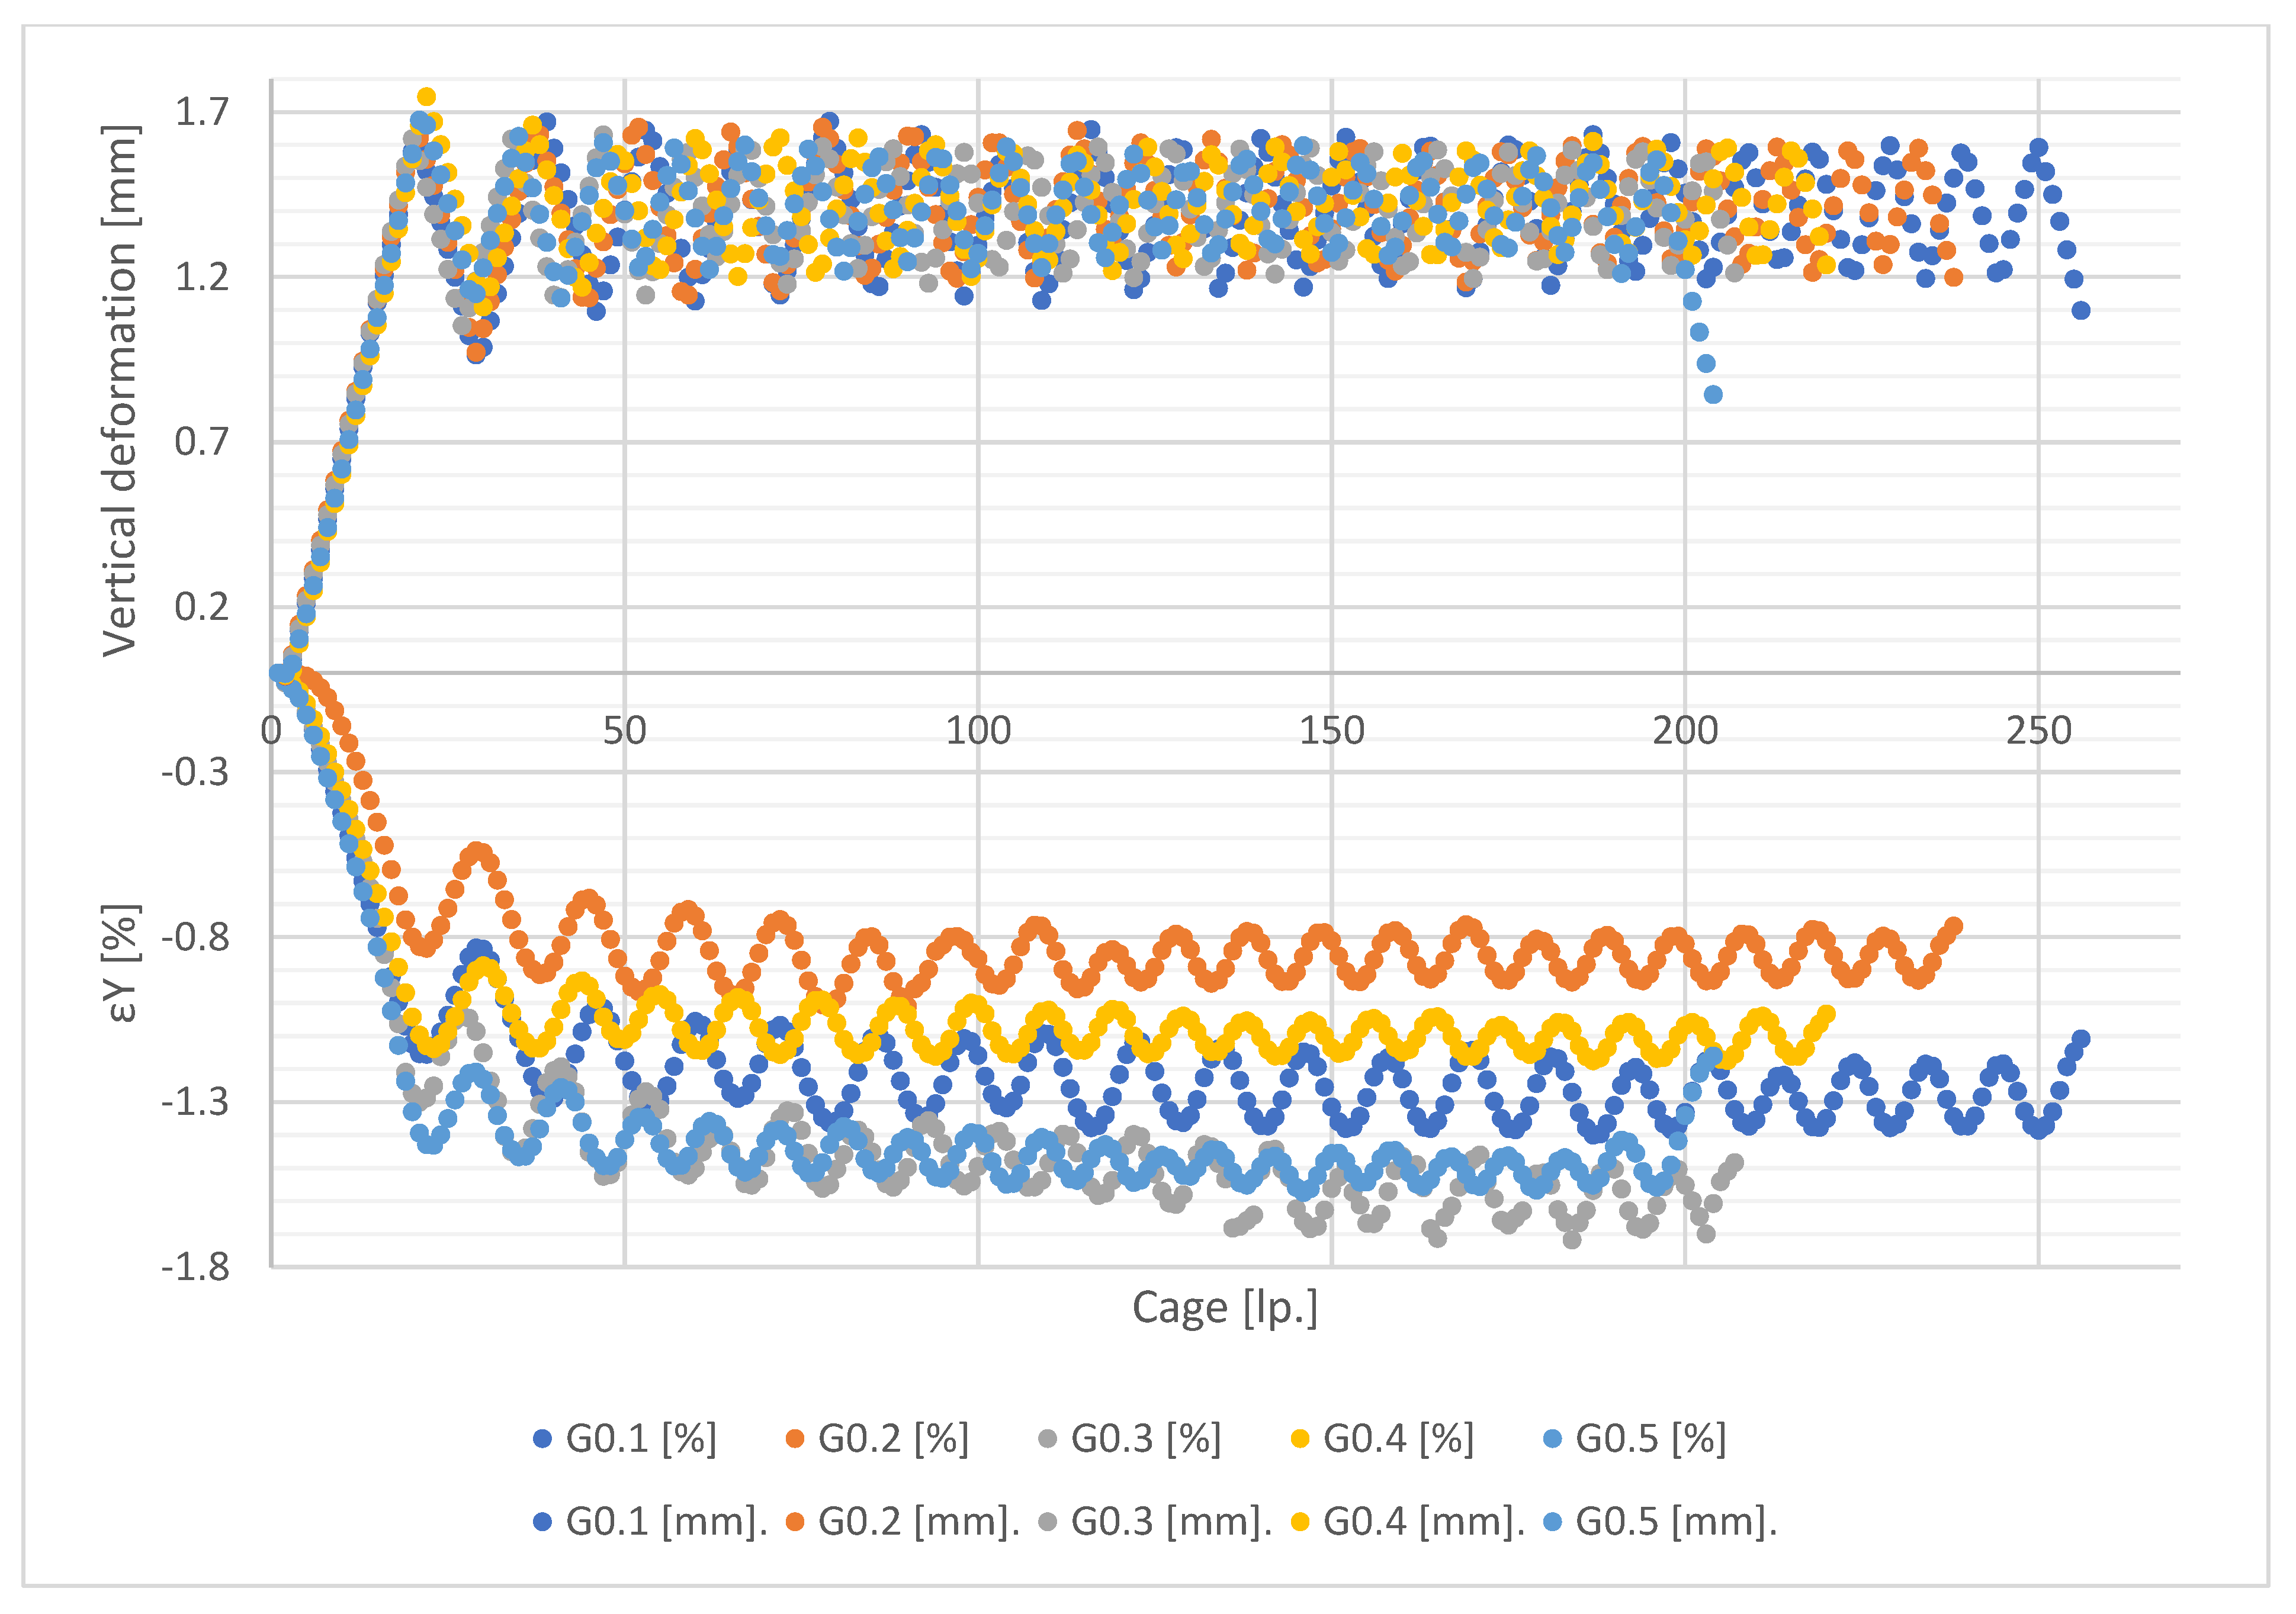
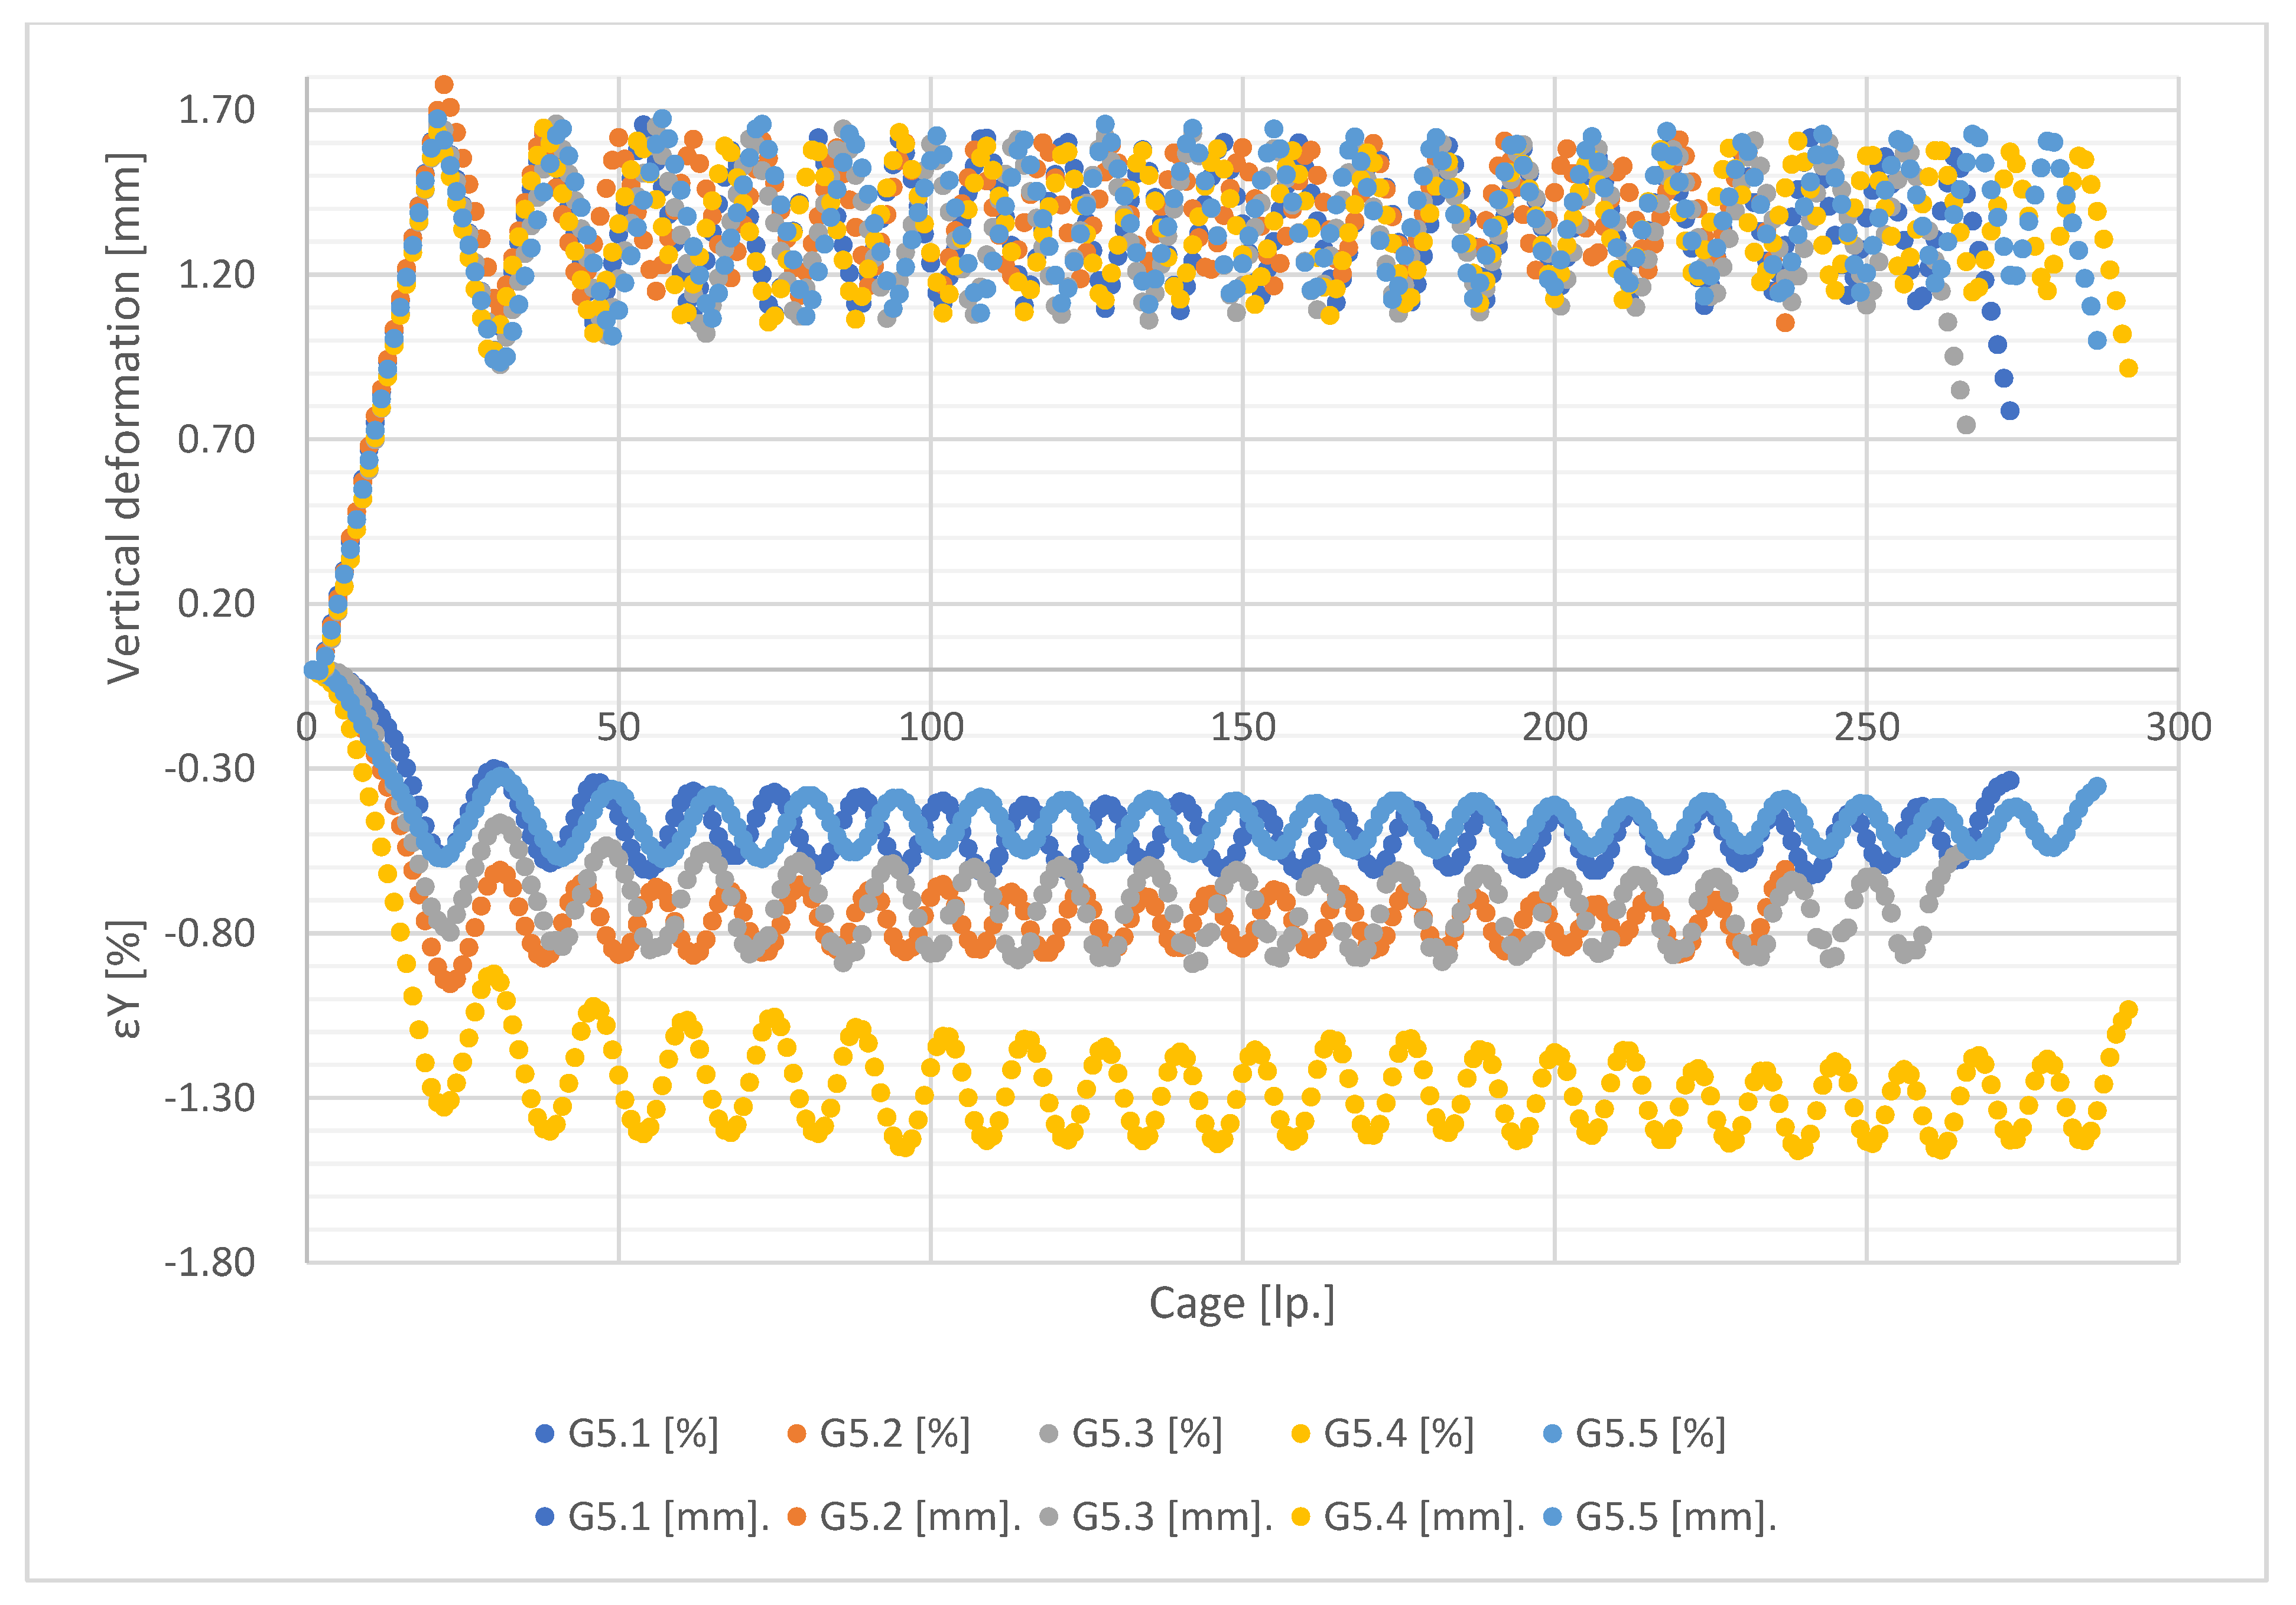
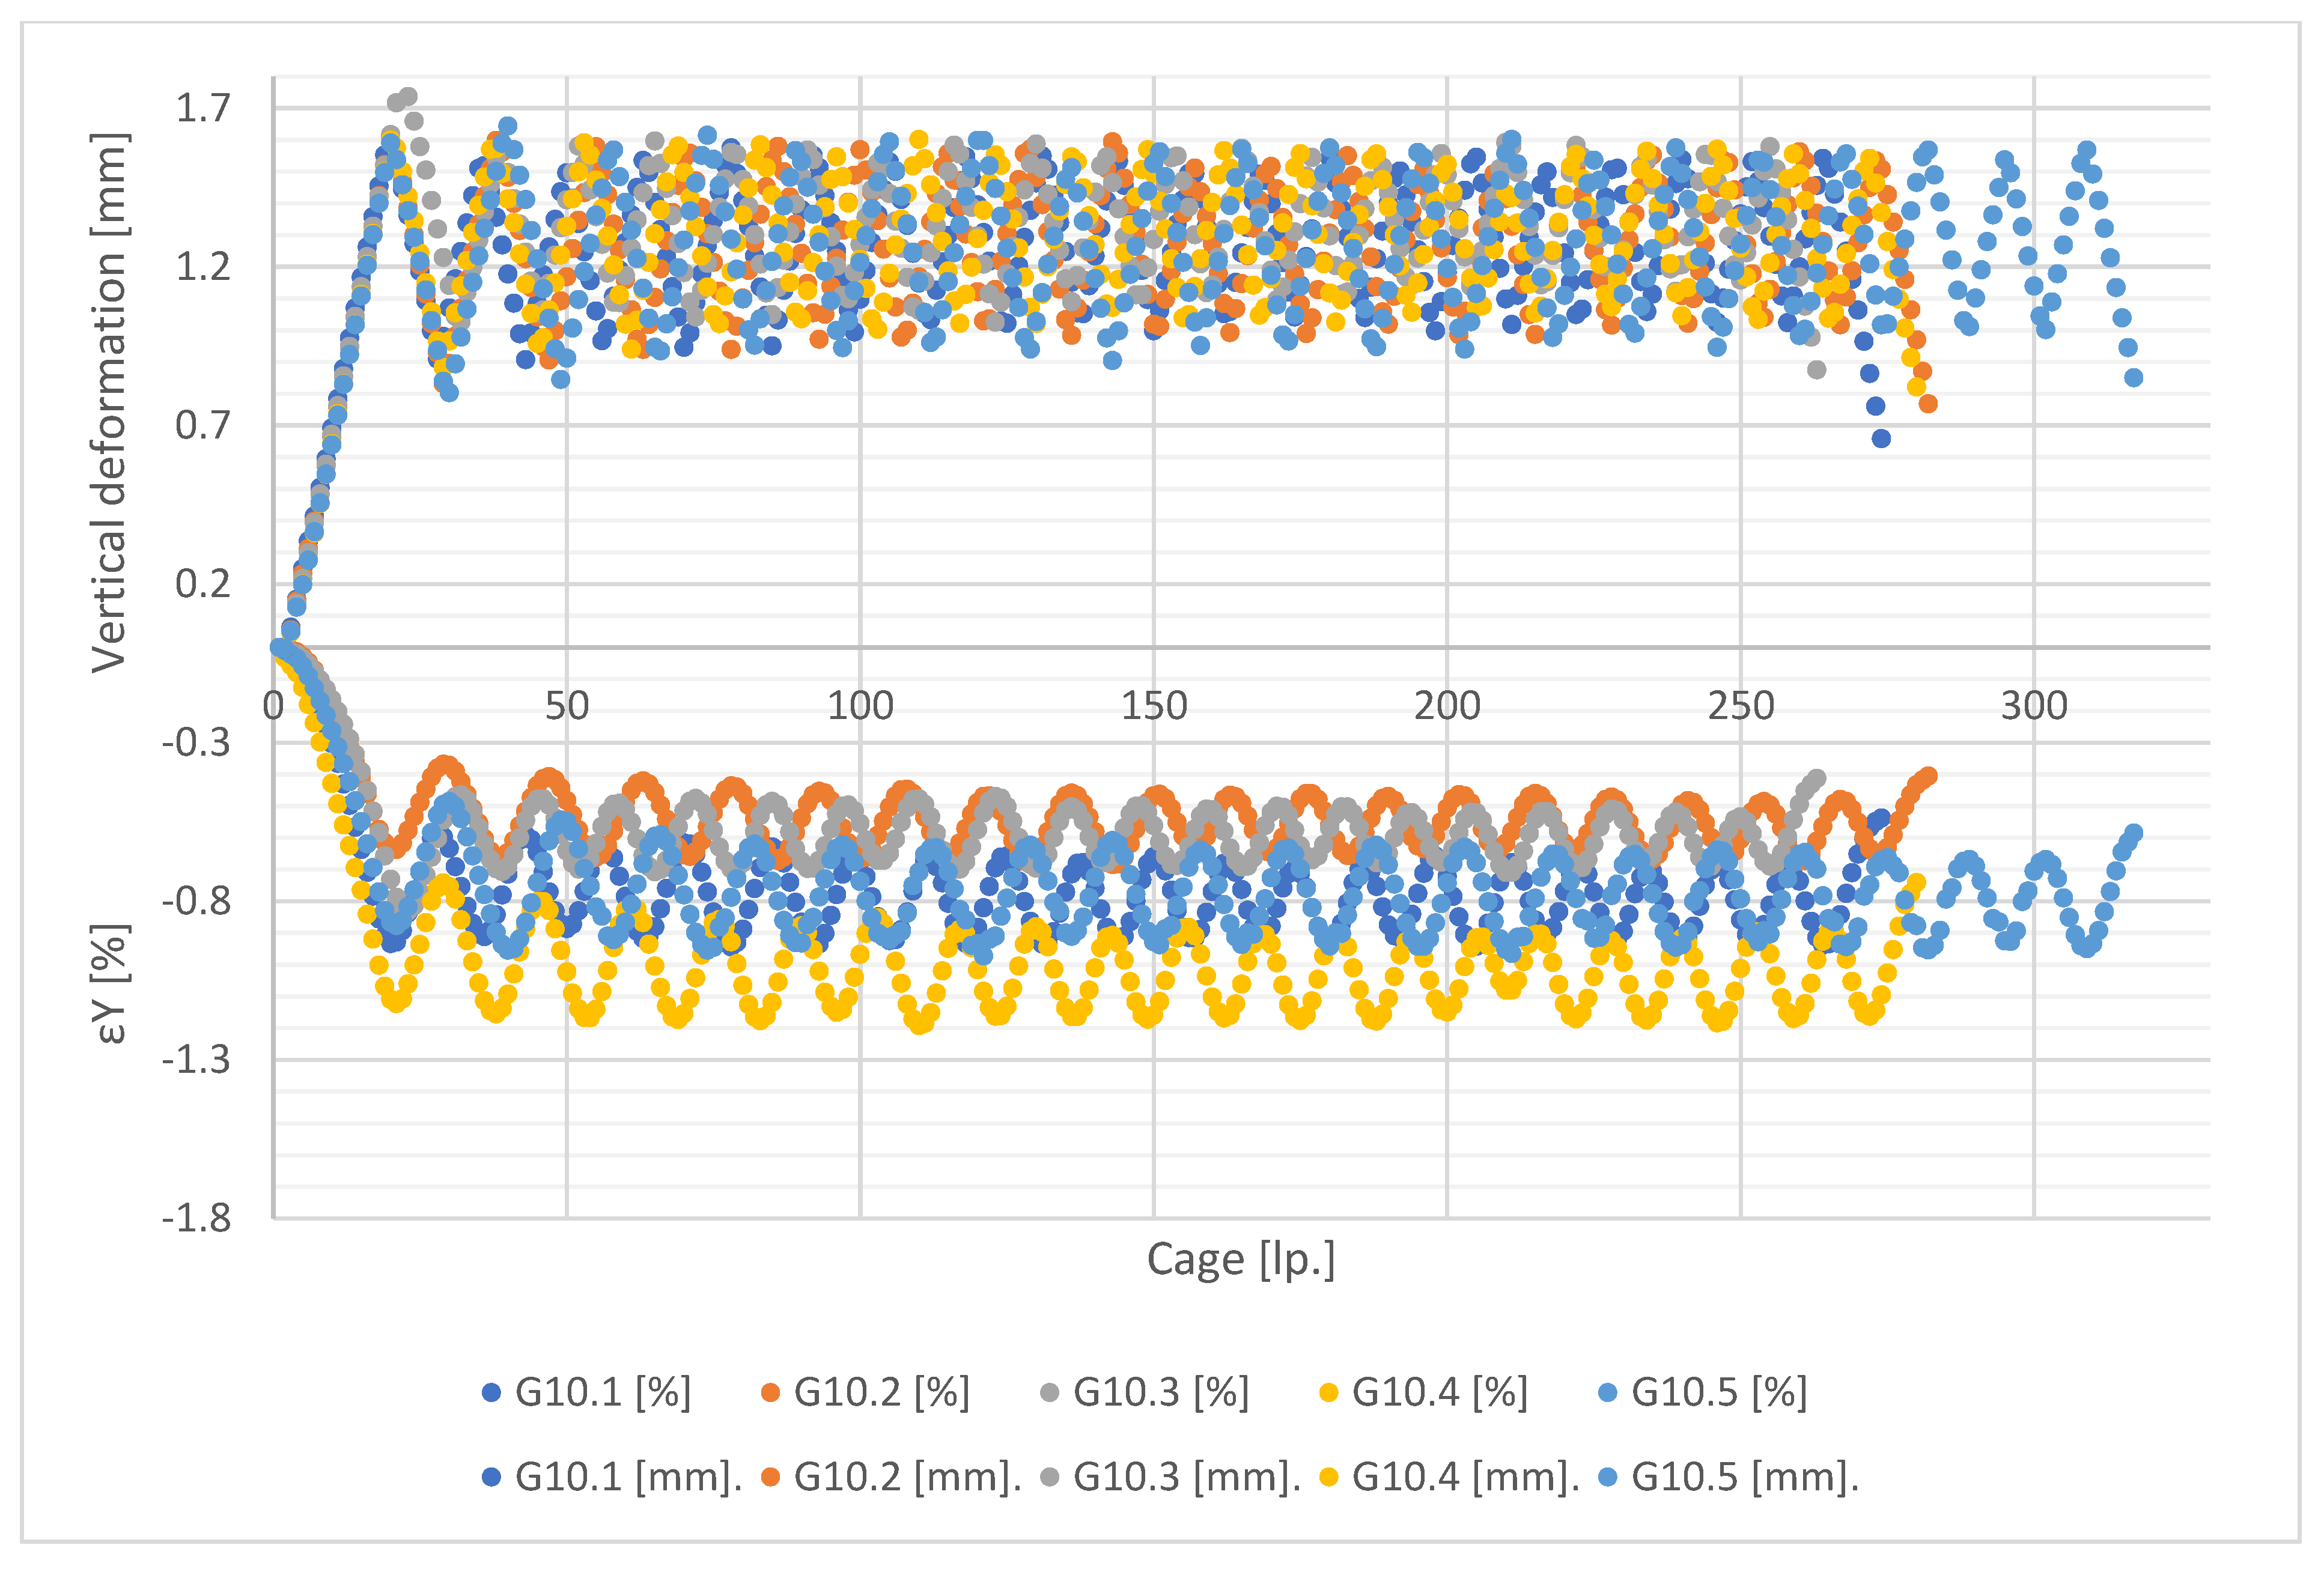
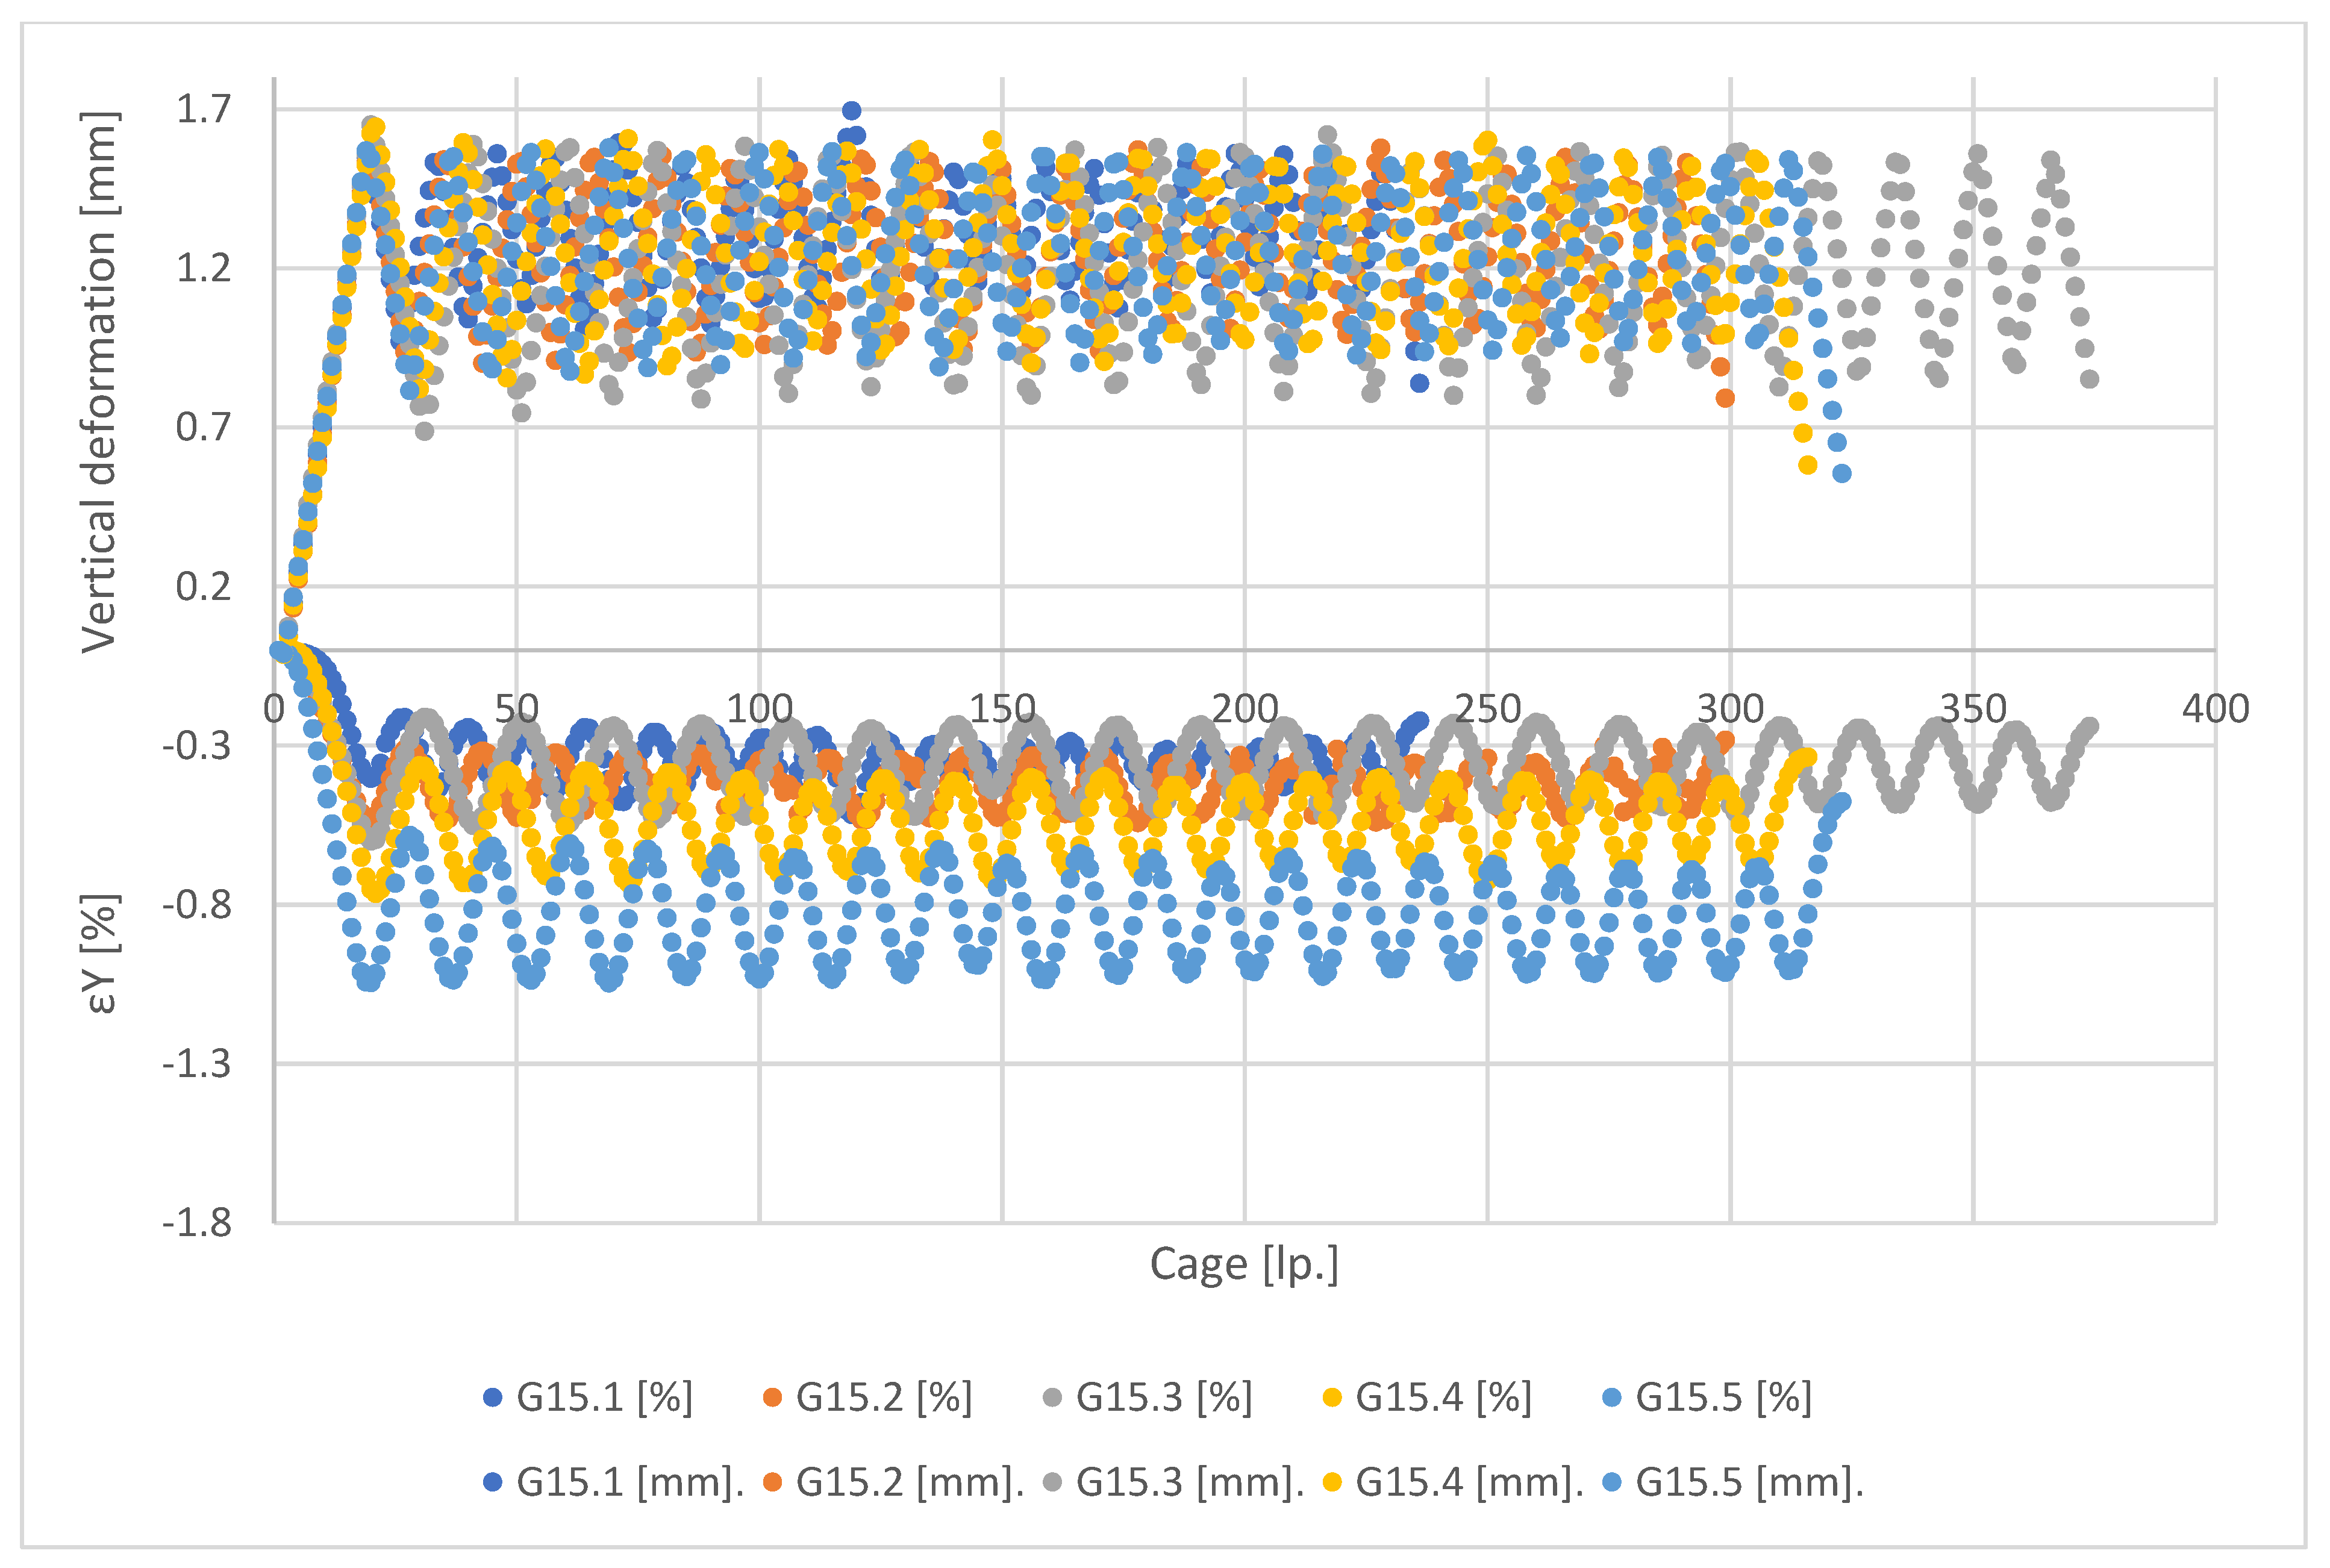
3.1. Course of Deformation and Strains during the Test
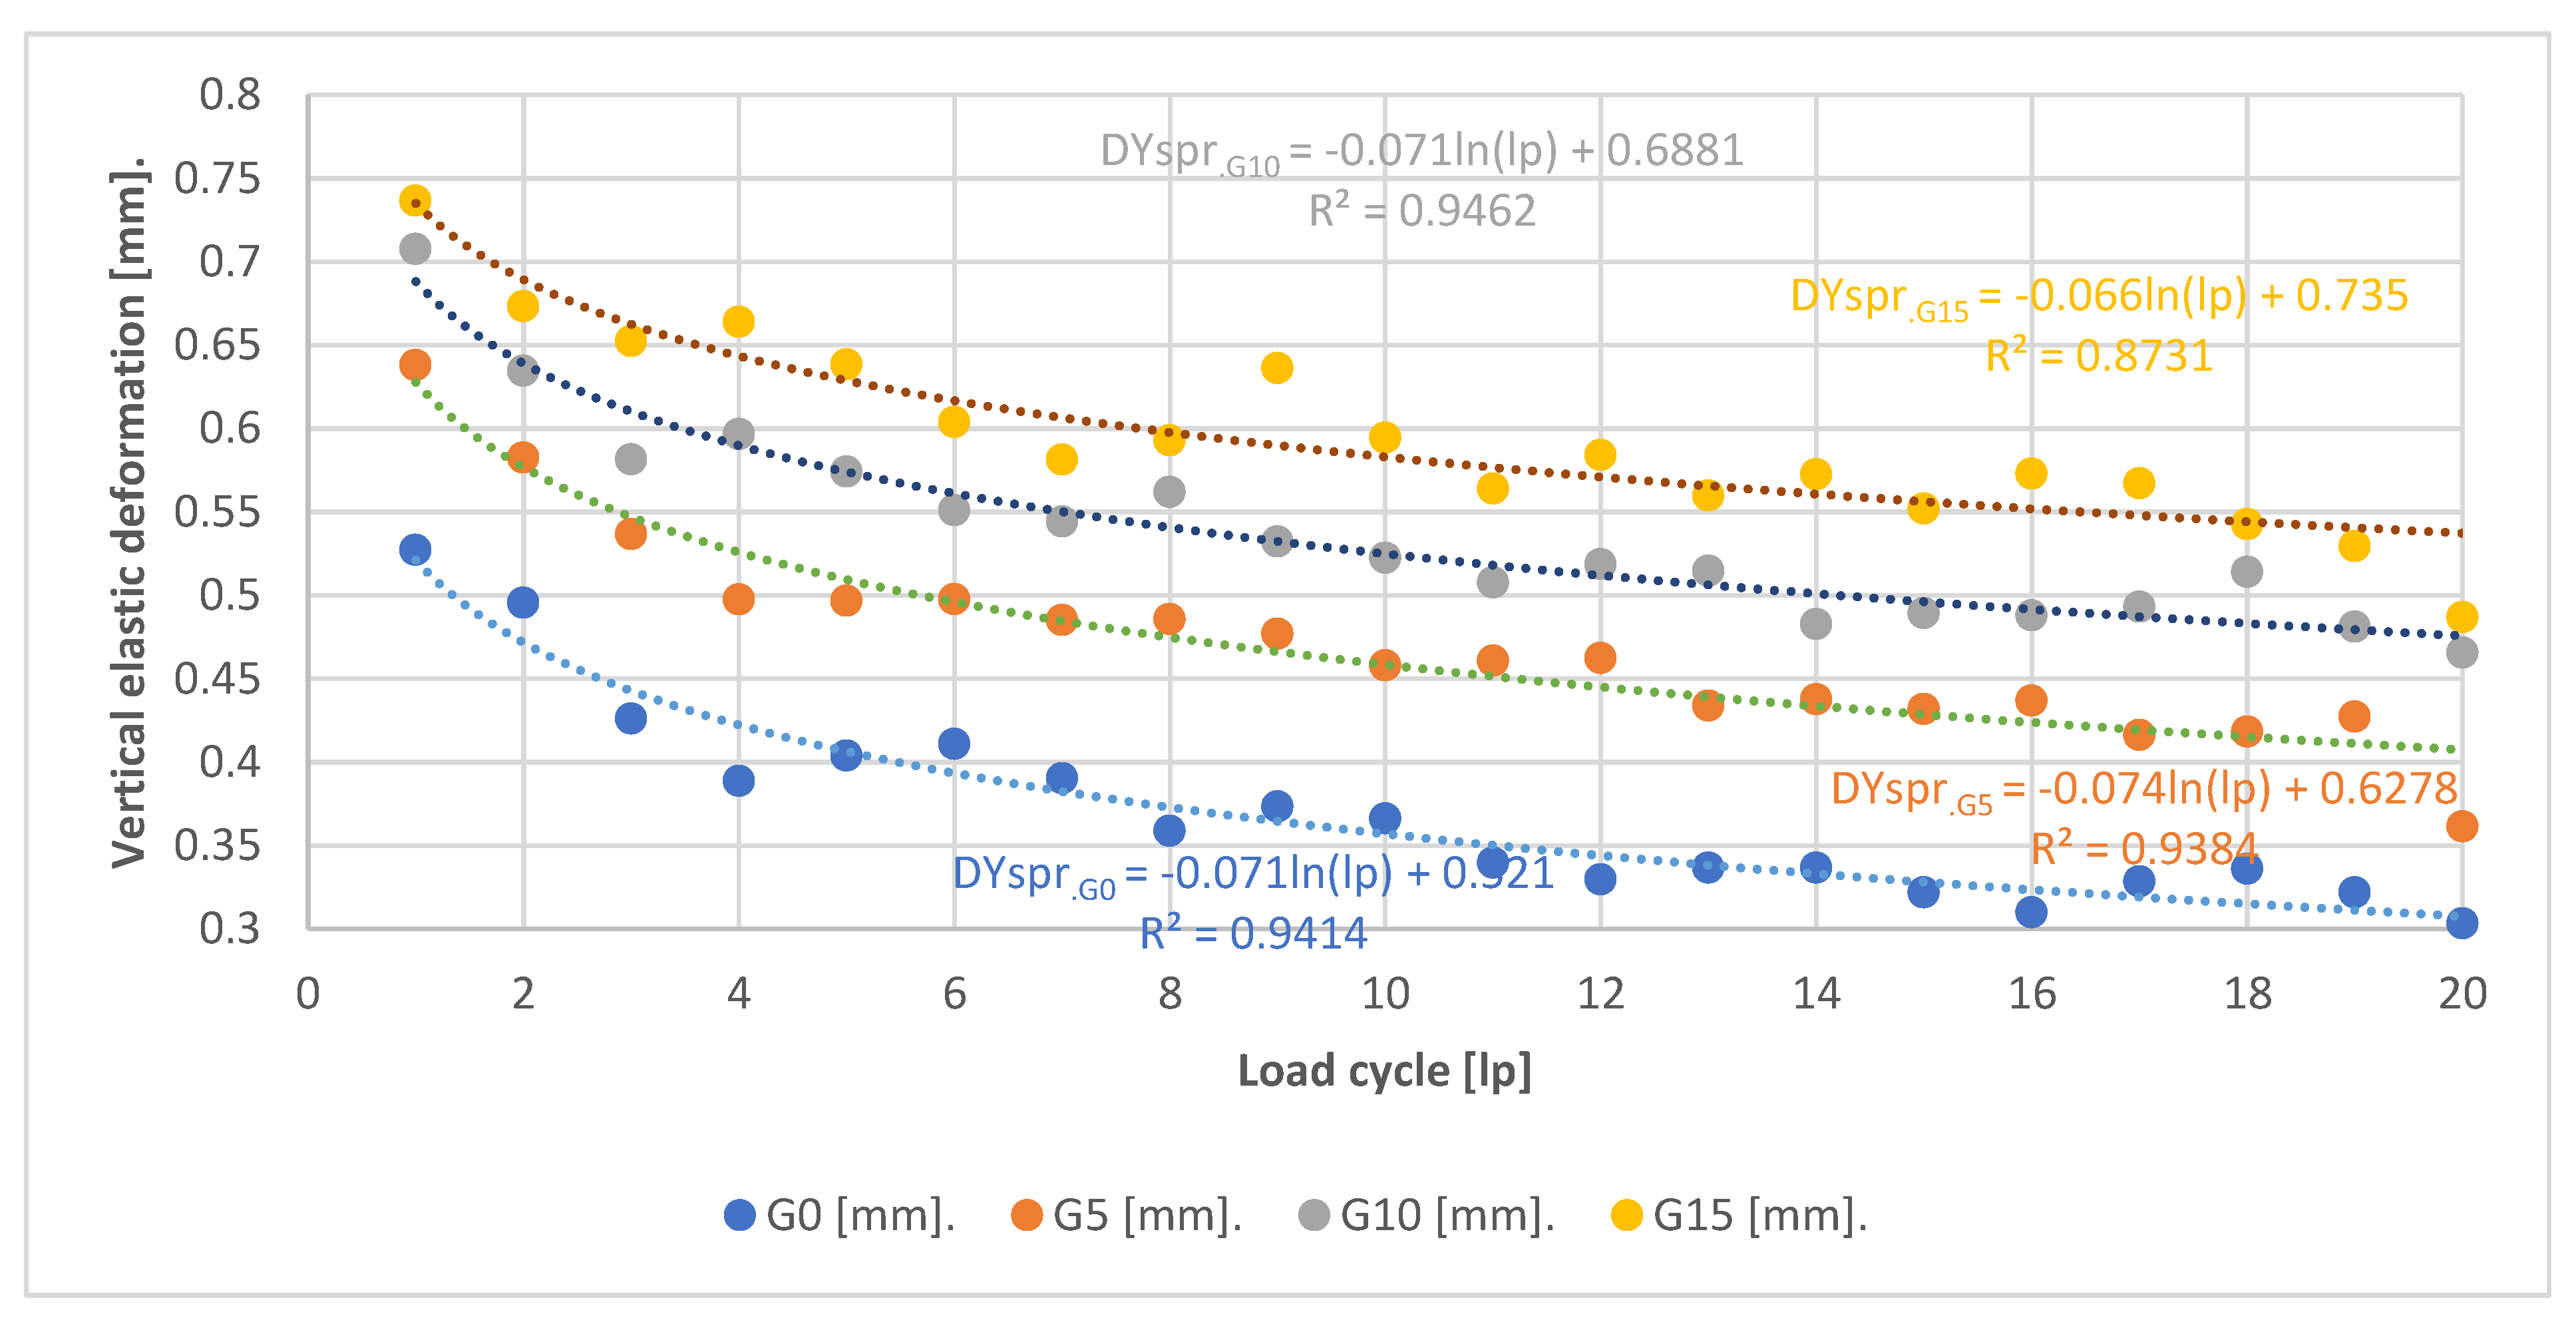
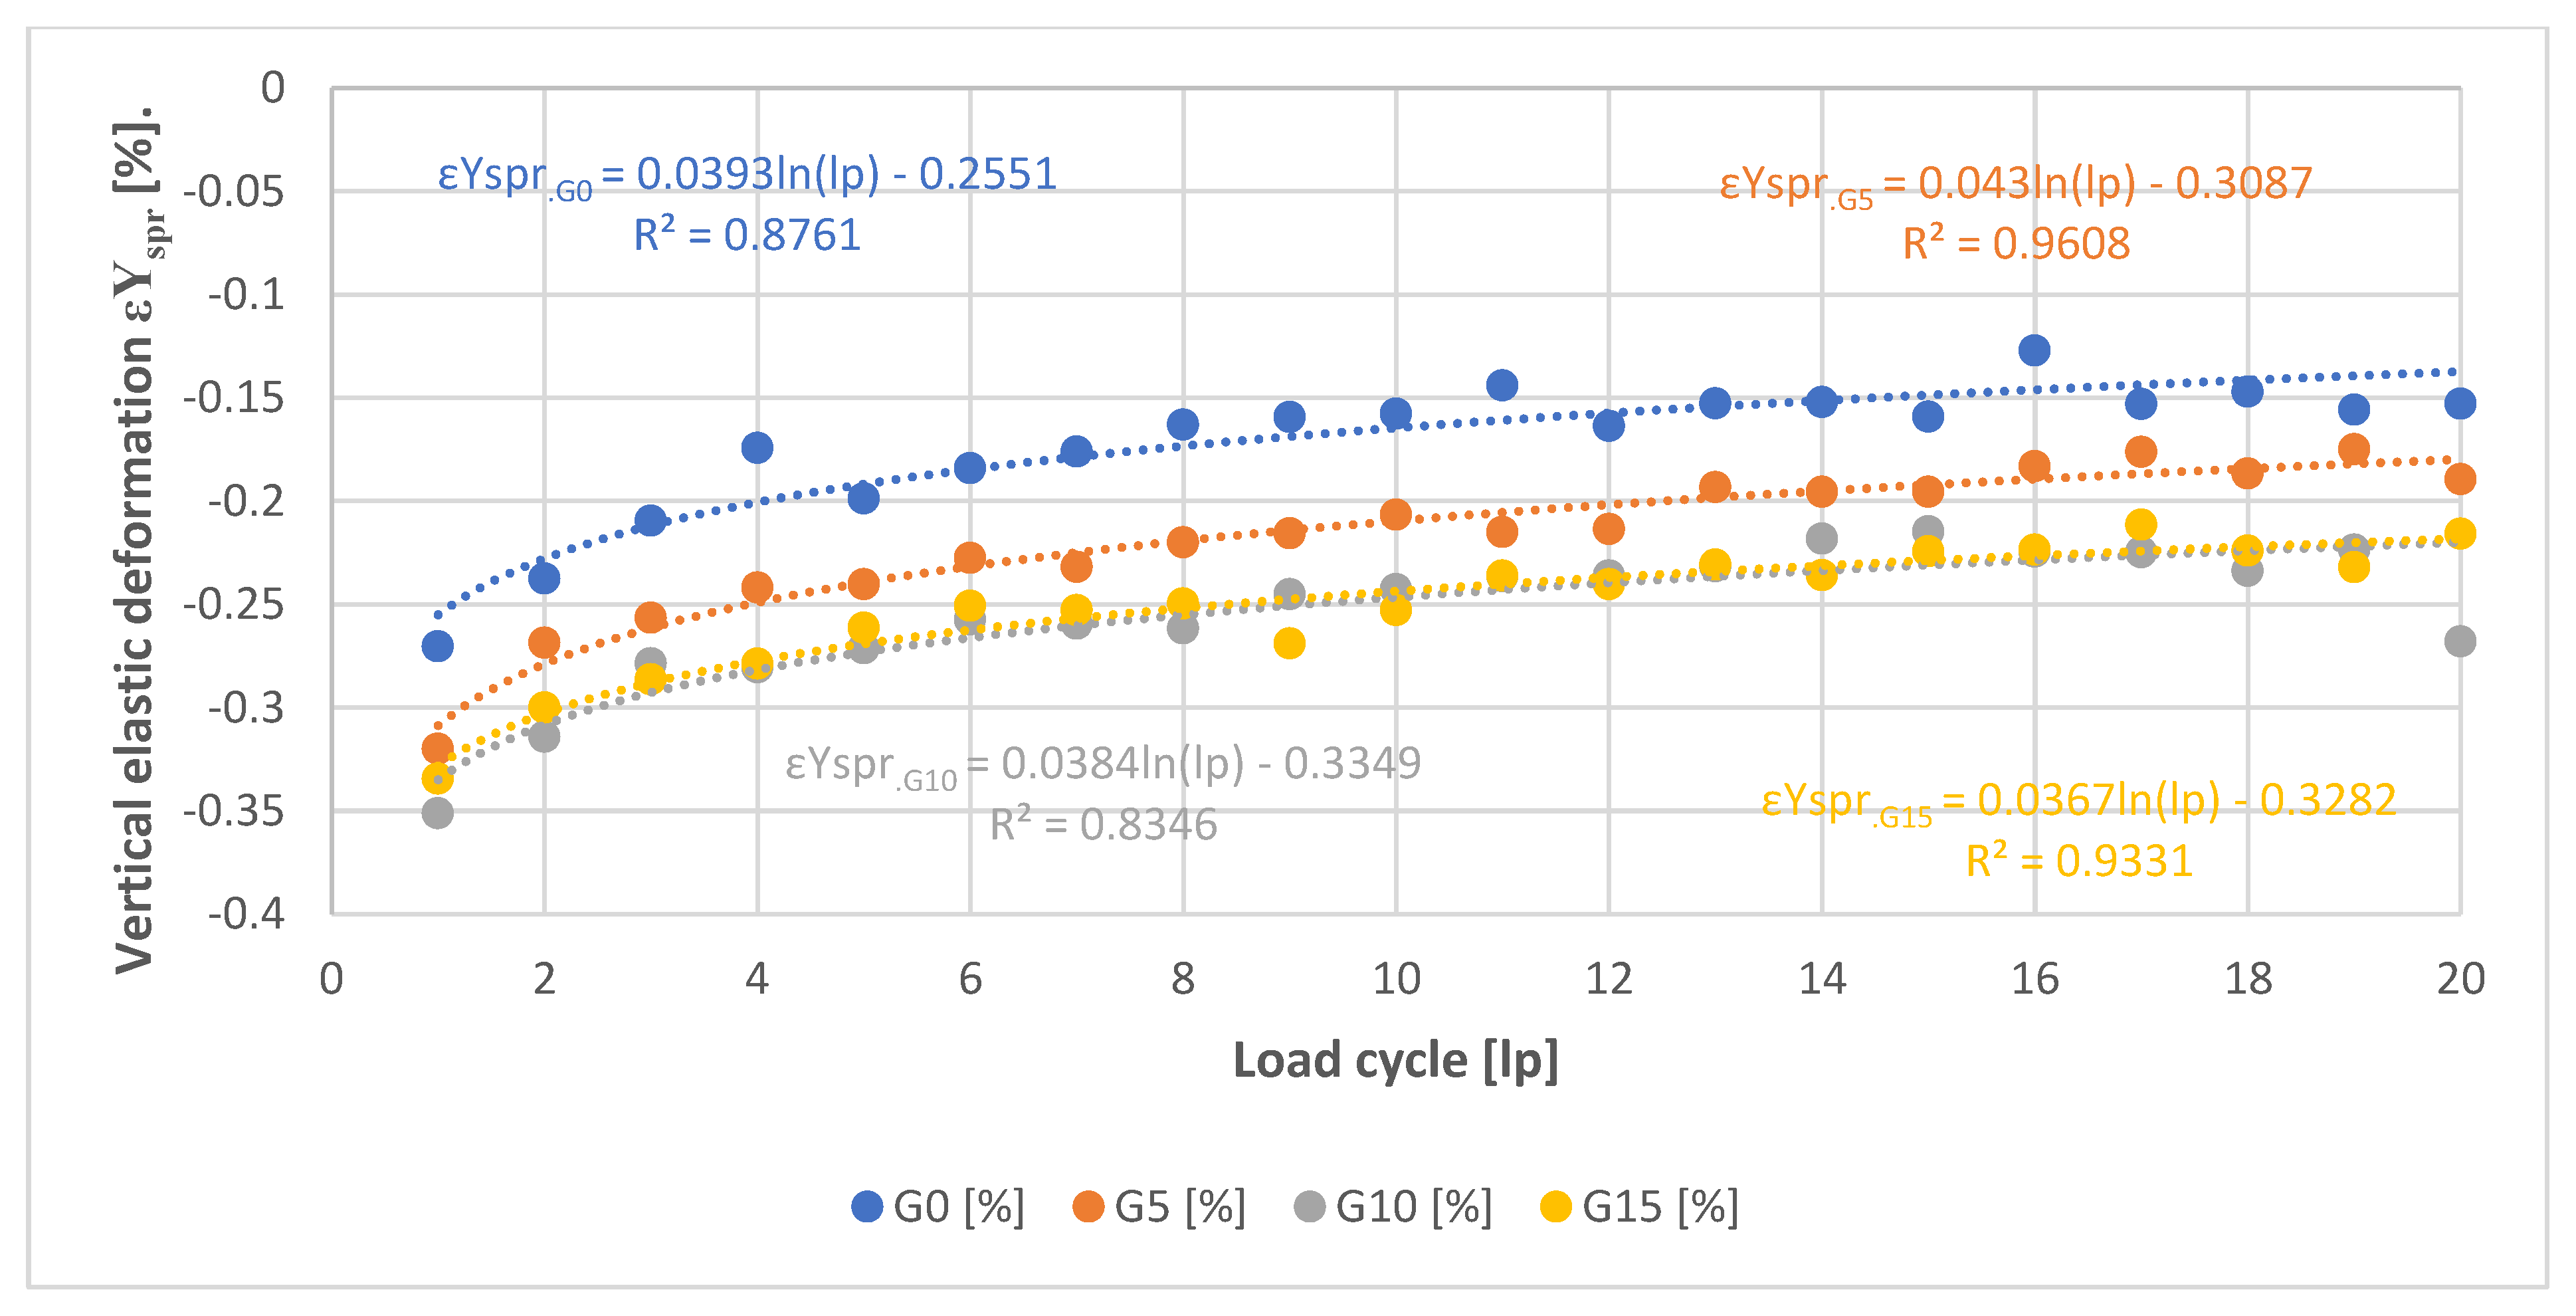
3.2. Values of Elastic Strain for Individual Load Cycles
- DYspr—vertical elastic deformations (mm).
- DYmax—vertical deformation read at maximum forcing (mm).
- DYmin—vertical deformation read at minimum assumed force (mm).
- εYspr—vertical elastic strains [%].
- εYmax—vertical strain at maximum forcing [%].
- εYmin—vertical strain at minimum assumed force [%].
- G0—0.527 mm; 0.322 mm
- G5—0.638 mm; 0.428 mm
- G10—0.708 mm; 0.481 mm
- G15—0.736 mm; 0.529 mm
3.3. Map of Vertical Strains Occurring on the Specimen Surface
4. Discussion
5. Conclusions
- Enlargement of the deformation range in which the specimen works elastically
- Decreasing tendency to reduce the elastic deformation range with each successive load cycle
- Alignment of the distribution of strains on the specimen surface
- Change in the strain form of the specimen
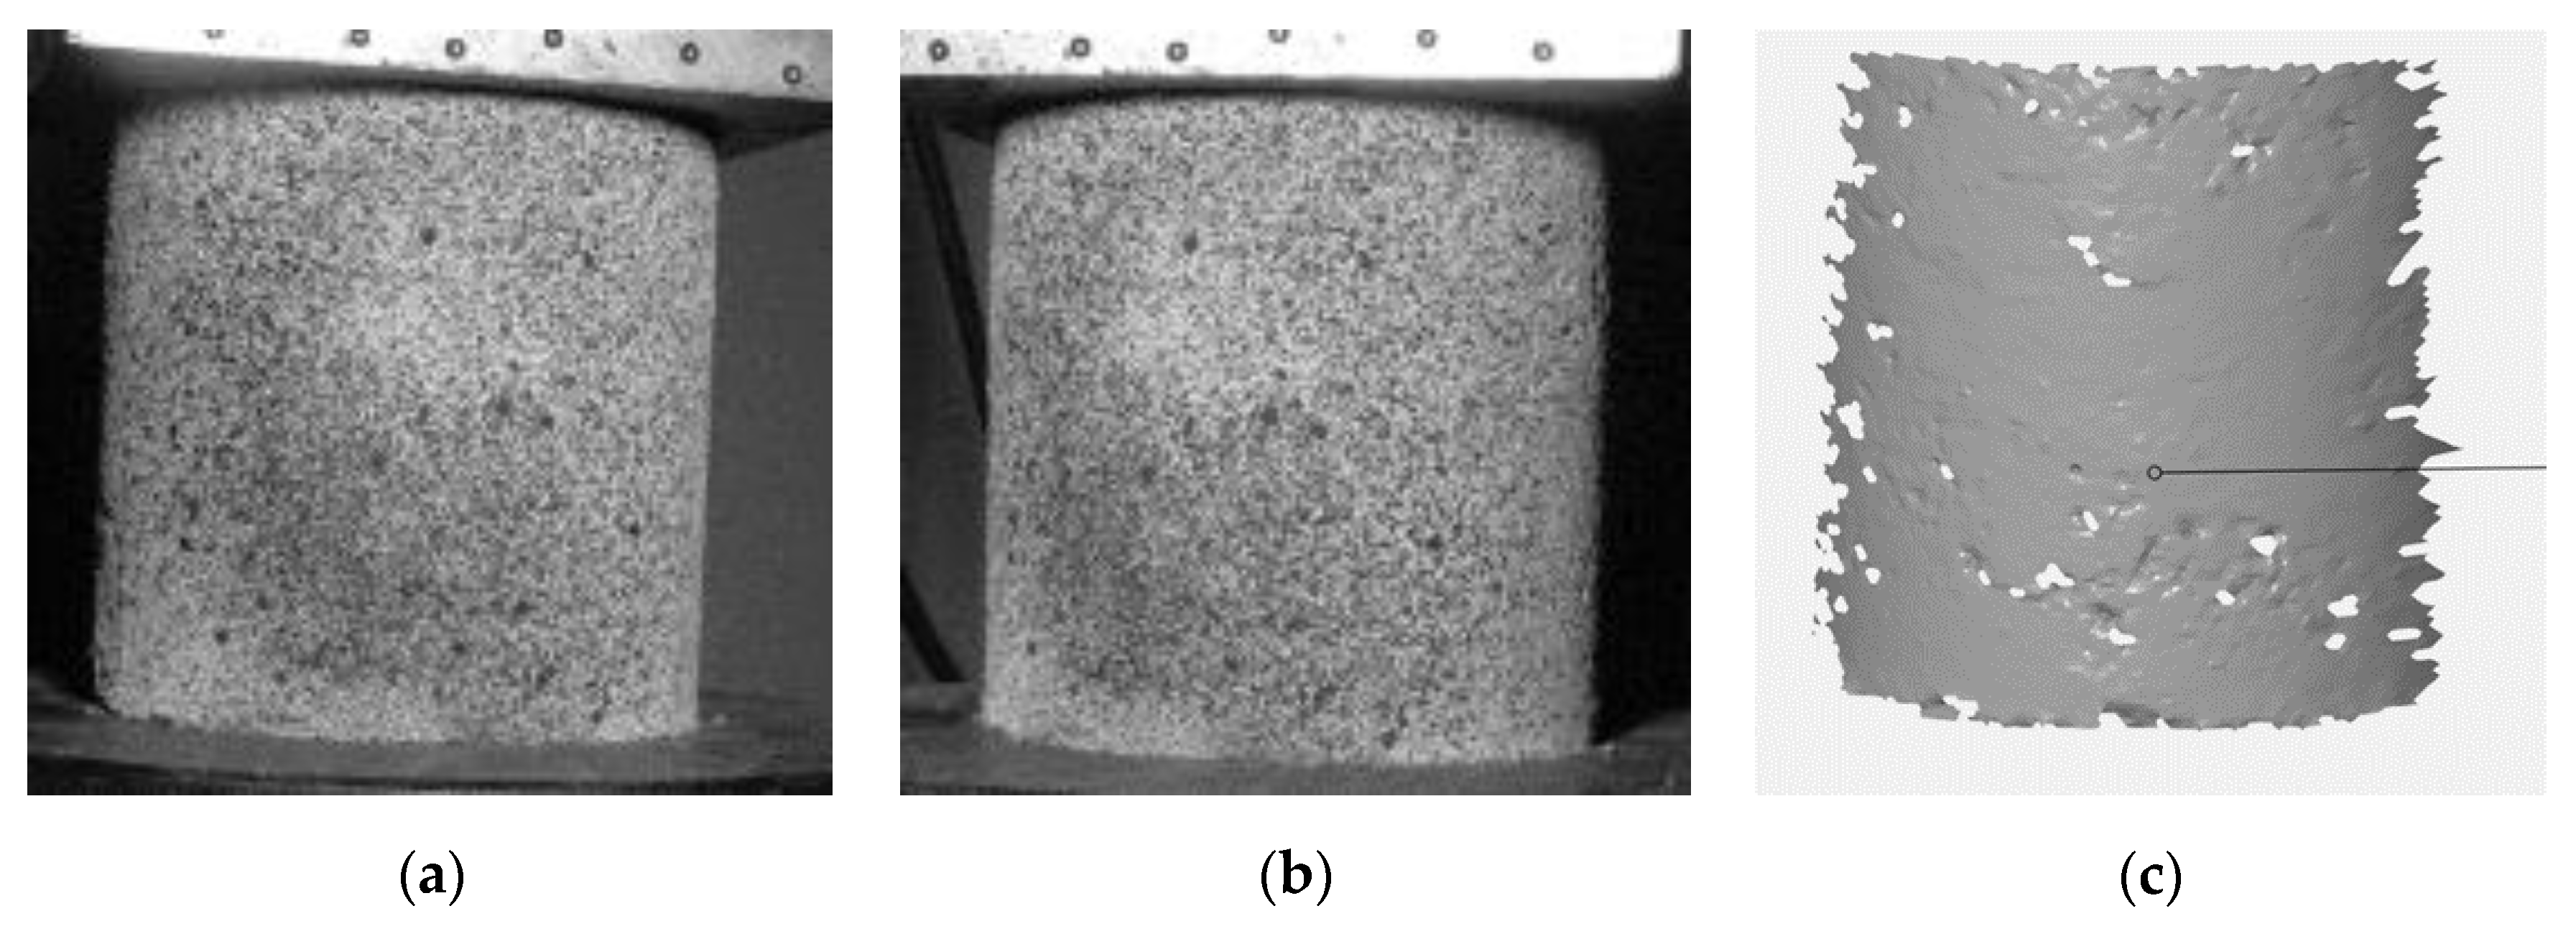
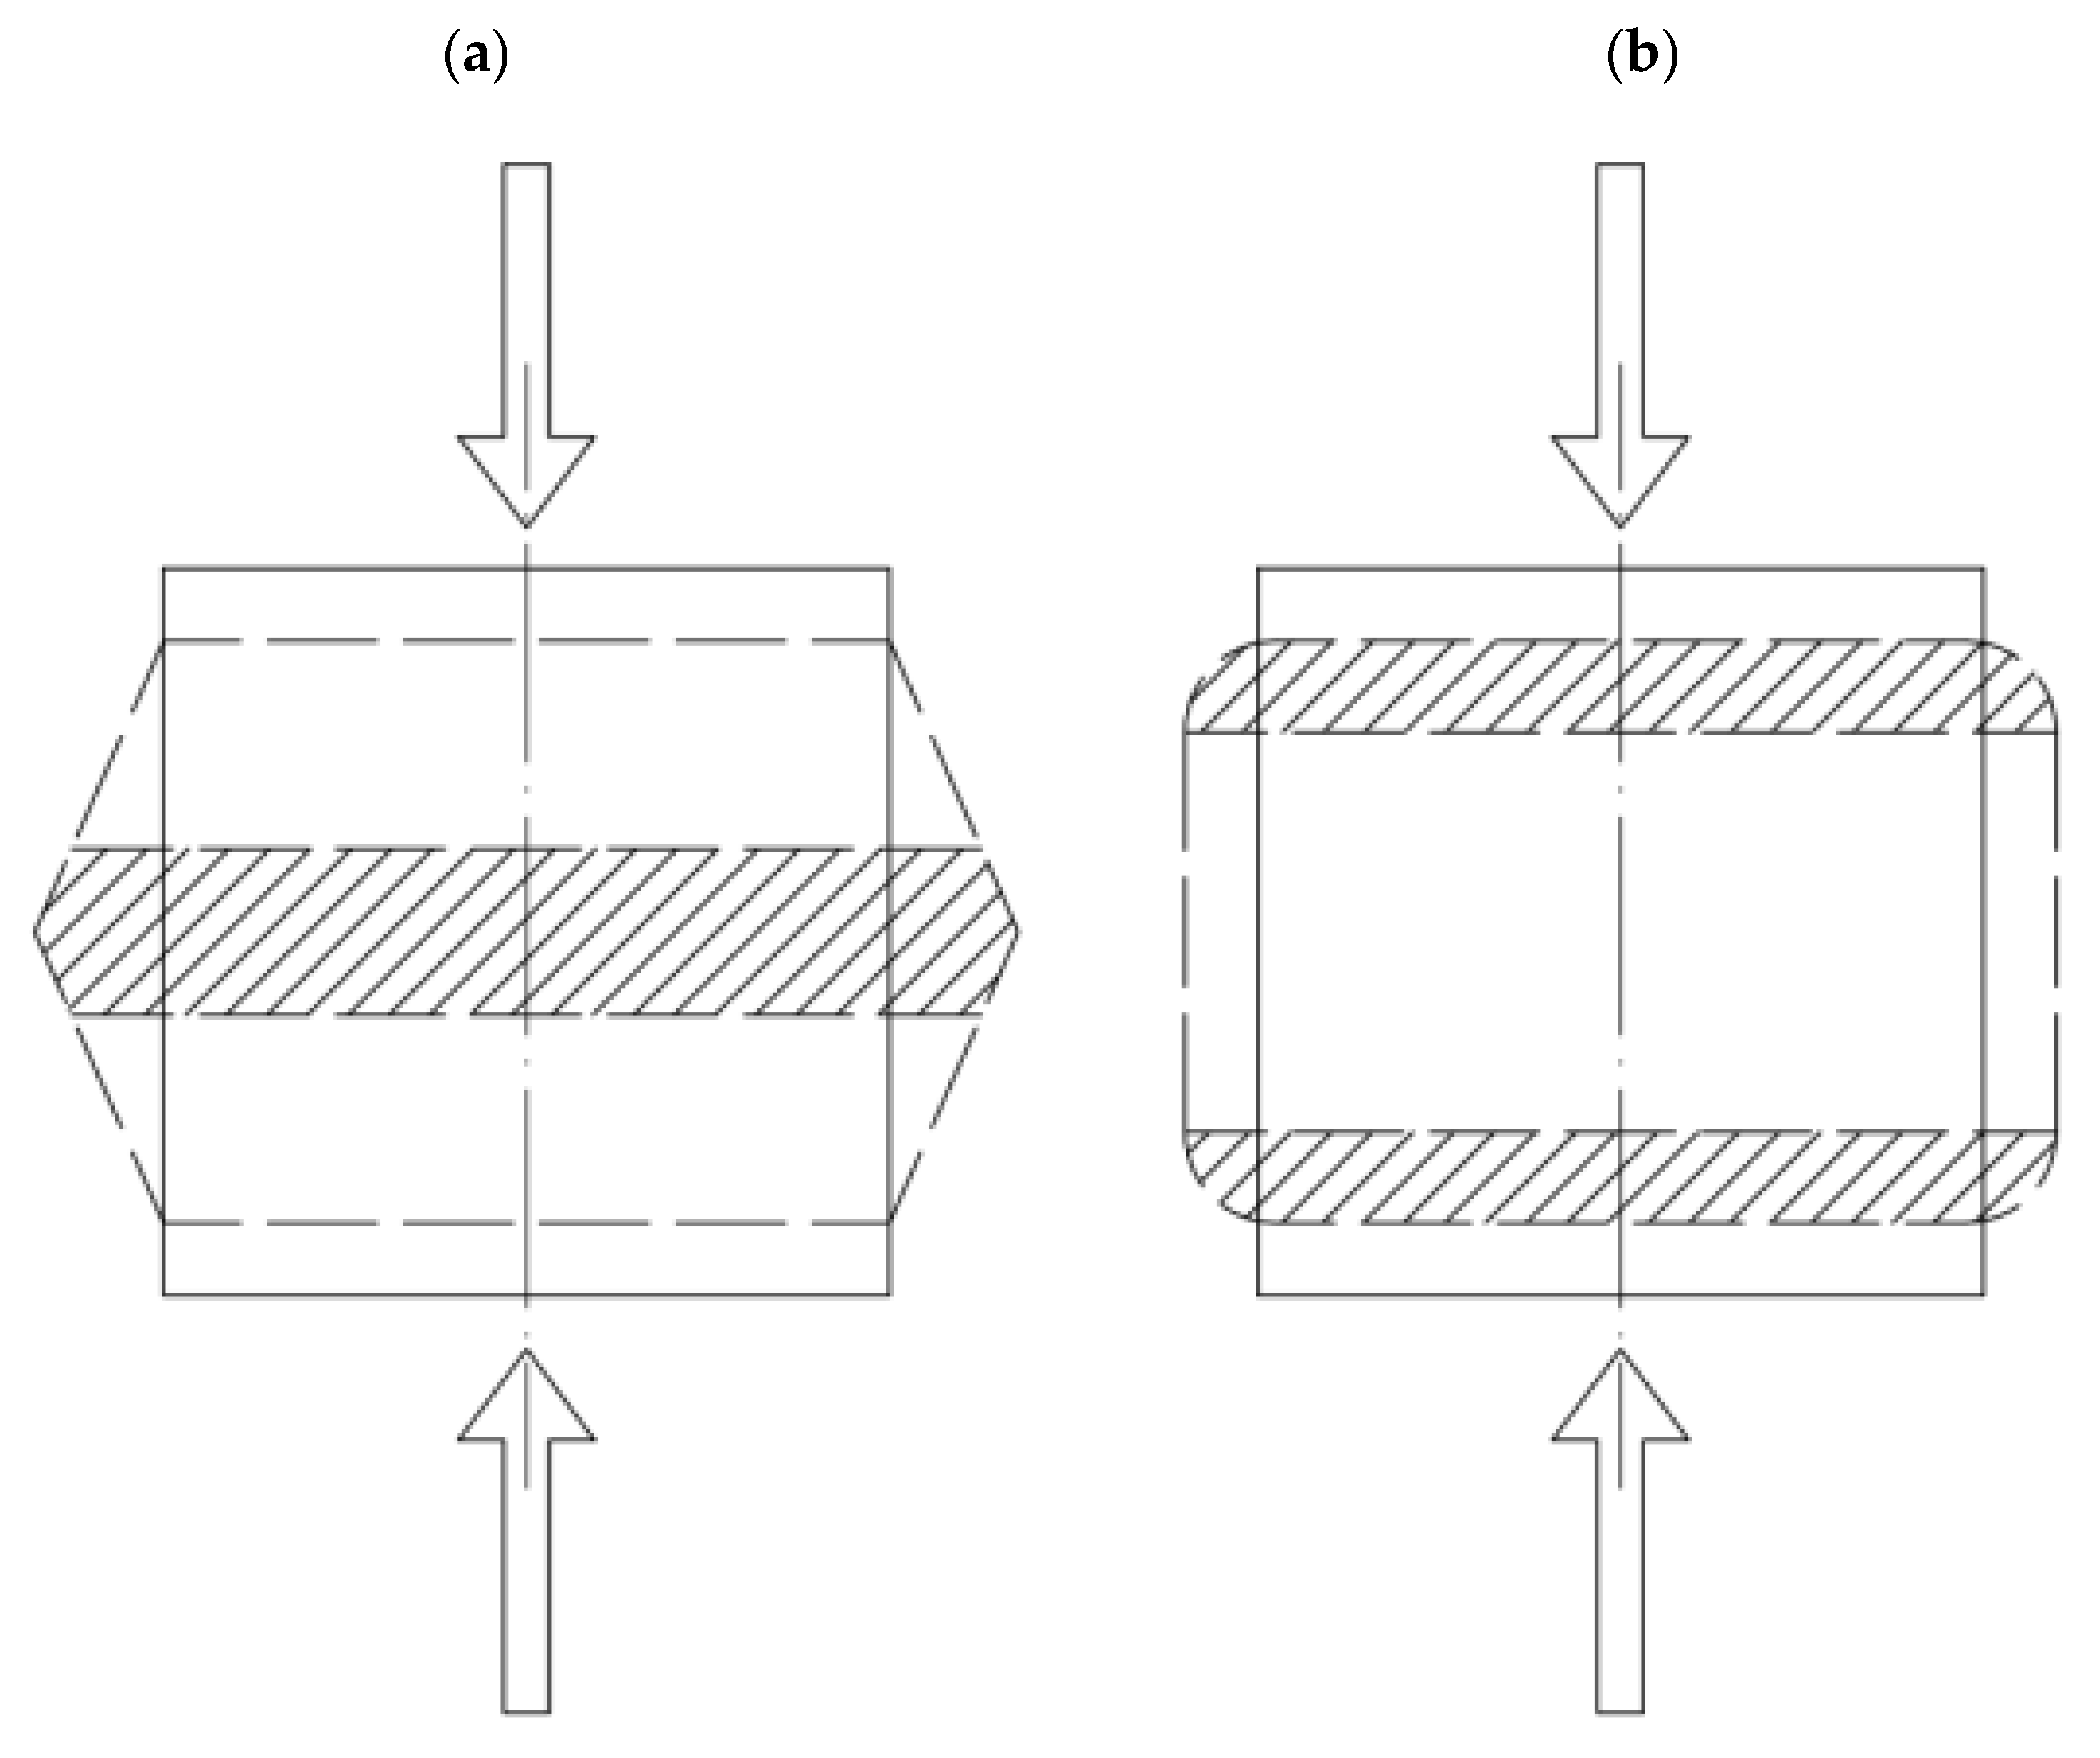
- The differences in the values of strains measured with virtual strain gauges and global deformations are due to the change in the form of strain of the specimen caused by the application of SRW additives. In the case of G0 control specimens, we are dealing with the form of deformability similar to that presented in Figure 19a, for which the strains are transmitted through the rigid parts of the specimen along the loading axis. In this case, the failure of the specimen occurs as a result of the accumulation of strains in the central part of the specimen, whereby the exhaustion of the load carrying capacity occurs. Specimens with SRW additives have lower stiffness, so that strains are not immediately transmitted along the load axis. They accumulate in the contact zones of the specimen and are only transmitted further when their local deformability is exhausted (Figure 19b). Therefore, the strain gauges, which did not cover the entire height of the specimen, did not record the total strain, which was realized in the contact zones of the specimen with the testing machine attachments.
- A buffer zone located where the load is in contact with the specimen and where the specimen is supported. This zone will absorb a significant portion of the strain
- Core zones where the inner part of the specimen will be subject to slight strain.
Author Contributions
Funding
Institutional Review Board Statement
Informed Consent Statement
Data Availability Statement
Conflicts of Interest
References
- Presti, D.L. Recycled tyre rubber modified bitumens for road asphalt mixtures: A literature review. Constr. Build. Mater. 2013, 49, 863–881. [Google Scholar] [CrossRef]
- Alfayez, S.A.; Suleiman, A.R.; Nehdi, M.L. Recycling Tire Rubber in Asphalt Pavements: State of the Art. Sustainability 2020, 12, 9076. [Google Scholar] [CrossRef]
- Ołdakowska, E. Assessment of selected properties of normal concretes with the grinded rubber from worn out vehicle tyres. Ecol. Eng. 2015, 43, 49–54. [Google Scholar] [CrossRef]
- Robaczyński, T. Tire recycling. Pt. I. Company sources of used tires. Recykling 2009, 1, 22–23. [Google Scholar]
- Smejda–Krzywicka, A.; Bociong, K.; Skrodzka, J.; Piwowarczyk, A.; Rzymski, W. Review of rubber products recycling methods. Przetwórstwo Tworzyw 2012, 5, 518–522. [Google Scholar]
- Sybilski, D. The use of rubber waste in road construction. Przegląd Bud. 2009, 5, 37–44. [Google Scholar]
- Simm, J.D.; Winter, M.G.; Waite, S. Design and specification of tyre bales in construction. Proc. Inst. Civ. Eng. Waste Resour. Manag. 2008, 161, 67–76. [Google Scholar] [CrossRef]
- Winter, M.G.; Watts, G.R.A.; Johnson, P.E.; Limited, T.R.L. Tyre Bales in Construction; TRL Limited: Wokingham, UK, 2006. [Google Scholar]
- Mackenzie, C.; Saarenketo, T. The B871 Tyre Bale Project. In The Use of Recycled Tyre Bales in a Lightweight Road Embankment over Peat; Roadscanners: Rovaniemi, Finland, 2003; p. 64. [Google Scholar]
- Winter, M.G.; Reid, J.M.; Griffiths, P.I.J. Tyre Bales in Construction: Case Studies. In Report PPR045; TRL Limited: Crowthorne, UK, 2005. [Google Scholar]
- Winter, M.G. Road foundation construction using lightweight tyre bales. In Proceedings of the 18th International Conference on Soil Mechanics and Geotechnical Engineering, Paris, France, 2–6 September 2013; Volume 4, pp. 3275–3278. [Google Scholar]
- Prikryl, W.; Williammee, R.; Winter, M.G. Slope failure repair using tyre bales at Interstate Highway 30, Tarrant County, Texas, USA. Q. J. Eng. Geol. Hydrogeol. 2005, 38, 377. [Google Scholar] [CrossRef]
- Simm, J.; Wallis, M. Sustainable Re-Use of Tyres in Port, Coastal and River Engineering. In Guidance for Planning, Implementation and Maintenance; HR Wallingford: Wallingford, UK, 2004. [Google Scholar]
- Winter, M.G.; Williammee, R.; Prikryl, W. The application of tyre bales to the repair of slope failures. Proc. Inst. Civ. Eng. Eng. Sustain. 2009, 162, 145–153. [Google Scholar] [CrossRef]
- Hodgson, I.F.; Beales, S.P.; Curd, M.J. Use of tyre bales as lightweight fill for the A421 improvements scheme near Bedford, UK. Eng. Geol. Spec. Publ. 2012, 26, 101–108. [Google Scholar] [CrossRef]
- Bo, M.W.; Yarde, A. Use of waste tyre bales to construct a flood embankment. Proc. Inst. Civ. Eng. Waste Resour. Manag. 2006, 159, 57–64. [Google Scholar] [CrossRef]
- Oikonomou, N.; Mavridou, S. The use of waste tyre rubber in civil engineering works. Sustain. Constr. Mater. 2009, 2009, 213–238. [Google Scholar] [CrossRef]
- Wang, F.; Song, W. Effects of Crumb Rubber on Compressive Strength of Cement-Treated Soil. Arch. Civ. Eng. 2015, 61, 59–78. [Google Scholar] [CrossRef]
- Liu, H.; Wang, X.; Jiao, Y.; Sha, T. Experimental Investigation of the Mechanical and Durability Properties of Crumb Rubber Concrete. Materials 2016, 9, 172. [Google Scholar] [CrossRef]
- Bušić, R.; Benšić, M.; Miličević, I.; Strukar, K. Prediction Models for the Mechanical Properties of Self-Compacting Concrete with Recycled Rubber and Silica Fume. Materials 2020, 13, 1821. [Google Scholar] [CrossRef]
- Hadzima-Nyarko, M.; Nyarko, E.K.; Ademović, N.; Miličević, I.; Kalman Šipoš, T. Modelling the Influence of Waste Rubber on Compressive Strength of Concrete by Artificial Neural Networks. Materials 2019, 12, 561. [Google Scholar] [CrossRef] [PubMed]
- Chen, C.-Y.; Lee, M.-T. Application of Crumb Rubber in Cement-Matrix Composite. Materials 2019, 12, 529. [Google Scholar] [CrossRef]
- Petrella, A.; Notarnicola, M. Lightweight Cement Conglomerates Based on End-of-Life Tire Rubber: Effect of the Grain Size, Dosage and Addition of Perlite on the Physical and Mechanical Properties. Materials 2021, 14, 225. [Google Scholar] [CrossRef] [PubMed]
- Strukar, K.; Kalman Šipoš, T.; Dokšanović, T.; Rodrigues, H. Experimental Study of Rubberized Concrete Stress-Strain Behavior for Improving Constitutive Models. Materials 2018, 11, 2245. [Google Scholar] [CrossRef] [PubMed]
- Lv, J.; Zhou, T.; Du, Q.; Li, K.; Sun, K. Evaluation of Stress–Strain Behavior of Self-Compacting Rubber Lightweight Aggregate Concrete under Uniaxial Compression Loading. Materials 2019, 12, 4064. [Google Scholar] [CrossRef] [PubMed]
- Lv, J.; Zhou, T.; Li, K.; Sun, K. Shrinkage Properties of Self-Compacting Rubber Lightweight Aggregate Concrete: Experimental and Analytical Studies. Materials 2019, 12, 4059. [Google Scholar] [CrossRef]
- Lv, J.; Zhou, T.; Wu, H.; Sang, L.; He, Z.; Li, G.; Li, K. A New Composite Slab Using Crushed Waste Tires as Fine Aggregate in Self-Compacting Lightweight Aggregate Concrete. Materials 2020, 13, 2551. [Google Scholar] [CrossRef] [PubMed]
- Fang, J.; Zhao, L.; Shi, J. Frost Resistance and Pore Structure of Concrete Incorporated with Rubber Aggregates and Nano-SiO2. Materials 2021, 14, 1170. [Google Scholar] [CrossRef] [PubMed]
- Mhaya, A.M.; Baghban, M.H.; Faridmehr, I.; Huseien, G.F.; Abidin, A.R.Z.; Ismail, M. Performance Evaluation of Modified Rubberized Concrete Exposed to Aggressive Environments. Materials 2021, 14, 1900. [Google Scholar] [CrossRef]
- Walotek, K. Research and Analyses of Road Mixtures Containing Selected Anthropogenic Wastes. Ph.D. Thesis, Silesian University of Technology, Faculty of Civil Engineering, Gliwice, Poland, 2022. [Google Scholar]
- Road and Bridge Research Institute. Assessment and Testing of Selected Industrial Waste for Use in Road Construction; Road and Bridge Research Institute: Warsaw, Poland, 2004. [Google Scholar]
- Szlugaj, J. Mineralogical and Petrographic Characteristics of Mining Waste from Selected Hard Coal Mines in Terms of Their Use for the Production of Mineral Aggregates; Publishing House of the Institute of Mineral and Energy Management; Polish Academy of Sciences: Kraków, Poland, 2020. [Google Scholar]
- Sokół, W.; Tabor, A. Problems of post-coal waste management from hard coal mining in Poland. Przegląd Geol. 1996, 44, 710–715. [Google Scholar]
- Machniak, Ł.; Kozioł, W. Alternative aggregates—Resource base and directions of use in construction. Aggreg. Prod. Transp. Appl. 2014, 4, 28–33. [Google Scholar]
- Kozioł, W.; Ciepliński, A.; Machniak, Ł.; Borcz, A. Aggregates in construction, Cz. 2. Alternative aggregates, September–October 2015. Now. Bud. Eng. 2015, 5, 35–40. [Google Scholar]
- Klojzy–Karczmarczyk, B.; Mazurek, J.; Paw, K. Possibilities of management of aggregates and mining waste of hard coal mining ZG Janina in the processes of reclamation of opencast workings. Gosp. Sur. Miner. 2016, 32, 111–134. [Google Scholar]
- Duszyński, A.; Jasiński, W.; Pryga–Szulc, A. Characteristic of coaly shale aggregate and its application for the road construction. Bull. Natl. Geol. Inst. 2018, 472, 321–326. [Google Scholar] [CrossRef]
- Skarżyńska, K. The use of unburned coal waste in road construction. Inżynieria Morska I Geotech. 1996, 4, 86–97. [Google Scholar]
- Skarżyńska, K. Coal Wastes and Their Application in Civil and Water Engineering; Agricultural University of H. Kołłątaja: Krakow, Poland, 1997. [Google Scholar]
- Pieczyrak, J. Characteristics and engineering usage of waste from coal mining. ACEE 2010, 1, 77–84. [Google Scholar]
- Bing, P.; Xie, H.; Xu, B.; Dai, F. Performance of sub-pixel registration algorithms in digital image correlation. Meas. Sci. Technol. 2006, 17, 1615–1621. [Google Scholar] [CrossRef]
- Blajer, M.; Stopkowicz, A.; Adamczyk, J.; Cała, M. The preliminary research of the physico-mechanical properties of aggregates based on the colliery shale, supplemented by fly ash. Arch. Min. Sci. 2019, 64, 21–34. [Google Scholar] [CrossRef]
- Amrani, M.; Taha, Y.; El Haloui, Y.; Benzaazoua, M.; Hakkou, R. Sustainable Reuse of Coal Mine Waste: Experimental and Economic Assessments for Embankments and Pavement Layer Applications in Morocco. Minerals 2020, 10, 851. [Google Scholar] [CrossRef]
- Haibin, L.; Zhenling, L. Recycling Utilization Patterns of Coal Mining Waste in China. Resour. Conserv. Recycl. 2010, 54, 1331–1340. [Google Scholar] [CrossRef]
- Wowkowicz, P.; Bojanowicz–Bablok, A.; Gaworek, B. Use of Thermal Metallurgy and Mining Waste in Road Construction. Middle Pomeranian Sci. Soc. Environ. Prot. 2018, 20, 1335–1349. [Google Scholar]
- Sternik, K. The influence of the degradation of the mechanical parameters of unburnt coal minig slate on the stability of the slope of a deep excavation (Wpływ degradacji parametrów mechanicznych odpadów kopalnianych na stateczność skarpy głębokiego wykopu). Czas. Tech. 2011, 21, 165–179. [Google Scholar]
- Galos, K.; Szlugaj, J. Management of hard coal mining and processing wastes in Poland. Miner. Resour. Manag. 2014, 30, 51–64. [Google Scholar] [CrossRef]
- Bauerek, A.; Diatta, J.; Pierzchała, Ł.; Więckol-Ryk, A.; Krzemień, A. Development of Soil Substitutes for the Sustainable Land Reclamation of Coal Mine-Affected Areas. Sustainability 2022, 14, 4604. [Google Scholar] [CrossRef]
- Lach, K.; Grodecki, M. The colliery spoils as the tight element of flood banks—Laboratory test and numerical symulations. Tech. Trans. 2012, 3, 43–52. [Google Scholar]
- Gruchot, A. Utilization of post coal waste composites and fly ash for levee constructions. Przegląd Górniczy 2014, 7, 158–164. [Google Scholar]
- Xu, Z. Study on preparation of porous ceramics by using industrial wastes. In Proceedings of the 4th International Conference on Mechanical Materials and Manufacturing Engineering (MMME 2016), Beijing, China, 30–31 December 2016. [Google Scholar]
- Sas, W.; Głuchowski, A. Methods of determination of the modulus of elasticity (E and Mr) from the repeated loading tests CBR. Sci. Rev.–Eng. Environ. Sci. 2012, 57, 171–181. [Google Scholar]
- Walotek, K.; Bzówka, J.; Ciołczyk, A. Examples of the Use of the ARAMIS 3D Measurement System for the Susceptibility to Deformation Tests for the Selected Mixtures of Coal Mining Wastes. Sensors 2021, 21, 4600. [Google Scholar] [CrossRef] [PubMed]
- Ciołczyk, A.; Walotek, K.; Bzówka, J. Possibilities of using digital image correlation for research in road construction (Możliwości wykorzystania cyfrowej korelacji obrazu do badań w budownictwie drogowym). Drog. 2022, 6, 173–178. [Google Scholar]
- Ciołczyk, A.; Walotek, K. Laboratory tests of waste mixtures consisting recycled tyre rubber and coal-mining wastes. Sborník Vědeckých Pr. Vysok. Školy Báňské—Tech. Univerzity Ostrav. Řada Stavební 2019, 19, 49–54. [Google Scholar]
- Ciołczyk, A.; Walotek, K. The influence of the use of recycled tyre rubber on the physical and mechanical parameters of waste mixtures with the hydraulic binder. W redaktor. In Zpevnovani, Tesneni a Kotveni Horninoveho Masivu a Stavebnich Konstrukci 2019, Sbornik Prispevku 24. Mezinarodniho Seminare, Ostrava, Czech Republic, 14–15 February 2019; Vysoka Skola Banska—Technicka Univerzita: Ostrava, Czech Republic, 2019; pp. 8–15. [Google Scholar]


| Method | Mass of Rammer (kg) | Volume of Mold (dm3) | Compaction Energy (kN × m−1 × dm−3) |
|---|---|---|---|
| I | 2.5 | 1.0 | 0.59 |
| II | 2.5 | 2.2 | 0.59 |
| III | 4.5 | 1.0 | 2.65 |
| IV | 4.5 | 2.2 | 2.65 |
| Recipe | Shredded Rubber Waste (%) | Fly Ah (%) | Cement CEM I 42.5R (%) |
|---|---|---|---|
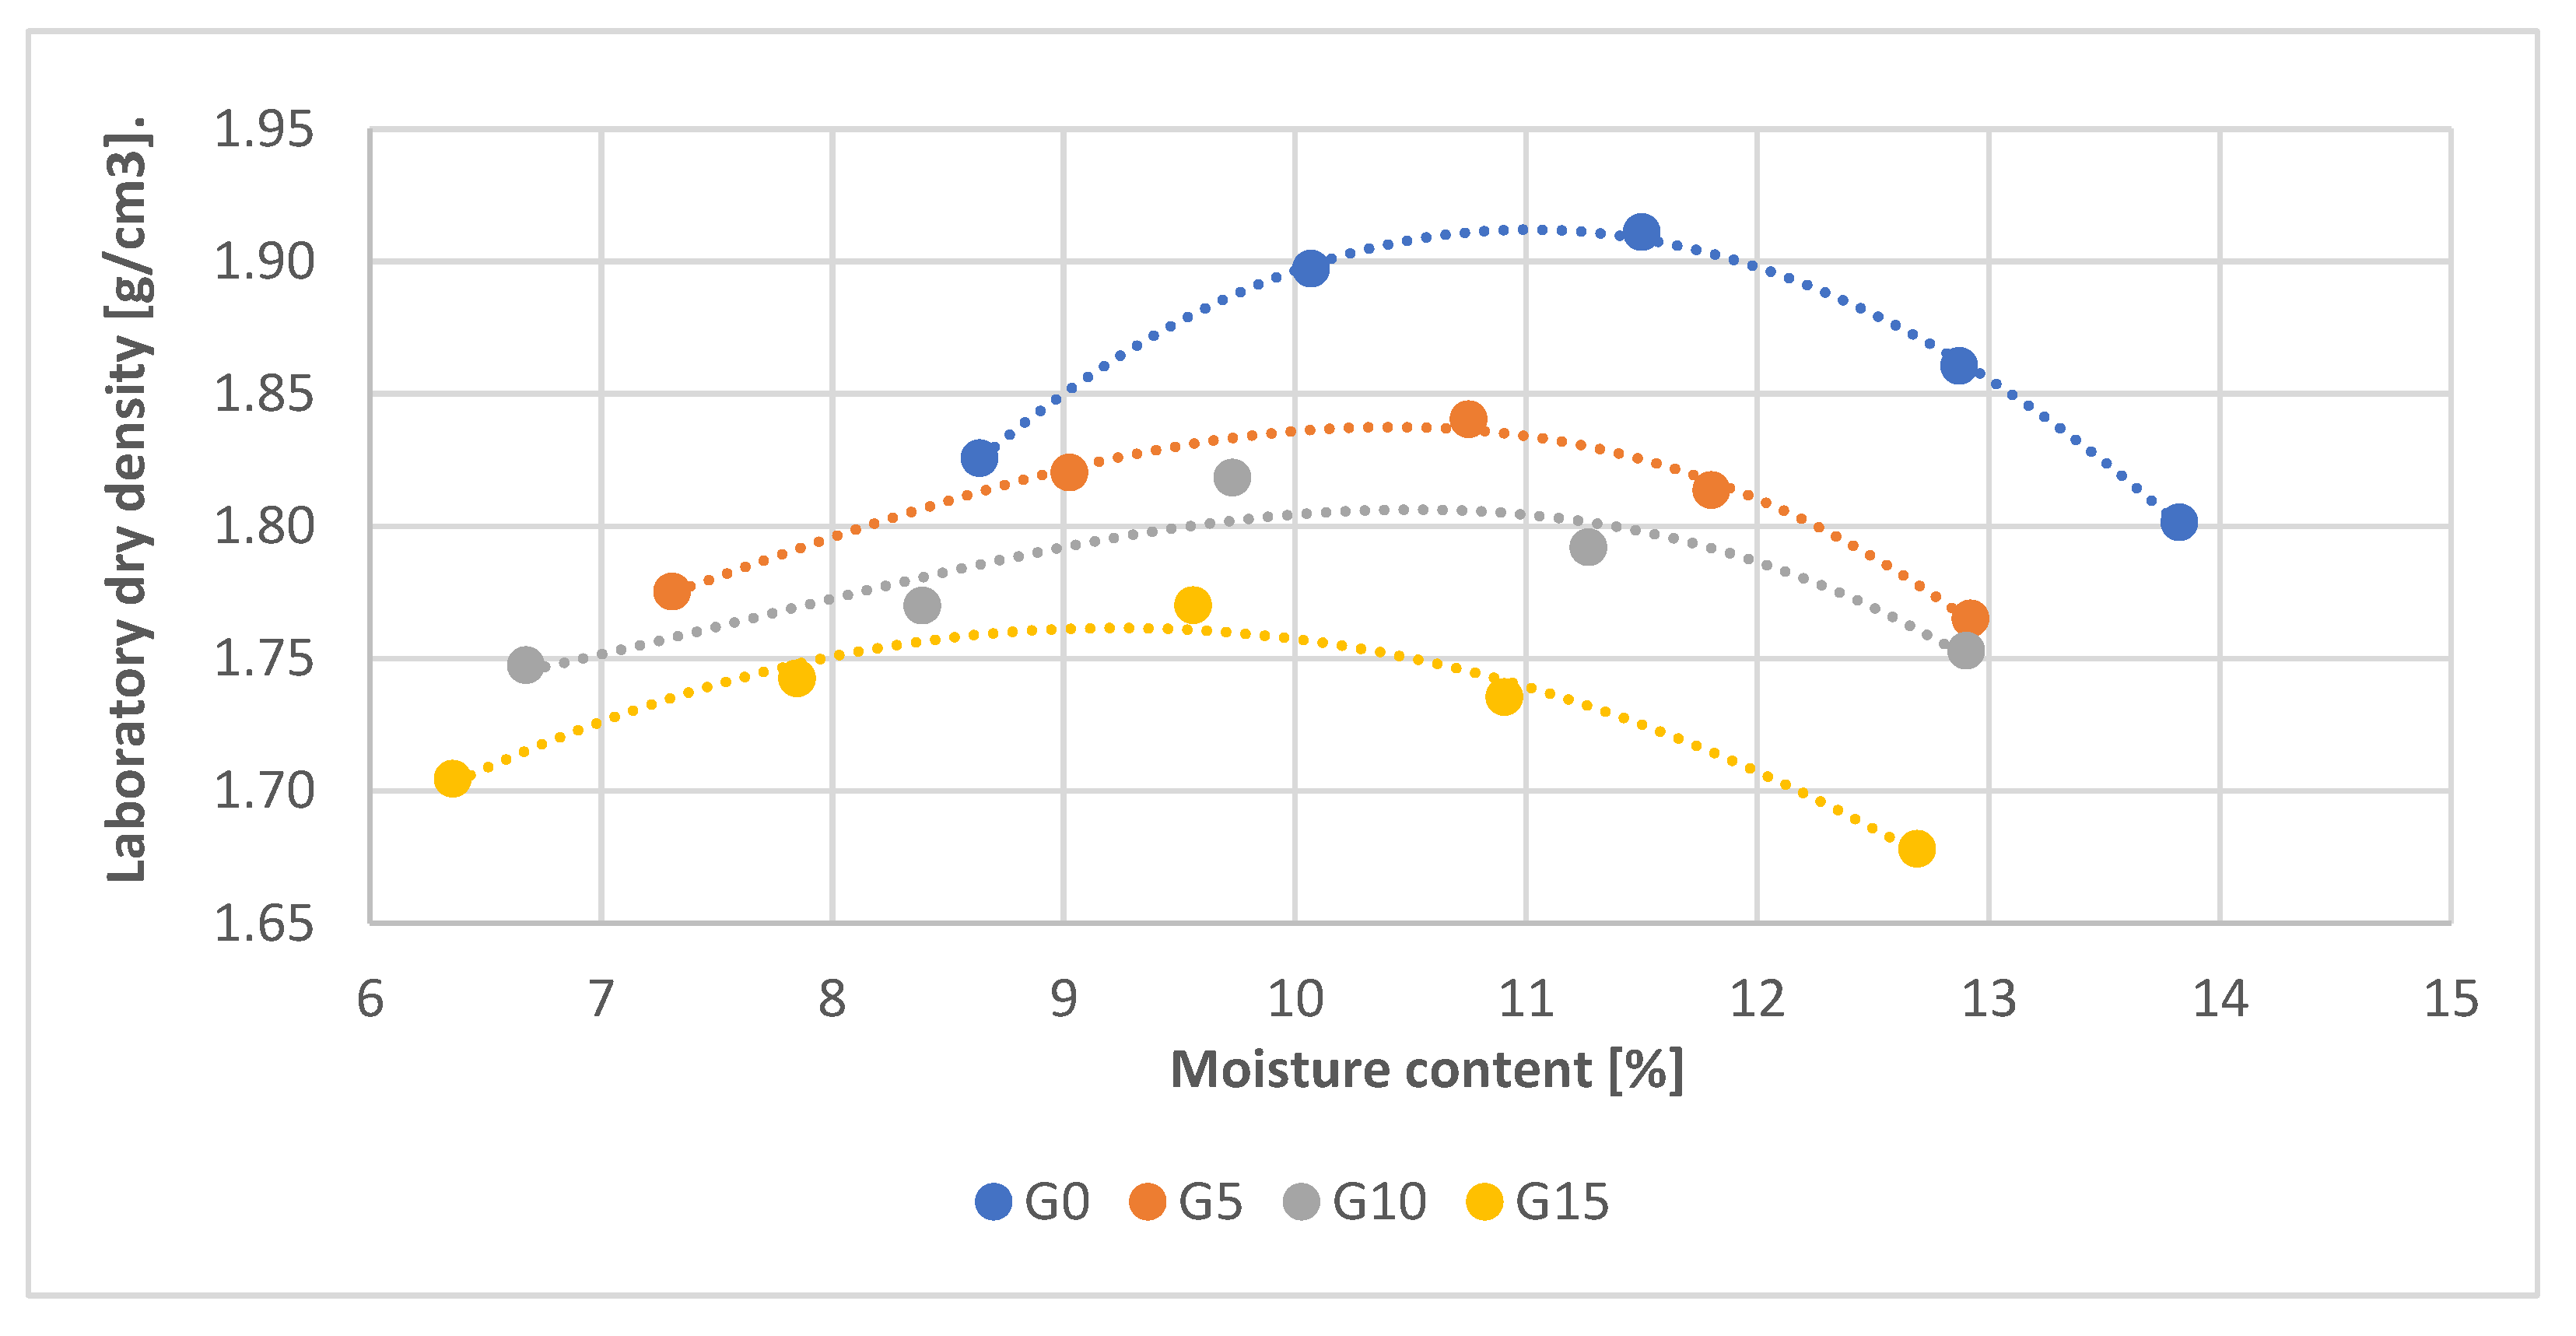
| G0 | 0 | 5 | 5 |
| G5 | 5 | 5 | 5 |
| G10 | 10 | 5 | 5 |
| G15 | 15 | 5 | 5 |
| Mix | Population Standard Deviation [%] |
|---|---|
| G0 | 0.344 |
| G5 | 0.333 |
| G10 | 0.226 |
| G15 | 0.219 |
Publisher’s Note: MDPI stays neutral with regard to jurisdictional claims in published maps and institutional affiliations. |
© 2022 by the authors. Licensee MDPI, Basel, Switzerland. This article is an open access article distributed under the terms and conditions of the Creative Commons Attribution (CC BY) license (https://creativecommons.org/licenses/by/4.0/).
Share and Cite
Walotek, K.; Bzówka, J.; Ciołczyk, A. Impact of Shredded Rubber Waste (SRW) on the Range of Elastic Work of Road Construction Mixtures Containing Industrial Waste Bound with a Binder. Materials 2022, 15, 8503. https://doi.org/10.3390/ma15238503
Walotek K, Bzówka J, Ciołczyk A. Impact of Shredded Rubber Waste (SRW) on the Range of Elastic Work of Road Construction Mixtures Containing Industrial Waste Bound with a Binder. Materials. 2022; 15(23):8503. https://doi.org/10.3390/ma15238503
Chicago/Turabian StyleWalotek, Konrad, Joanna Bzówka, and Adrian Ciołczyk. 2022. "Impact of Shredded Rubber Waste (SRW) on the Range of Elastic Work of Road Construction Mixtures Containing Industrial Waste Bound with a Binder" Materials 15, no. 23: 8503. https://doi.org/10.3390/ma15238503
APA StyleWalotek, K., Bzówka, J., & Ciołczyk, A. (2022). Impact of Shredded Rubber Waste (SRW) on the Range of Elastic Work of Road Construction Mixtures Containing Industrial Waste Bound with a Binder. Materials, 15(23), 8503. https://doi.org/10.3390/ma15238503