Article

Effect of the Matrix Melt Flow Index and Fillers on Mechanical Properties of Polypropylene-Based Composites

1
Department of Engineering Management, College of Engineering, Prince Sultan University, P.O. Box 66833, Riyadh 11586, Saudi Arabia
2
Saudi Arabian Basic Industries Corporation (SABIC), Plastics Applications Development Center, Riyadh 12373, Saudi Arabia
3
Department of Mechanical Engineering, College of Engineering, King Saud University, P.O. Box 800, Riyadh 11421, Saudi Arabia
*
Author to whom correspondence should be addressed.
Materials 2022, 15(21), 7568; https://doi.org/10.3390/ma15217568
Submission received: 5 October 2022 / Revised: 20 October 2022 / Accepted: 25 October 2022 / Published: 28 October 2022

Abstract

:
In this work, mechanical properties of reinforced polypropylene composites were studied. PP in particulates shape with two different melt flow indexes (MFI) was used, i.e., 3 and 23 g/10 min, namely PP3 and PP23, respectively. Three different materials, namely TiO2 nanoparticle (nTiO2, spherical, 0D), micro-size short carbon fiber (SCF, fiber, 1D), and graphite nanoplatelet (GNP, sheet, 2D), were used as reinforcements/fillers. PP and fillers (in the desired composition) were first pre-mixed by a mechanical mixer. The mixture was then fed to a co-rotating twin-screw extruder for melt-compounding, followed by injection molding to fabricate testing samples. The microstructure and fracture surface of the composites were observed by a scanning electron microscope (SEM). Additionally, tensile, flexural, impact, and hardness tests were conducted to evaluate their mechanical properties. The SEM images stipulate that PP23 had better adhesion and dispersion with the fillers. The results from the SEM images support the mechanical testing results. PP23 composites exhibited more significant improvement in mechanical properties in comparison to PP3. At 5 wt. % filler loading, PP/GNP composite exhibited a greater improvement in mechanical properties compared with two other composites, which are PP/SCF and PP/nTiO2 composites for both PPs.

1. Introduction

The primary factor that drives the composite industry is the great demand for lightweight materials. Composites are replacing metallic (aluminum and steel) parts in many industries. The increasing demand for lightweight materials provides a boost for composite industries. The demand for advanced materials continues to fuel the composite industry for better composites [1]. The exceptional properties of PP composites, including being lightweight and posessing high strength and recyclability, made them great candidates for automotive applications. The automotive industry is expected to have the highest growth in utilizing PP composites in the next decade due to the high load-to-weight ratio and strength. The corrosion resistance of PP composites has also fueled the growth in the PP composite market [2].
Different reinforcing fillers are being used to improve the mechanical and physical properties of polymer-based composites. Fillers are solid particulate materials usually used in polymers to enhance their properties [3]. Different types of filler material and their loading levels in the polymer may affect the properties of the polymer composite differently [4]. Carbon-fiber-reinforced composites gained popularity in the industry due to their low weight and high strength. The high cost of processing carbon fiber compared to glass fiber limited the utilization of carbon fiber in advanced industries [1]. The use of fibers and nanomaterials-reinforced thermoplastic composites existed for many years. Meanwhile, graphene or graphite nano-platelet (GNP) composites gained popularity in the last decade. The growth in the graphene market is fuelled by the demand for renewable and lightweight materials.
SCF-reinforced polymer composites have been studied since the 1970s. Nevertheless, until today, PP/SCF composites are still interesting research topics [5,6,7]. Meanwhile, the polymer nanocomposite has become a research trend and one of the research focuses in the polymer field for the past 15 years. PP/GNP [8,9,10,11] and PP/TiO2 nanoparticles [12,13,14,15] composites have been investigated extensively by many researchers. The addition of a small amount of GNP to PP was reported to improve the mechanical properties of the composite significantly [8]. GNP and TiO2 nanoparticles were also reported can be functionalized as anti-ultraviolet [16,17,18] and flame retardant [19,20,21].
The properties of composite polymers are not only affected by fillers but also depend on the base polymer and the interfacial bonding between the base polymer and the filler [22]. The melt flow index (MFI), in general, characterizes the rheological aspect of polymers, which is known as melt viscosity [23]. MFI value and viscosity have an inverse relation, wherein the higher MFI value corresponds to lower melt viscosity [24]. The MFI of the matrix influences the ability to mix between the matrix and fillers. Polymers with a low melt viscosity (high MFI) present better wetting and homogeneous distributions of the filler. These characteristics are expected to enhance the interaction between polymer and fillers and, moreover, increase the performance of a composite. Meanwhile, high melt viscosity (low MFI) polymers could lead to poor wetting and distribution. They could weaken the interfacial bonding between the polymer matrix and filler and lower the mechanical properties of composites [25,26].
In this study, different filler materials, namely TiO2 nanoparticles (nTiO2), short carbon fiber (SCF), and graphite nano-platelet (GNP), were incorporated into the PP matrix with two different melt flow indexes to produce PP-based composites. The fillers were selected based on their dimensions, such as 0D, 1D, and 2D. Incorporating these PPs and fillers creates a broad spectrum of composite materials to be characterized and studied. This paper emphasizes studying the effect of different types of PPs and fillers on the mechanical properties of composites.

2. Materials and Methods

2.1. Materials

The raw materials used were the isotactic polypropylene (iPP) polymer as the matrix and SCF, GNP, and nTiO2 as the fillers (Figure 1). Two different types PPs with different MFI were used. Table 1 shows the properties of the PPs. The first PP was PP500 grade with an MFI of 3 g/10 min (PP3) and the second PP was PP511A grade with an MFI of 23 g/10 min (PP23). MFI was measured at a temperature of 230 °C and a load of 2.16 kg. Both PPs were in the form of particulates and were supplied by SABIC. The milled SCF with 7–9 µm diameter and 150 µm average length (with carbon content above 94%) was purchased from Asbury Carbon Inc. The GNP was Nano307 grade obtained from Asbury Carbon Inc. The thickness of the GNP was about 3 nm and a diameter of less than 1 µm. A 30 nm average diameter nTiO2 rutile grade was used and purchased from US Research Nanomaterials, Inc.

2.2. Processing of Composites

The PP-based composites used in this study were prepared by combining varying percentages of SCF, GNP, and nTiO2 with the PP matrix. The percentage of SCF in the composites varied from 0 to 20 wt. %. Meanwhile, for nanofillers, the concentration varied between 0 and 5 wt. %. Table 2 presents the detailed compositions of the composites used in this study. Initially, the PP polymer was dry-mixed with the desired percentage of fillers by a mechanical mixer. The mixed mixture was then fed and melt-mixed in a twin-screw extruder. The temperature at which the mixture was processed was selected within the range of 150–210 °C to obtain composite pellets. The injection molding machine was used to produce the tensile test specimens from the composite pellets. The barrel temperature of the injection molding process was selected within the range of 180–220 °C, while the nozzle temperature was 230 °C. The schematic of composites manufacturing process can be seen in Figure 2.

2.3. Characterization of Composites

2.3.1. Microstructure

The observation of the microstructure of the composites was performed on the test sample. It was performed using a Scanning Electron Microscope (JEOL JSM 6610LV). The surface of the sample was initially coated with electroplating before SEM observation.

2.3.2. Tensile Test

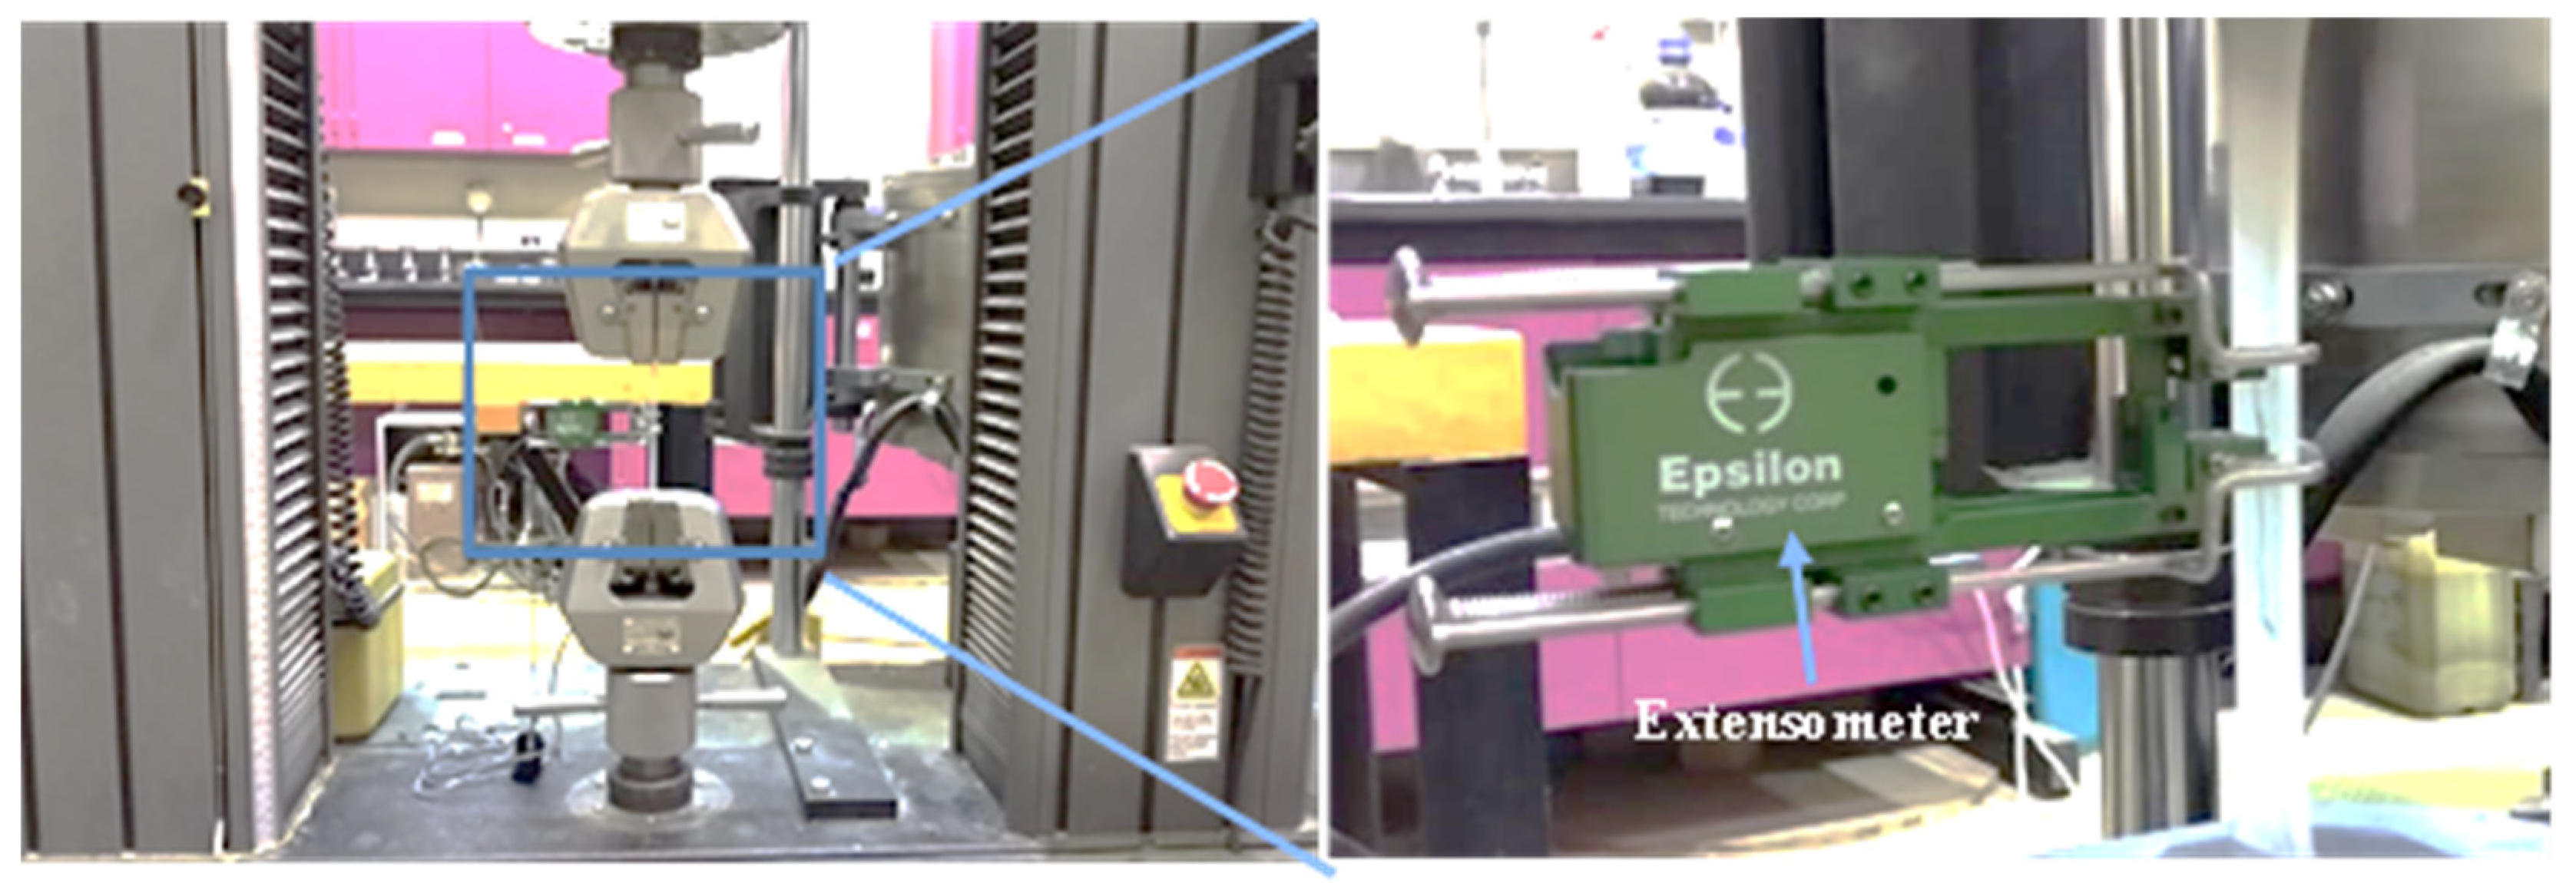
Uniaxial tensile tests were carried out per the ASTM D638-14 standard to obtain the mechanical properties of the composites [27]. The sample dimension was based on Type I of ASTM D638. Room temperature tests were performed using INSTRON 3385H with a 5 mm/min loading speed. An extensometer was attached to the samples to measure accurate strain. The ultimate tensile strength (UTS), tensile modulus, and strain at break were calculated from the stress–strain curve. Three experiments were performed at each composition to obtain statistically significant data. The tensile test’s setup can be observed in Figure 3.

2.3.3. Flexural Test

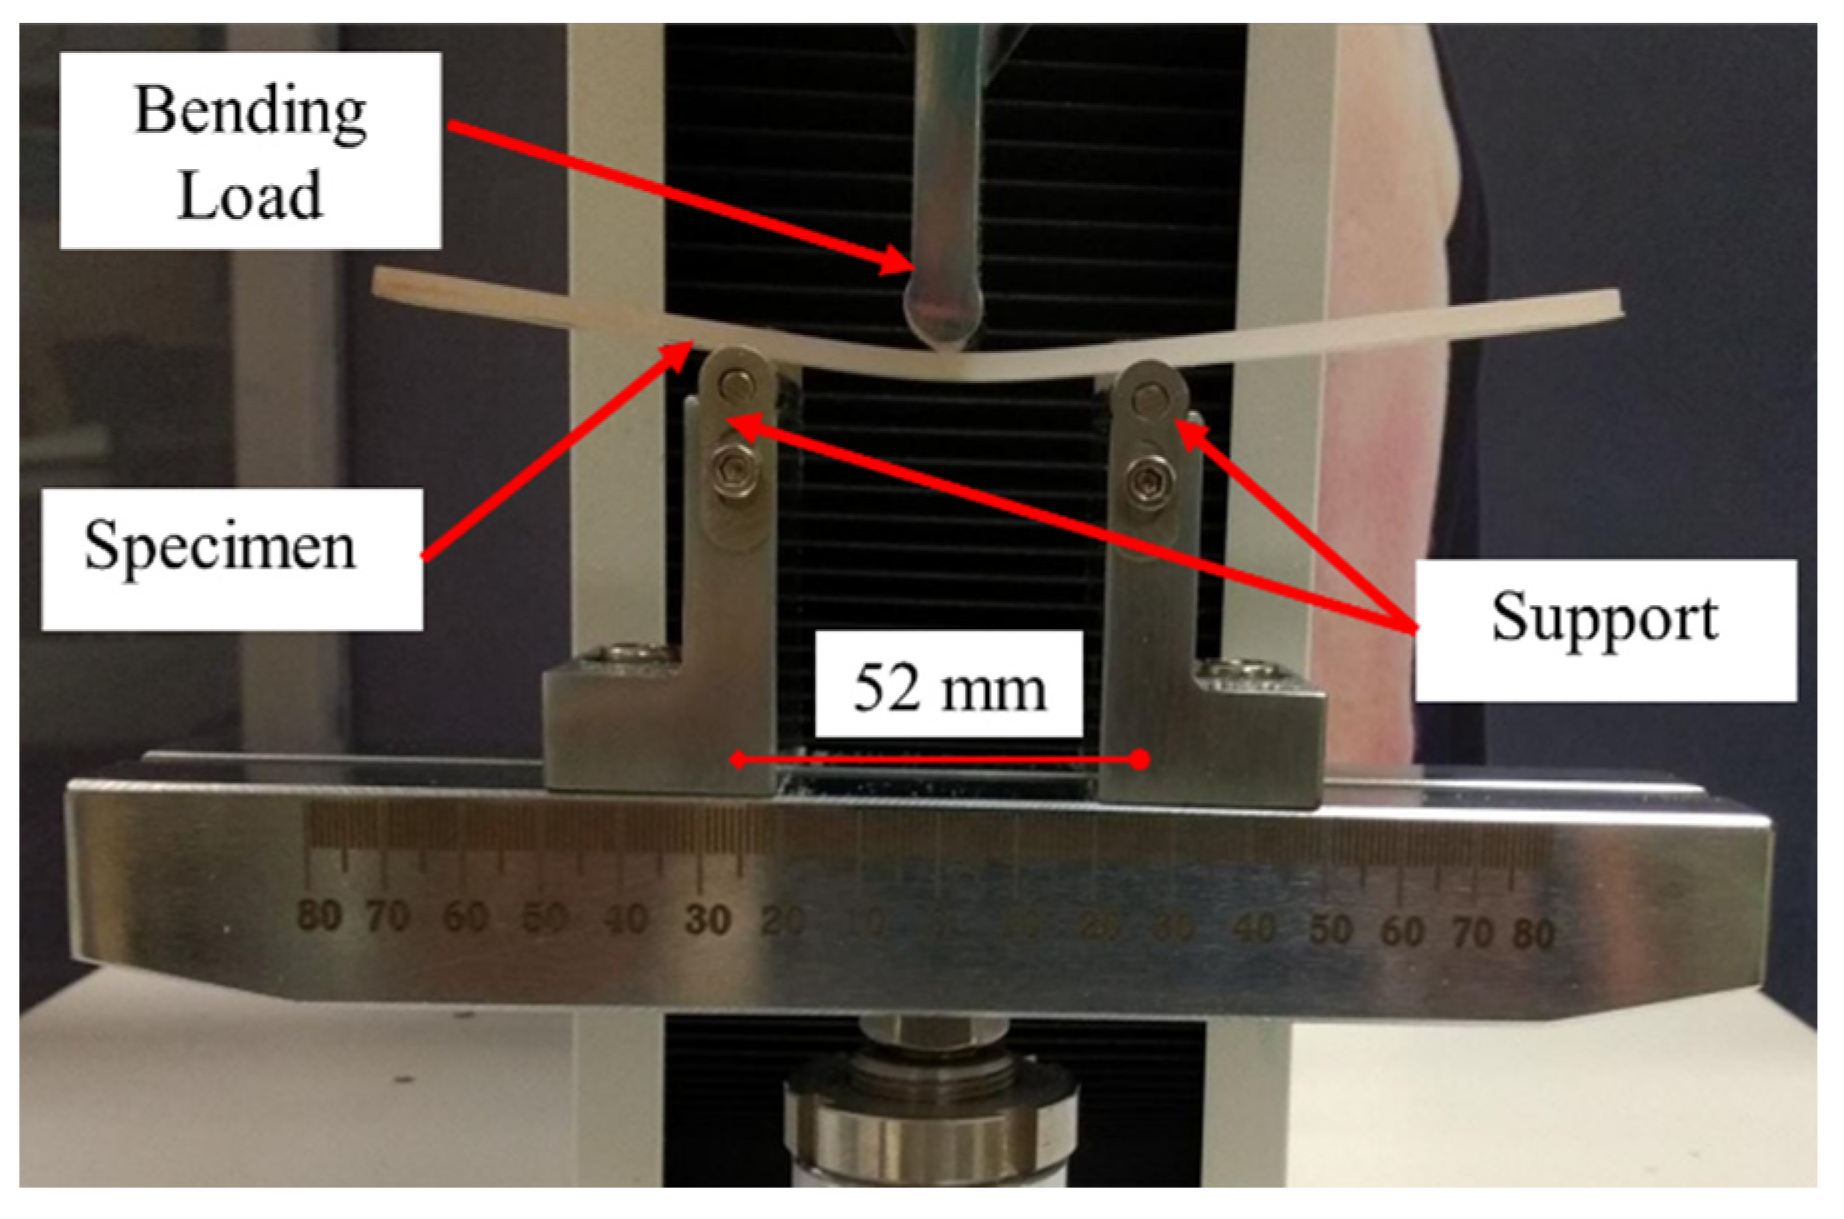
Flexural tests were performed according to ASTM D790-10 [28] on an INSTRON 3385H with a three-point bending standard attachment (Figure 4). Three experiments were carried out on each composition. The cross-head speed was adjusted to 1.5 mm/min, with a span support distance set at 52 mm. Flexural modulus and strength were calculated from the experiments.

2.3.4. Impact Test

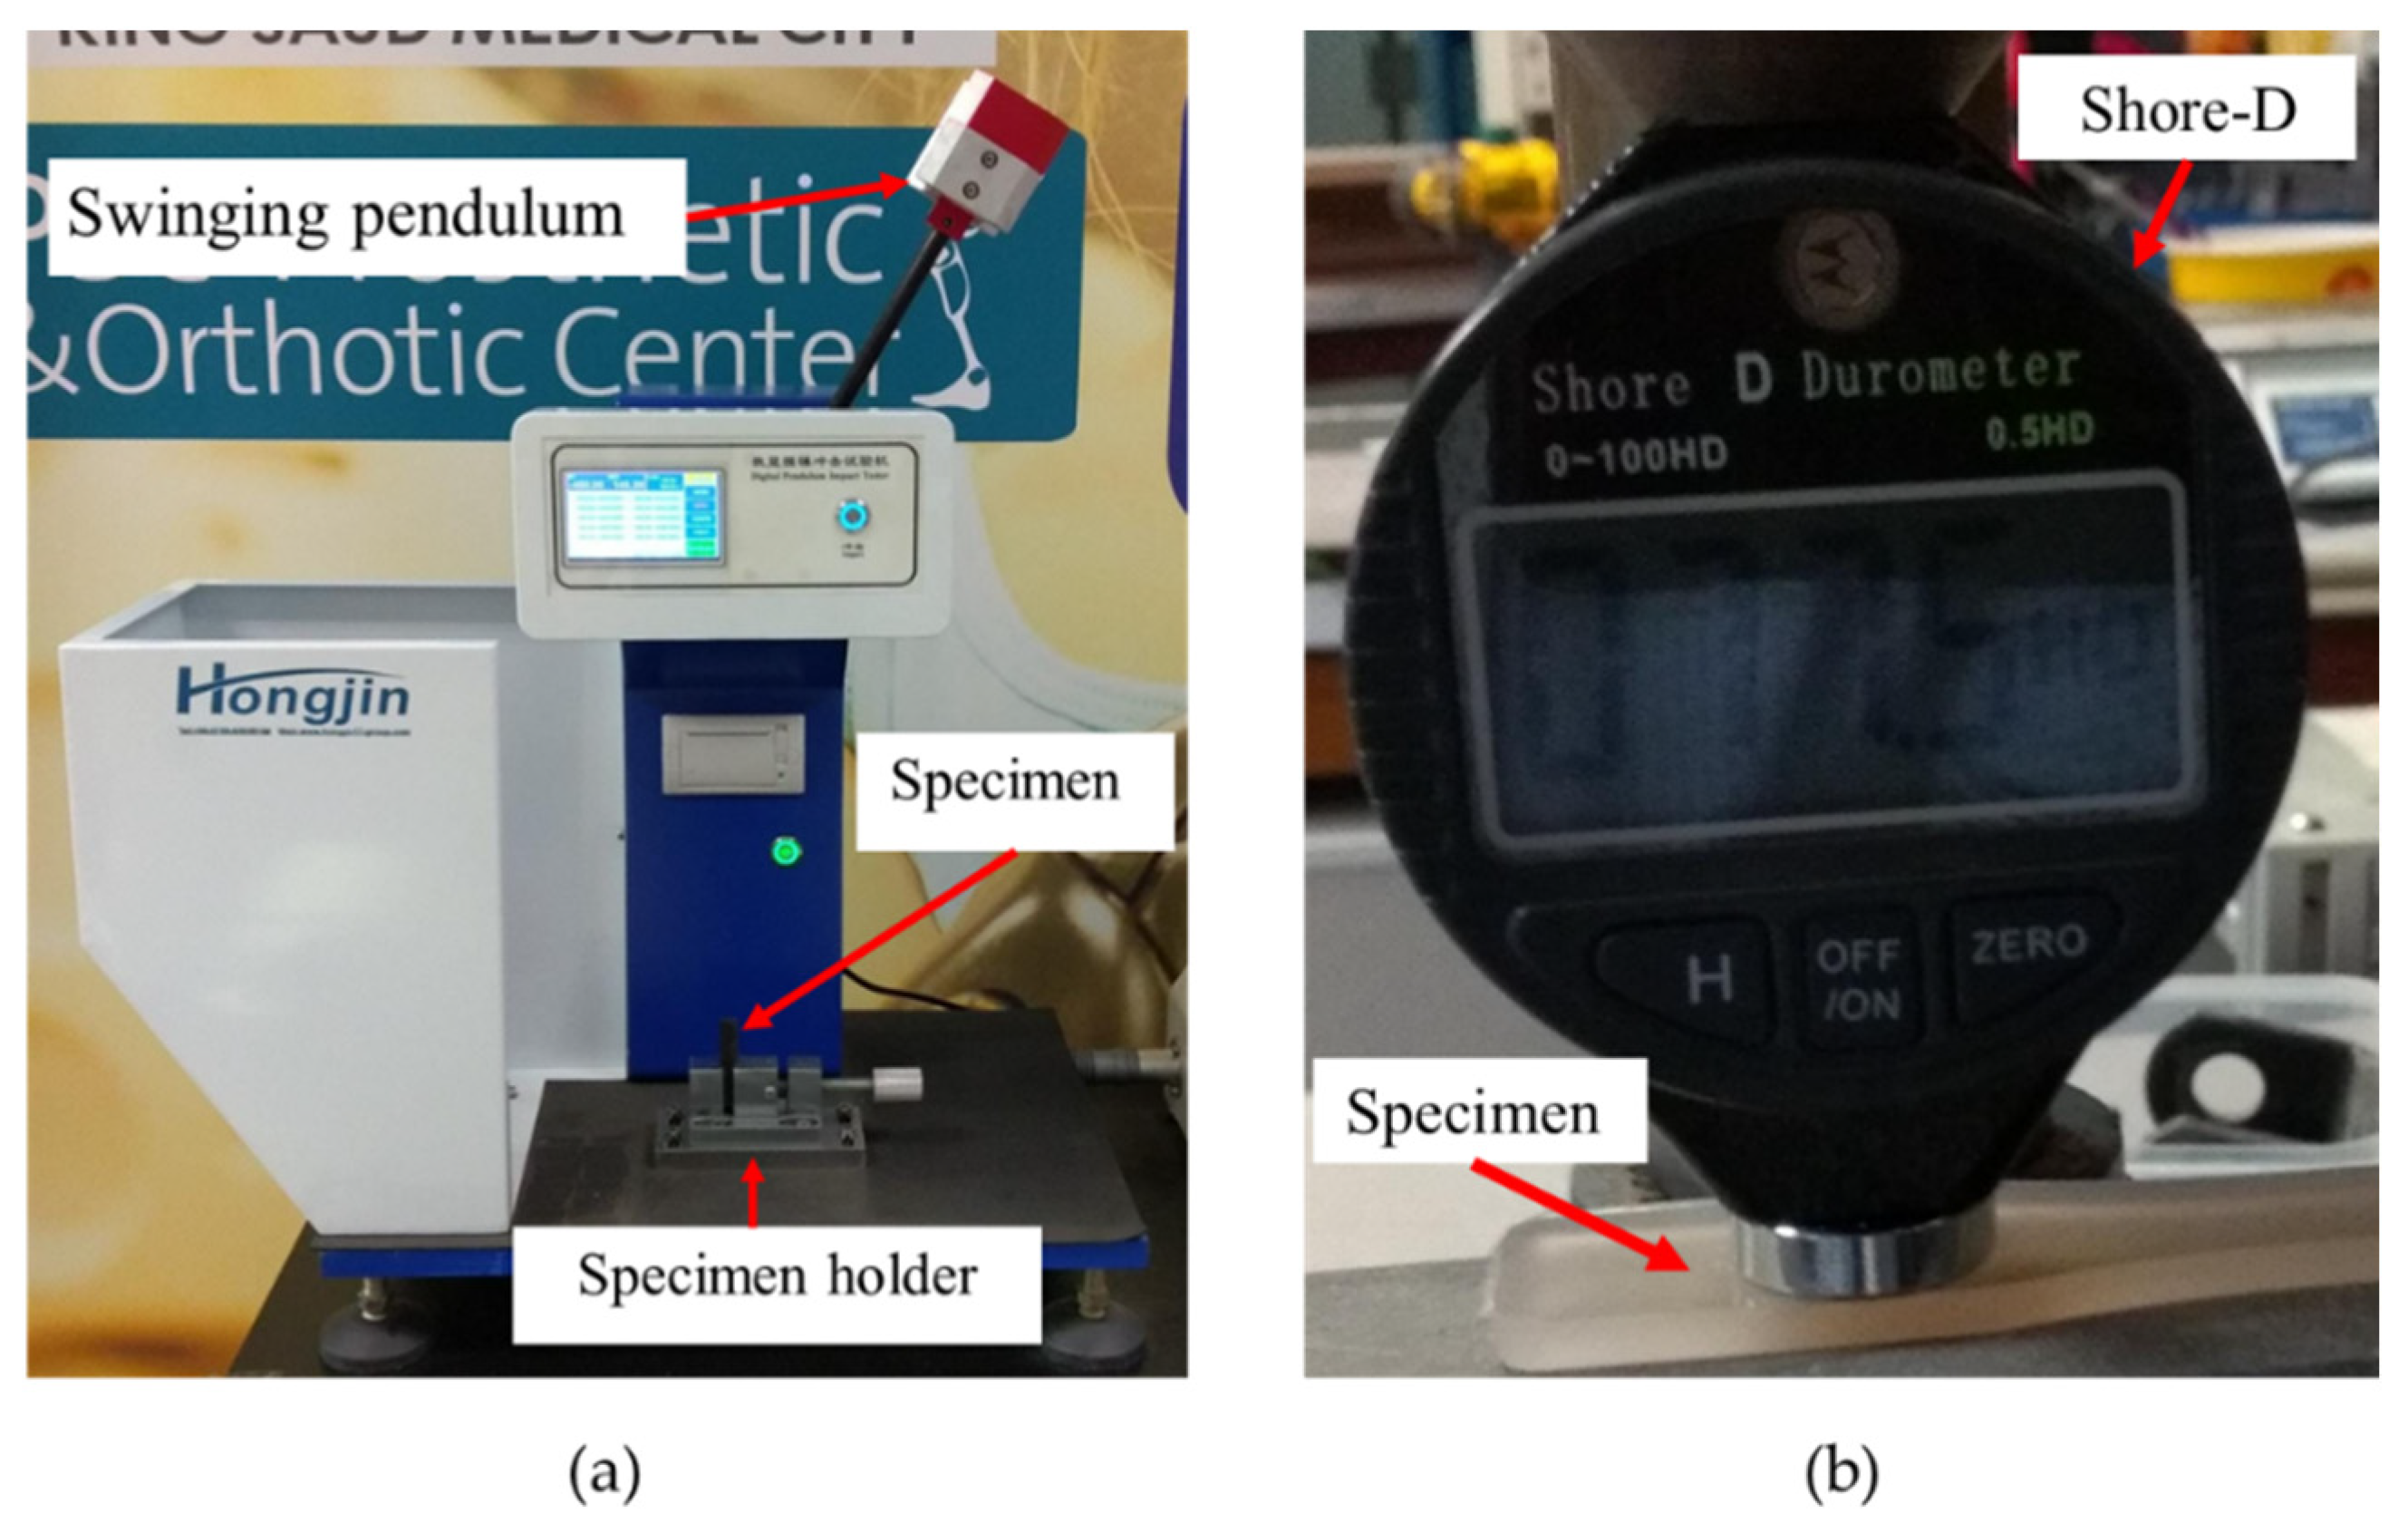
The Izod impact tests were conducted as per ASTM D256-10 [29] with notched samples to study the notch impact’s toughness (kJ/m2). An Izod impact test machine with an impact speed of 3.5 m/s and maximum impact energy of 5.5 J was used (Figure 5a). Three tests were conducted for each composition.

2.3.5. Hardness Test

Hardness tests were conducted on the composites by Durometer according to ASTM D2240-15 [30] type D (Shore-D, Figure 5b). Five measurements were performed for every sample. Readings were taken 1 s after the needle touched the samples.

3. Results and Discussion

3.1. Microstructures

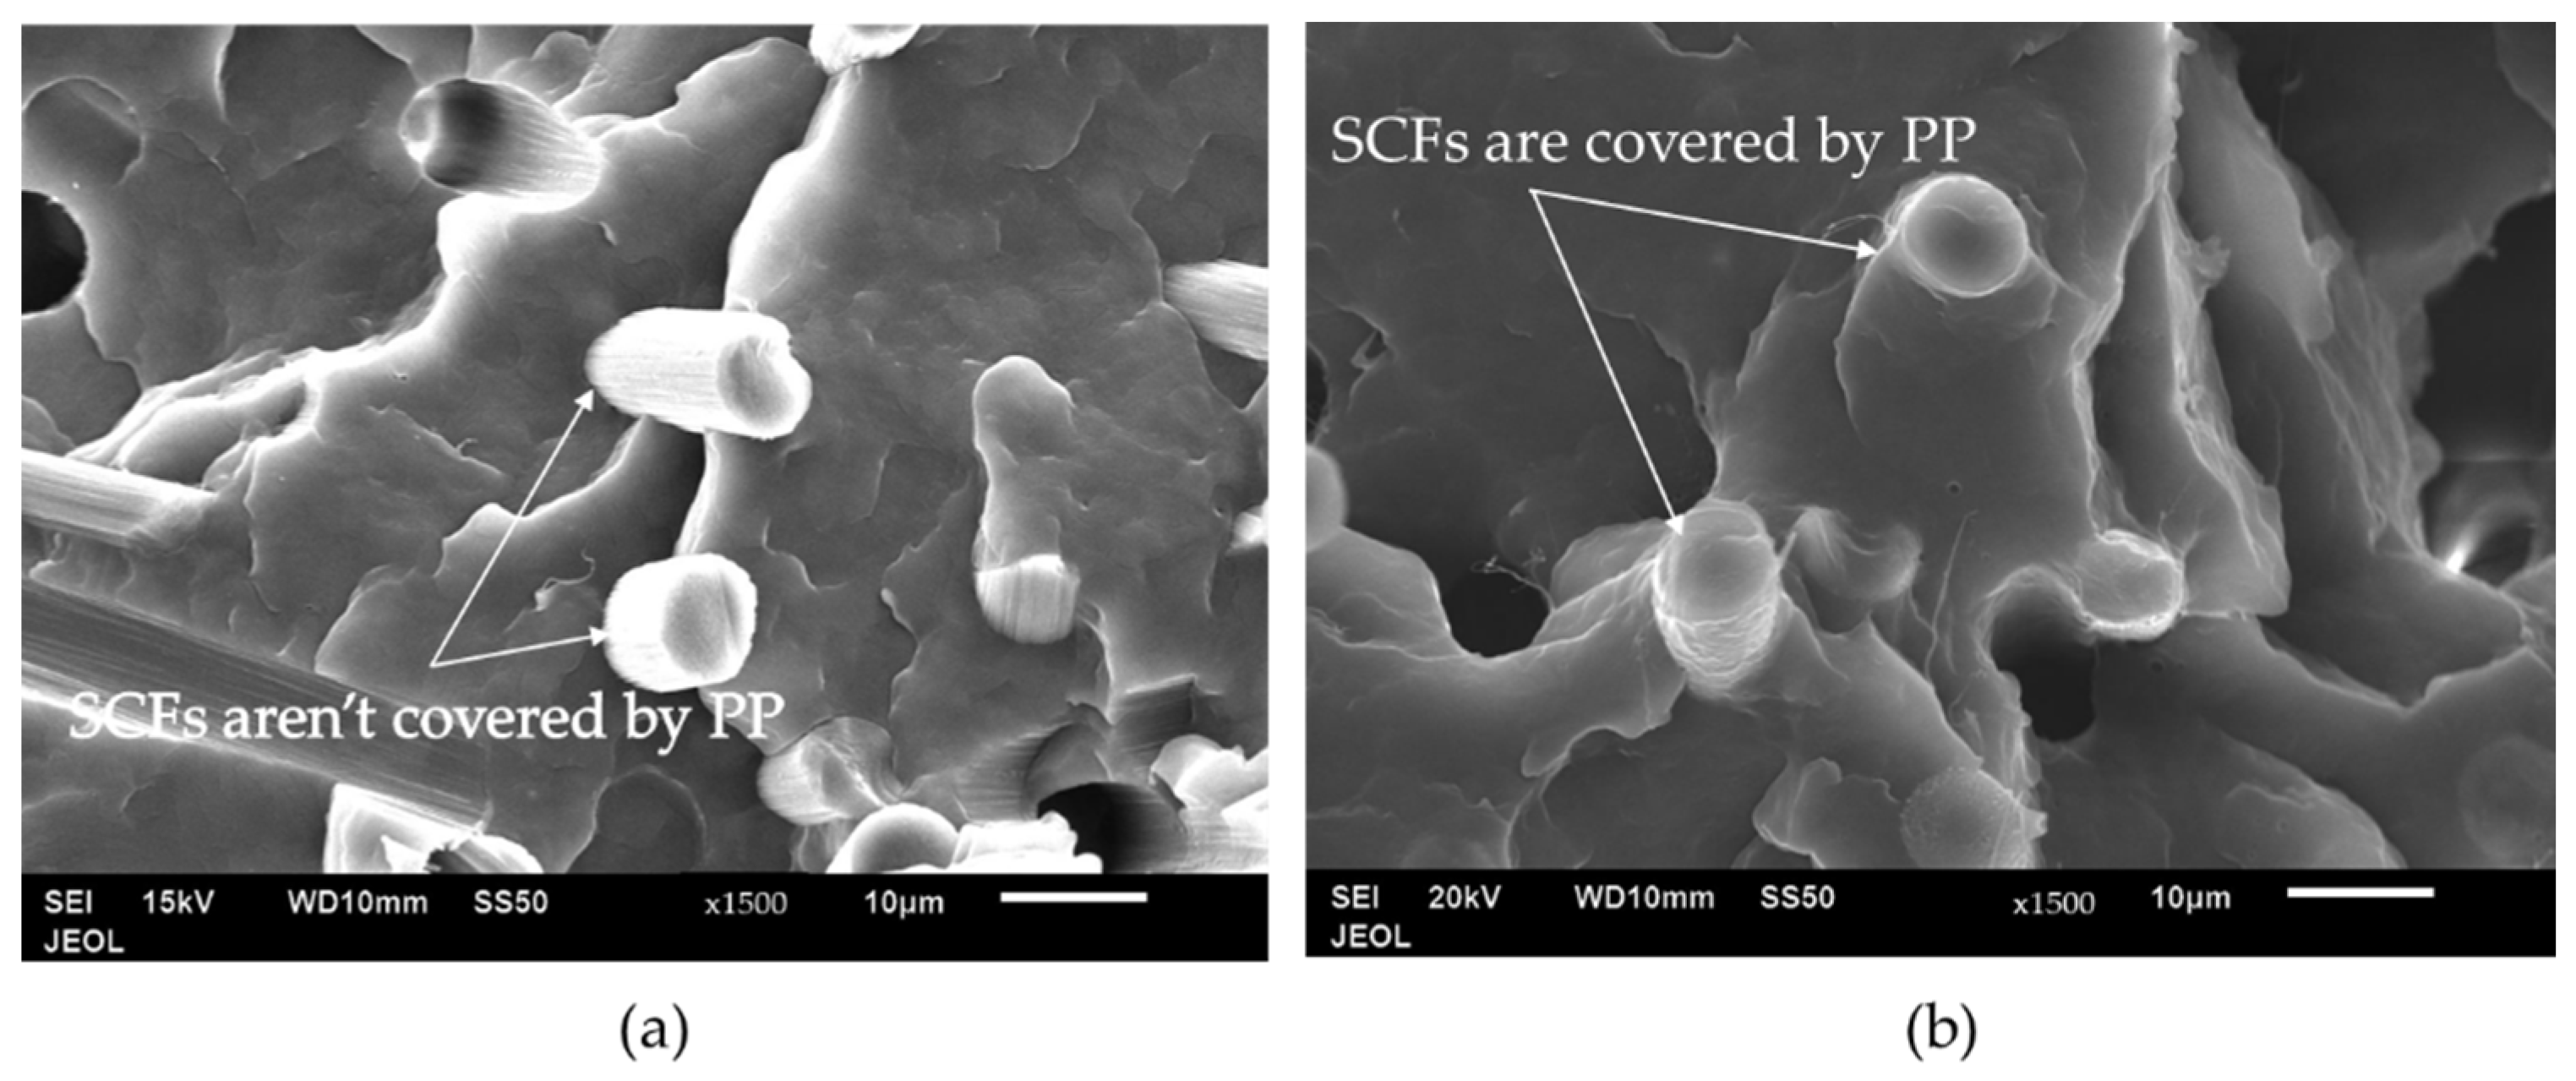
Figure 6 shows the SEM images of PP/20SCF composites with two different types of PP. It shows that PP23 has a better interface compared to PP3. Additionally, in the PP23/20SCF composite, the fibers appear to be covered by the PP matrix. However, the figure for the PP3/20SCF composite shows clean fiber surfaces, implying that the PP is not completely attached to the SCF’s surface. Since PP23 was processed with identical processing conditions as PP3, it can be concluded that the PP with high MFI (PP23) can have better wettability relative to the SCF in comparison to PP with a lower MFI (PP3) [31].
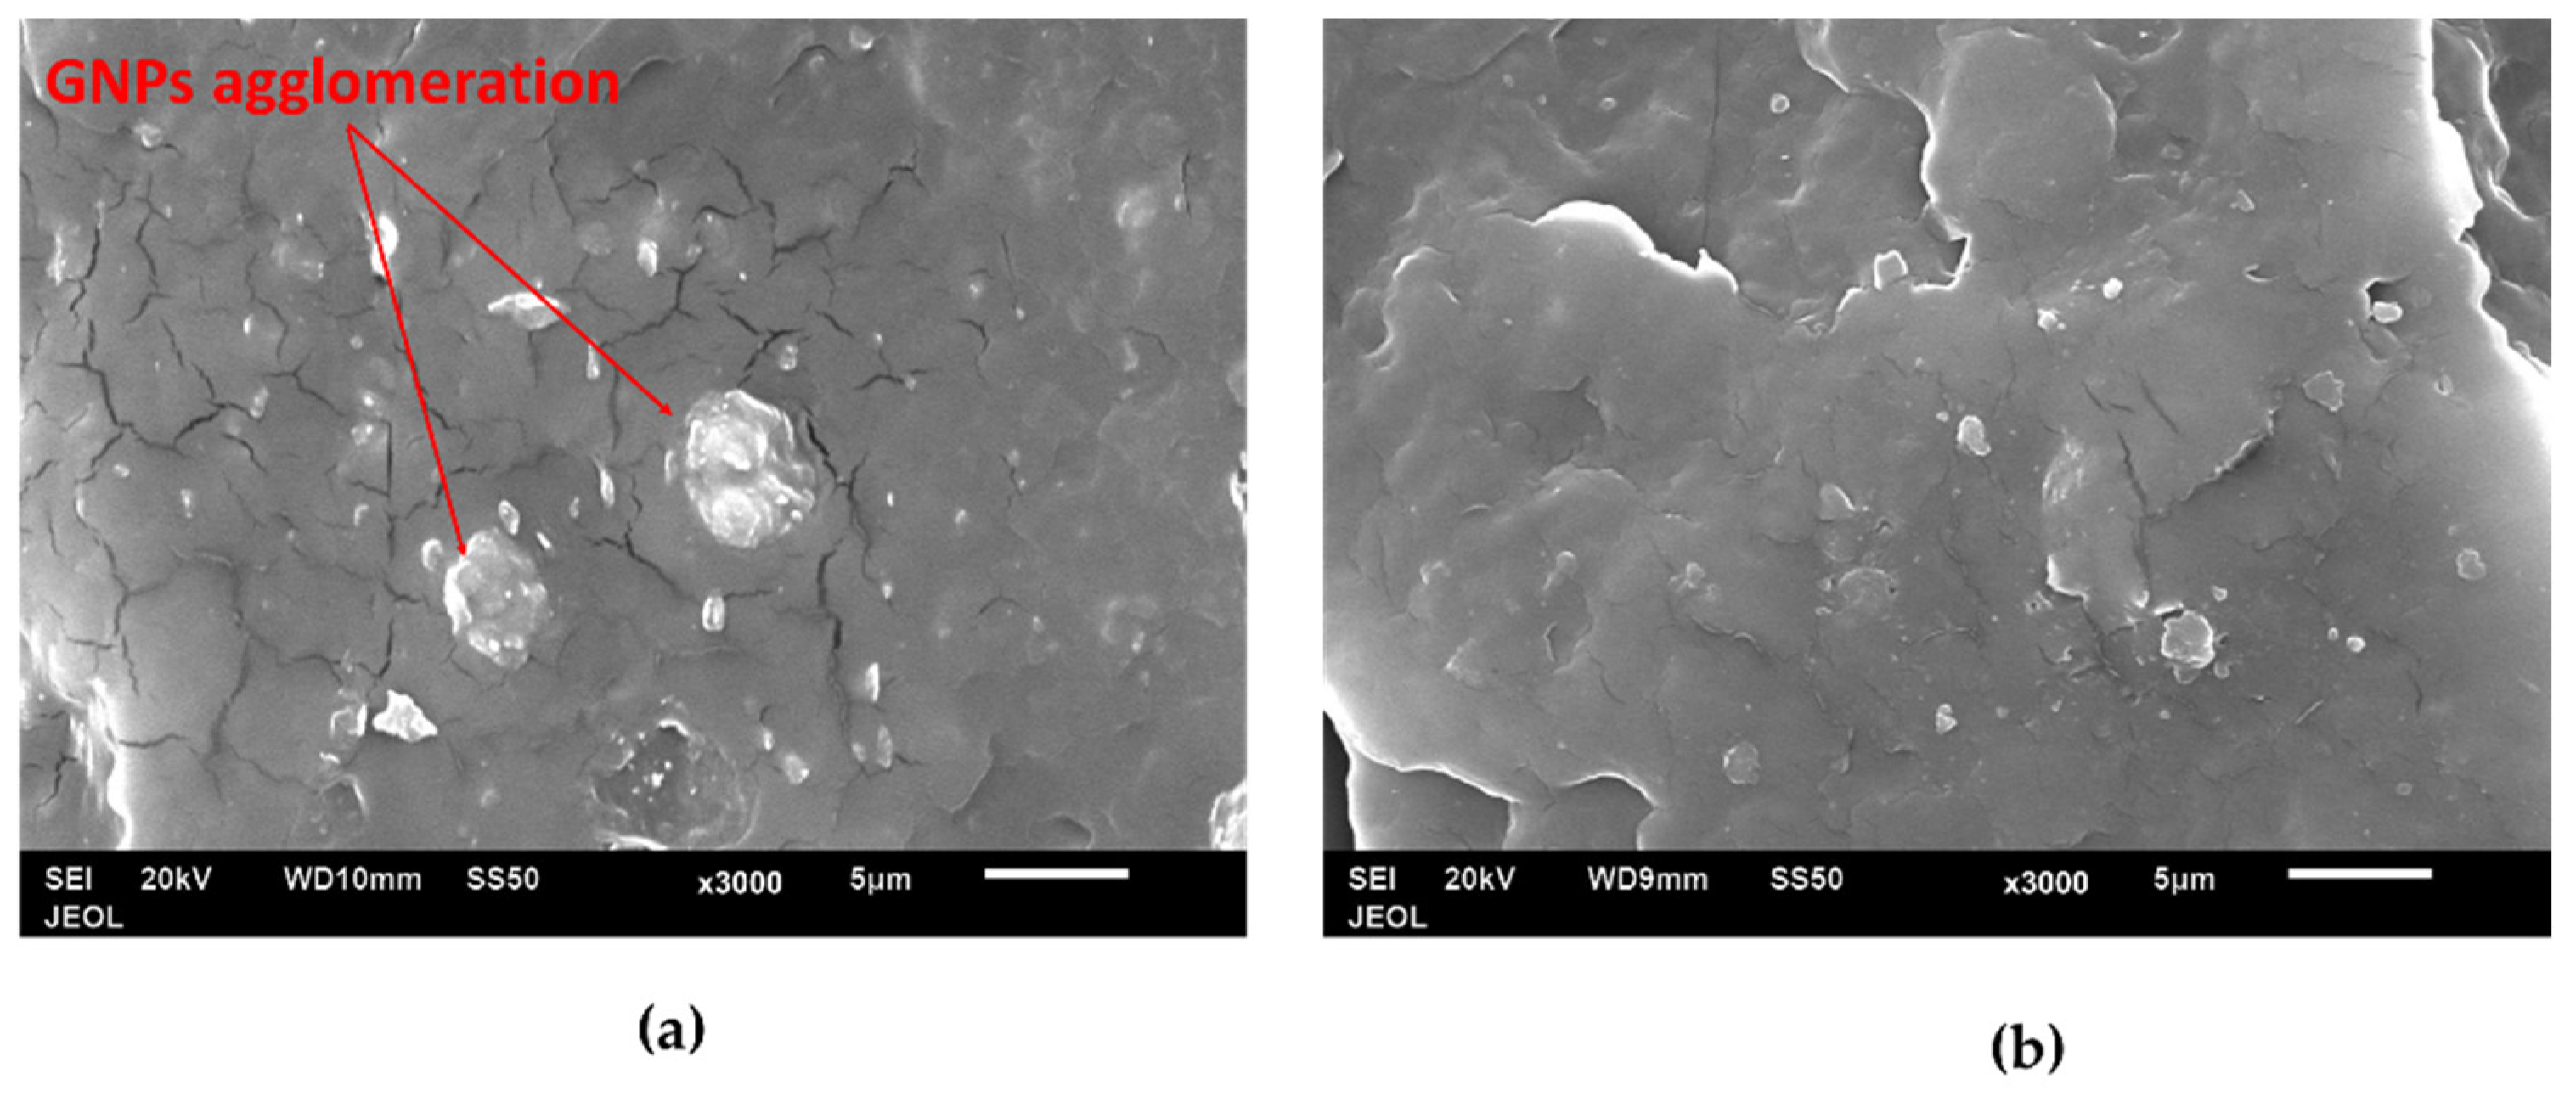
SEM images of PP/GNP composites are shown in Figure 7. These composites were composed of 5 wt. % GNP. It is observed from Figure 7b that the PP23 composite has a better dispersion compared to PP3. The agglomeration of GNP was observed in PP3 composites, as shown in Figure 7a.
Figure 8 reveals the microstructure of the PP/nTiO2 composites. nTiO2 tends to agglomerate in the PP3 composite at 5 wt. % nTiO2 loading (Figure 8a). Meanwhile, in Figure 8b, PP23 shows a better dispersion of nTiO2 when compared to PP3. Thus, it can be inferred that PP with higher MFI performs better in the filler’s dispersion [25].

3.2. Tensile Test

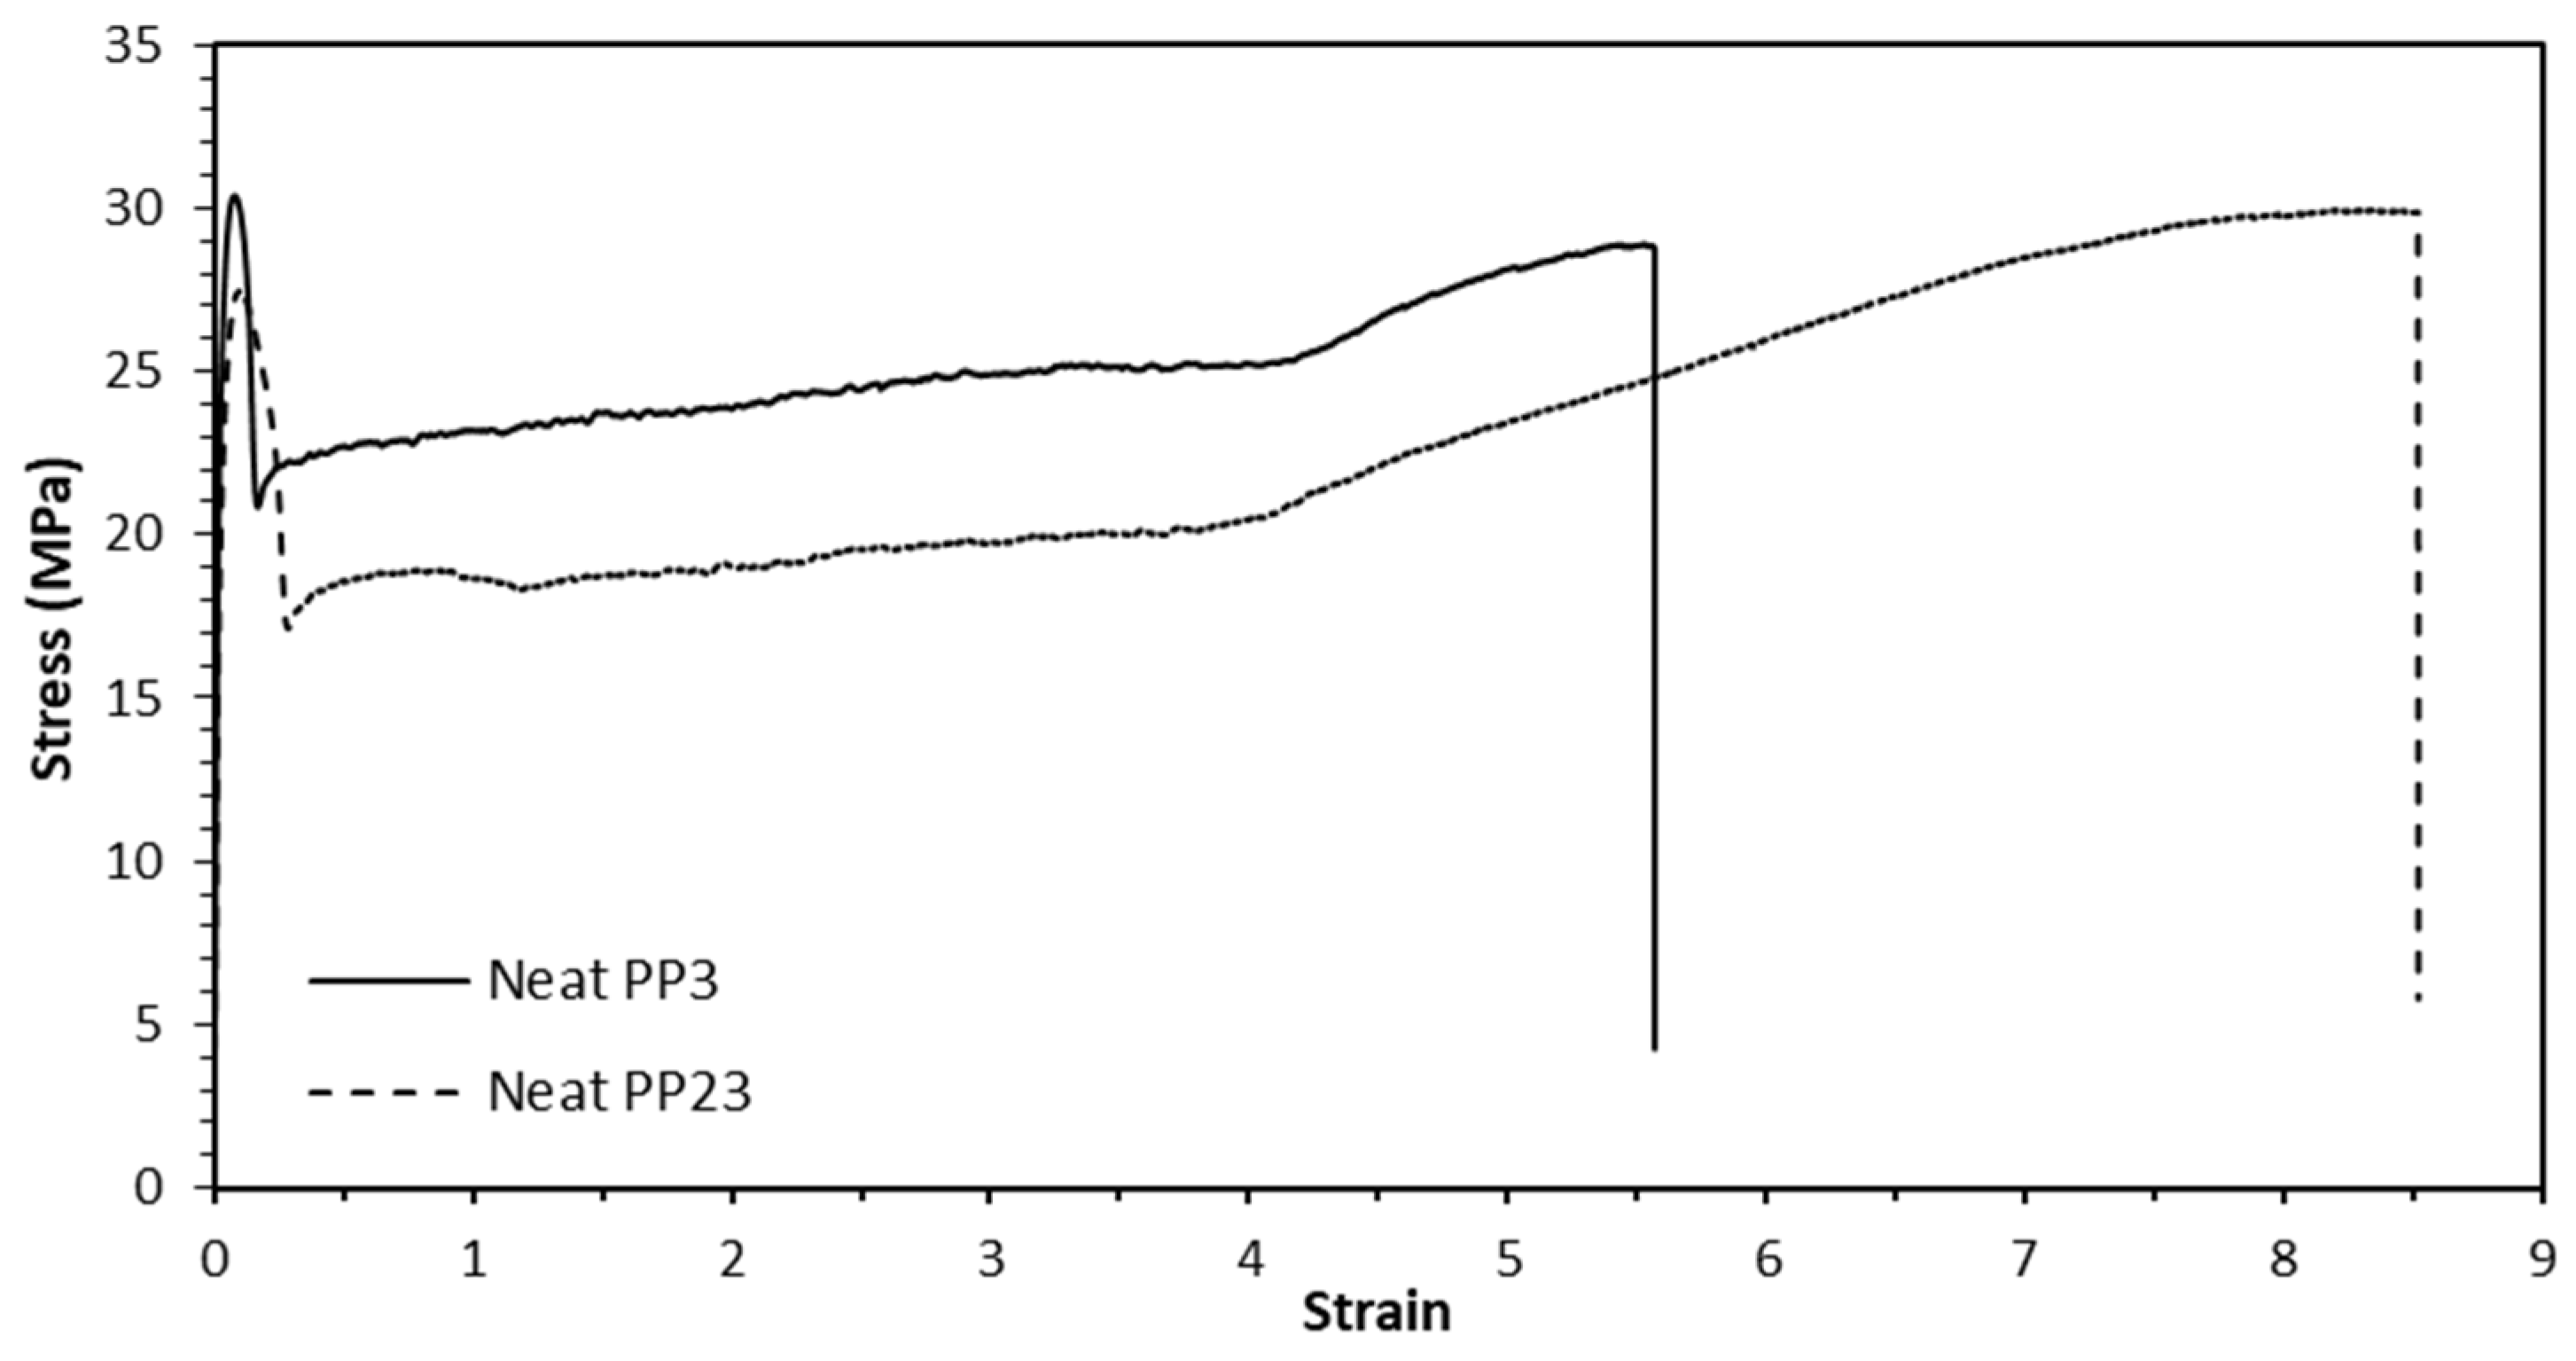
Figure 9 shows the typical stress–strain curves for neat PP3 and PP23. The average mechanical properties from the tensile test of the two different PPs are presented in Table 3. From the figure, it is observed that PP3 has a higher tensile modulus and UTS compared to PP23, but PP23 has a higher strain to break compared to PP3. Even though PP3 has higher UTS than PP23, PP23 has higher stress at fracture.
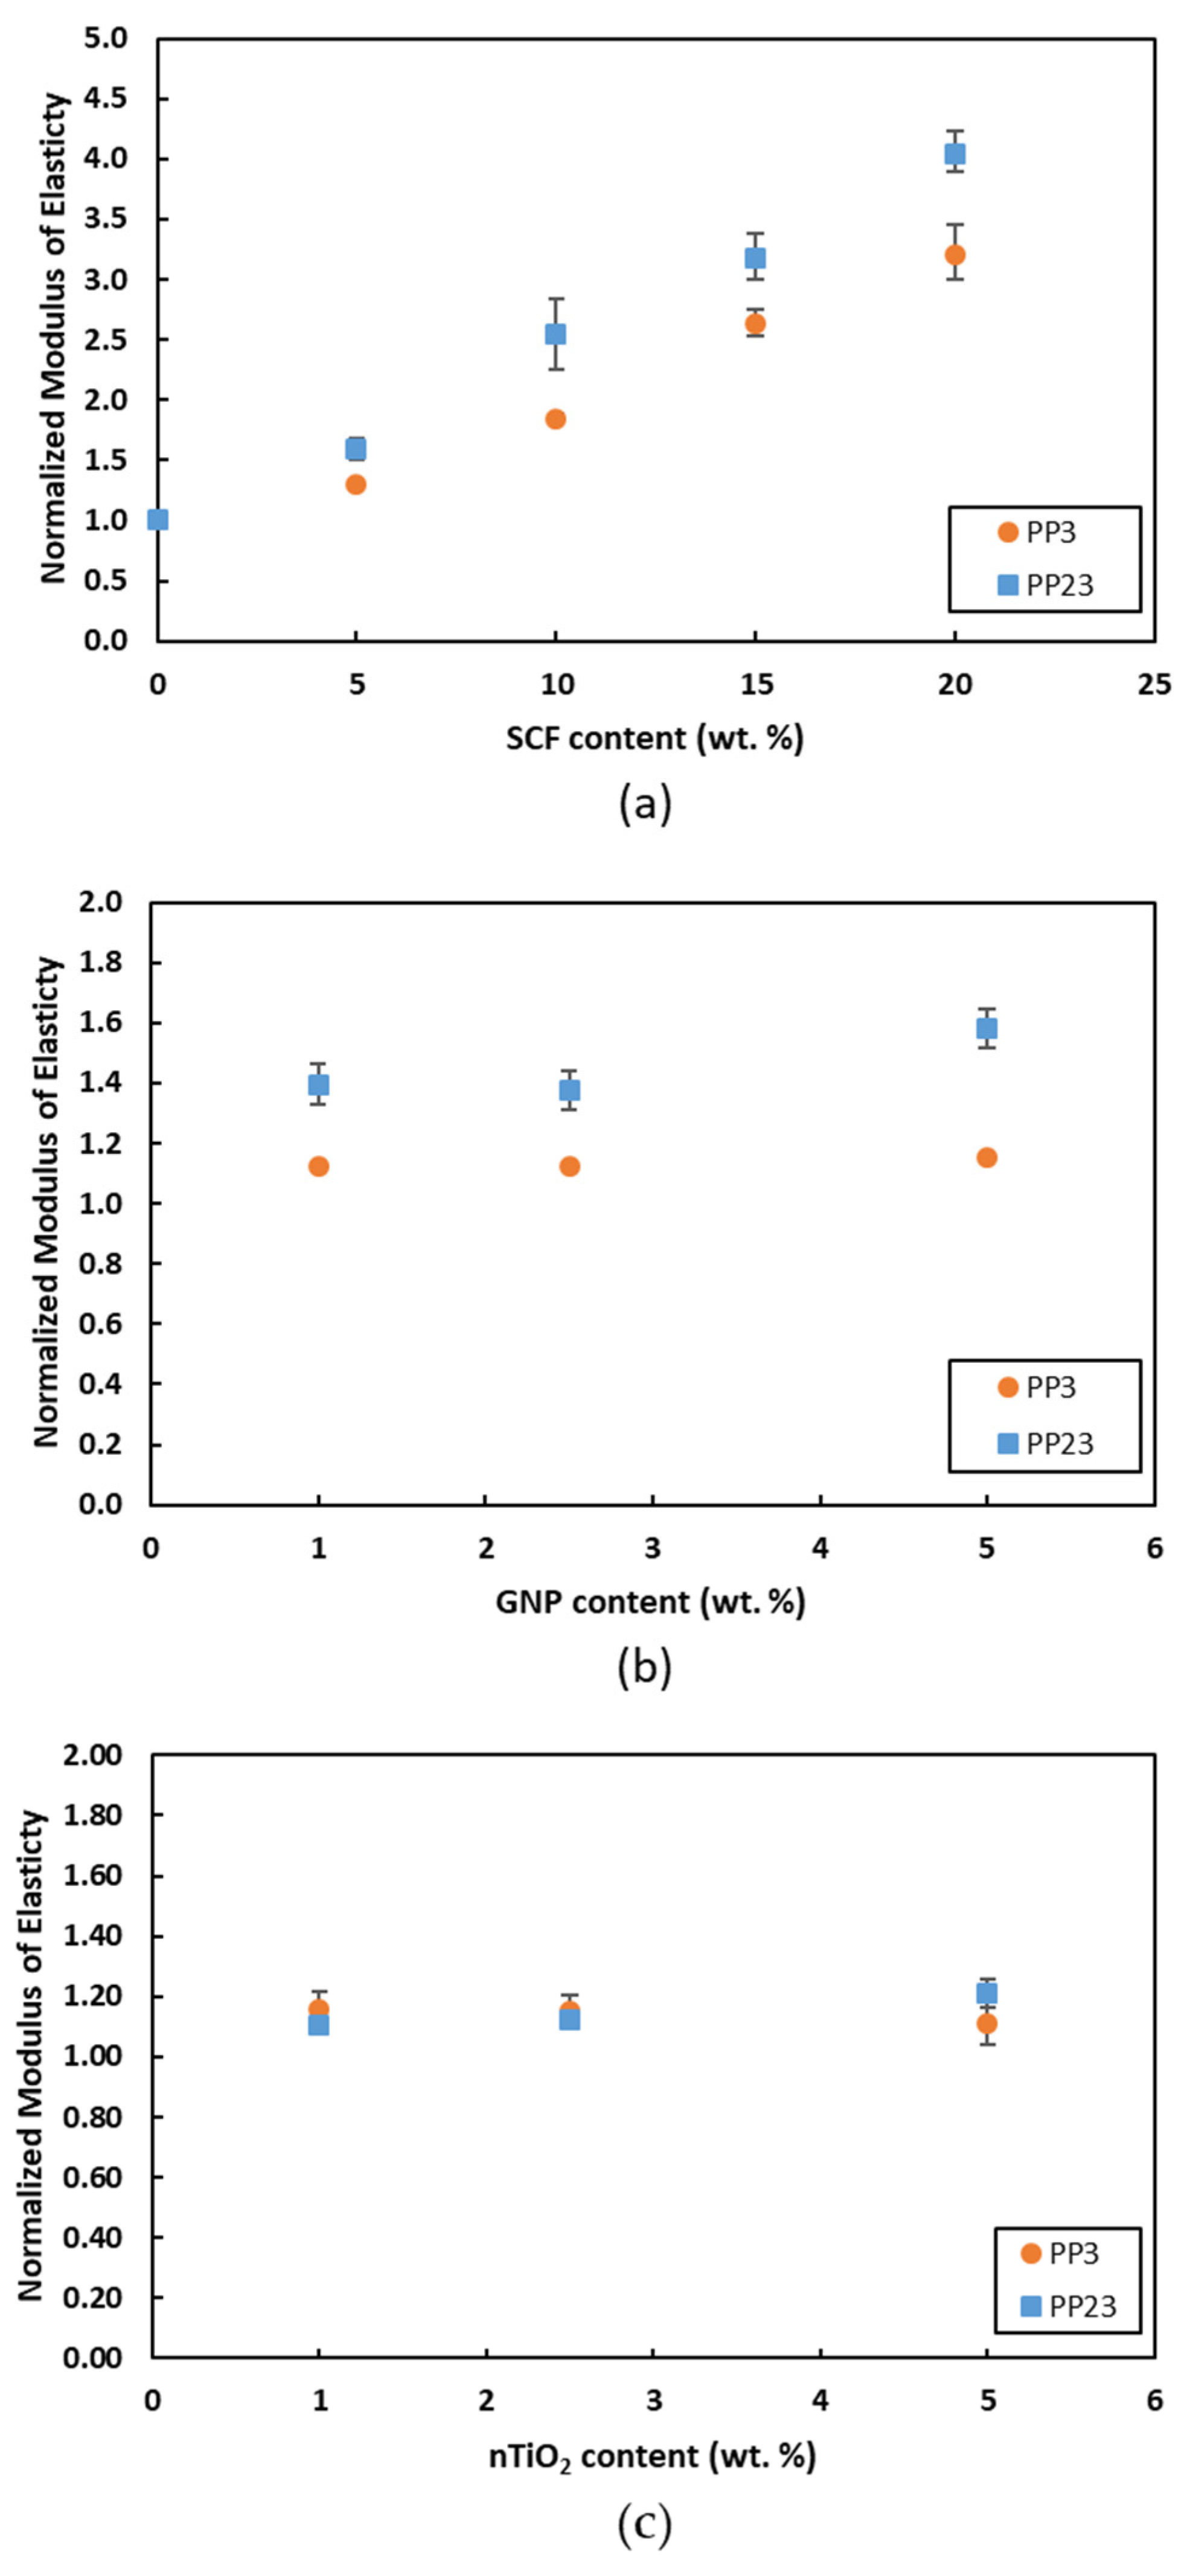
Figure 10 shows the normalized modulus of elasticity of PP composites. Figure 10a shows the normalized modulus of elasticity of PP/SCF composites. It is shown that at 20 wt. % of SCF loading, the tensile modulus of PP23/20SCF increases by 306% compared to 222% increases for the PP3/20SCF. Figure 10b shows the normalized modulus of elasticity of PP23/GNP composites. PP23/GNP composites have a slightly higher increase on the average tensile modulus compared to PP3/GNP, and the differences are more pronounced at 5 wt. % of GNP. Figure 10c shows that the tensile modulus of PP23/nTiO2 composites has a slightly higher increase of up to 21% on average at 5 wt. % loading. However, PP3/nTiO2 exhibited a 16% maximum increase at 1 wt. % loading and then the tensile modulus started to drop. The higher increase in the tensile modulus of PP23/SCF composites signifies that PP23 has better interfacial bonding with the SCF compared to PP3. It is known that interfacial bonding can also be affected by wettability. The difference between PP3 and PP23 is in the melt flow index of the polymer. The polymer with a higher MFI at the same processing temperature has better wettability [31].
Figure 11 shows the UTS of PP composites. Figure 11a presents the UTS of PP/SCF composites. The UTS of PP23/20SCF increases by 55.4%, compared to the PP23/20SCF, which is only 12%. The higher increase in UTS of PP23/SCF is also attributed to the superior interfacial bonding with the SCF compared to PP3. Good interfacial bonding can also be affected by good wettability [32]. Figure 11b shows the UTS of PP/GNP composites. The UTS of PP23/GNP also shows a higher increase compared to PP3. At 5 wt. % of GNP, PP23/5GNP increases by up to 22%. However, the UTS of PP23/5GNP increases by up to 10%. The UTS of PP23/nTiO2 also shows an increase while PP3/nTiO2 shows a decrease. At 5 wt. % of nTiO2, PP23/5nTiO2 increases by almost 6%; meanwhile, the PP3/5nTiO2 decreases by 1.4%, as shown in Figure 11c. This phenomenon could be attributed to the poor dispersion of the filler on the matrix. The agglomeration or aggregation of nanofillers is responsible for the drop of the tensile modulus or/and UTS [33]. PP with a higher MFI could lead to better dispersion of the fillers [25]. A comparison among the three fillers showed that GNP provided better performance in the tensile modulus and UTS for loading up to 5 wt. % for both PPs. A higher specific surface area of the GNP than the other fillers is responsible for this phenomenon.
Figure 12 shows the strain at break comparison of PP/SCF, PP/GNP, and PP/nTiO2 composites of two different PP. From Figure 12a, the PP23/SCF composite’s strain at break drops faster than the PP3/SCF composite. For PP23/SCF composite, the strain at break value drops to 1% strain of the neat PP23 at 10 wt. % SCF loading. Meanwhile, PP3/10SCF still has high ductility, which is 69% of neat PP3 strain. Both PPs show a sudden drop in the strain at break value at different SCF loadings. Higher interfacial bonding between PP and SCF inhibits the movement of the PP chain molecule, which also leads to lower strains at break. The sudden drop of strain at break at certain loadings has been discussed elsewhere [6]. Figure 12b shows the strain at break for PP/GNP composites. The PP23/GNP strain at break drops slightly while PP3/GNP composites show some increases compared to neat PP3. PP23/GNP strain at break increased to 576% from 553% at 5 wt. % GNP loading; meanwhile, PP3/GNP dropped from 845% to 520% at 5 wt. % GNP loading. It can be inferred that PP23 also has better interfacial bonding with GNP compared to PP3. Figure 12c shows the strain at break for PP/nTiO2 composites. It is shown that for the PP3/nTiO2 composite, the strain at break value increases to 638% from 553% at 5 wt. % nTiO2 loading; meanwhile, PP23/nTiO2 dropped from 845% to 781% at 5 wt. % nTiO2 loading. Similarly to the response of the other two fillers, PP23 also has better interfacial bonding with nTiO2 compared to PP3.

3.3. Flexural Test

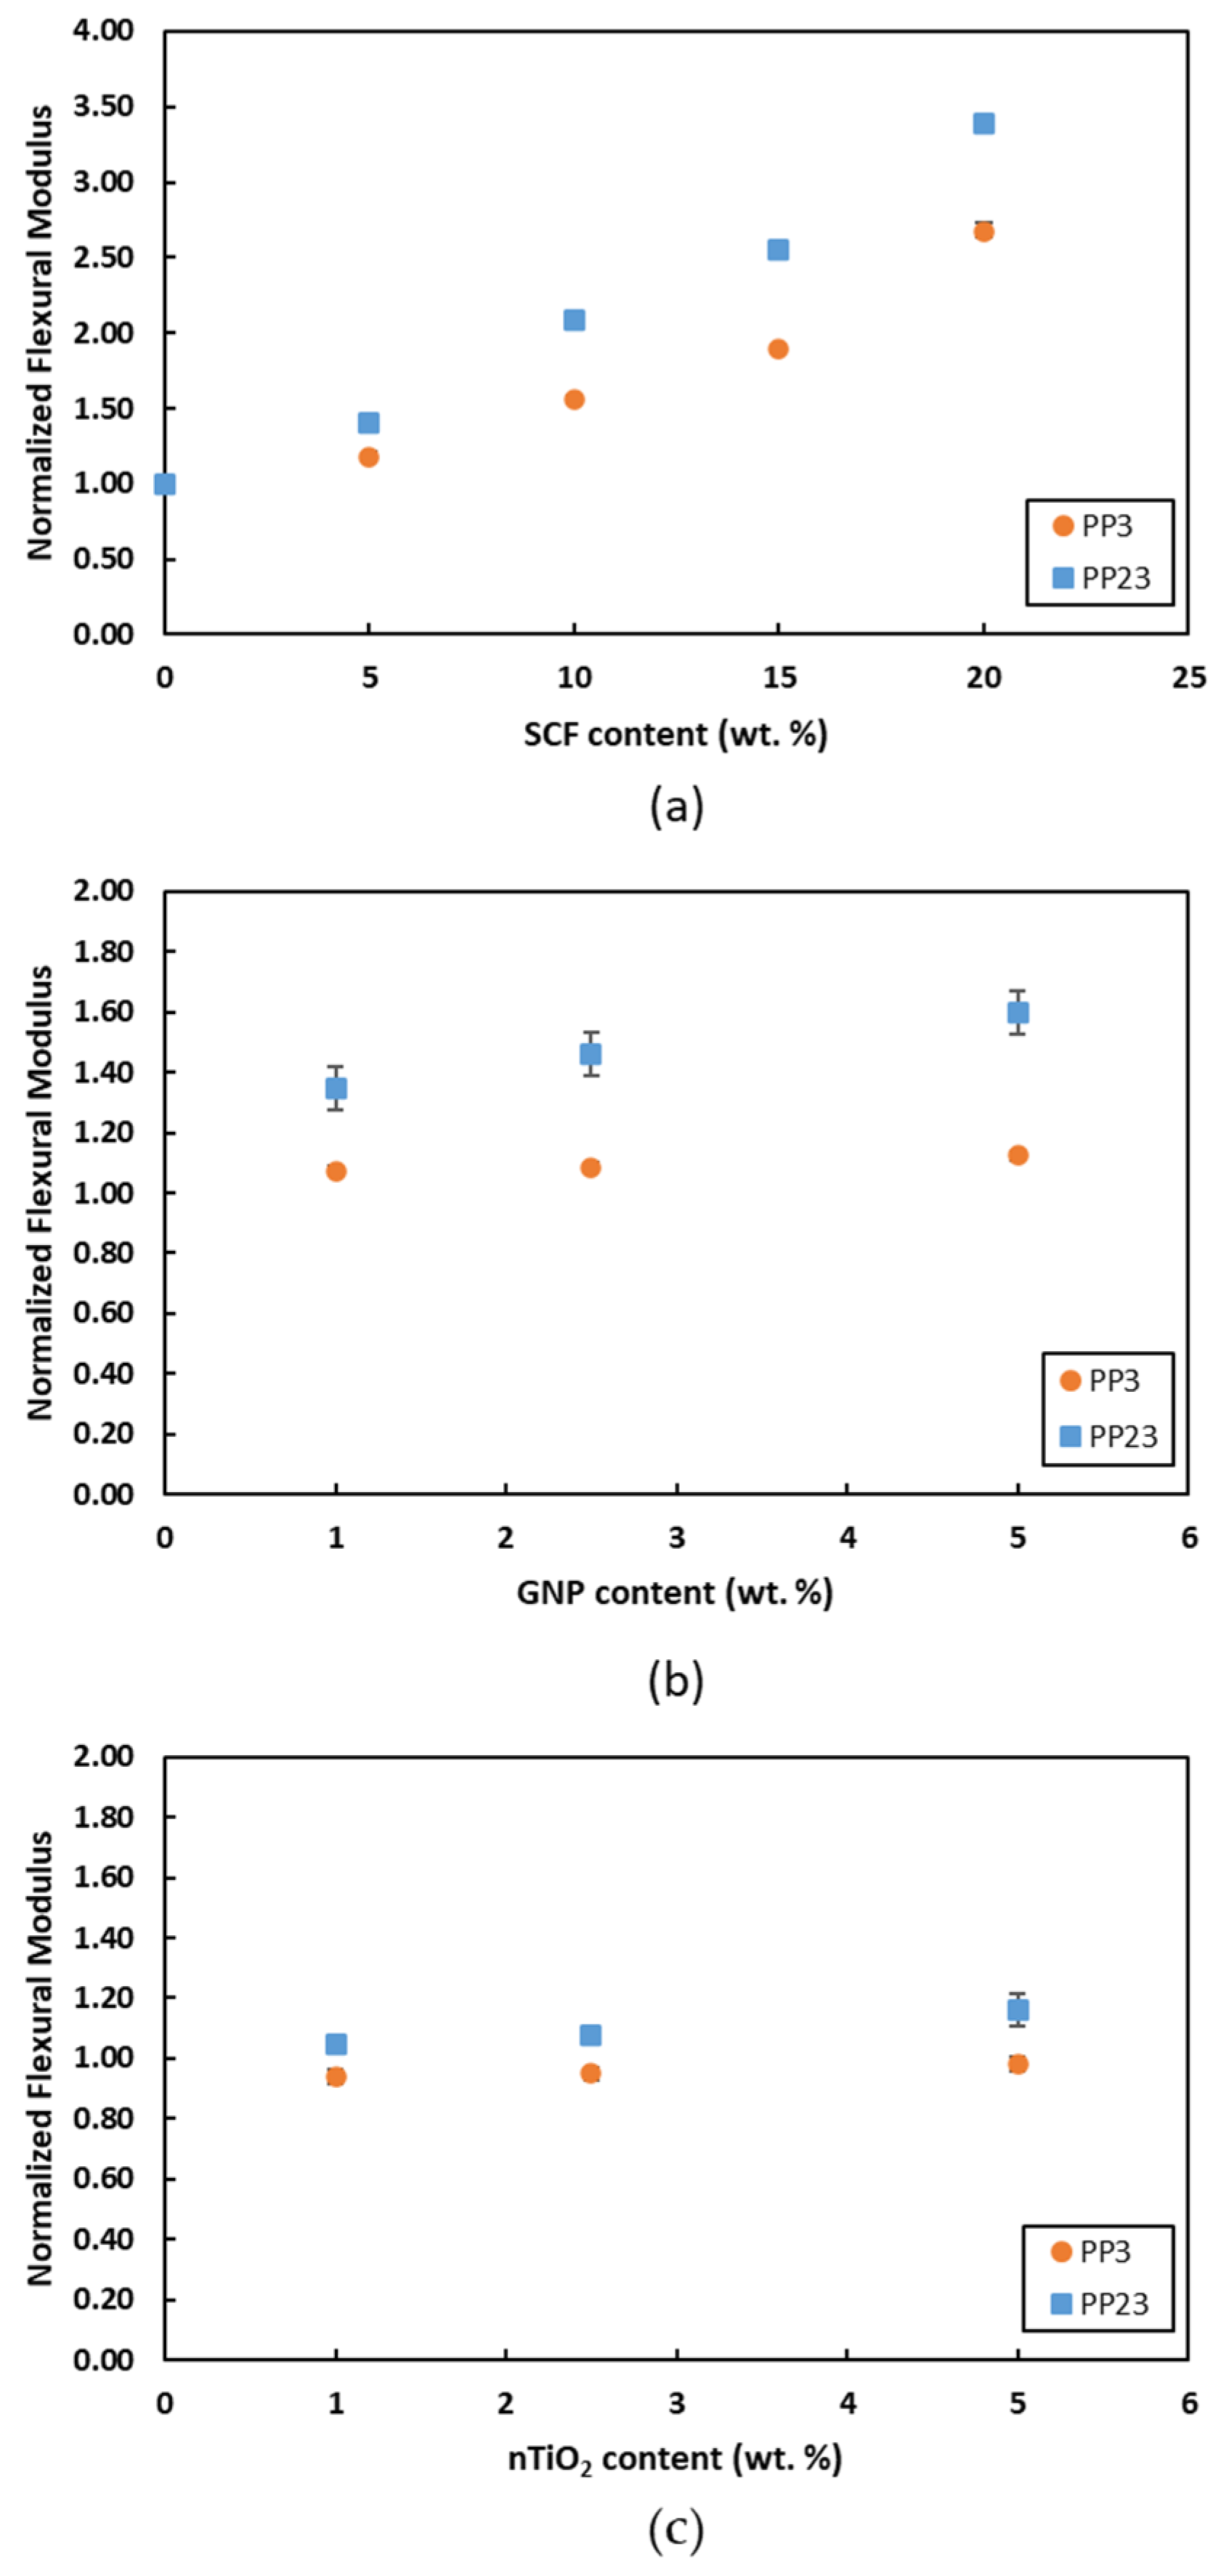
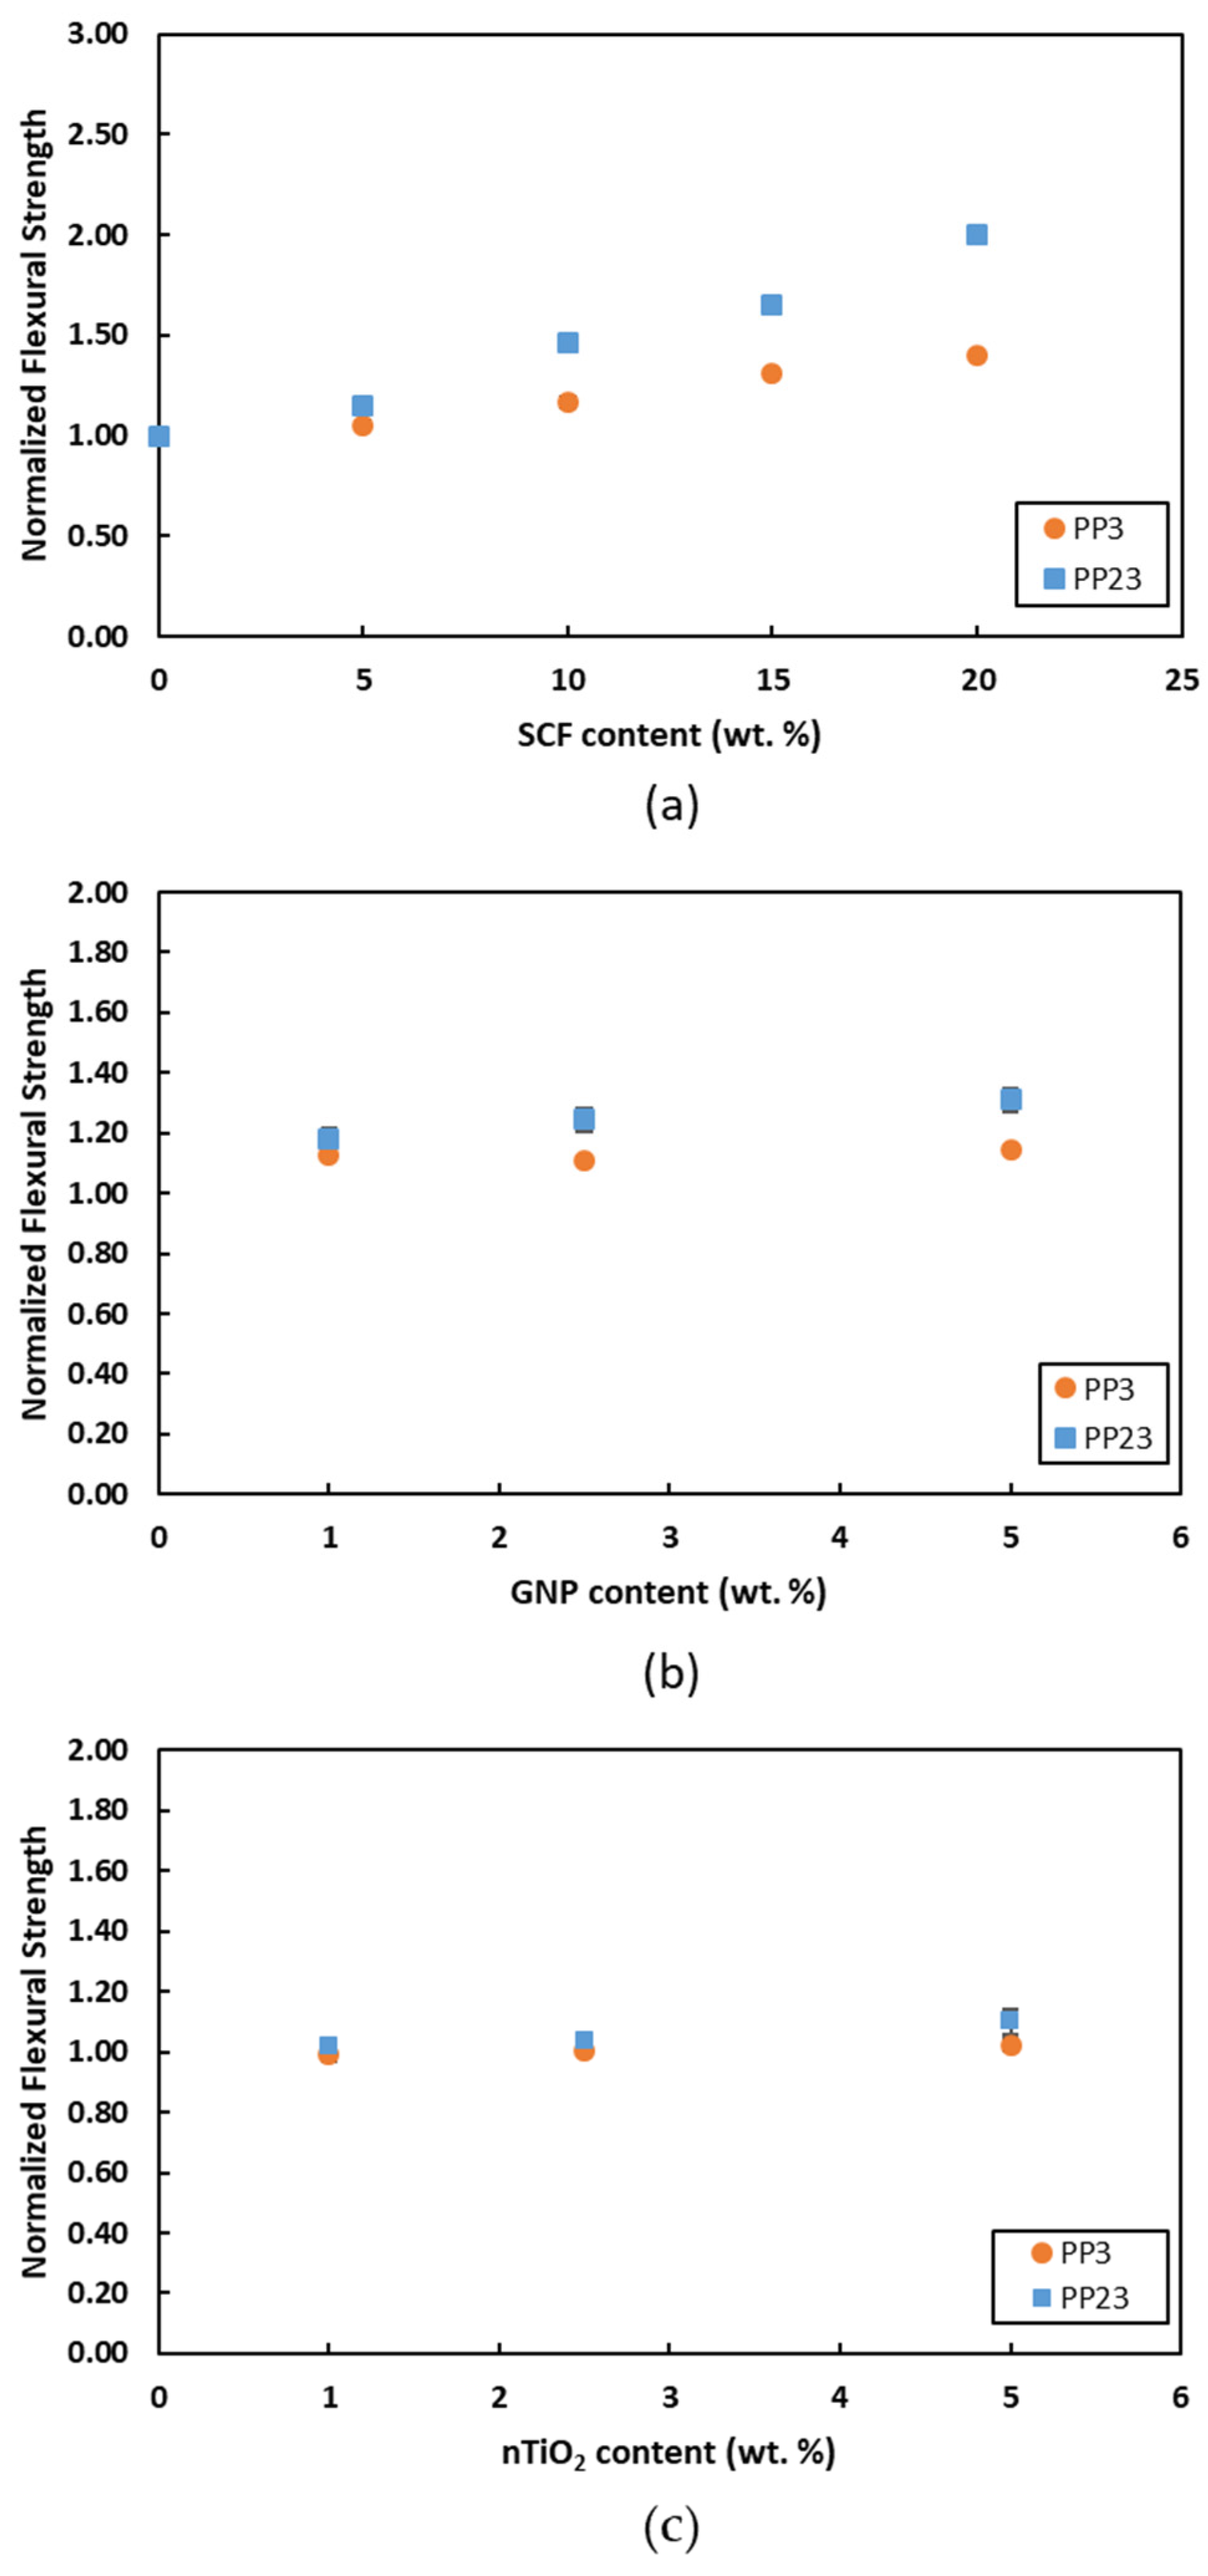
Figure 13 and Figure 14 show the comparison of flexural modulus and flexural strength, respectively. In general, an improvement in the flexural modulus and flexural strength can be observed for both PPs with the increase in filler loading. However, PP23 composites exhibit higher improvements in properties when compared to PP3 composites. Figure 13a and Figure 14a show that PP23/SCF composites exhibit higher increases in the flexural modulus value and flexural strength value compared to PP3/SCF composites. The maximum increase in the flexural modulus and flexural strength of the PP23/20SCF composite was 240% and 100%, respectively, compared to an increase of 170% and 40%, respectively, for the PP3/20SCF composite. The better interfacial bonding between PP23 and SCF is a major factor responsible for such behaviors. Figure 13b and Figure 14b show the flexural modulus and flexural strength of PP/GNP composites. The figures show that PP23/GNP composites exhibit a higher improvement in the flexural modulus value and flexural strength value when compared to PP3/GNP composites. Figure 13c and Figure 14c show the flexural modulus and flexural strength of PP/nTiO2 composites. From the figures, it is observed that PP23/nTiO2 composites exhibit a higher improvement in flexural modulus and flexural strength compared to PP3/nTiO2 composites. Kim et al. [34] also reported similar results for PP/Cotton composite. The tensile and flexural strength of PP/Cotton composite with a higher MFI exhibited higher improvements compared to the lower MFI due to the better wettability. From the observation, it can be inferred that other than wettability, PP23 has a better ability to disperse nanofillers, as mentioned in the previous section. A comparison of the three fillers showed that GNP provided better performance in the flexural modulus and strength for loading up to 5 wt. % for both PPs.

3.4. Impact Test

Figure 15 compares the normalized notch Izod impact toughness for PP3 and PP23 composites with different fillers. The impact toughness of PP23/SCF composites shows an increase by the increase in the wt. % loading of SCF, as shown in Figure 15a. Meanwhile, PP3/SCF composites show an increase at 5 wt. % loading but then dropped again and almost stayed steady by the increase in wt. % of SCF. This steady impact toughness of PP3/SCF composites could be attributed to crack deflection, low interfacial bonding, and fibers’ orientation to the fracture surface. Due to the presence of SCF in the composite, the crack deflection would increase the impact toughness value of the composite. On the other side, low interfacial bonding between SCF and PP and SCF oriented to align to the fracture’s surface may affect the toughness values in the composite. For PP23, the synergy between good interfacial bonding and crack deflection increased the notch impact’s toughness values. The notched impact toughness value increased with the increase in wt. % of SCF loading. In addition, fiber fracture and pull-out during the sample fracture are also responsible for improving impact toughness [35].
Figure 15b compares the normalized notch Izod impact toughness for PP3/GNP and PP23/GNP composites. Up to 5 wt. % loading of GNP, the PP23/GNP shows a maximum increase at 1 wt. % loading and then starts to drop as the GNP loading increases. However, the impact toughness value was still higher when compared to the impact toughness value of the neat PP. It shows that PP23 has a better interfacial bonding with GNP than PP3. An improvement in the impact toughness values is attributed to the bridging effect of GNP [8]. Meanwhile, the drop in the impact toughness of PP3/GNP by the further increase in GNP is due to the increase in the agglomeration of GNPs and GNP aligned to the fracture surface [36].
Figure 15c compares the normalized notch Izod impact toughness for PP23/nTiO2 and PP23/nTiO2 composites. Both composites, PP3/nTiO2 and PP23/nTiO2, show an improvement in impact toughness by the increase in wt. % of nTiO2 up to 5 wt. % loadings. The presence of the spherical shape of filler may produce crack blunting during crack propagation, which is responsible for the improvement of the impact toughness [12,37].

3.5. Hardness Test

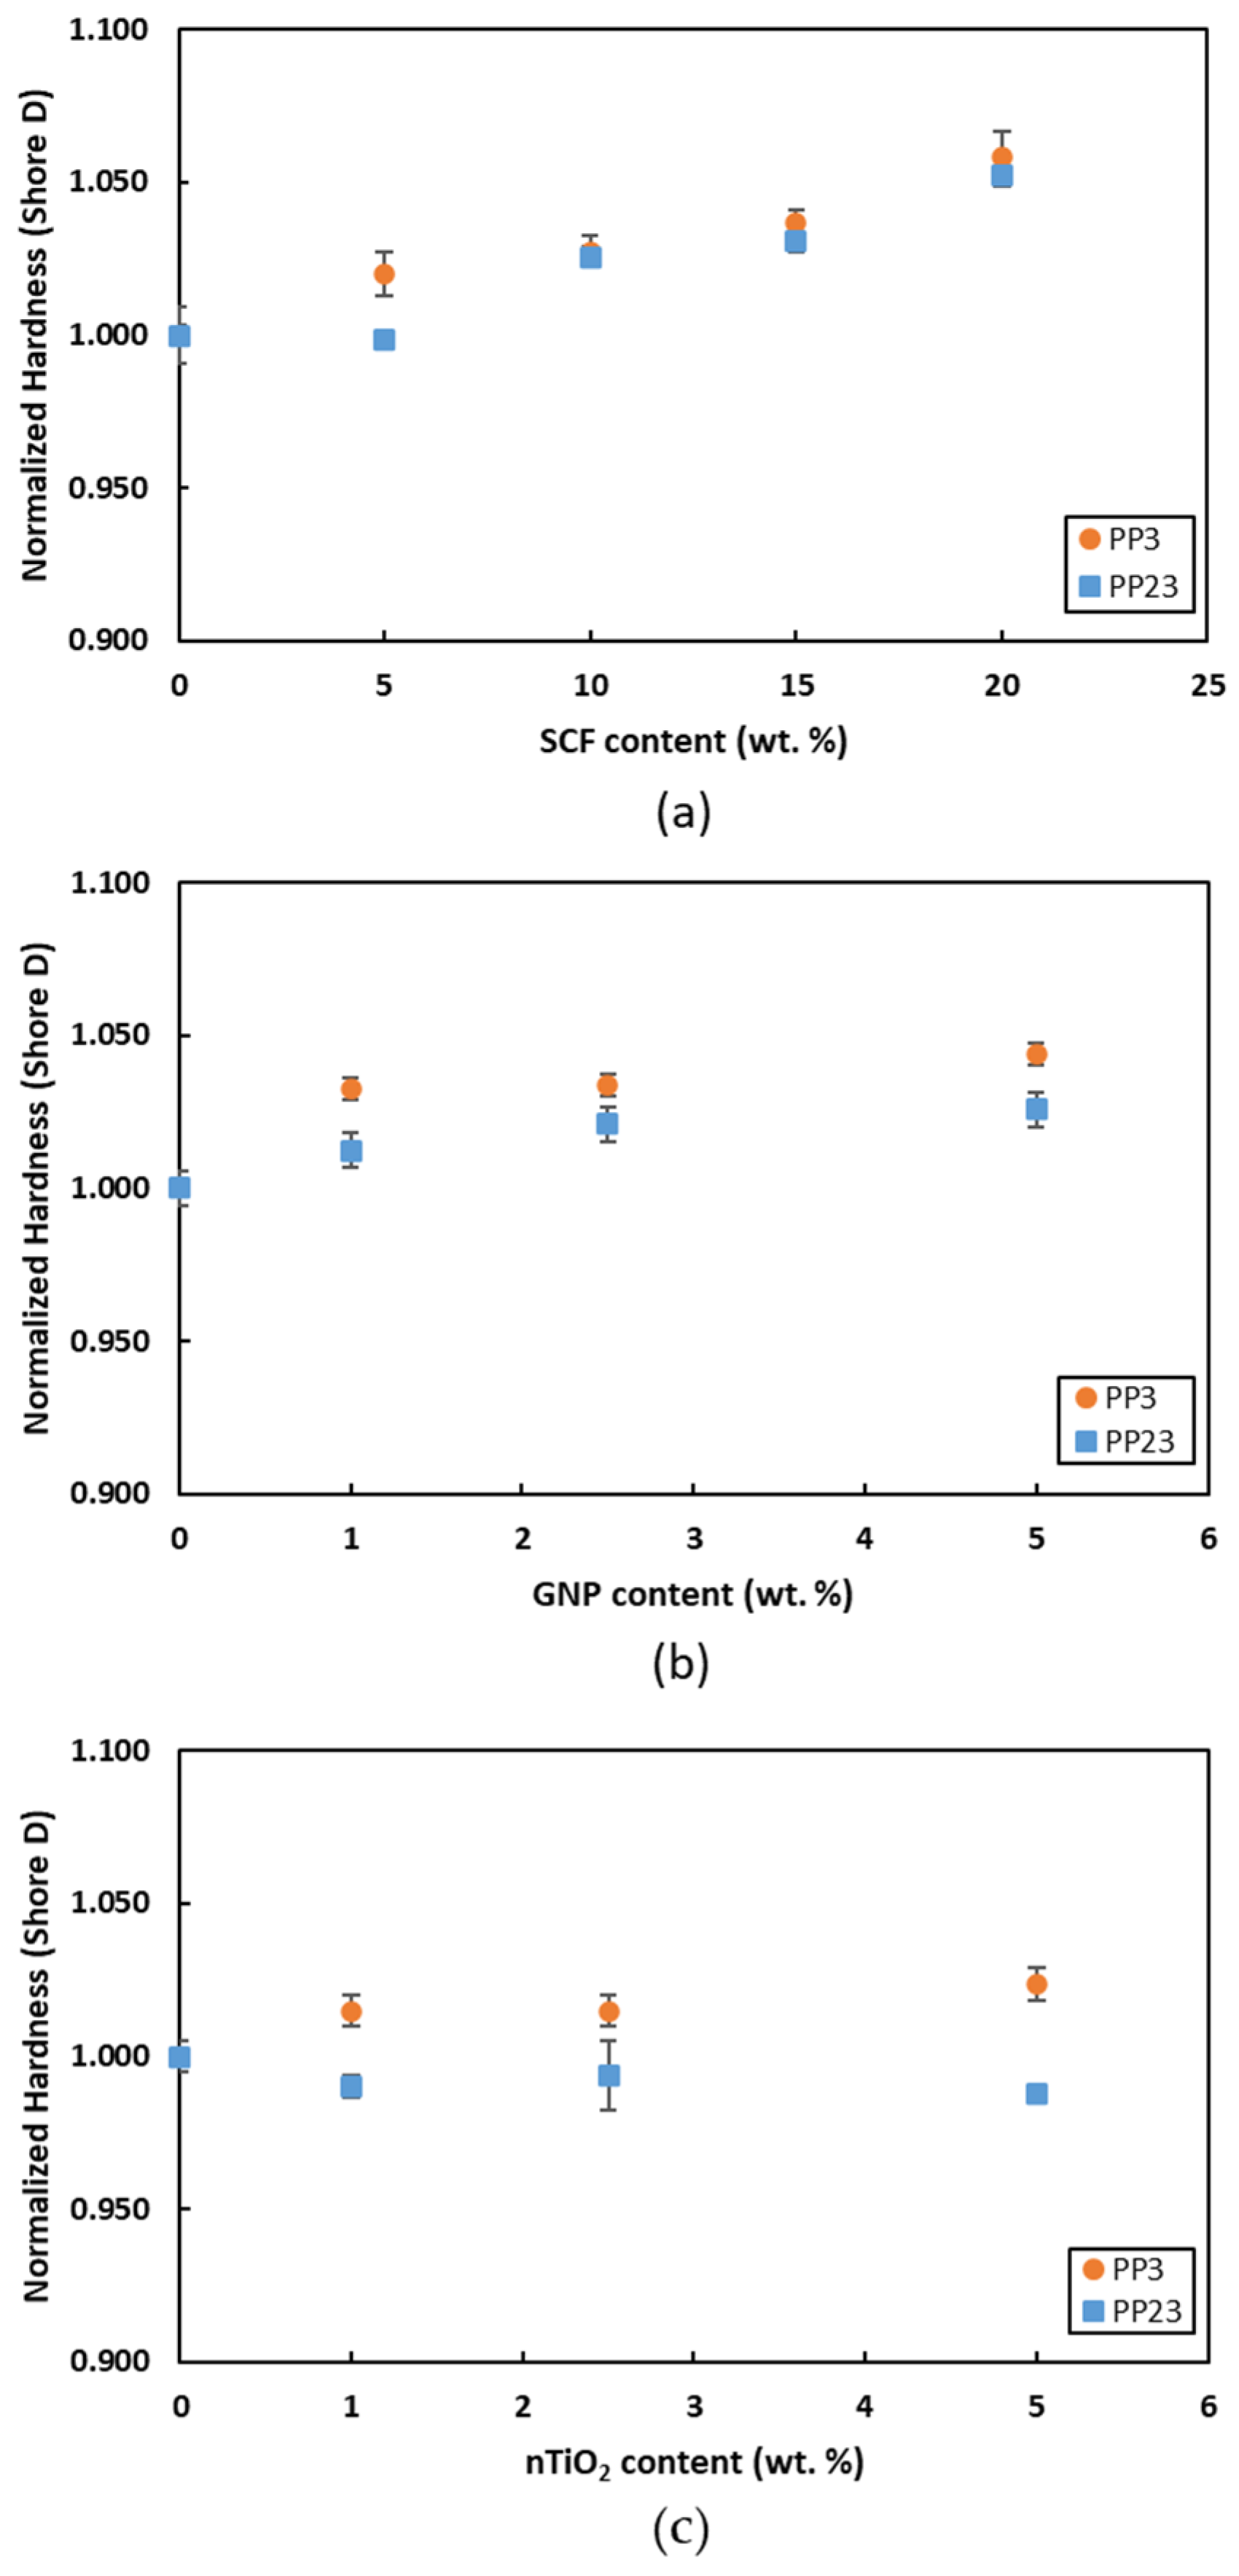
Figure 16 shows the variation in the normalized hardness values of the composites with the varying percentages of the filler materials. For all composites studied in this work, in general, PP3 composites exhibit slightly higher hardness compared to PP23 composites. The presence of fillers hinders the movement of the polymer’s molecular chains. The PP3, which has a higher molecular weight (lower MFI), compared to PP23 (higher MFI) can gain a higher increase in hardness with the addition of the filler. The increase in hardness is more evident with the addition of nanofillers. For 5 wt. % loading, GNP gained a higher hardness increase, followed by nTiO2 and SCF. The nanofillers have a higher specific surface area compared to SCF.

4. Conclusions

The effect of polypropylenes and fillers types on the mechanical properties of PP-based composites was studied. PP with MFI 23 (PP23)-based composites exhibited a higher tensile modulus, UTS, flexural modulus, flexural strength, and notch impact toughness compared to the PP with MFI 3 (PP3)-based composite. Meanwhile, the hardness of PP3 composites exhibits a slightly higher increase compared to PP23. The microstructures reveal that the PP23 could provide better interfacial bonding and dispersion to the fillers. The composite with the GNP filler exhibits higher enhancements on mechanical properties compared to SCF and nTiO2 with up to 5 wt. % loading.

Author Contributions

Conceptualization, H.J., A.A., and M.B.; methodology, H.J. and A.A.; validation, A.A., M.B., and E.A.; formal analysis, H.J.; investigation, H.J.; resources, A.A. and A.D.; data curation, H.J.; writing—original draft preparation, H.J.; writing—review and editing, M.B., A.A., and E.A.; supervision, A.A, M.B., A.D., and E.A.; project administration, H.J.; funding acquisition, H.J. All authors have read and agreed to the published version of the manuscript.

Funding

The APC was funded by Prince Sultan University.

Institutional Review Board Statement

Not applicable.

Informed Consent Statement

Not applicable.

Data Availability Statement

The data presented in this study are available upon request from the corresponding author.

Acknowledgments

The authors would like to thank to Prince Sultan University for their support.

Conflicts of Interest

The authors declare no conflict of interest.

References

  1. Composites Market Size, Share & Trends Analysis Report by Product (Carbon, Glass), by Resin (Thermosetting, Thermoplastics), by Manufacturing Process, by End Use, and Segment Forecasts, 2020–2027; Grand View Research, Inc.: San Francisco, CA, USA, 2020; p. 142.
  2. Polypropylene Compounds Market Size, Share & Trends Analysis Report By Product (Mineral Filled, Compounded TPO, Compounded TPV, Glass Reinforced), By End Use, And Segment Forecasts, 2019–2025; Grand View Research, Inc.: San Francisco, CA, USA, 2019; p. 120.
  3. Xanthos, M. Functional Fillers for Plastics, 2nd ed.; Wiley-VCH: Hoboken, NJ, USA, 2010. [Google Scholar]
  4. Seymour, R.B. The Role of Fillers and Reinforcements in Plastics Technology. Polym. -Plast. Technol. Eng. 1976, 7, 49–79. [Google Scholar] [CrossRef]
  5. Rezaei, F.; Yunus, R.; Ibrahim, N.; Mahdi, E. Effect of fiber loading and fiber length on mechanical and thermal properties of short carbon fiber reinforced polypropylene composite. Malays. J. Anal. Sci. 2007, 11, 181–188. [Google Scholar]
  6. Junaedi, H.; Albahkali, E.; Baig, M.; Dawood, A.; Almajid, A. Ductile to Brittle Transition of Short Carbon Fiber-Reinforced Polypropylene Composites. Adv. Polym. Technol. 2020, 2020, 6714097. [Google Scholar] [CrossRef]
  7. Ghanbari, A.; Jalali, A.; Nofar, M.; Mamun, A.; Arjmand, M. Extrinsic toughening of recycled carbon fibers in polypropylene composites in the absence of plasticity penalty. J. Compos. Mater. 2022, 56, 941–950. [Google Scholar] [CrossRef]
  8. Kalaitzidou, K.; Fukushima, H.; Drzal, L.T. Mechanical properties and morphological characterization of exfoliated graphite–Polypropylene nanocomposites. Compos. Part A Appl. Sci. Manuf. 2007, 38, 1675–1682. [Google Scholar] [CrossRef]
  9. Al-Saleh, M.A.; Yussuf, A.A.; Al-Enezi, S.; Kazemi, R.; Wahit, M.U.; Al-Shammari, T.; Al-Banna, A. Polypropylene/Graphene Nanocomposites: Effects of GNP Loading and Compatibilizers on the Mechanical and Thermal Properties. Materials 2019, 12, 3924. [Google Scholar] [CrossRef] [Green Version]
  10. Ajorloo, M.; Fasihi, M.; Khoramishad, H. The role of nanofiller size and polymer chain configuration on the properties of polypropylene/graphite nanoplates composites. J. Taiwan Inst. Chem. Eng. 2020, 108, 82–91. [Google Scholar] [CrossRef]
  11. Lai, M.-F.; Huang, C.-H.; Lin, J.-H.; Chuang, Y.-C.; Wang, C.-H.; Lou, C.-W. Polypropylene/Carbon Fiber Composite Layered Materials: Electromagnetic Interference Shielding Effect and Mechanical Performance. Fibers Polym. 2021, 22, 2552–2562. [Google Scholar] [CrossRef]
  12. Zhang, H.; Zhang, Z.; Park, H.-W.; Zhu, X. Influence of surface-modified TiO2 nanoparticles on fracture behavior of injection molded polypropylene. Front. Mater. Sci. China 2008, 2, 9–15. [Google Scholar] [CrossRef]
  13. Aydemir, D.; Uzun, G.; Gumuş, H.; Yildiz, S.; Gumuş, S.; Bardak, T.; Gunduz, G. Nanocomposites of Polypropylene/Nano Titanium Dioxide: Effect of Loading Rates of Nano Titanium Dioxide. Mater. Sci. 2016, 22, 364–369. [Google Scholar] [CrossRef] [Green Version]
  14. Vidakis, N.; Petousis, M.; Velidakis, E.; Tzounis, L.; Mountakis, N.; Kechagias, J.; Grammatikos, S. Optimization of the Filler Concentration on Fused Filament Fabrication 3D Printed Polypropylene with Titanium Dioxide Nanocomposites. Materials 2021, 14, 3076. [Google Scholar] [CrossRef]
  15. Bendaoued, A.; Messaoud, M.; Harzallah, O.; Bistac, S.; Salhi, R. Nano-TiO2 effect on thermal, rheological and structural properties of thermoplastic polypropylene nanocomposites. J. Mater. Res. Technol. 2022, 17, 2313–2325. [Google Scholar] [CrossRef]
  16. Xuan, L.; Han, G.; Wang, D.; Cheng, W.; Gao, X.; Chen, F.; Li, Q. Effect of Surface-Modified TiO2 Nanoparticles on the Anti-Ultraviolet Aging Performance of Foamed Wheat Straw Fiber/Polypropylene Composites. Materials 2017, 10, 456. [Google Scholar] [CrossRef] [Green Version]
  17. Zhang, C.; Zhong, L.; Wang, D.; Zhang, F.; Zhang, G. Anti-ultraviolet and anti-static modification of polyethylene terephthalate fabrics with graphene nanoplatelets by a high-temperature and high-pressure inlaying method. Text. Res. J. 2018, 89, 1488–1499. [Google Scholar] [CrossRef]
  18. Pereira, P.; Ferreira, D.P.; Araújo, J.C.; Ferreira, A.; Fangueiro, R. The Potential of Graphene Nanoplatelets in the Development of Smart and Multifunctional Ecocomposites. Polymers 2020, 12, 2189. [Google Scholar] [CrossRef]
  19. Cabello-Alvarado, C.; Reyes-Rodríguez, P.; Andrade-Guel, M.; Cadenas-Pliego, G.; Pérez-Alvarez, M.; Cruz-Delgado, V.J.; Melo-López, L.; Quiñones-Jurado, Z.V.; Ávila-Orta, C.A. Melt-Mixed Thermoplastic Nanocomposite Containing Carbon Nanotubes and Titanium Dioxide for Flame Retardancy Applications. Polymers 2019, 11, 1204. [Google Scholar] [CrossRef] [Green Version]
  20. Netkueakul, W.; Fischer, B.; Walder, C.; Nüesch, F.; Rees, M.; Jovic, M.; Gaan, S.; Jacob, P.; Wang, J. Effects of Combining Graphene Nanoplatelet and Phosphorous Flame Retardant as Additives on Mechanical Properties and Flame Retardancy of Epoxy Nanocomposite. Polymers 2020, 12, 2349. [Google Scholar] [CrossRef]
  21. Moradkhani, G.; Fasihi, M.; Brison, L.; Laoutid, F.; Vahabi, H.; Saeb, M.R. Flame retardancy effect of phosphorus graphite nanoplatelets on ethylene-vinyl acetate copolymer: Physical blending versus chemical modification. Polym. Adv. Technol. 2021, 32, 4296–4305. [Google Scholar] [CrossRef]
  22. Carvalho, G.B.; Canevarolo, S.V.; Sousa, J.A. Influence of interfacial interactions on the mechanical behavior of hybrid composites of polypropylene/short glass fibers/hollow glass beads. Polym. Test. 2020, 85, 106418. [Google Scholar] [CrossRef]
  23. Sarabi, M.T.; Behravesh, A.H.; Shahi, P.; Daryabari, Y. Effect of polymeric matrix melt flow index in reprocessing extruded wood–plastic composites. J. Thermoplast. Compos. Mater. 2014, 27, 881–894. [Google Scholar] [CrossRef]
  24. Bremner, T.; Rudin, A.; Cook, D.G. Melt flow index values and molecular weight distributions of commercial thermoplastics. J. Appl. Polym. Sci. 1990, 41, 1617–1627. [Google Scholar] [CrossRef]
  25. Balasuriya, P.W.; Ye, L.; Mai, Y.W. Mechanical properties of wood flake–polyethylene composites. Part I: Effects of processing methods and matrix melt flow behaviour. Compos. Part A Appl. Sci. Manuf. 2001, 32, 619–629. [Google Scholar] [CrossRef]
  26. Sharma, M.; Bijwe, J. Influence of molecular weight on performance properties of polyethersulphone and its composites with carbon fabric. Wear 2012, 274–275, 388–394. [Google Scholar] [CrossRef]
  27. ASTM D638-14; Standard Test Method for Tensile Properties of Plastics. ASTM International: West Conshohocken, PA, USA, 2014.
  28. ASTM D790-10; Standard Test Methods for Flexural Properties of Unreinforced and Reinforced Plastics and Electrical Insulating Materials. ASTM International: West Conshohocken, PA, USA, 2010.
  29. ASTM D256-10; Standard Test Methods for Determining the Izod Pendulum Impact Resistance of Plastics. ASTM International: West Conshohocken, PA, USA, 2010.
  30. ASTM D2240-15; Standard Test Method for Rubber Property—Durometer Hardness. ASTM International: West Conshohocken, PA, USA, 2015.
  31. Zitzenbacher, G.; Dirnberger, H.; Längauer, M.; Holzer, C. Calculation of the Contact Angle of Polymer Melts on Tool Surfaces from Viscosity Parameters. Polymers 2018, 10, 38. [Google Scholar] [CrossRef] [Green Version]
  32. Chen, P.; Lu, C.; Yu, Q.; Gao, Y.; Li, J.; Li, X. Influence of fiber wettability on the interfacial adhesion of continuous fiber-reinforced PPESK composite. J. Appl. Polym. Sci. 2006, 102, 2544–2551. [Google Scholar] [CrossRef]
  33. Ashraf, M.A.; Peng, W.; Zare, Y.; Rhee, K.Y. Effects of Size and Aggregation/Agglomeration of Nanoparticles on the Interfacial/Interphase Properties and Tensile Strength of Polymer Nanocomposites. Nanoscale Res. Lett. 2018, 13, 214. [Google Scholar] [CrossRef]
  34. Kim, S.-J.; Moon, J.-B.; Kim, G.-H.; Ha, C.-S. Mechanical properties of polypropylene/natural fiber composites: Comparison of wood fiber and cotton fiber. Polym. Test. 2008, 27, 801–806. [Google Scholar] [CrossRef]
  35. Hemanth, R.; Sekar, M.; Suresha, B. Effects of Fibers and Fillers on Mechanical Properties of Thermoplastic Composites. Indian J. Adv. Chem. Sci. 2014, 2, 28–35. [Google Scholar]
  36. Junaedi, H.; AlMajid, A.A.; Friedrich, K. Mechanical Properties and Microstructures of Exfoliated Graphite Nano Platelet Reinforced Thermoplastic Nanocomposites. In Proceedings of the 9th International Conference on Composite Science and Technology, Sorrento, Italy, 24–26 April 2013. [Google Scholar]
  37. Kinloch, A.J.; Williams, J.G. Crack blunting mechanisms in polymers. J. Mater. Sci. 1980, 15, 987–996. [Google Scholar] [CrossRef]
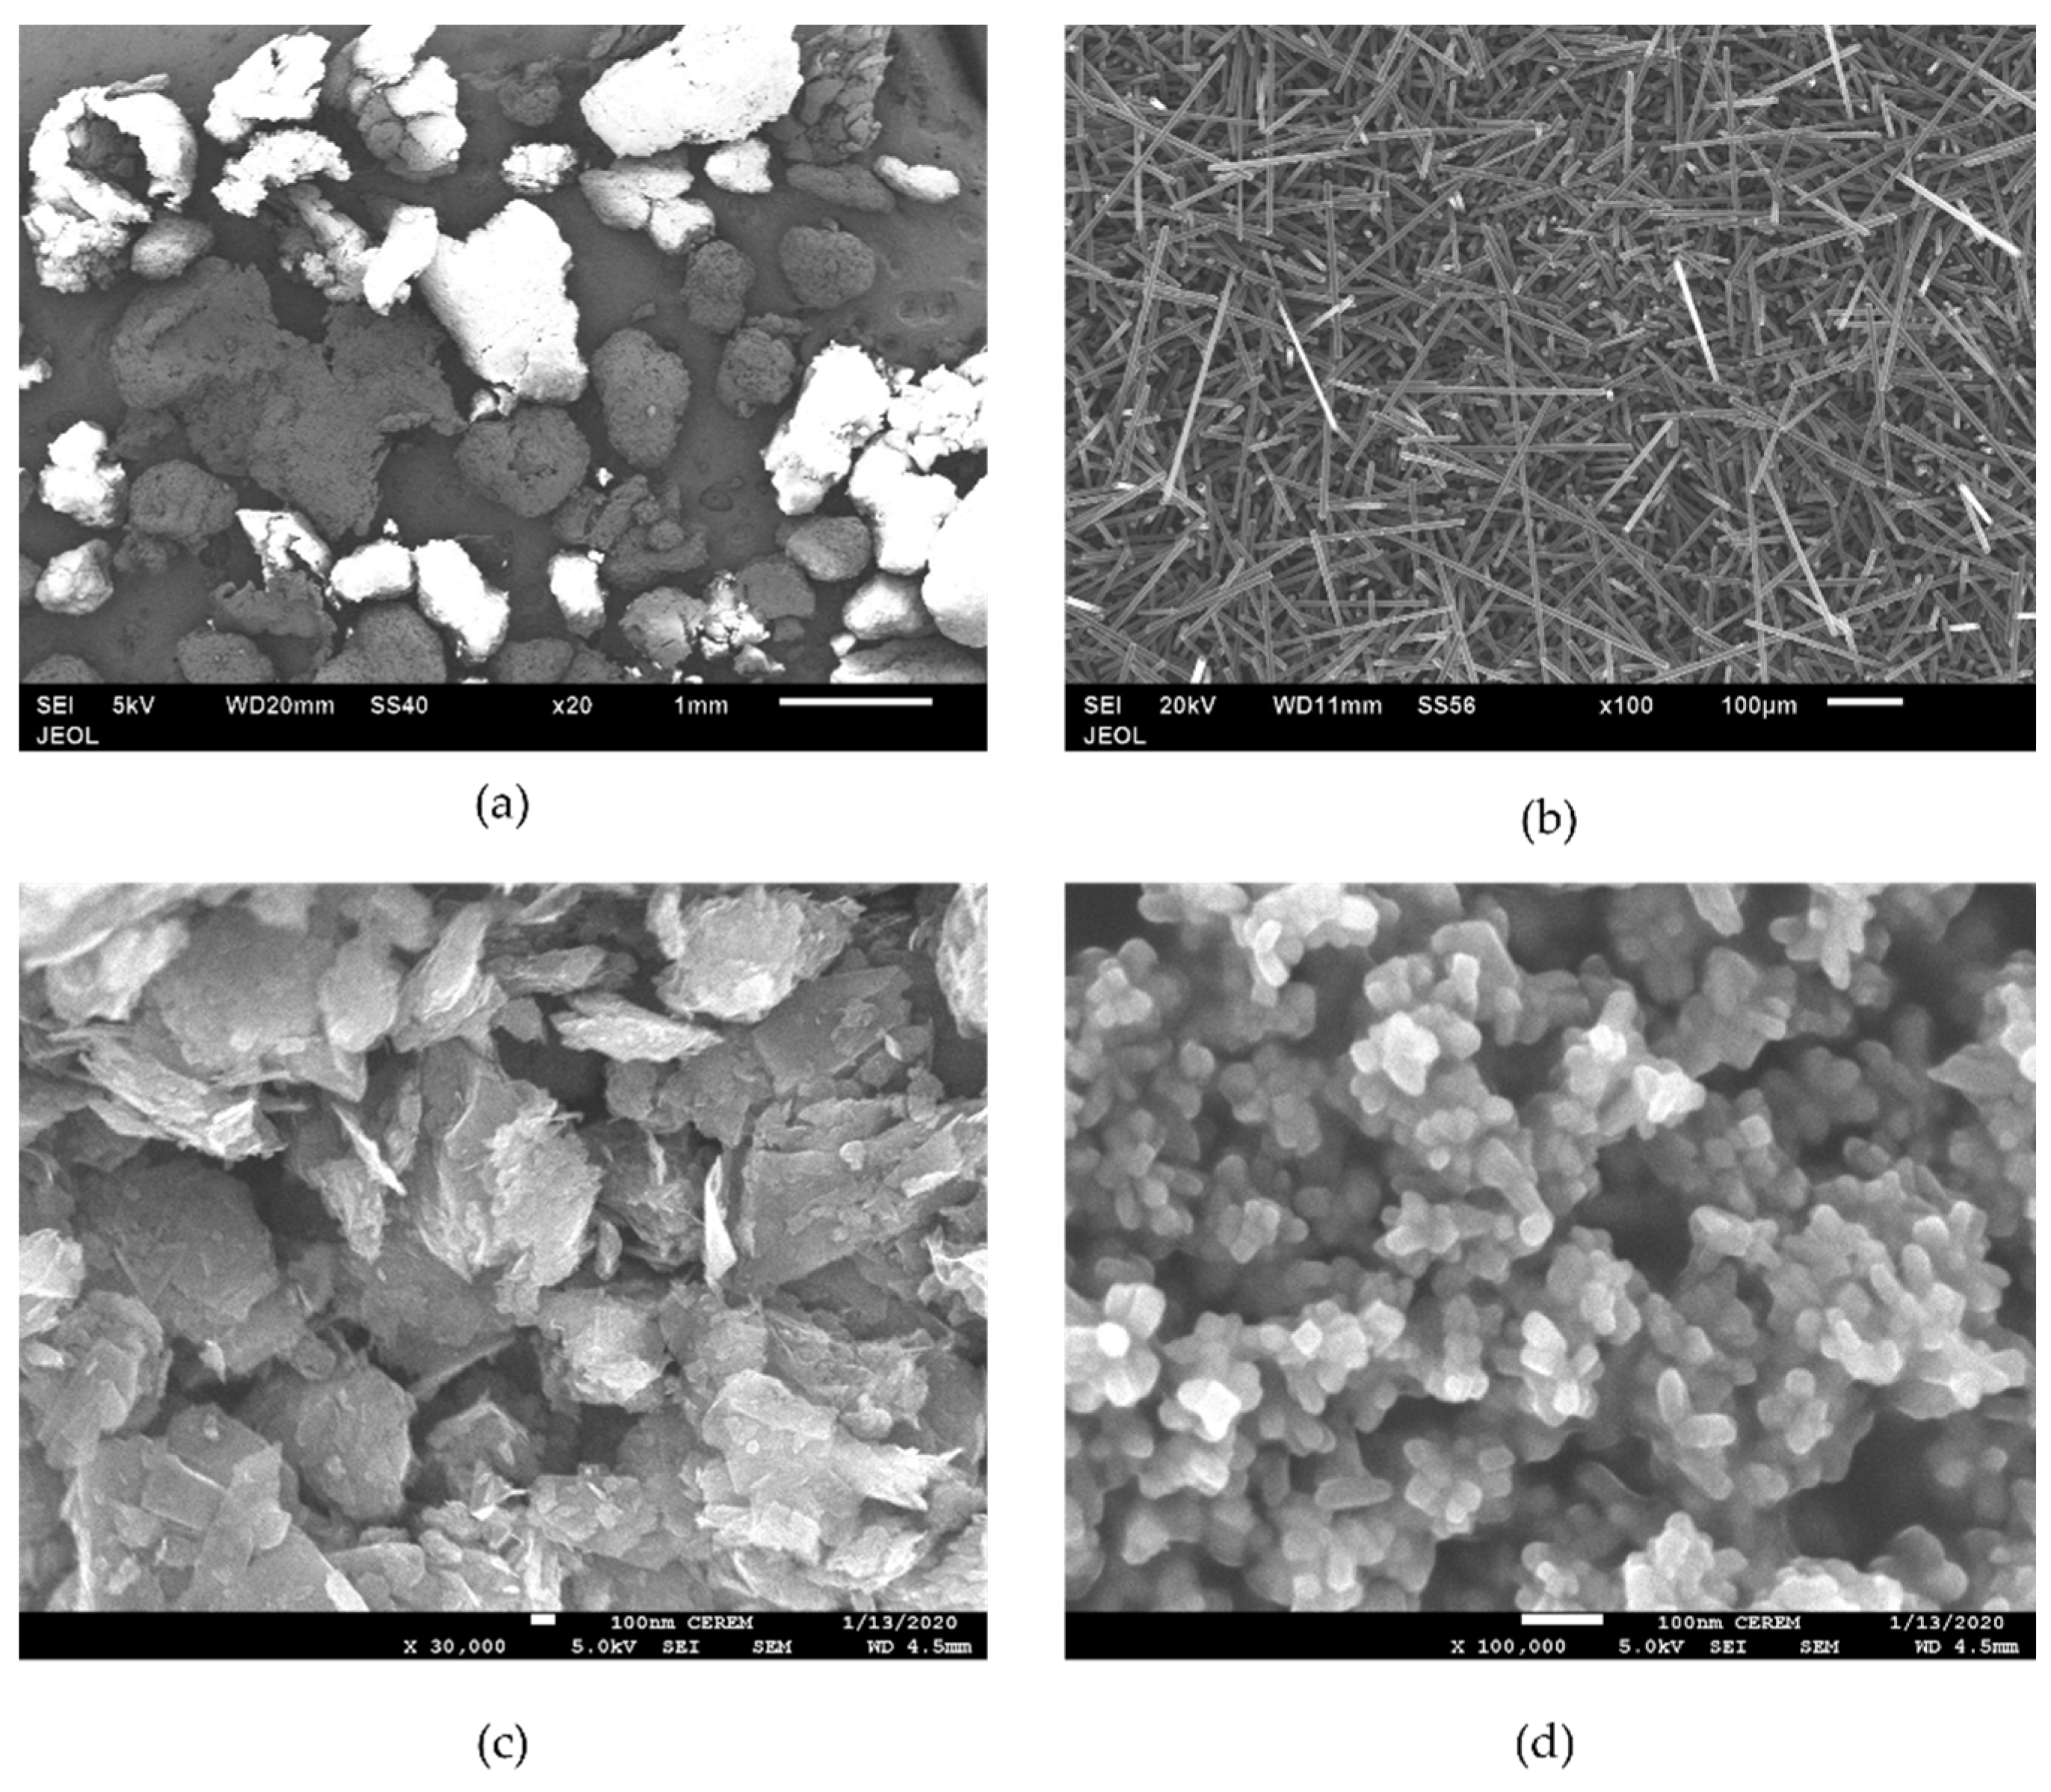
Figure 1. SEM images of raw materials (a) PP23, (b) SCF, (c) GNP, and (d) nTiO2.
Materials 15 07568 g001
Figure 2. Processing steps schematic of the composites.
Materials 15 07568 g002
Figure 3. Tensile testing.
Materials 15 07568 g003
Figure 4. Three-point bending testing.
Materials 15 07568 g004
Figure 5. (a) Izod impact and (b) hardness shore-D testing.
Materials 15 07568 g005
Figure 6. SEM images of 20 wt. % of SCF-reinforced Polypropylene (PP/20SCF) of (a) PP3 and (b) PP23.
Materials 15 07568 g006
Figure 7. SEM images of 5 wt. % of GNP of PP/5GNP composites of (a) PP3 and (b) PP23.
Materials 15 07568 g007
Figure 8. SEM images of 5 wt. % of nTiO2 of PP/5nTiO2 composites of (a) PP3 and (b) PP23.
Materials 15 07568 g008
Figure 9. Typical stress-strain curves for neat PP3 and PP23.
Materials 15 07568 g009
Figure 10. Normalized tensile modulus of (a) PP/SCF, (b) PP/GNP, and (c) PP/nTiO2 composites.
Materials 15 07568 g010
Figure 11. Normalized UTS of (a) PP/SCF, (b) PP/GNP, and (c) PP/nTiO2 composites.
Materials 15 07568 g011
Figure 12. Normalized strain at break of (a) PP/SCF, (b) PP/GNP, and (c) PP/nTiO2 composites.
Materials 15 07568 g012
Figure 13. Normalized flexural modulus of (a) PP/SCF, (b) PP/GNP, and (c) PP/nTiO2 composites.
Materials 15 07568 g013
Figure 14. Normalized flexural strength of (a) PP/SCF, (b) PP/GNP, and (c) PP/nTiO2 composites.
Materials 15 07568 g014
Figure 15. Normalized notch Izod impact toughness of (a) PP/SCF, (b) PP/GNP, and (c) PP/nTiO2 composites.
Materials 15 07568 g015
Figure 16. Normalized hardness (Shore-D) of (a) PP/SCF, (b) PP/GNP, and (c) PP/nTiO2 composites.
Materials 15 07568 g016
Table 1. Physical properties of the polypropylenes.
Polypropylene TypeName
Tag
MFI (g/10 min)
@2.16 kg and 230 °C
Density
(g/cm3)
PP500PP330.900
PP511APP23230.900
Table 2. Composites compositions.
Name Tagwt. % SCFwt. % GNPwt. % nTiO2
Neat PP---
PP/5SCF5--
PP/10SCF10--
PP/15SCF15--
PP/20SCF20--
PP/1GNP-1-
PP/2.5GNP-2.5-
PP/5GNP-5-
PP/1nTiO2--1
PP/2.5nTiO2--2.5
PP/5nTiO2--5
Table 3. Mechanical properties of the neat polypropylenes.
TypeTensile Modulus (MPa)UTS
(MPa)
Strain at Break
(%)
Stress at Fracture (MPa)
PP31643 ± 4530 ± 0.6553 ± 38.528.7 ± 0.3
PP231358 ± 3527.6 ± 0.3845 ± 26.130.2 ± 0.7
Publisher’s Note: MDPI stays neutral with regard to jurisdictional claims in published maps and institutional affiliations.