


Pd-Ce-Ox/MWCNTs and Pt-Ce-Ox/MWCNTs Composite Materials: Morphology, Microstructure, and Catalytic Properties

 , , , ,
  , and
, and
Abstract
1. Introduction
2. Materials and Methods
2.1. Samples Preparation
2.1.1. Support Preparation
2.1.2. Pd-Based Catalysts
2.1.3. Pt-Based Catalysts
2.2. Characterization by Physicochemical Methods
2.3. Catalytic Activity Tests
3. Results and Discussion
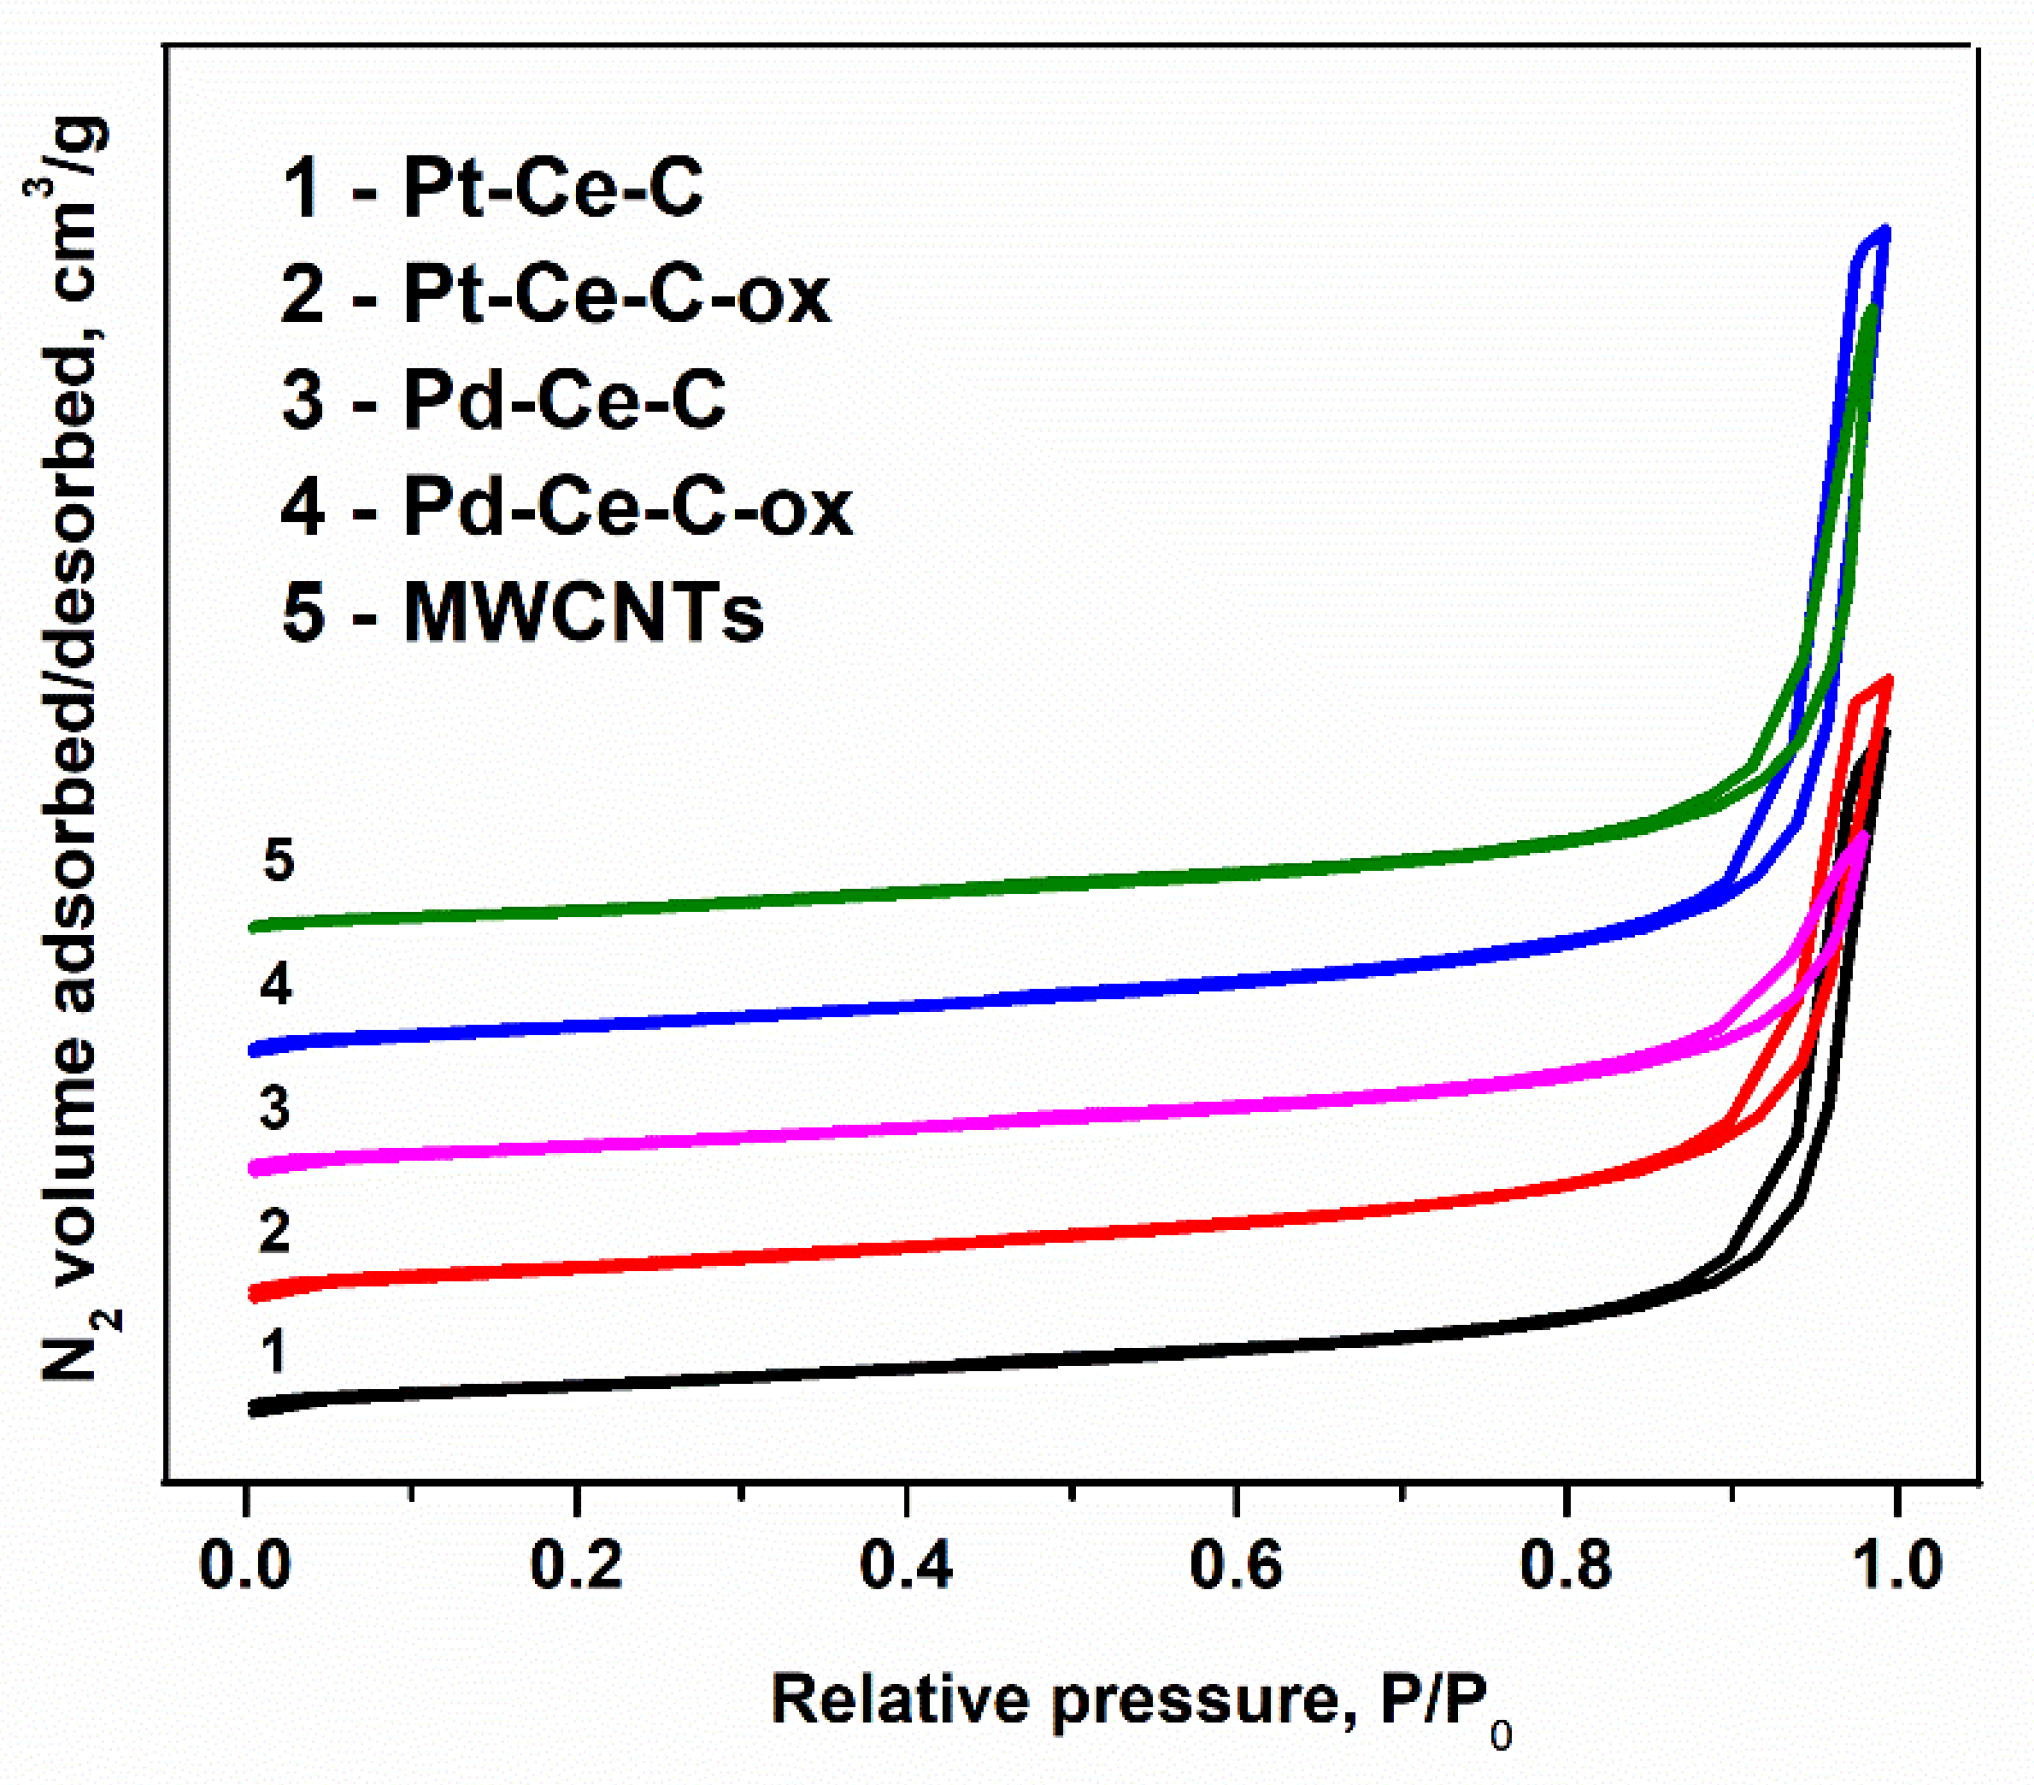
3.1. Textural Properties and XRD Data
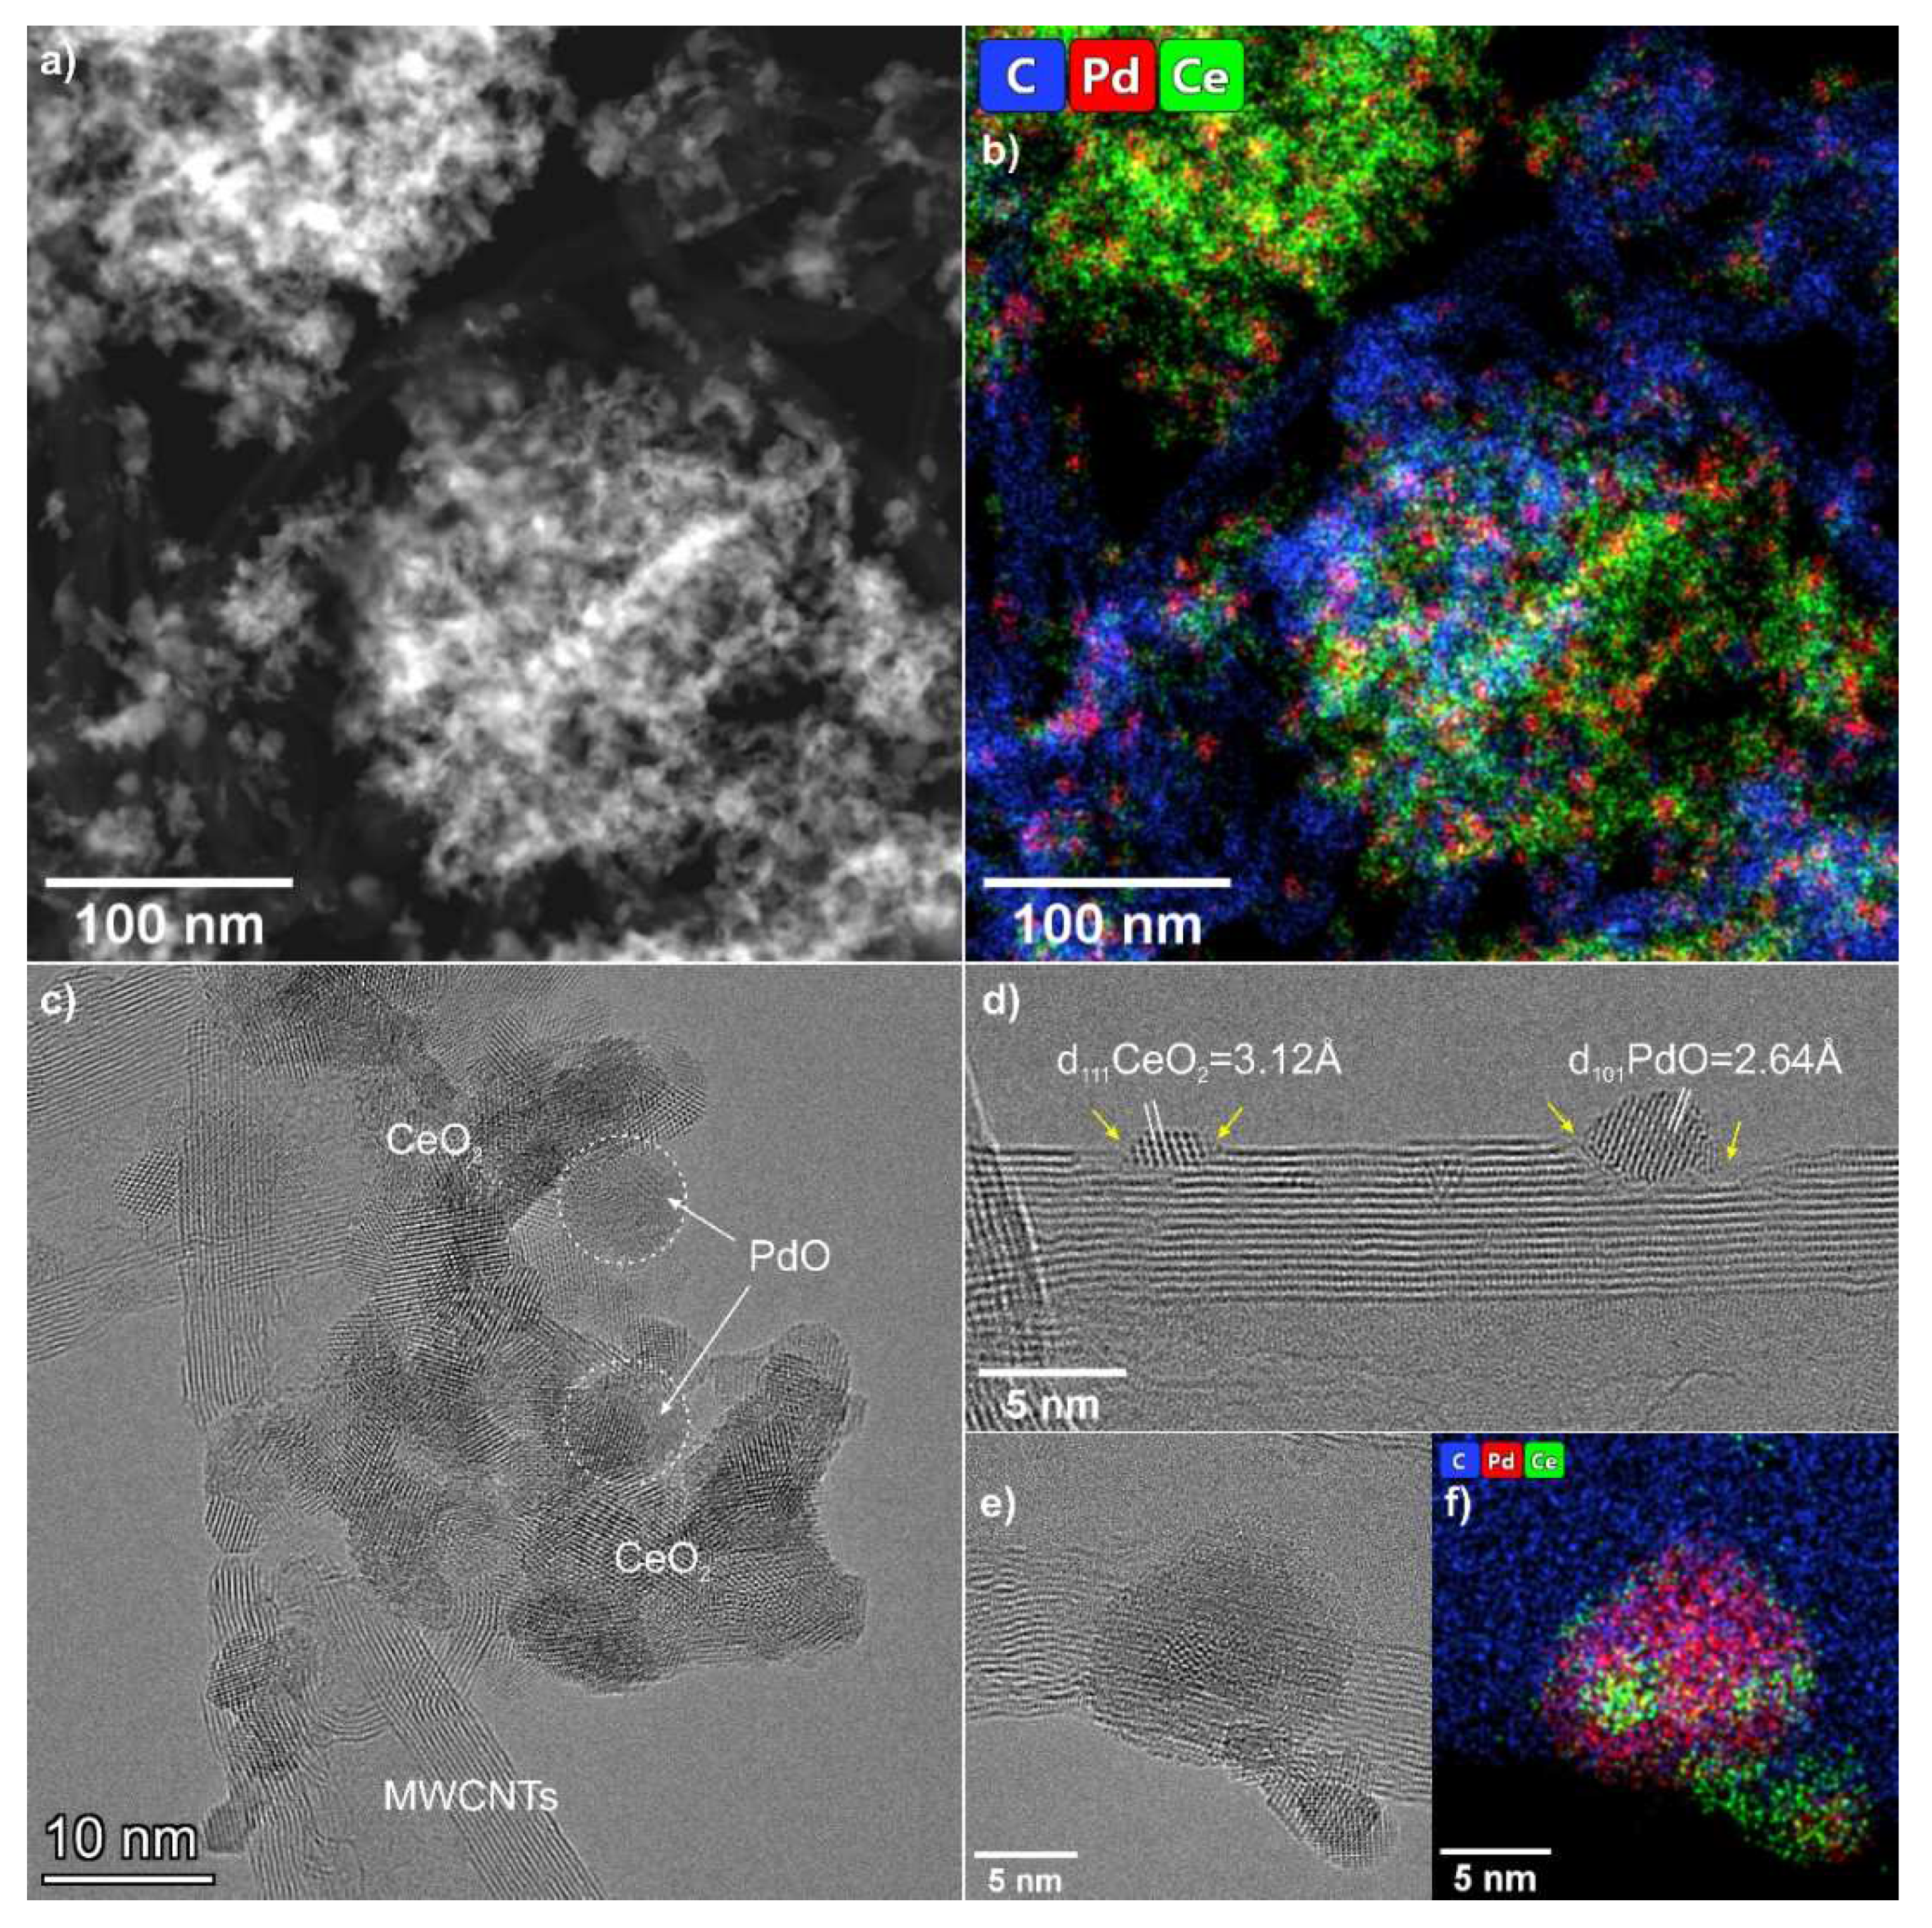
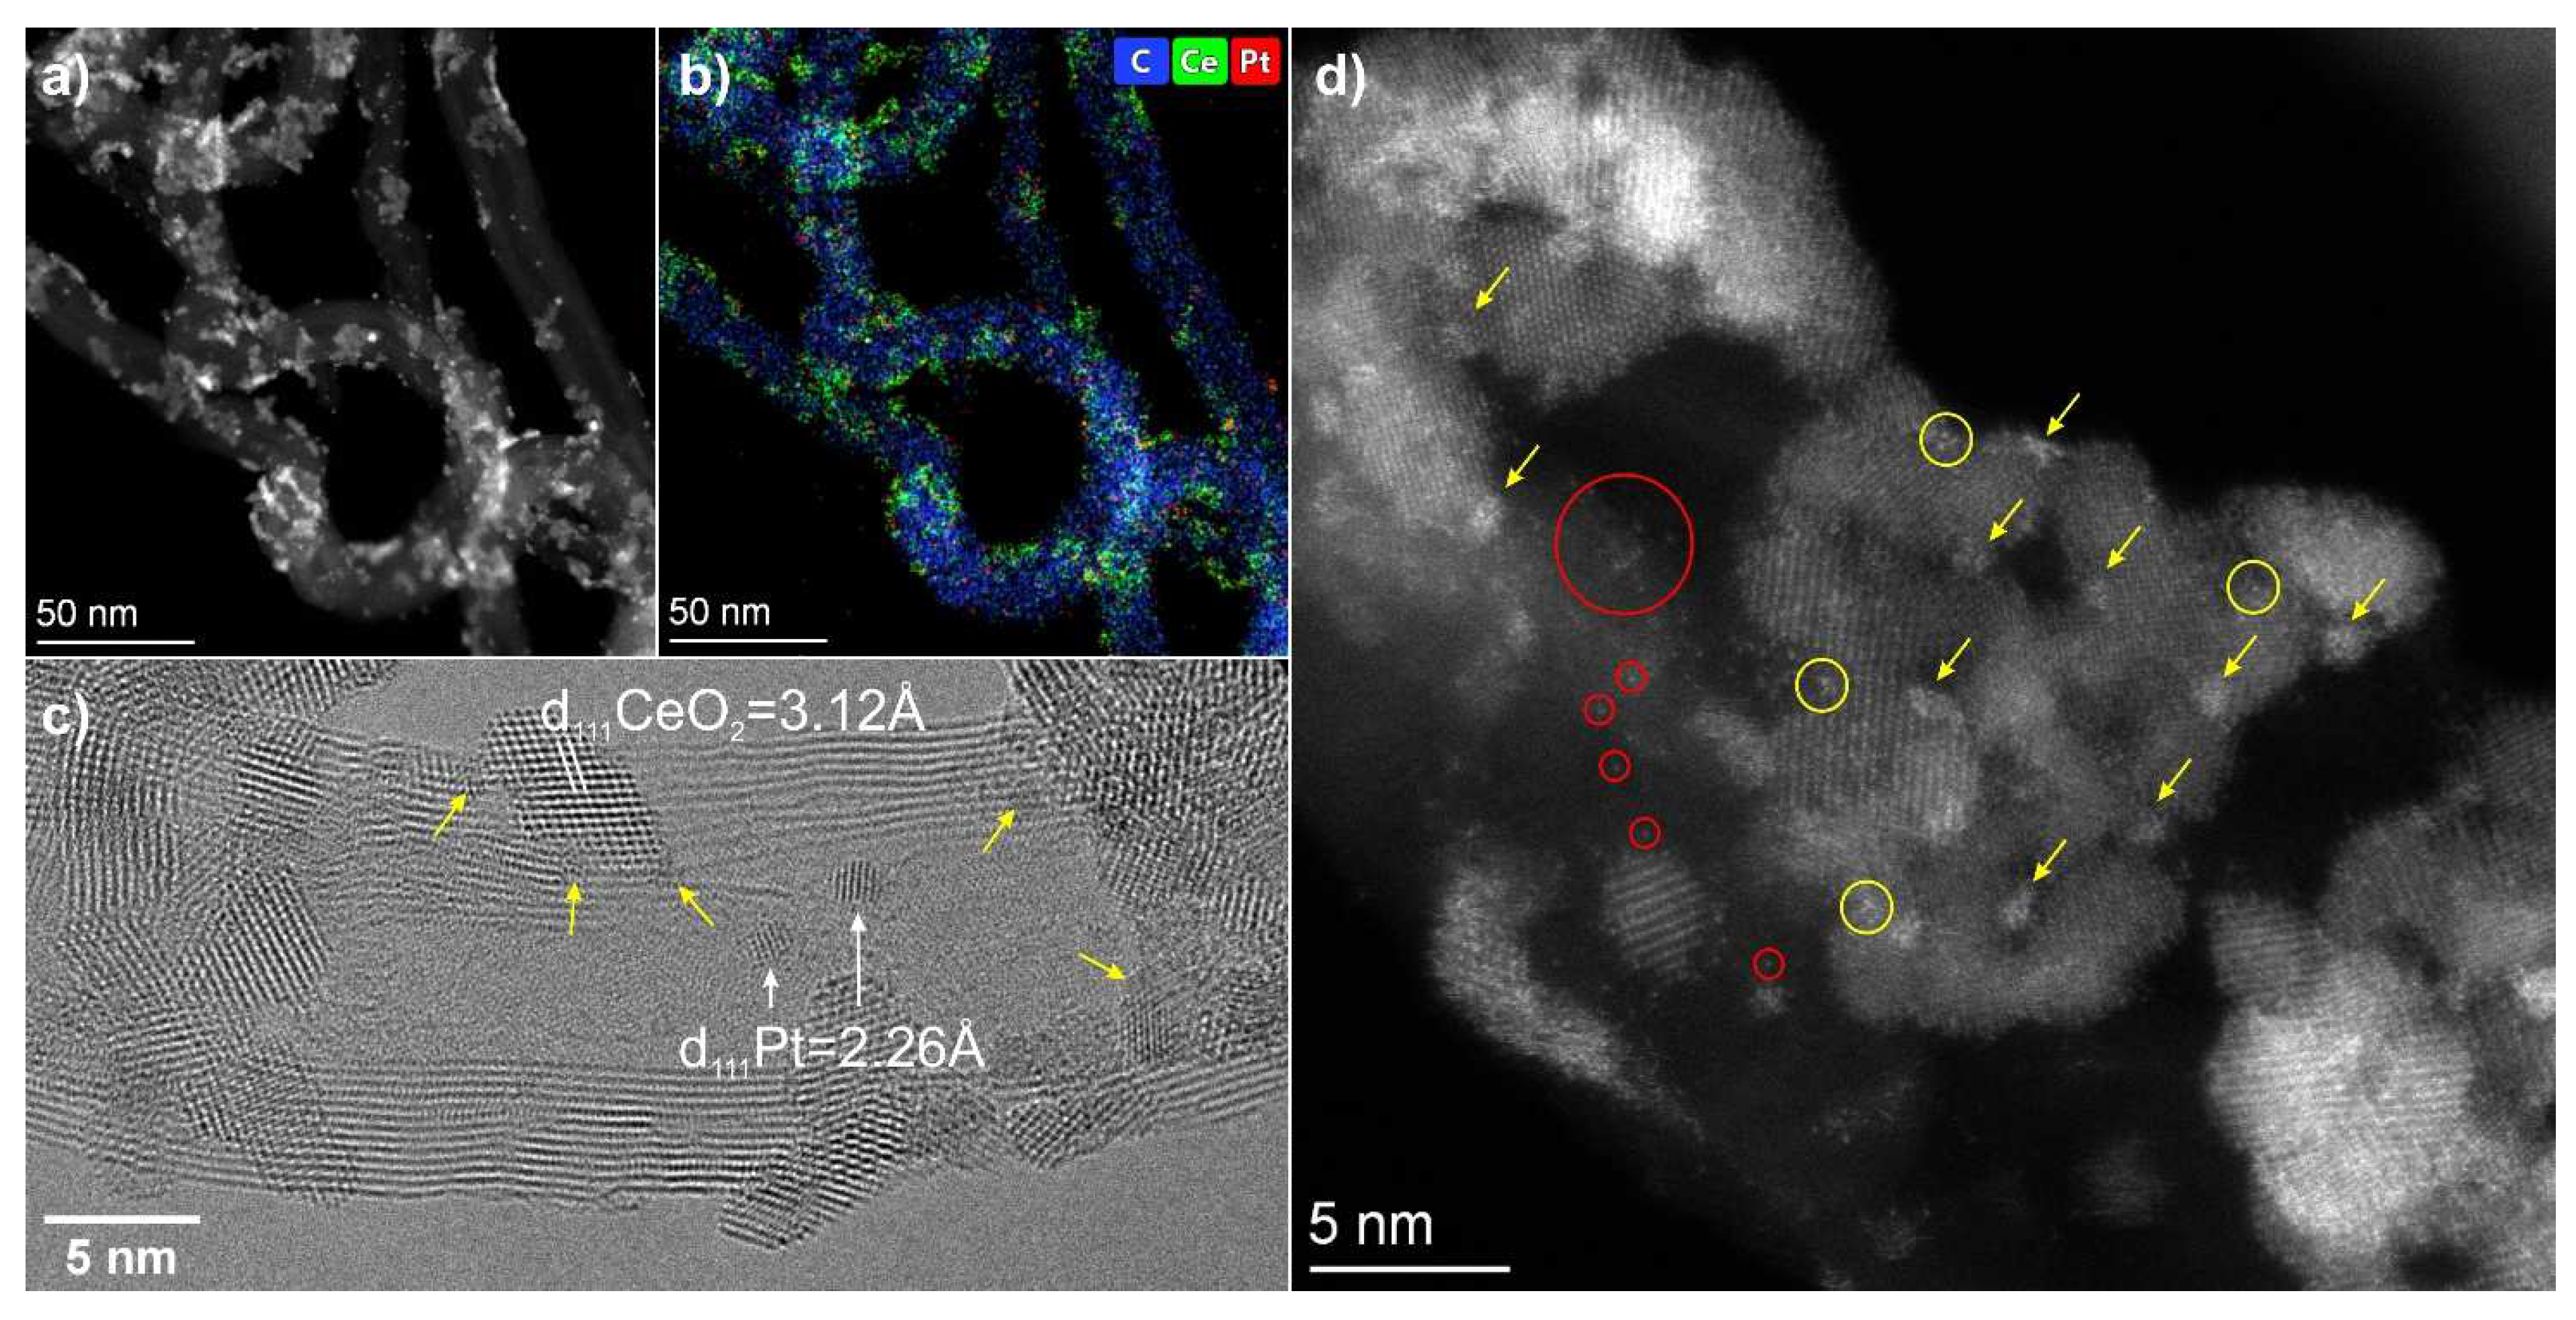
3.2. TEM Data
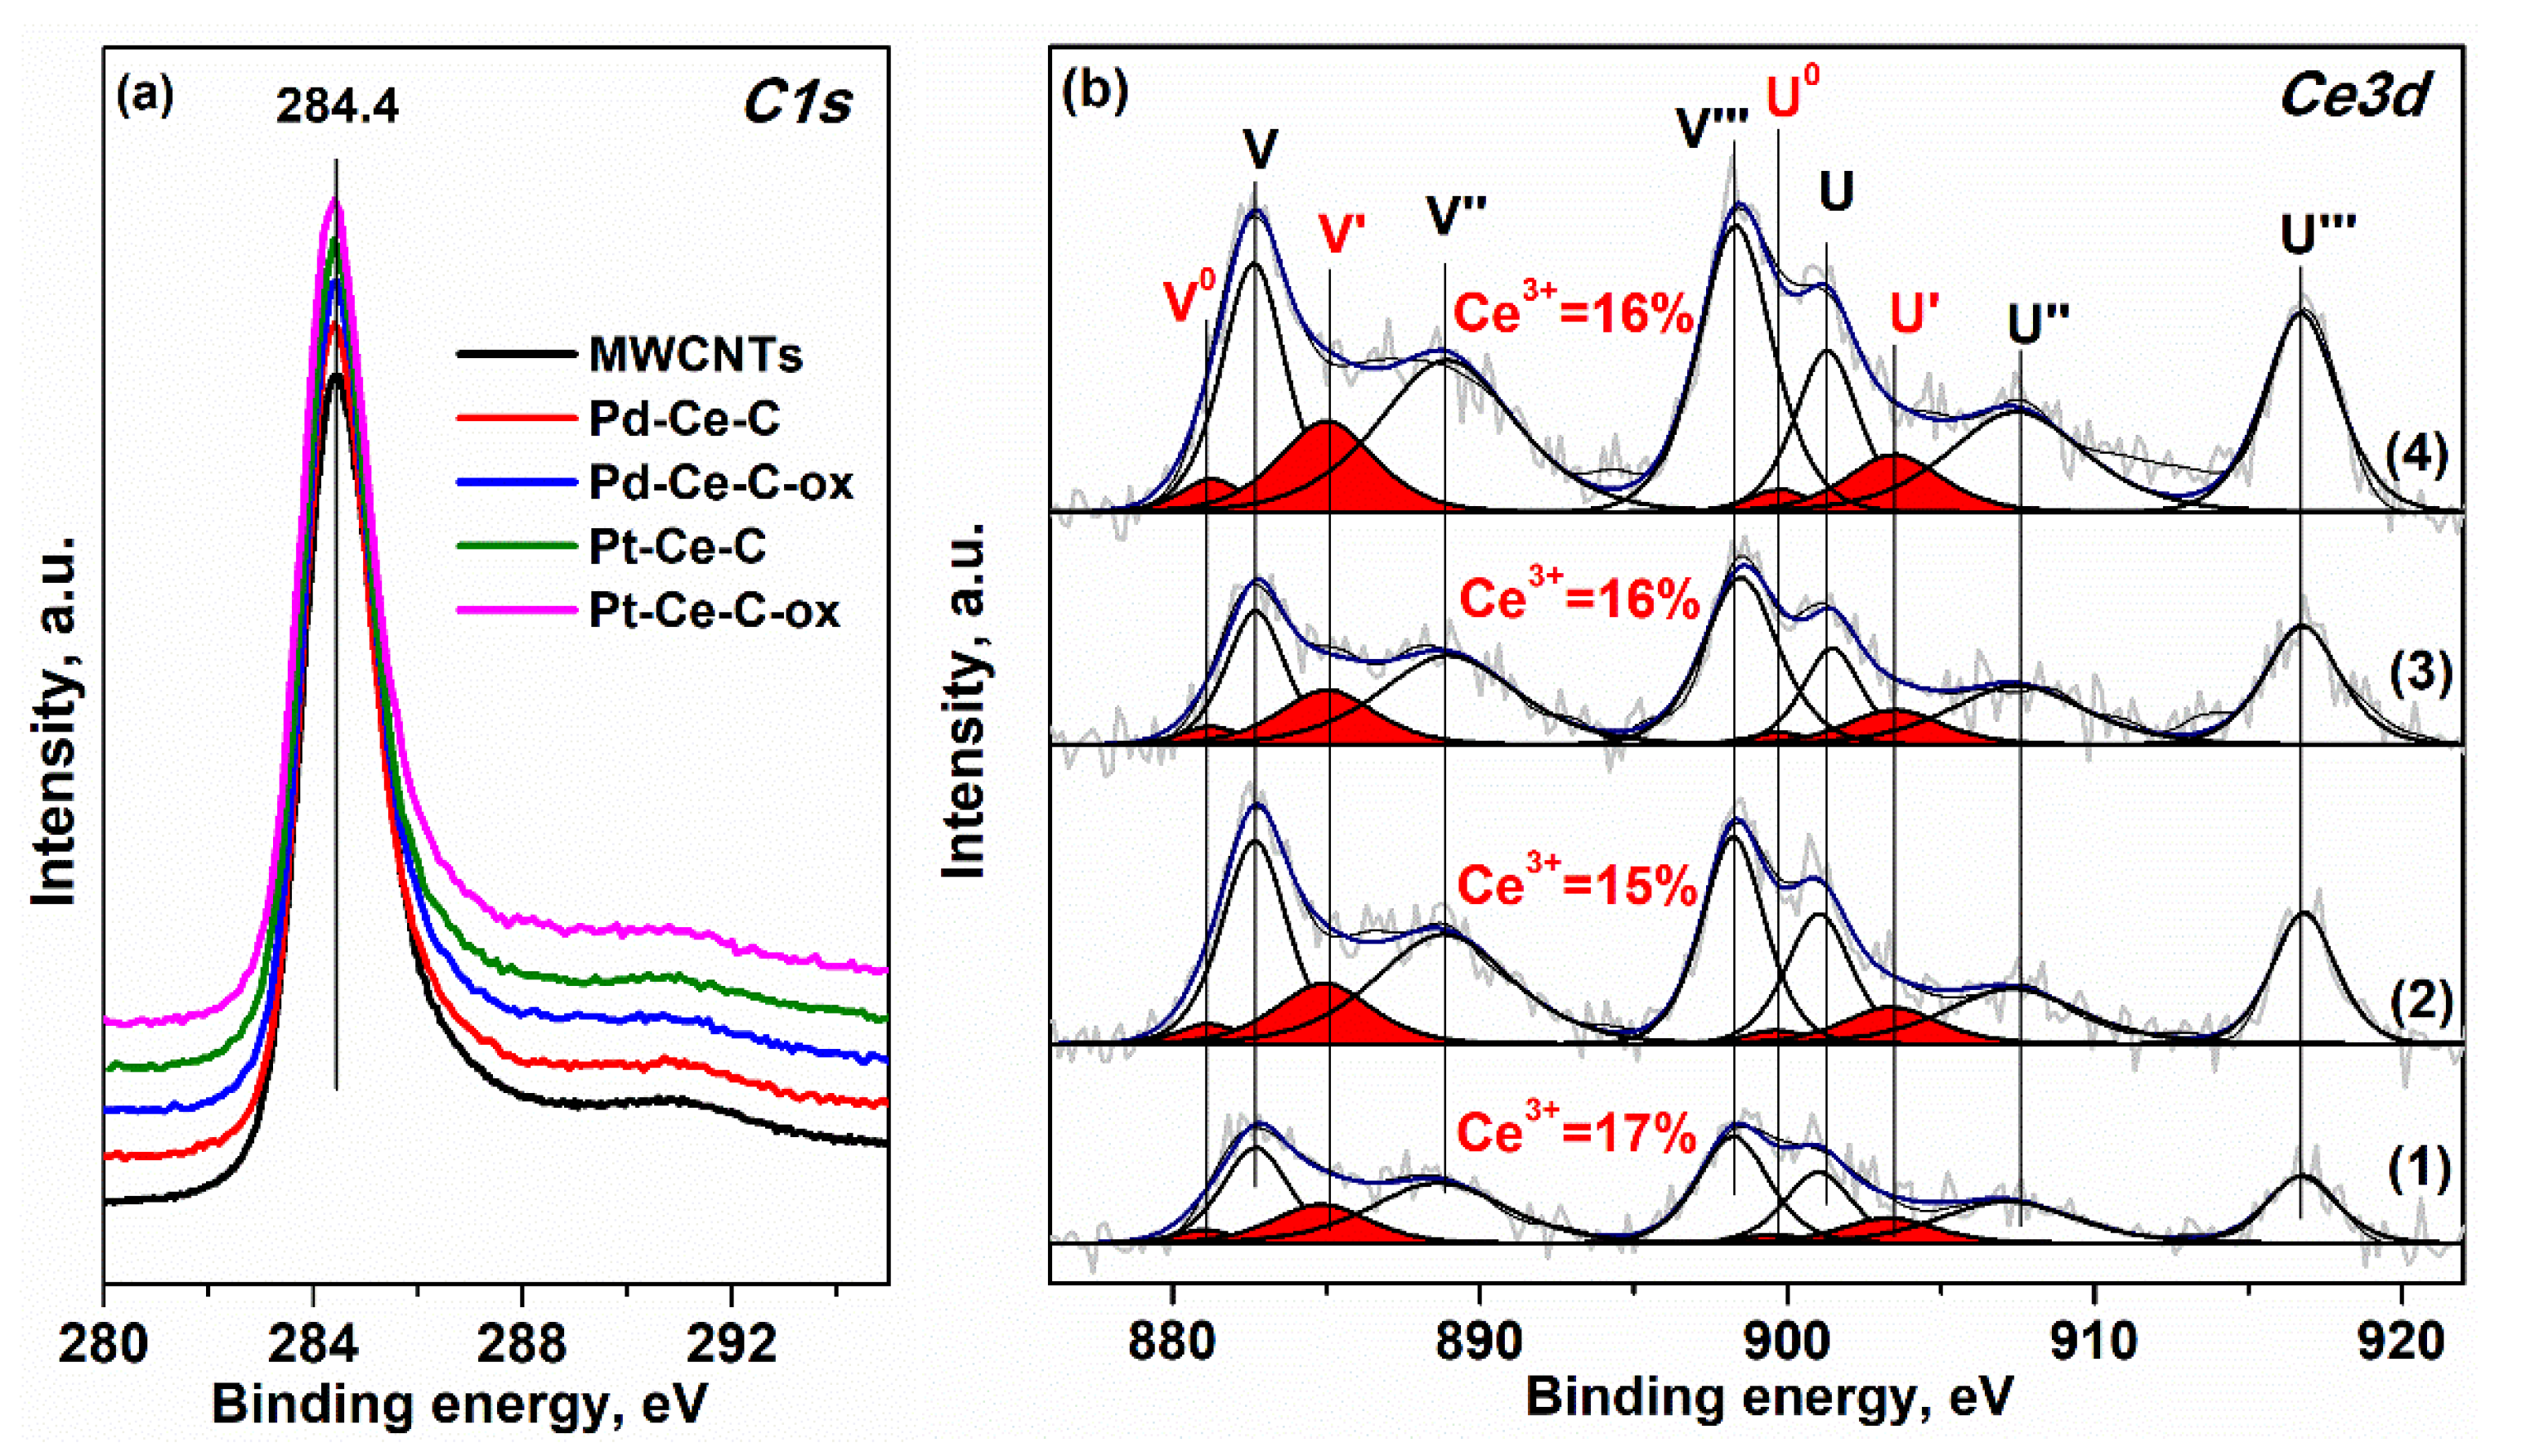
3.3. XPS Data
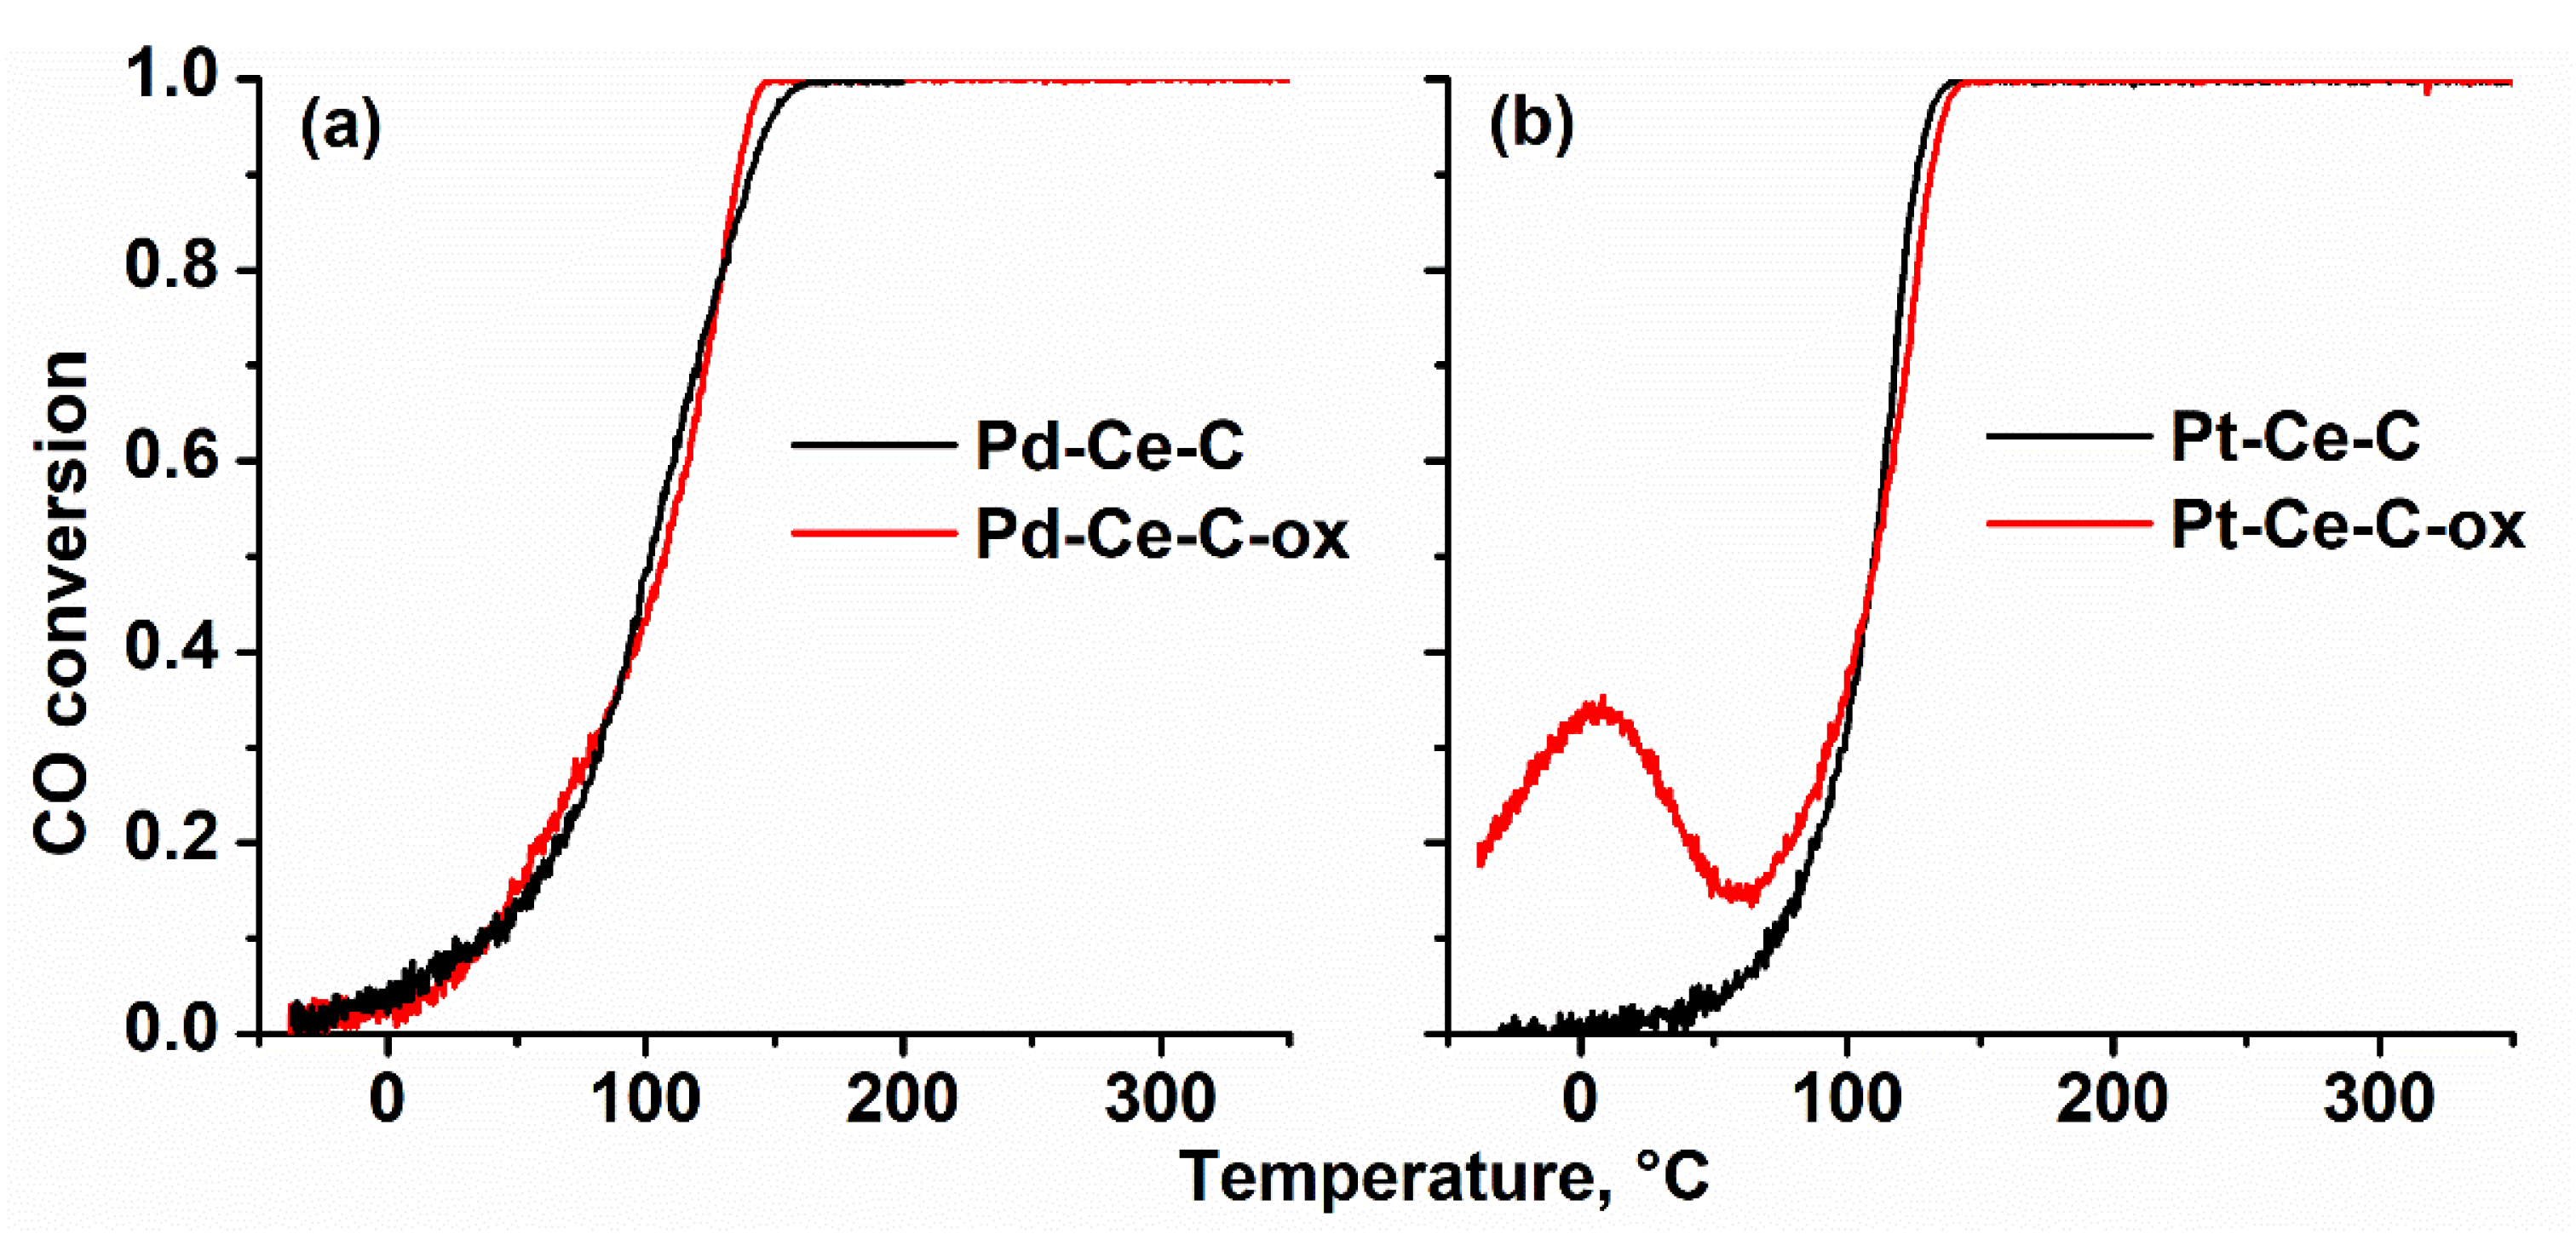
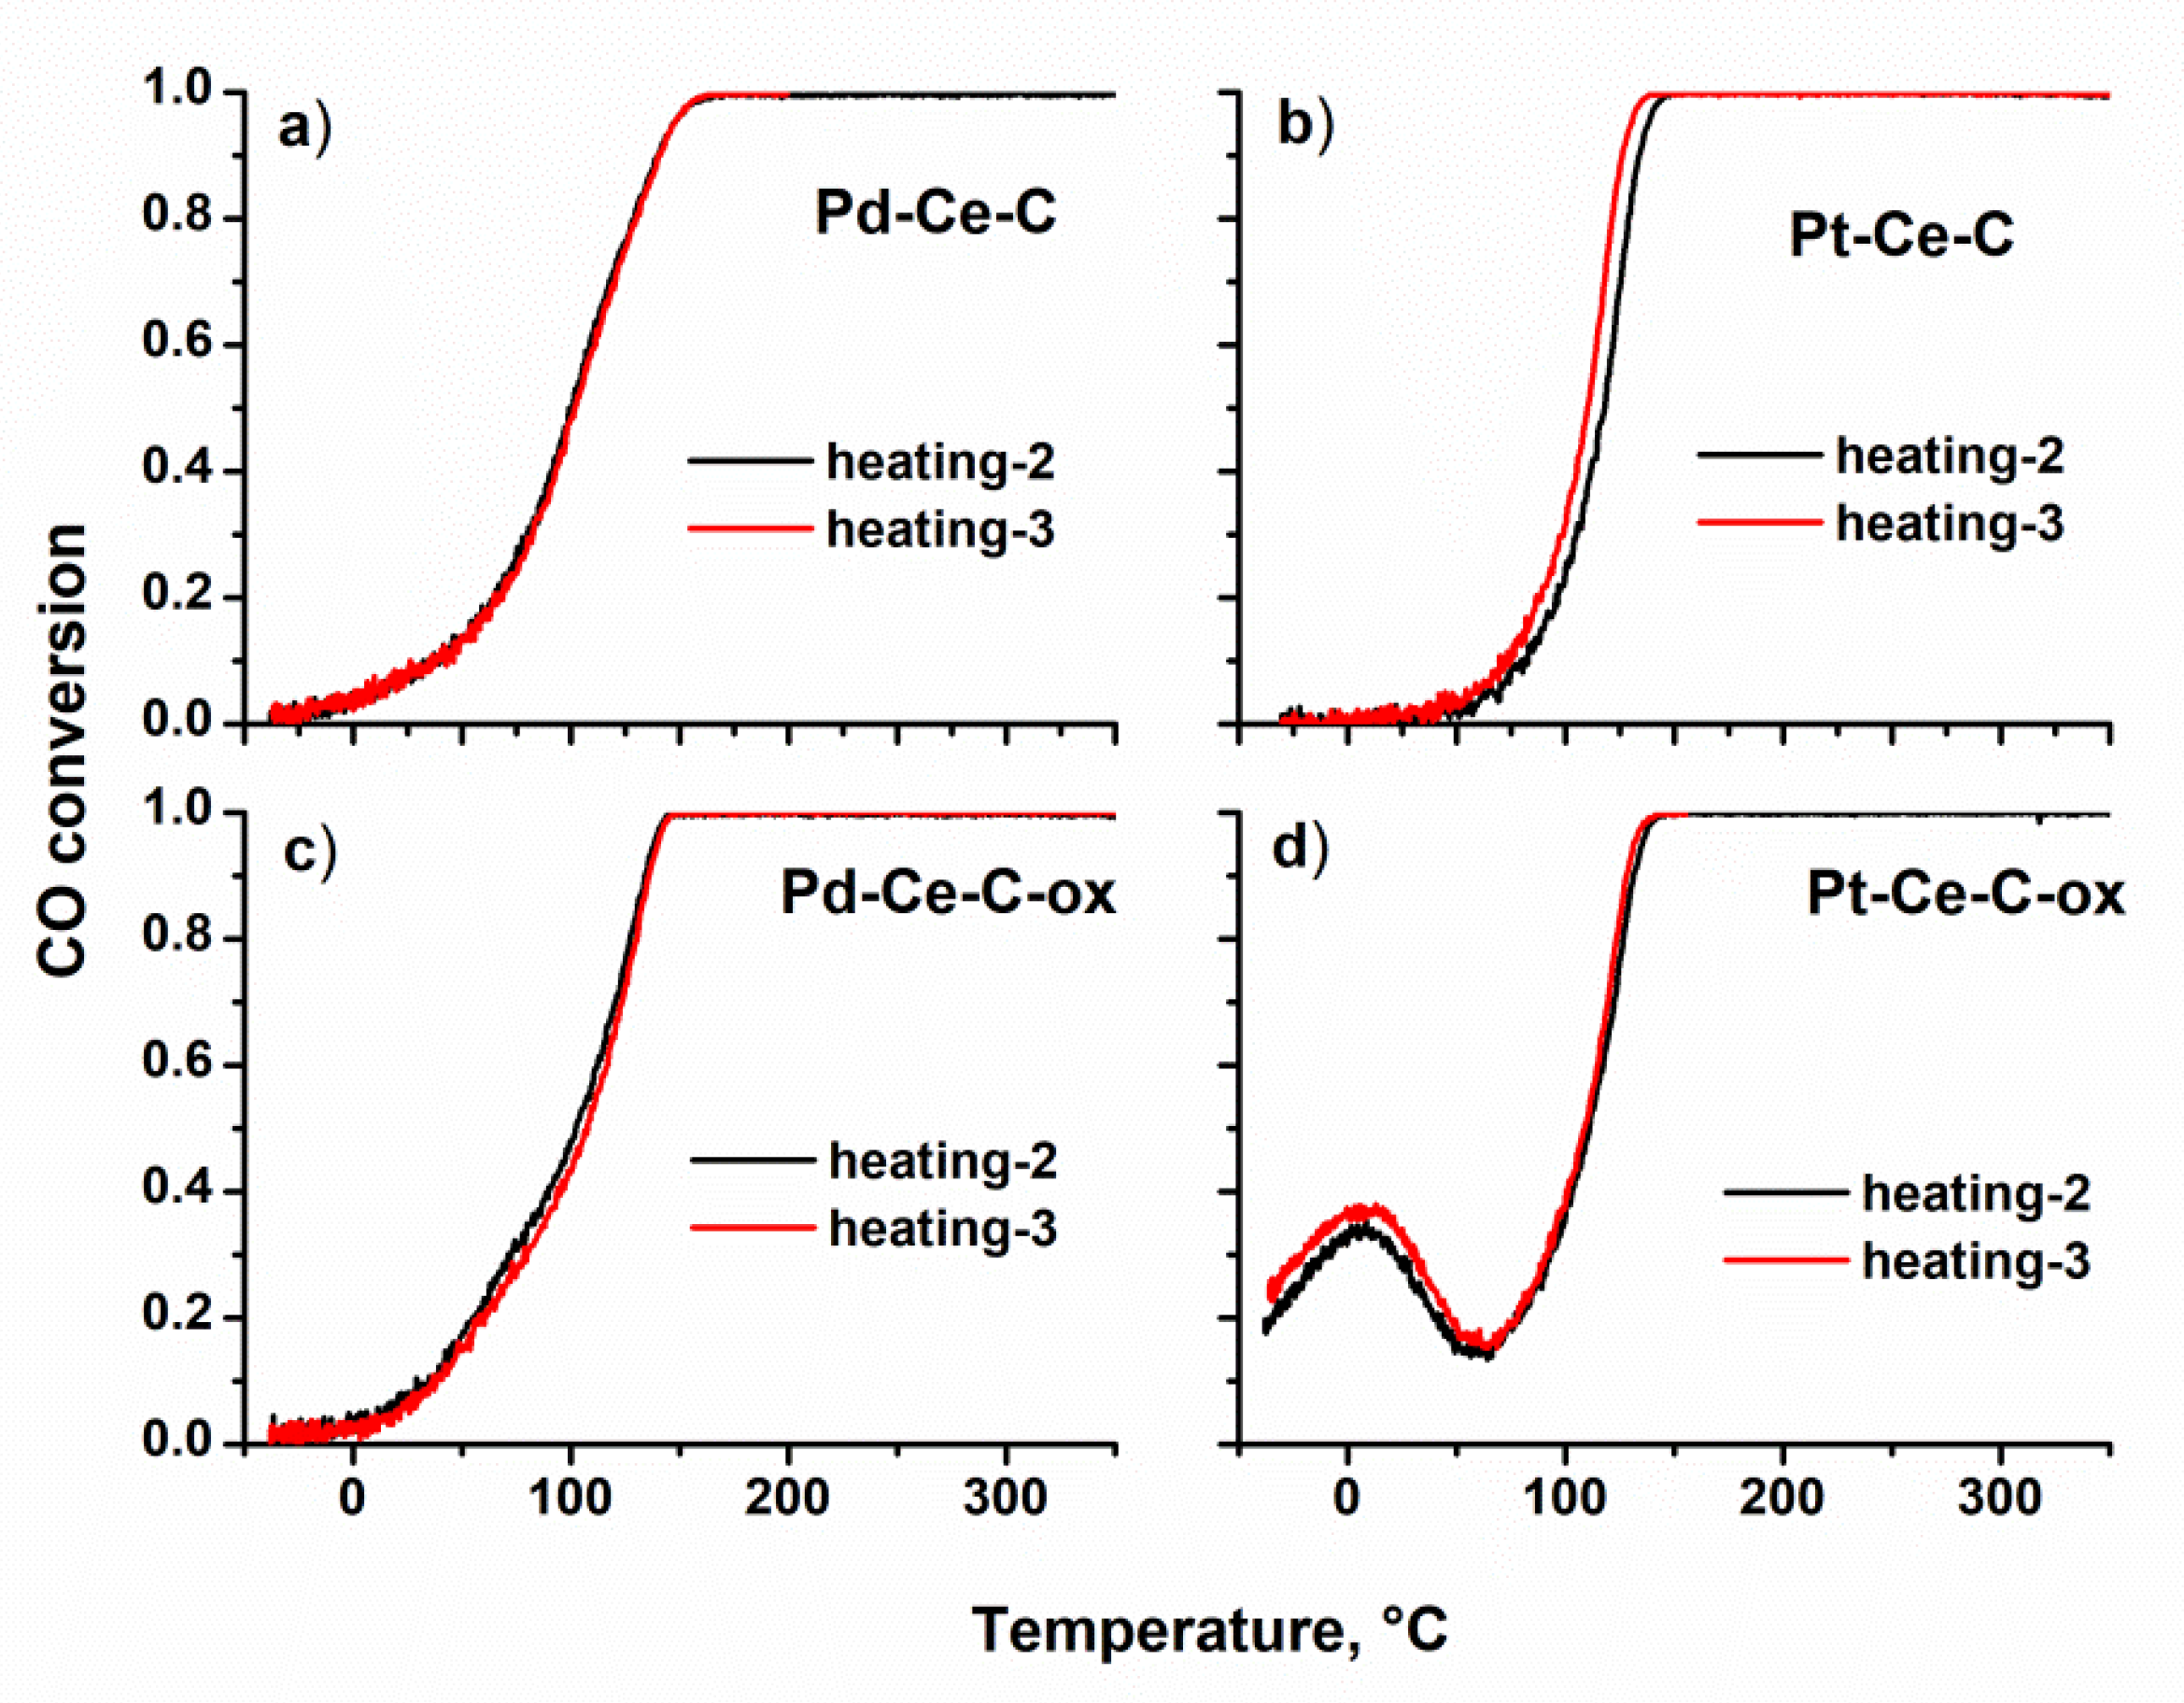
3.4. Catalytic Properties
4. Conclusions
Author Contributions
Funding
Institutional Review Board Statement
Informed Consent Statement
Data Availability Statement
Acknowledgments
Conflicts of Interest
Appendix A


References
- Liu, S.; Bai, S.-Q.; Zheng, Y.; Shah, K.W.; Han, M.-Y. Composite Metal-Oxide Nanocatalysts. ChemCatChem 2012, 4, 1462–1484. [Google Scholar] [CrossRef]
- Xie, Z.; Liu, Z.; Wang, Y.; Yang, Q.; Xu, L.; Ding, W. An Overview of Recent Development in Composite Catalysts from Porous Materials for Various Reactions and Processes. Int. J. Mol. Sci. 2010, 11, 2152–2187. [Google Scholar] [CrossRef]
- Liang, Y.N.; Da Oh, W.; Li, Y.; Hu, X. Nanocarbons as Platforms for Developing Novel Catalytic Composites: Overview and Prospects. Appl. Catal. A Gen. 2018, 562, 94–105. [Google Scholar] [CrossRef]
- Xu, Y.; Chen, L.; Wang, X.; Yao, W.; Zhang, Q. Recent Advances in Noble Metal Based Composite Nanocatalysts: Colloidal Synthesis, Properties, and Catalytic Applications. Nanoscale 2015, 7, 10559–10583. [Google Scholar] [CrossRef] [PubMed]
- Shoukat, R.; Khan, M.I. Carbon Nanotubes: A Review on Properties, Synthesis Methods and Applications in Micro and Nanotechnology. Microsyst. Technol. 2021, 27, 4183–4192. [Google Scholar] [CrossRef]
- Veeman, D.; Shree, M.V.; Sureshkumar, P.; Jagadeesha, T.; Natrayan, L.; Ravichandran, M.; Paramasivam, P. Sustainable Development of Carbon Nanocomposites: Synthesis and Classification for Environmental Remediation. J. Nanomater. 2021, 2021, 5840645. [Google Scholar] [CrossRef]
- Tafete, G.A.; Thothadri, G.; Abera, M.K. A Review on Carbon Nanotube-Based Composites for Electrocatalyst Applications. Fuller. Nanotub. Carbon Nanostr. 2022, 2022, 1–9. [Google Scholar] [CrossRef]
- Tichit, D.; Álvarez, M.G. Layered Double Hydroxide/Nanocarbon Composites as Heterogeneous Catalysts: A Review. ChemEngineering 2022, 6, 45. [Google Scholar] [CrossRef]
- Melchionna, M.; Marchesan, S.; Prato, M.; Fornasiero, P. Carbon Nanotubes and Catalysis: The Many Facets of a Successful Marriage. Catal. Sci. Technol. 2015, 5, 3859–3875. [Google Scholar] [CrossRef]
- Yang, L.; Wang, P.; Yao, L.; Meng, X.; Jia, C.Q.; Jiang, X.; Jiang, W. Copper Doping Promotion on Ce/CAC-CNT Catalysts with High Sulfur Dioxide Tolerance for Low-Temperature NH3-SCR. ACS Sustain. Chem. Eng. 2021, 9, 987–997. [Google Scholar] [CrossRef]
- Podyacheva, O.Y.; Lisitsyn, A.S.; Kibis, L.S.; Stadnichenko, A.I.; Boronin, A.I.; Slavinskaya, E.M.; Stonkus, O.A.; Yashnik, S.A.; Ismagilov, Z.R. Influence of the Nitrogen-Doped Carbon Nanofibers on the Catalytic Properties of Supported Metal and Oxide Nanoparticles. Catal. Today 2018, 301, 125–133. [Google Scholar] [CrossRef]
- Bulusheva, L.G.; Gevko, P.N.; Okotrub, A.V.; Lavskaya, Y.V.; Yudanov, N.F.; Yudanova, L.I.; Abrosimov, O.G.; Pazhetnov, E.M.; Boronin, A.I.; Flahaut, E. Thermal Behavior of Fluorinated Double-Walled Carbon Nanotubes. Chem. Mater. 2006, 18, 4967–4971. [Google Scholar] [CrossRef][Green Version]
- Kamedulski, P.; Lukaszewicz, J.P.; Witczak, L.; Szroeder, P.; Ziolkowski, P. The Importance of Structural Factors for the Electrochemical Performance of Graphene/Carbon Nanotube/Melamine Powders towards the Catalytic Activity of Oxygen Reduction Reaction. Materials 2021, 14, 2448. [Google Scholar] [CrossRef]
- Gawande, M.B.; Fornasiero, P.; Zbořil, R. Carbon-Based Single-Atom Catalysts for Advanced Applications. ACS Catal. 2020, 10, 2231–2259. [Google Scholar] [CrossRef]
- Haruta, M. Gold as a Novel Catalyst in the 21st Century: Preparation, Working Mechanism and Applications. Gold Bull. 2004, 37, 27–36. [Google Scholar] [CrossRef]
- Bruix, A.; Lykhach, Y.; Matolínová, I.; Neitzel, A.; Skála, T.; Tsud, N.; Vorokhta, M.; Stetsovych, V.; Ševčíková, K.; Mysliveček, J.; et al. Maximum Noble-Metal Efficiency in Catalytic Materials: Atomically Dispersed Surface Platinum. Angew. Chem.—Int. Ed. 2014, 53, 10525–10530. [Google Scholar] [CrossRef]
- Slavinskaya, E.M.; Zadesenets, A.V.; Stonkus, O.A.; Stadnichenko, A.I.; Shchukarev, A.V.; Shubin, Y.V.; Korenev, S.V.; Boronin, A.I. Thermal Activation of Pd/CeO2-SnO2 Catalysts for Low-Temperature CO Oxidation. Appl. Catal. B Environ. 2020, 277, 119275. [Google Scholar] [CrossRef]
- Bao, W.; Chen, H.; Wang, H.; Zhang, R.; Wei, Y.; Zheng, L. Pt Nanoparticles Supported on N/Ce-Doped Activated Carbon for the Catalytic Oxidation of Formaldehyde at Room Temperature. ACS Appl. Nano Mater. 2020, 3, 2614–2624. [Google Scholar] [CrossRef]
- Wang, M.; Ma, P.; Wu, Z.; Chu, S.; Zheng, Y.; Zhou, Z.; Weng, W. Evolution of Pd Chemical States and Effects of C3H6 and H2O on the CO Oxidation over Pd/CeO2 Catalyst. Appl. Surf. Sci. 2022, 599, 153897. [Google Scholar] [CrossRef]
- Ma, K.; Liao, W.; Shi, W.; Xu, F.; Zhou, Y.; Tang, C.; Lu, J.; Shen, W.; Zhang, Z. Ceria-Supported Pd Catalysts with Different Size Regimes Ranging from Single Atoms to Nanoparticles for the Oxidation of CO. J. Catal. 2022, 407, 104–114. [Google Scholar] [CrossRef]
- Zhu, H.; Qin, Z.; Shan, W.; Shen, W.; Wang, J. Low-Temperature Oxidation of CO over Pd/CeO2-TiO2 Catalysts with Different Pretreatments. J. Catal. 2005, 233, 41–50. [Google Scholar] [CrossRef]
- Shaikhutdinov, S. Strong Metal–Support Interaction and Reactivity of Ultrathin Oxide Films. Catal. Lett. 2018, 148, 2627–2635. [Google Scholar] [CrossRef]
- Bugrova, T.A.; Kharlamova, T.S.; Svetlichnyi, V.A.; Savel’eva, A.S.; Salaev, M.A.; Mamontov, G.V. Insights into Formation of Pt Species in Pt/CeO2 Catalysts: Effect of Treatment Conditions and Metal-Support Interaction. Catal. Today 2021, 375, 36–47. [Google Scholar] [CrossRef]
- Wang, S.; Wang, Y.; Wang, F. Room Temperature HCHO Oxidation over the Pt/CeO2 Catalysts with Different Oxygen Mobilities by Changing Ceria Shapes. Appl. Catal. A Gen. 2022, 630, 118469. [Google Scholar] [CrossRef]
- Pereira-Hernández, X.I.; DeLaRiva, A.; Muravev, V.; Kunwar, D.; Xiong, H.; Sudduth, B.; Engelhard, M.; Kovarik, L.; Hensen, E.J.M.; Wang, Y.; et al. Tuning Pt-CeO2 Interactions by High-Temperature Vapor-Phase Synthesis for Improved Reducibility of Lattice Oxygen. Nat. Commun. 2019, 10, 1358. [Google Scholar] [CrossRef]
- Gänzler, A.M.; Casapu, M.; Vernoux, P.; Loridant, S.; Cadete Santos Aires, F.J.; Epicier, T.; Betz, B.; Hoyer, R.; Grunwaldt, J.D. Tuning the Structure of Platinum Particles on Ceria In Situ for Enhancing the Catalytic Performance of Exhaust Gas Catalysts. Angew. Chem.—Int. Ed. 2017, 56, 13078–13082. [Google Scholar] [CrossRef]
- Boronin, A.I.; Slavinskaya, E.M.; Figueroba, A.; Stadnichenko, A.I.; Kardash, T.Y.; Stonkus, O.A.; Fedorova, E.A.; Muravev, V.V.; Svetlichnyi, V.A.; Bruix, A.; et al. CO Oxidation Activity of Pt/CeO2 Catalysts below 0 °C: Platinum Loading Effects. Appl. Catal. B Environ. 2021, 286, 119931. [Google Scholar] [CrossRef]
- Derevyannikova, E.A.; Kardash, T.Y.; Stadnichenko, A.I.; Stonkus, O.A.; Slavinskaya, E.M.; Svetlichnyi, V.A.; Boronin, A.I. Structural Insight into Strong Pt−CeO2 Interaction: From Single Pt Atoms to PtO. J. Phys. Chem. C 2018, 123, 1320–1334. [Google Scholar] [CrossRef]
- Zalomaeva, O.V.; Podyacheva, O.Y.; Suboch, A.N.; Kibis, L.S.; Kholdeeva, O.A. Aerobic Oxidation of Syringyl Alcohol over N-Doped Carbon Nanotubes. Appl. Catal. A Gen. 2022, 629, 118424. [Google Scholar] [CrossRef]
- Khranenko, S.P.; Baidina, I.A.; Gromilov, S.A. Crystal Structure Refinement for Trans-[Pd(NO3)2(H2O)2]. J. Struct. Chem. 2007, 48, 1152–1155. [Google Scholar] [CrossRef]
- Vasilchenko, D.; Topchiyan, P.; Berdyugin, S.; Filatov, E.; Tkachev, S.; Baidina, I.; Komarov, V.; Slavinskaya, E.; Stadnichenko, A.; Gerasimov, E. Tetraalkylammonium Salts of Platinum Nitrato Complexes: Isolation, Structure, and Relevance to the Preparation of PtOx/CeO2 Catalysts for Lowerature CO Oxidation. Inorg. Chem. 2019, 58, 6075–6087. [Google Scholar] [CrossRef] [PubMed]
- Slavinskaya, E.M.; Stonkus, O.A.; Gulyaev, R.V.; Ivanova, A.S.; Zaikovskii, V.I.; Kuznetsov, P.A.; Boronin, A.I. Structural and Chemical States of Palladium in Pd/Al2O3 Catalysts under Self-Sustained Oscillations in Reaction of CO Oxidation. Appl. Catal. A Gen. 2011, 401, 83–97. [Google Scholar] [CrossRef]
- Barr, T.L. An ESCA Study of the Termination of the Passivation of Elemental Metals. J. Phys. Chem. 1978, 82, 1801–1810. [Google Scholar] [CrossRef]
- Fleisch, T.H.; Mains, G.J. Photoreduction and Reoxidation of Platinum Oxide and Palladium Oxide Surfaces. J. Phys. Chem. 1986, 90, 5317–5320. [Google Scholar] [CrossRef]
- Kibis, L.S.; Titkov, A.I.; Stadnichenko, A.I.; Koscheev, S.V.; Boronin, A.I. X-Ray Photoelectron Spectroscopy Study of Pd Oxidation by RF Discharge in Oxygen. Appl. Surf. Sci. 2009, 255, 9248–9254. [Google Scholar] [CrossRef]
- Neitzel, A.; Figueroba, A.; Lykhach, Y.; Skála, T.; Vorokhta, M.; Tsud, N.; Mehl, S.; Ševčíková, K.; Prince, K.C.; Neyman, K.M.; et al. Atomically Dispersed Pd, Ni, and Pt Species in Ceria-Based Catalysts: Principal Differences in Stability and Reactivity. J. Phys. Chem. C 2016, 120, 9852–9862. [Google Scholar] [CrossRef]
- Muravev, V.; Spezzati, G.; Su, Y.-Q.; Parastaev, A.; Chiang, F.-K.; Longo, A.; Escudero, C.; Kosinov, N.; Hensen, E.J.M. Interface Dynamics of Pd–CeO2 Single-Atom Catalysts during CO Oxidation. Nat. Catal. 2021, 4, 469–478. [Google Scholar] [CrossRef]
- Fiala, R.; Vaclavu, M.; Rednyk, A.; Khalakhan, I.; Vorokhta, M.; Lavkova, J.; Potin, V.; Matolinova, I.; Matolin, V. Pt–CeOx Thin Film Catalysts for PEMFC. Catal. Today 2015, 240, 236–241. [Google Scholar] [CrossRef]
- Vorokhta, M.; Khalakhan, I.; Matolínová, I.; Nováková, J.; Haviar, S.; Lančok, J.; Novotný, M.; Yoshikawa, H.; Matolín, V. PLD Prepared Nanostructured Pt-CeO2 Thin Films Containing Ionic Platinum. Appl. Surf. Sci. 2017, 396, 278–283. [Google Scholar] [CrossRef]
- Vovk, E.I.; Kalinkin, A.V.; Smirnov, M.Y.; Klembovskii, I.O.; Bukhtiyarov, V.I. XPS Study of Stability and Reactivity of Oxidized Pt Nanoparticles Supported on TiO2. J. Phys. Chem. C 2017, 121, 17297–17304. [Google Scholar] [CrossRef]
- Suboch, A.N.; Cherepanova, S.V.; Kibis, L.S.; Svintsitskiy, D.A.; Stonkus, O.A.; Boronin, A.I.; Chesnokov, V.V.; Romanenko, A.I.; Ismagilov, Z.R.; Podyacheva, O.Y. Observation of the Superstructural Diffraction Peak in the Nitrogen Doped Carbon Nanotubes: Simulation of the Structure. Fuller. Nanotub. Carbon Nanostr. 2016, 24, 520–530. [Google Scholar] [CrossRef]
- Cargnello, M.; Jaén, J.J.D.; Garrido, J.C.H.; Bakhmutsky, K.; Montini, T.; Gámez, J.J.C.; Gorte, R.J.; Fornasiero, P. Exceptional Activity for Methane Combustion over Modular Pd@CeO2 Subunits on Functionalized Al2O3. Science 2012, 337, 713–717. [Google Scholar] [CrossRef]
- Danielis, M.; Colussi, S.; de Leitenburg, C.; Soler, L.; Llorca, J.; Trovarelli, A. Outstanding Methane Oxidation Performance of Palladium-Embedded Ceria Catalysts Prepared by a One-Step Dry Ball-Milling Method. Angew. Chem.—Int. Ed. 2018, 57, 10212–10216. [Google Scholar] [CrossRef]
- Xiong, H.; Wiebenga, M.H.; Carrillo, C.; Gaudet, J.R.; Pham, H.N.; Kunwar, D.; Oh, S.H.; Qi, G.; Kim, C.H.; Datye, A.K. Design Considerations for Low-Temperature Hydrocarbon Oxidation Reactions on Pd Based Catalysts. Appl. Catal. B Environ. 2018, 236, 436–444. [Google Scholar] [CrossRef]
- Xiong, H.; Kunwar, D.; Jiang, D.; García-Vargas, C.E.; Li, H.; Du, C.; Canning, G.; Pereira-Hernandez, X.I.; Wan, Q.; Lin, S.; et al. Engineering Catalyst Supports to Stabilize PdOx Two-Dimensional Rafts for Water-Tolerant Methane Oxidation. Nat. Catal. 2021, 4, 830–839. [Google Scholar] [CrossRef]
- Hellman, A.; Resta, A.; Martin, N.M.; Gustafson, J.; Trinchero, A.; Carlsson, P.-A.; Balmes, O.; Felici, R.; van Rijn, R.; Frenken, J.W.M.; et al. The Active Phase of Palladium during Methane Oxidation. J. Phys. Chem. Lett. 2012, 3, 678–682. [Google Scholar] [CrossRef]
- Martin, N.M.; Van Den Bossche, M.; Hellman, A.; Grönbeck, H.; Hakanoglu, C.; Gustafson, J.; Blomberg, S.; Johansson, N.; Liu, Z.; Axnanda, S.; et al. Intrinsic Ligand Effect Governing the Catalytic Activity of Pd Oxide Thin Films. ACS Catal. 2014, 4, 3330–3334. [Google Scholar] [CrossRef]


| Sample | SBET, m2/g | D(CeO2), nm | a(CeO2), Å | Δd/d(CeO2) | D(PdO), nm | D(Pt), nm | Rwp, % |
|---|---|---|---|---|---|---|---|
| Pd-Ce-C | 194 | 3(1) 1 | 5.432(1) | 0.36(2) | 8(1) | - | 5.1 |
| Pd-Ce-C-ox | 213 | 8(1) | 5.429(1) | 0.16(3) | 8(1) | - | 4.6 |
| Pt-Ce-C | 168 | 3(1) | 5.425(1) | 0.30(3) | - | 3(1) | 4.3 |
| Pt-Ce-C-ox | 215 | 3(1) | 5.434(1) | 0.25(1) | - | 6(3) 2 | 5.9 |
| MWCNTs | 180 | - | - | - | - | - | - |
Publisher’s Note: MDPI stays neutral with regard to jurisdictional claims in published maps and institutional affiliations. |
© 2022 by the authors. Licensee MDPI, Basel, Switzerland. This article is an open access article distributed under the terms and conditions of the Creative Commons Attribution (CC BY) license (https://creativecommons.org/licenses/by/4.0/).
Share and Cite
Kibis, L.; Zadesenets, A.; Garkul, I.; Korobova, A.; Kardash, T.; Slavinskaya, E.; Stonkus, O.; Korenev, S.; Podyacheva, O.; Boronin, A. Pd-Ce-Ox/MWCNTs and Pt-Ce-Ox/MWCNTs Composite Materials: Morphology, Microstructure, and Catalytic Properties. Materials 2022, 15, 7485. https://doi.org/10.3390/ma15217485
Kibis L, Zadesenets A, Garkul I, Korobova A, Kardash T, Slavinskaya E, Stonkus O, Korenev S, Podyacheva O, Boronin A. Pd-Ce-Ox/MWCNTs and Pt-Ce-Ox/MWCNTs Composite Materials: Morphology, Microstructure, and Catalytic Properties. Materials. 2022; 15(21):7485. https://doi.org/10.3390/ma15217485
Chicago/Turabian StyleKibis, Lidiya, Andrey Zadesenets, Ilia Garkul, Arina Korobova, Tatyana Kardash, Elena Slavinskaya, Olga Stonkus, Sergey Korenev, Olga Podyacheva, and Andrei Boronin. 2022. "Pd-Ce-Ox/MWCNTs and Pt-Ce-Ox/MWCNTs Composite Materials: Morphology, Microstructure, and Catalytic Properties" Materials 15, no. 21: 7485. https://doi.org/10.3390/ma15217485
APA StyleKibis, L., Zadesenets, A., Garkul, I., Korobova, A., Kardash, T., Slavinskaya, E., Stonkus, O., Korenev, S., Podyacheva, O., & Boronin, A. (2022). Pd-Ce-Ox/MWCNTs and Pt-Ce-Ox/MWCNTs Composite Materials: Morphology, Microstructure, and Catalytic Properties. Materials, 15(21), 7485. https://doi.org/10.3390/ma15217485