1. Introduction
Steel structures are booming in this era, but some problems remain in their engineering application, such as low rigidity and poor fire resistance in high-rise buildings [
1]. With the increase in building floors, reinforced concrete structures are prone to form short columns that are unfavorable for anti-seismicity and need to be controlled by some structural measures [
2]. A concrete-filled steel tube is a kind of composite structure formed by filling steel tubes with concrete [
3]. According to the different cross-sectional forms, they are divided into circular, square, and polygonal concrete-filled steel tubes [
4]. The concrete-filled steel tube has a good economic effect. It can save 50% of the steel under the conditions of a similar weight and the same bearing capacity. The weight of the concrete and the components will be reduced by about 50% under the conditions of a similar amount of steel and the same bearing capacity [
5,
6,
7,
8,
9].
Klppol et al. [
10] carried out axial compression tests on 24 concrete-filled circular steel tube columns and derived the calculation formula for the bearing capacity of the concrete-filled circular steel tube columns. Furlong [
11] conducted axial compression and eccentric compression tests on 52 concrete-filled steel tube short columns. He observed the damage to the specimens and recorded the corresponding ultimate bearing capacity and put forward the formulas for the axial compression bearing capacity and the ultimate bearing capacity of concrete-filled square steel tube columns. Gardner et al. [
12] conducted axial compression tests on 22 concrete-filled circular steel tubes and found that when the concrete-filled steel tube column reached the ultimate bearing capacity, the steel had reached the state while the concrete still had not. Axial compression and compression-bending-shear tests on concrete-filled steel tubes were conducted by Tomii et al., and the influence of the section aspect ratio on the mechanical properties of concrete-filled steel tubes was obtained [
13].
Axial compression tests on 57 concrete-filled steel tubular columns were conducted by Cai et al. to study the influence of hoop coefficients on the ultimate bearing capacity of concrete-filled steel tubes, and the calculation formula for the ultimate bearing capacity was proposed [
14]. The compression-torsion, bending-torsion, compression-bending-torsion, and compression-bending-shear tests on concrete-filled steel tubes were conducted by Han et al. to study the working mechanism of concrete-filled steel tubes in complex stress states, and the calculation formula of the ultimate bearing capacity under various stress states was deduced [
15,
16,
17,
18]. Tan et al. [
19,
20] conducted axial compression tests on 18 ultra-high-strength circular steel tube columns and found that they did not deform significantly when they reached the ultimate load. The axial compression and eccentric compression tests on 14 concrete-filled steel tube columns with restraint rods were conducted by Cai et al. [
21] to investigate the influence of the material strength and restraint rod parameters on the concrete-filled steel tube. The result was that the existence of restraint rods can improve the ductility and ultimate bearing capacity of the components [
21,
22,
23].
Mansour et al. proposed equations that were derived based on the empirical models found in the literature and were set to estimate the shear capacity of normal-strength RC beams without stirrups [
24]. Continuous RC beams containing openings were the most affected among the analyzed locations. The reduction in load capacities ranged from 7.3 to 66.1% compared to the solid beam [
25]. Sakr et al. investigated the behavior of RC beams strengthened in shear capacity with UHPFRC. The results showed that strengthening RC beams using two UHPFRC plates improved the load-carrying capacity by 145% in comparison to the control beam [
26]. Hamoda et al. experimentally investigated the behavior of steel I-beams with/without high-strength bolted connectors embedded in the normal/steel fiber-reinforced concrete (SFRC). Composite action can exist not only in the composite structures but also when casing the critical joints with bolted connectors [
27]. A 3D numerical finite element model (FEM) is proposed to simulate the bond behavior between the concrete and the UHPFRC plates, and this study reviews the analytical models that can predict the relationship between the maximum bond stress and the slip for the strengthened concrete elements [
28]. The viscous UHPFRC material can fill the pores and the concaves on the NSC surface, causing the shear connectors to enhance the bond performance [
29]. The steel connectors prevented the debonding failure pattern and enhanced both the ultimate failure load and the ductility index [
30].
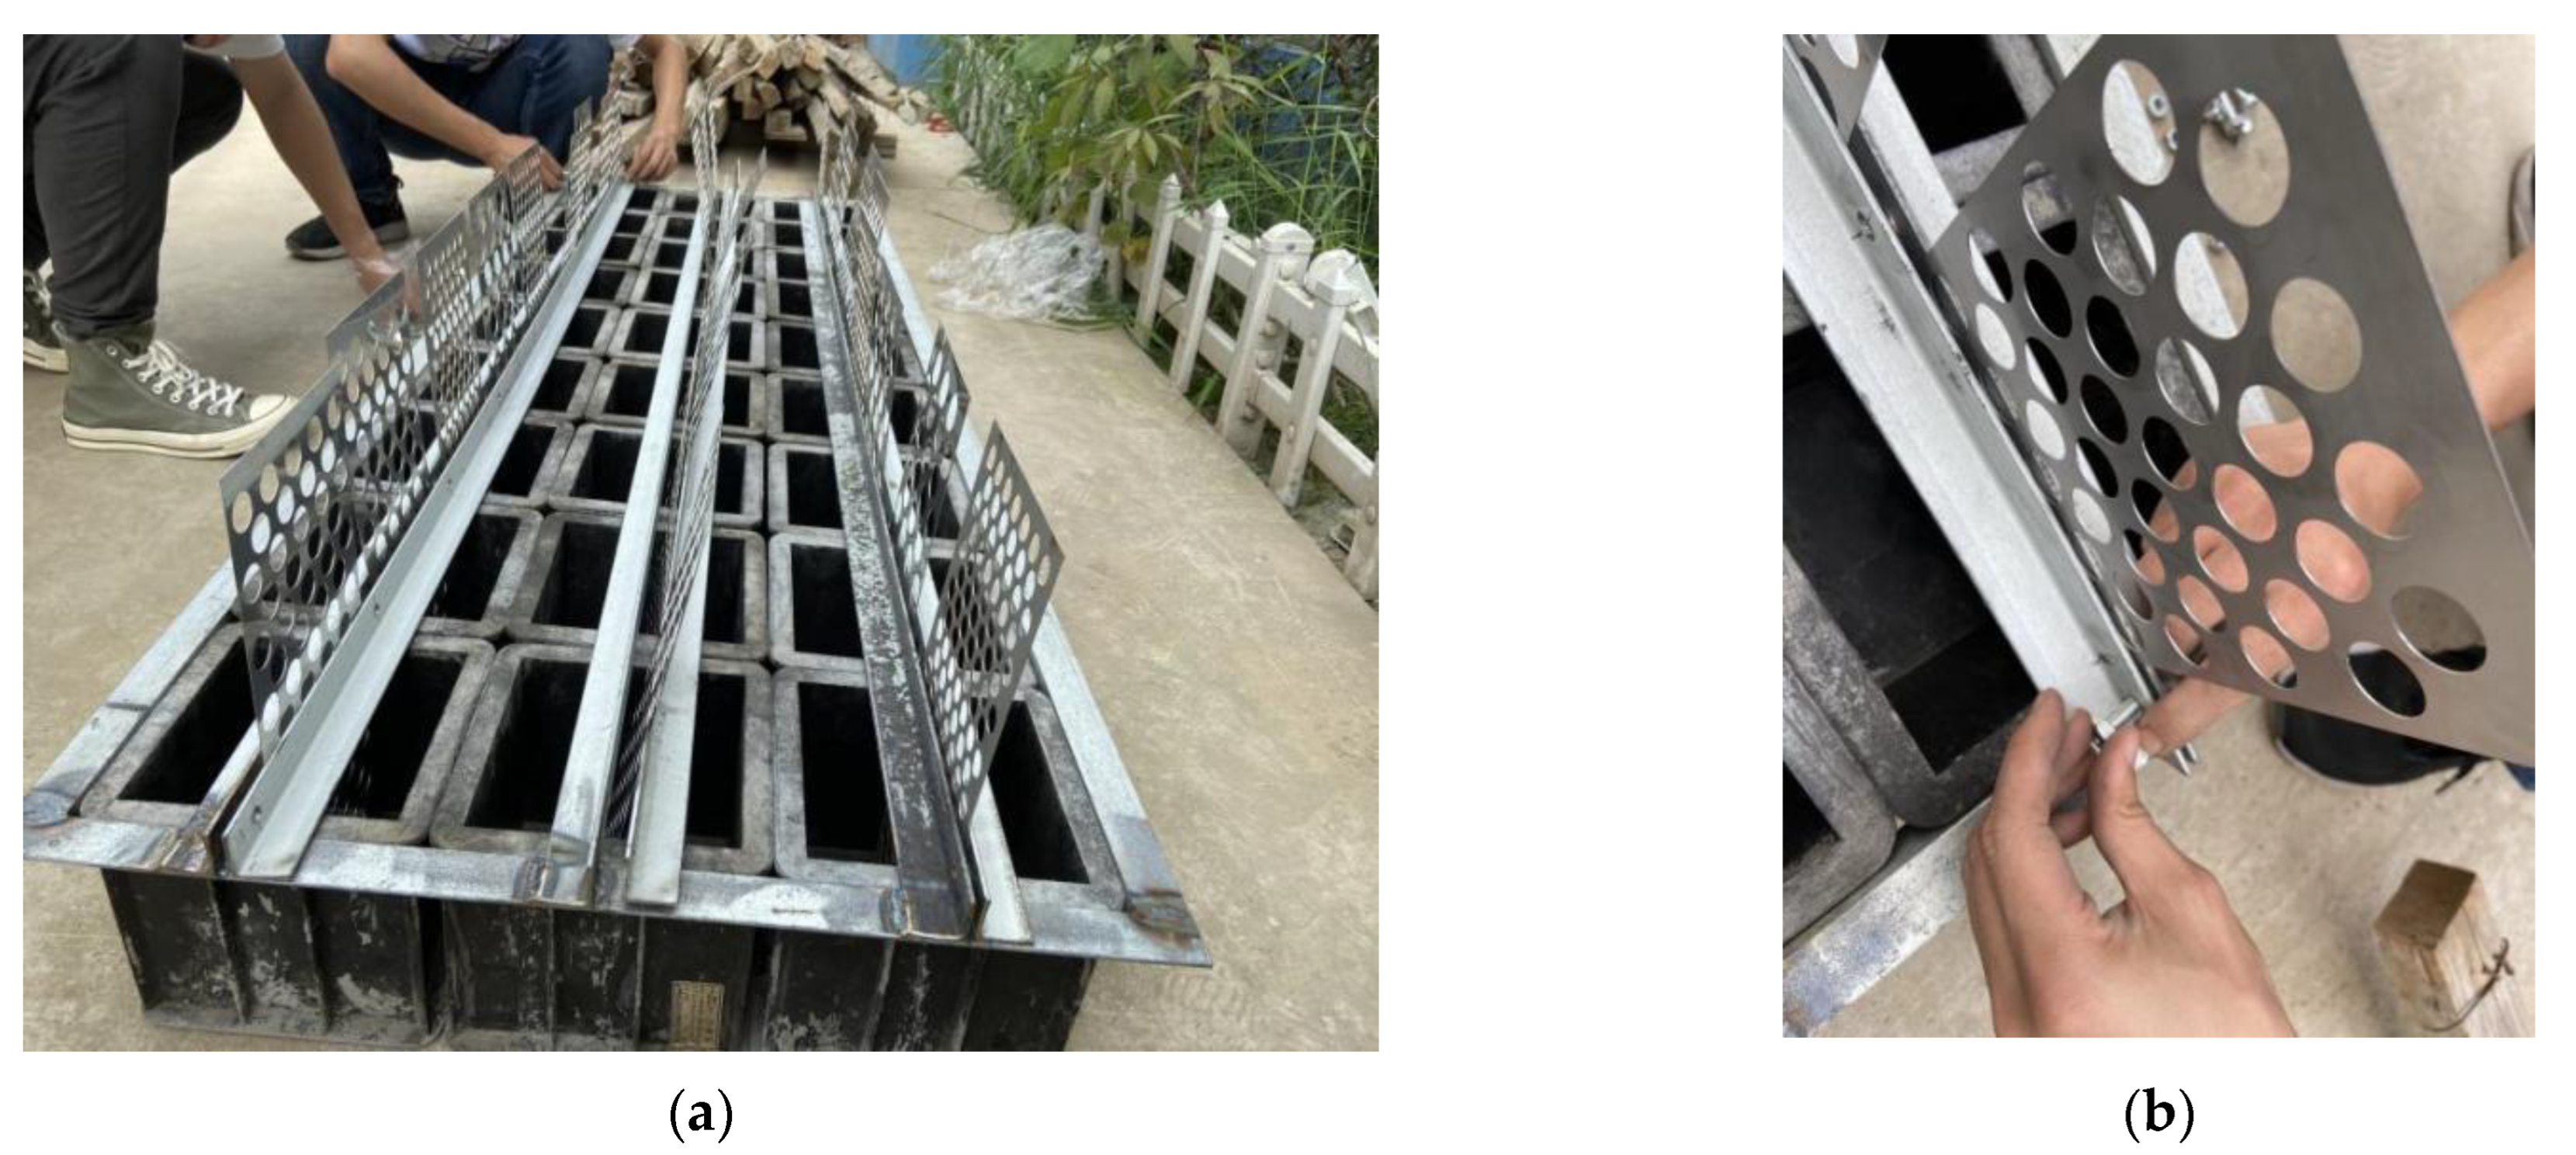
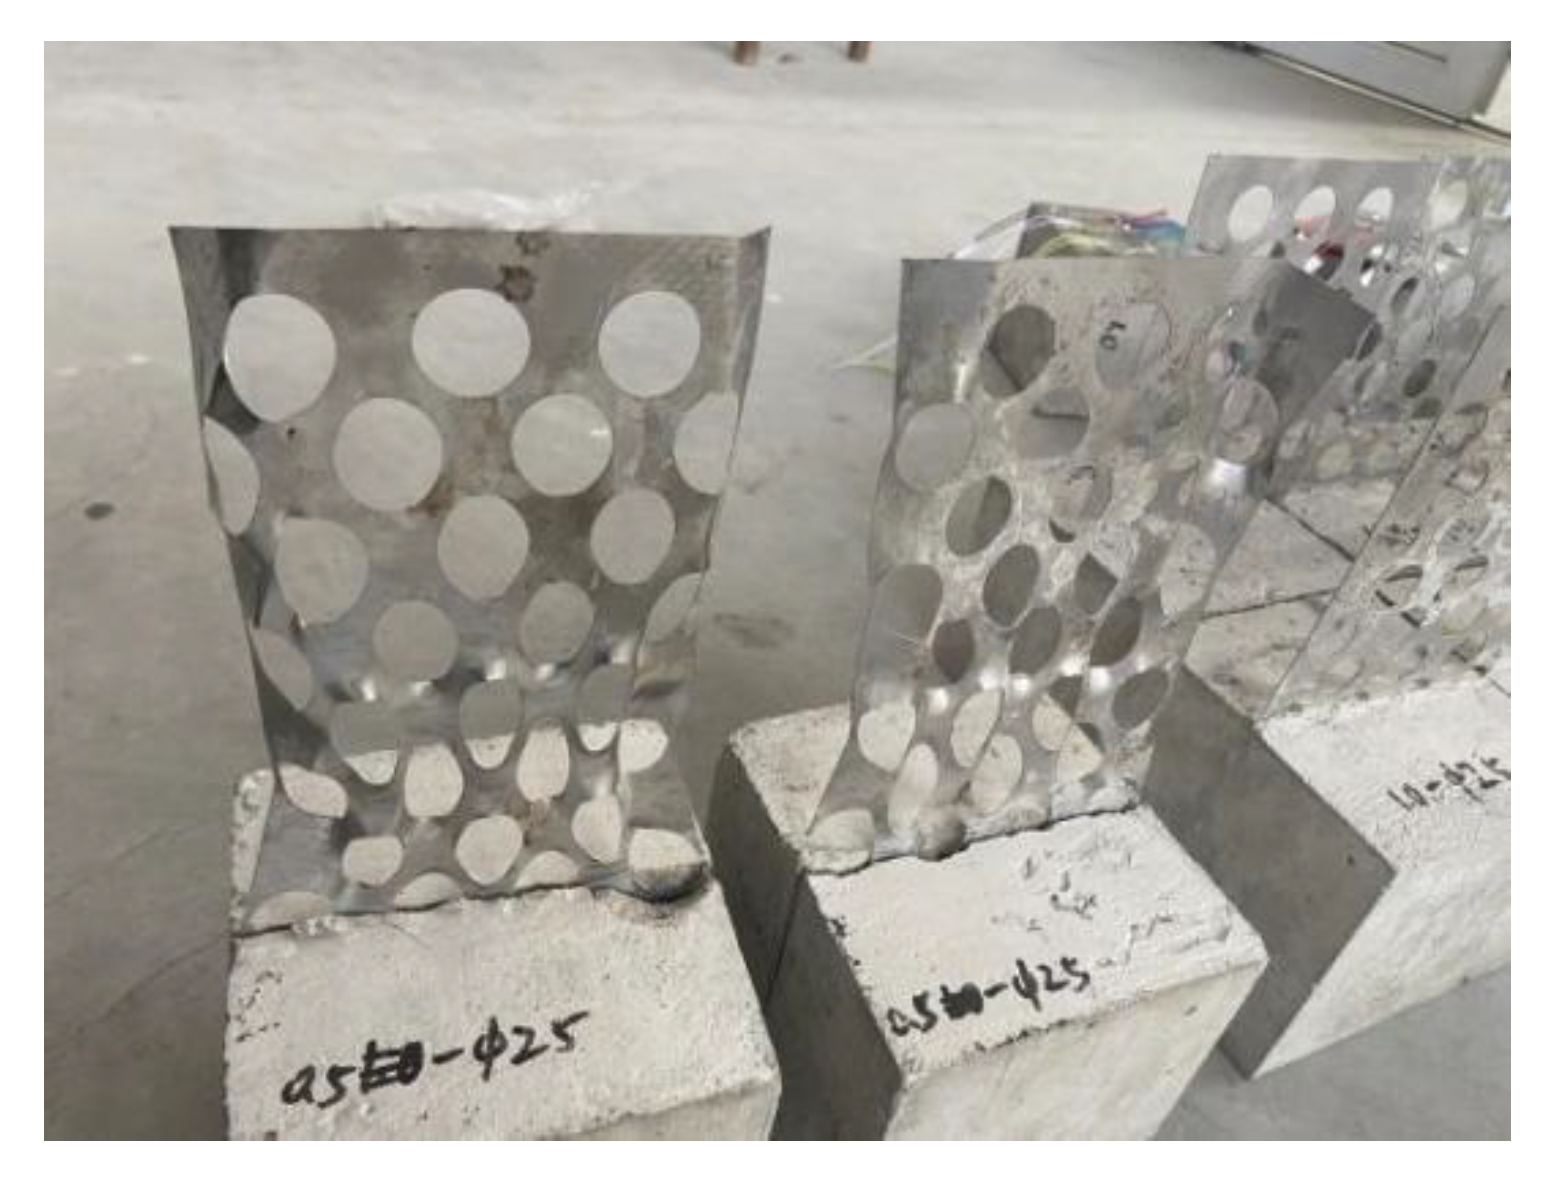
In order to promote the building industrialization, this paper introduces a new type of perforated steel plate reinforced concrete composite structure which incorporates the advantages of the concrete-filled steel tube structure. A compression test on 54 specimens and a pull test on 27 specimens were performed. Three factors, including the thickness of the steel plate, the hole diameter, and the hole spacing, and three levels for each factor were designed in the orthogonal test. Finite element analysis and data processing were performed, and the validity of the numerical simulations was verified by the test data. Through range analysis, the influence of these three factors on the compressive strength and the ultimate pull-out bearing capacity was quantified, and the optimum combinations were determined.
4. Finite Element Simulation
4.1. Compression Test Model
- (1)
Material constitutive
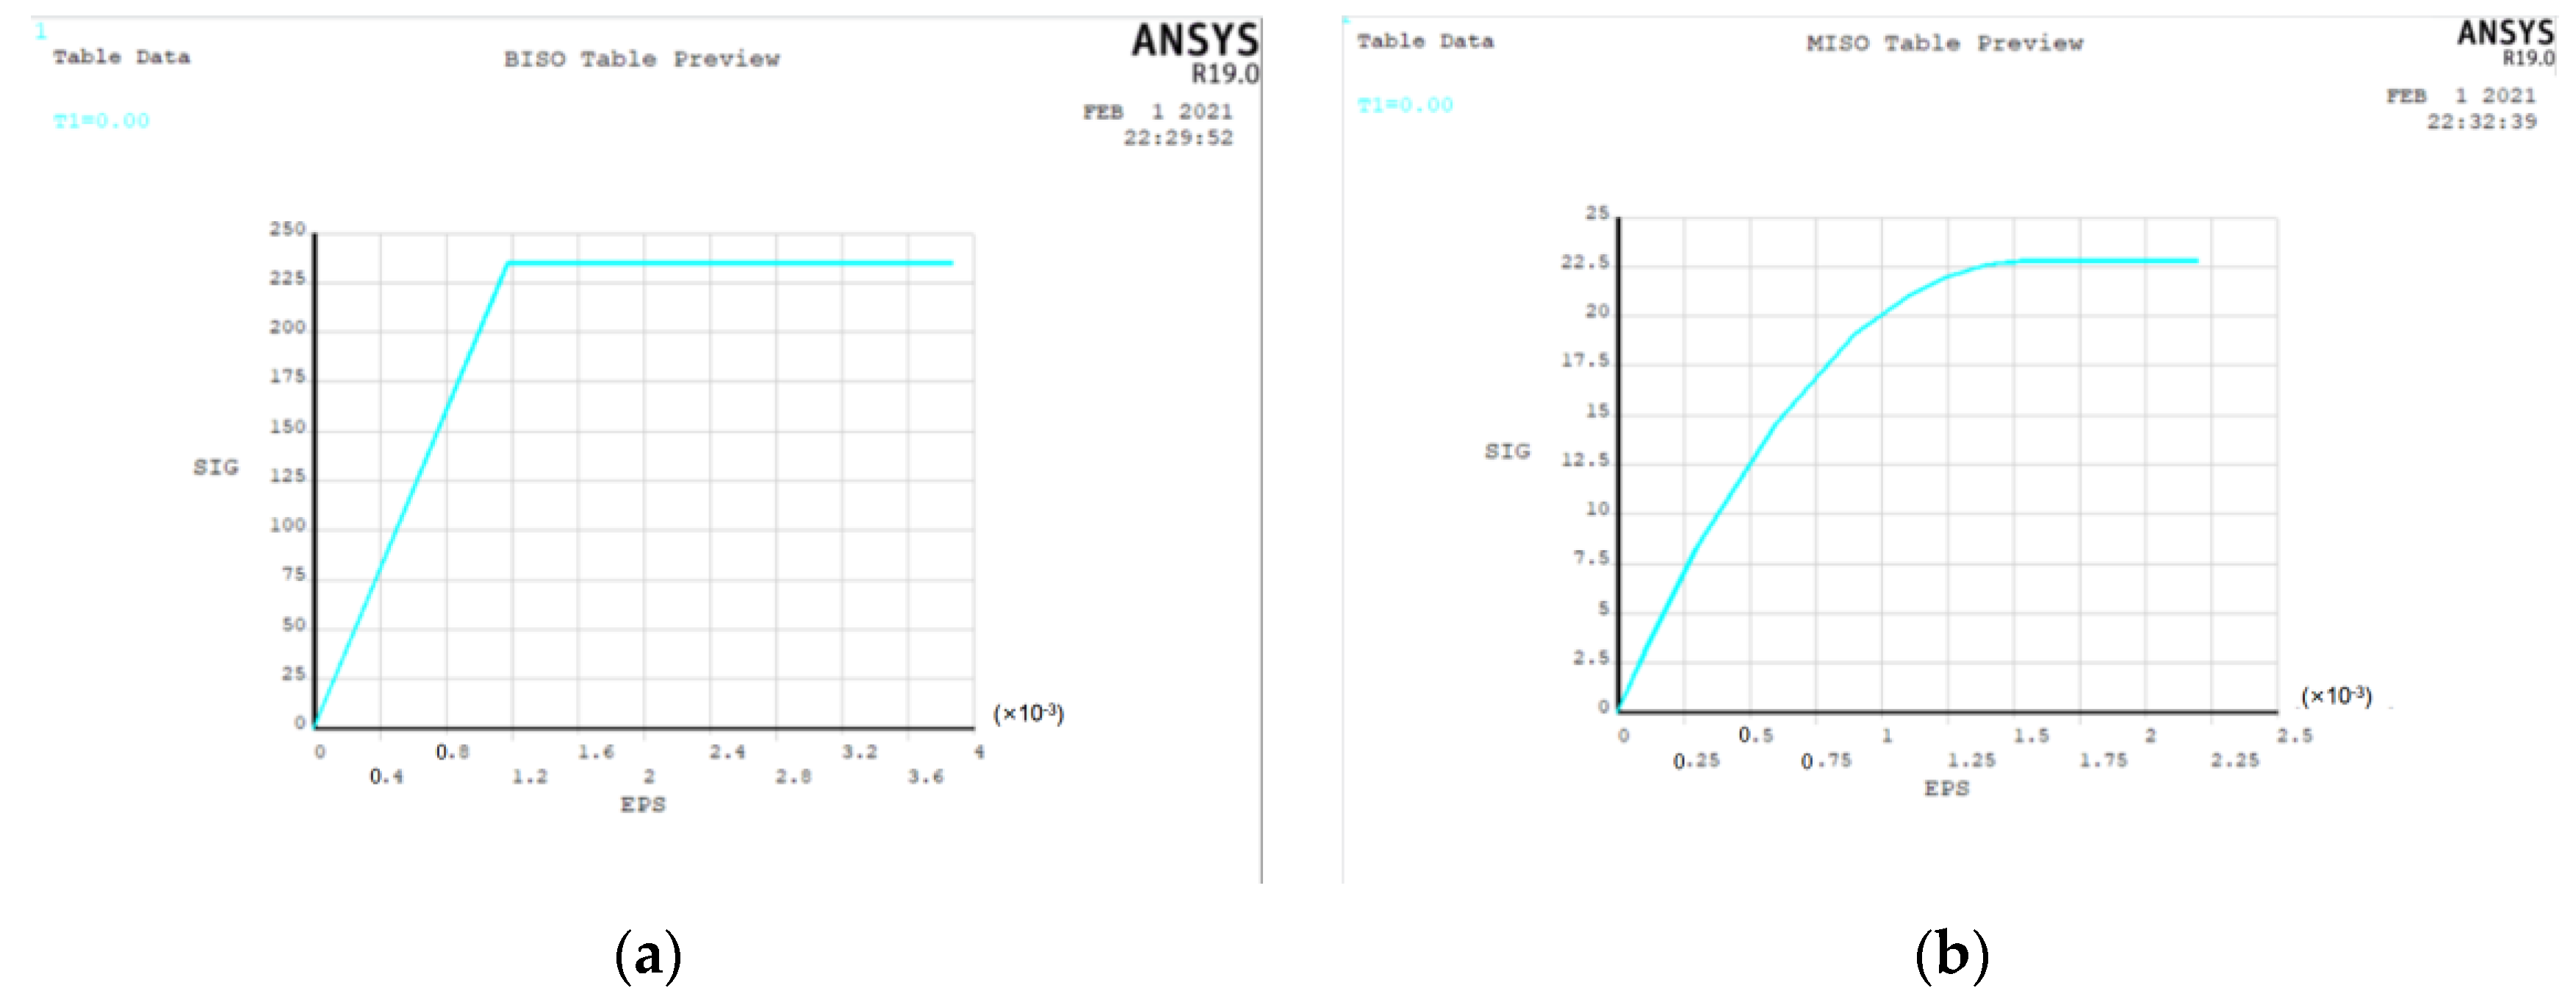
In the finite element method, the stress–strain relationship of steel adopts the Mises yield criterion [
37] and the William–Warnke five-parameter failure criterion [
38] for concrete. The constitutive relationship diagram is shown in
Figure 12 below.
- (2)
Parameter selection
Q235 steel and concrete with a strength grade of C30 were selected in this simulation. The material parameters of steel are shown in
Table 6, and the material parameters of concrete are shown in
Table 7.
- (3)
Selection of unit type
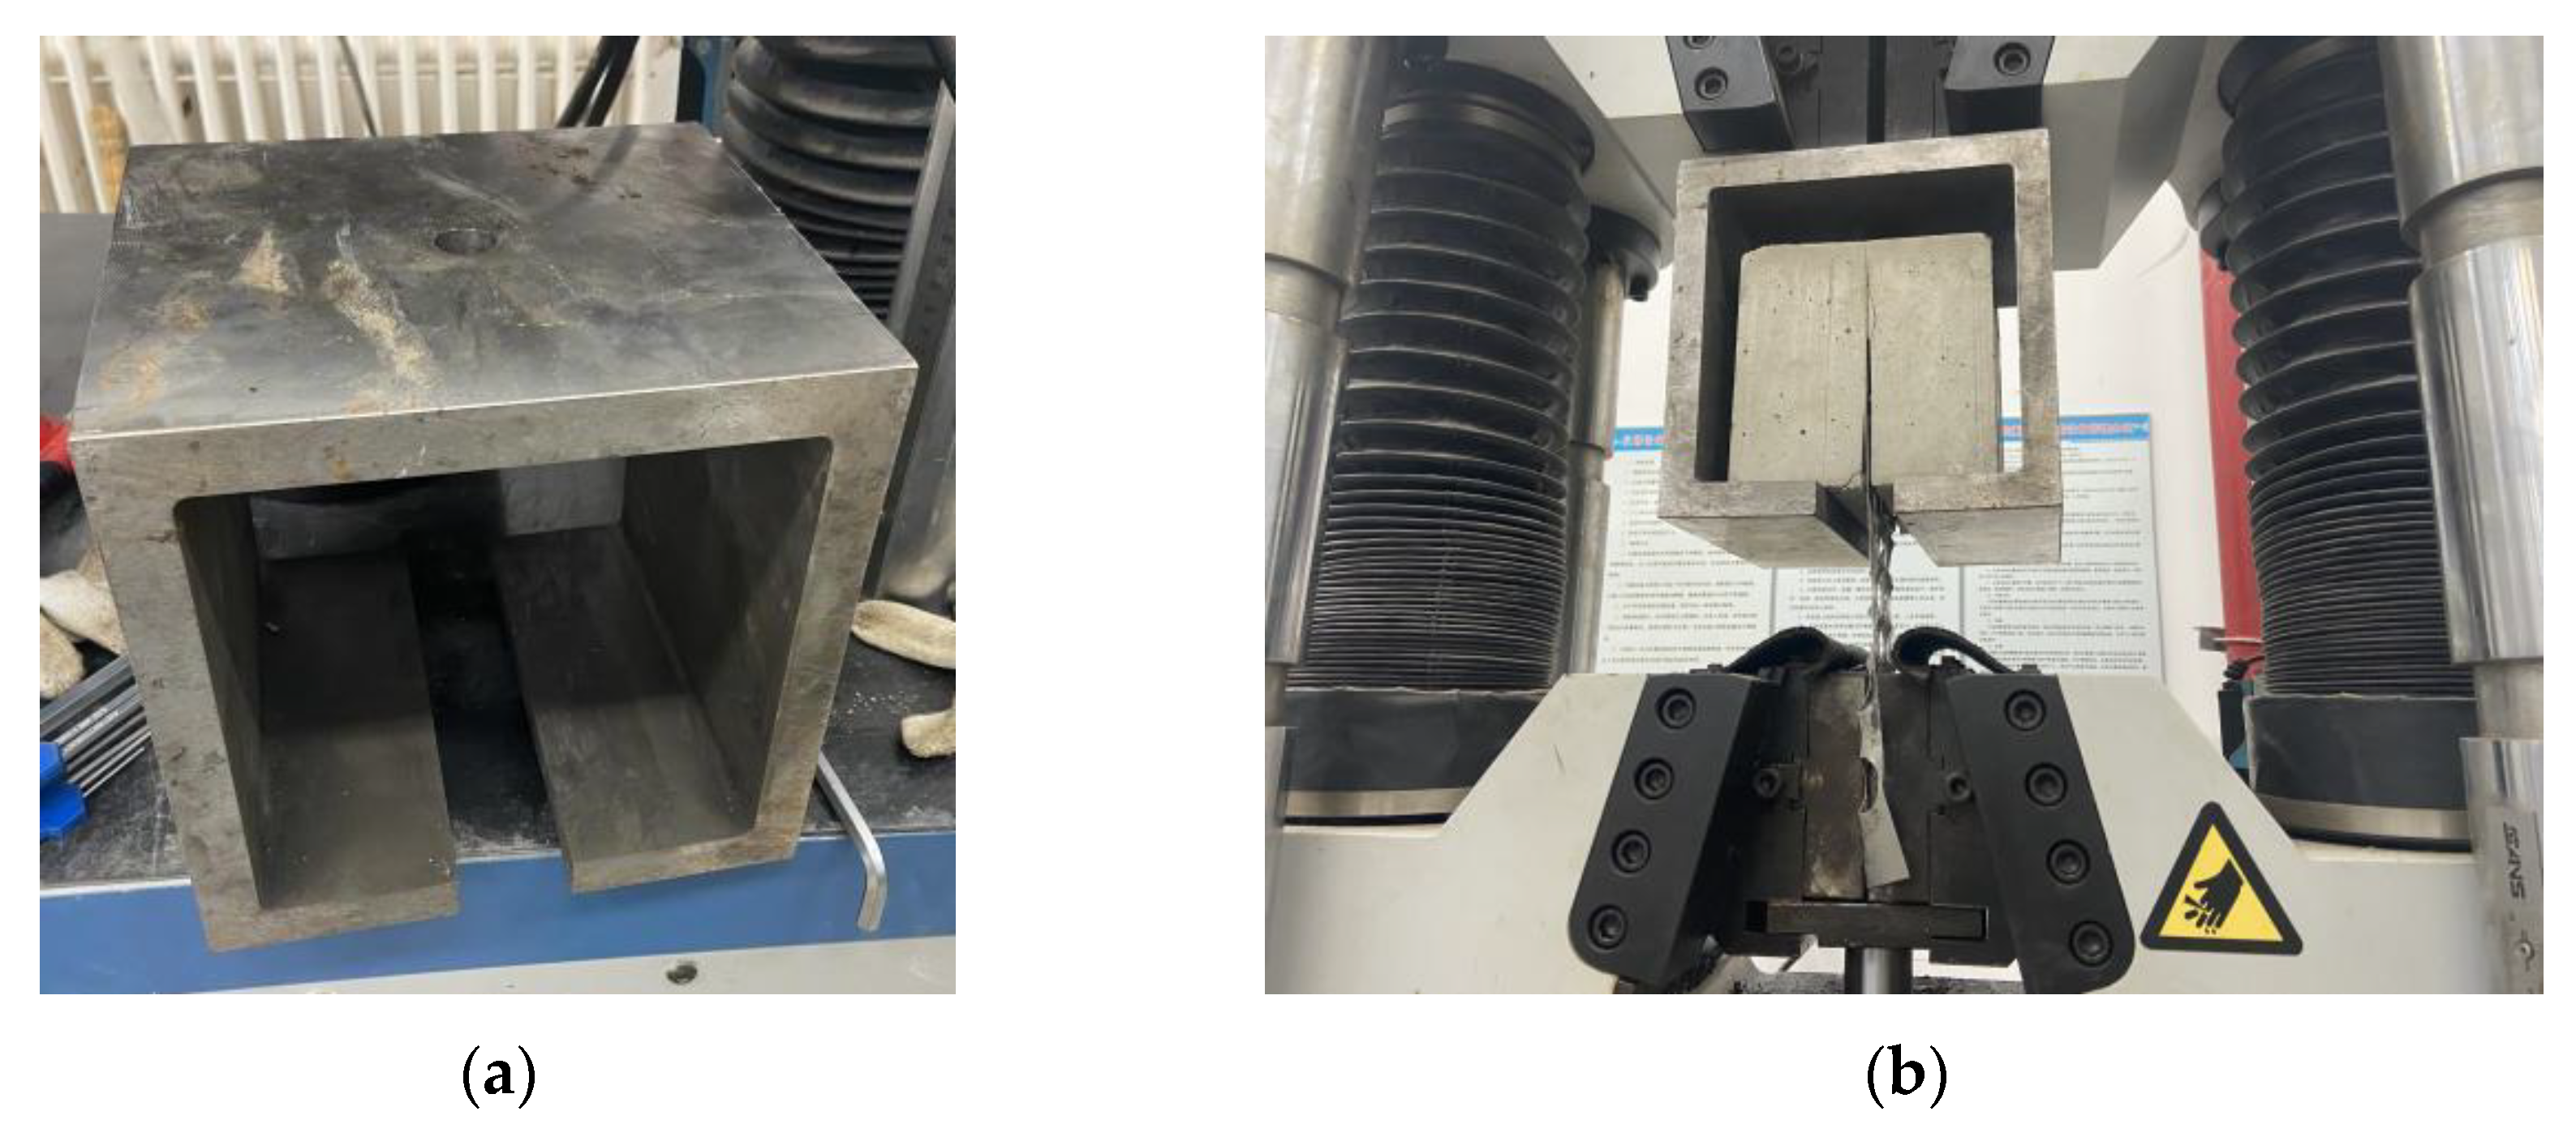
We performed several finite element simulations. Here, we present in detail the models where the plate thickness is 1 mm, the hole diameter is 20 mm, and the hole spacing is 10 mm. The perforated steel plate is modeled by Solid185, and the concrete is modeled by Solid65.
- (4)
Node connection, boundary conditions, and loading method
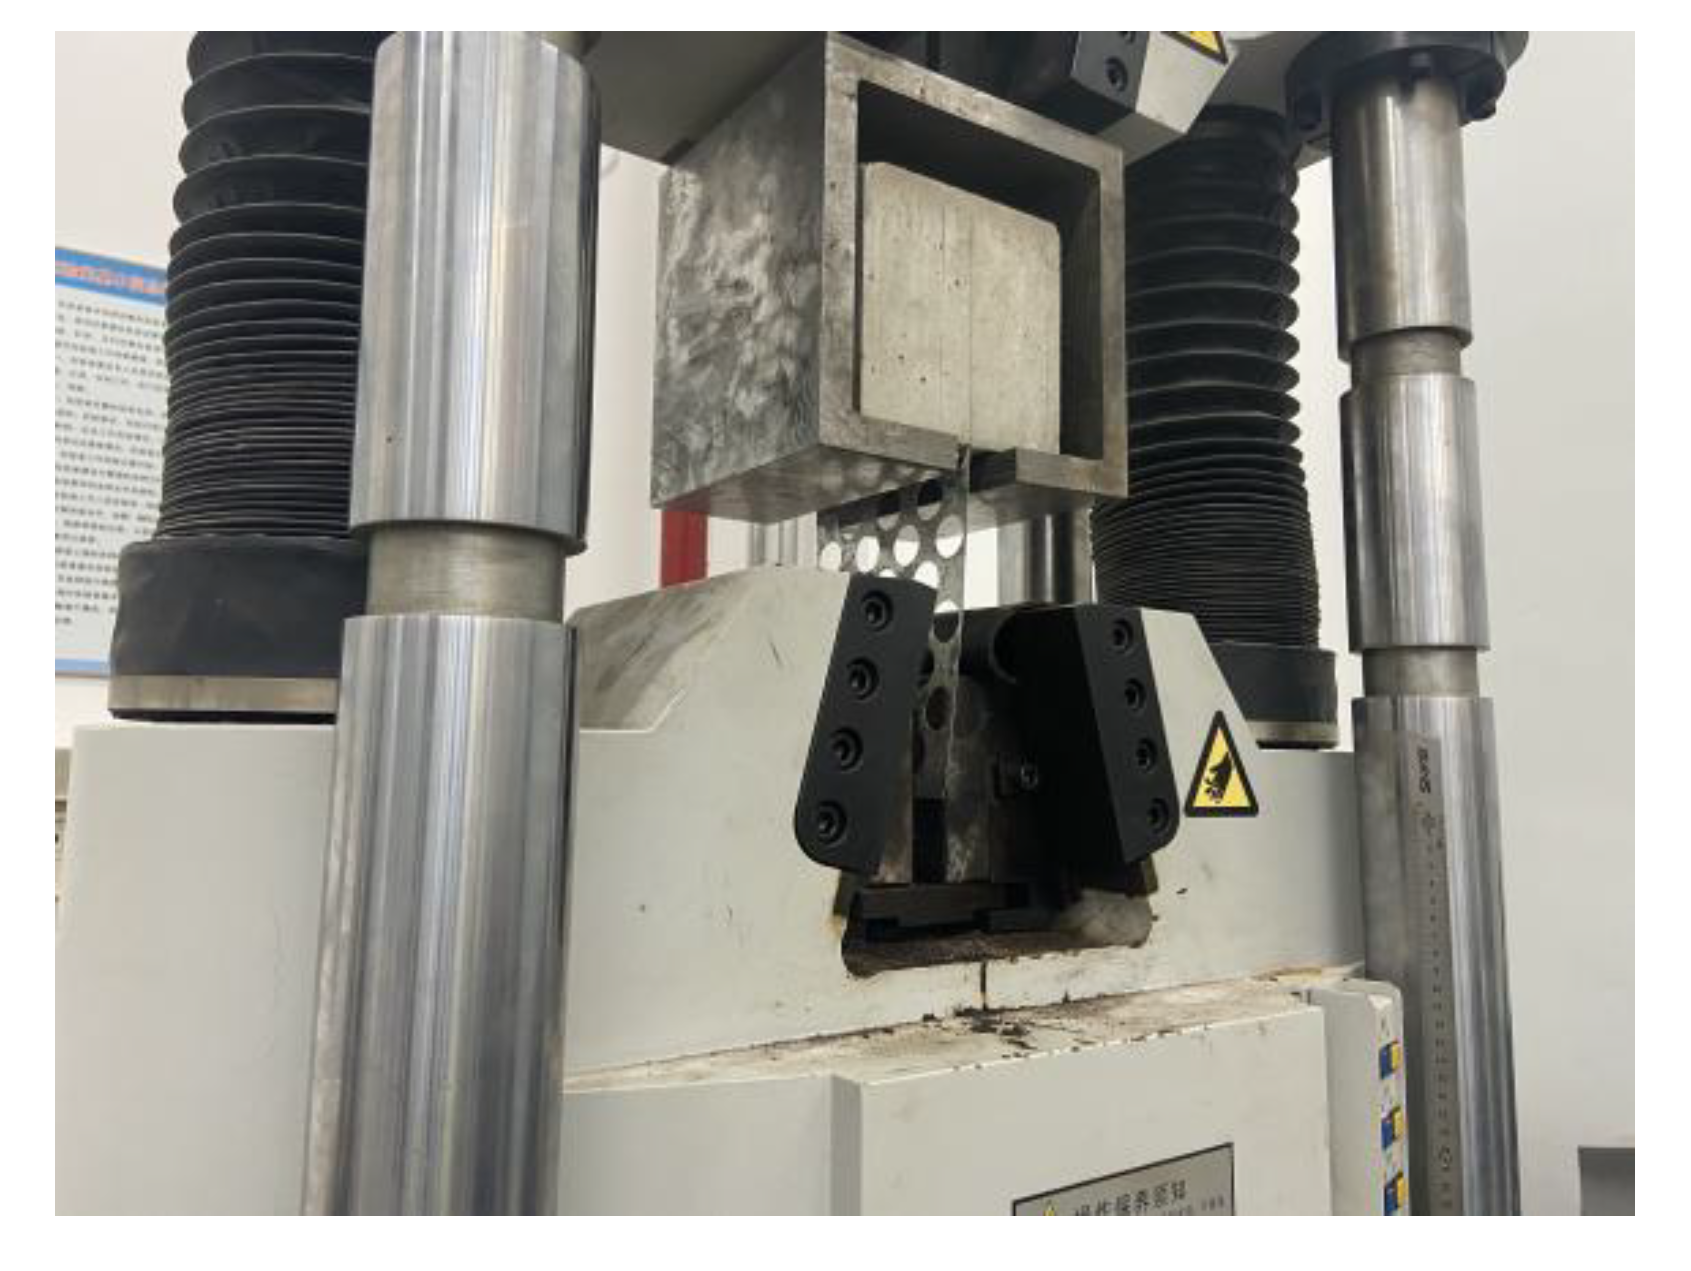
In the ANSYS finite element simulation produced by ANSYS Company in Pittsburgh, USA, the concrete and perforated steel plate are connected by the Merge command to make them become a whole to bear the force. This model simulates the concrete compression test; so, a full restraint is set at the center of the bottom, and a surface load is applied on the top.
- (5)
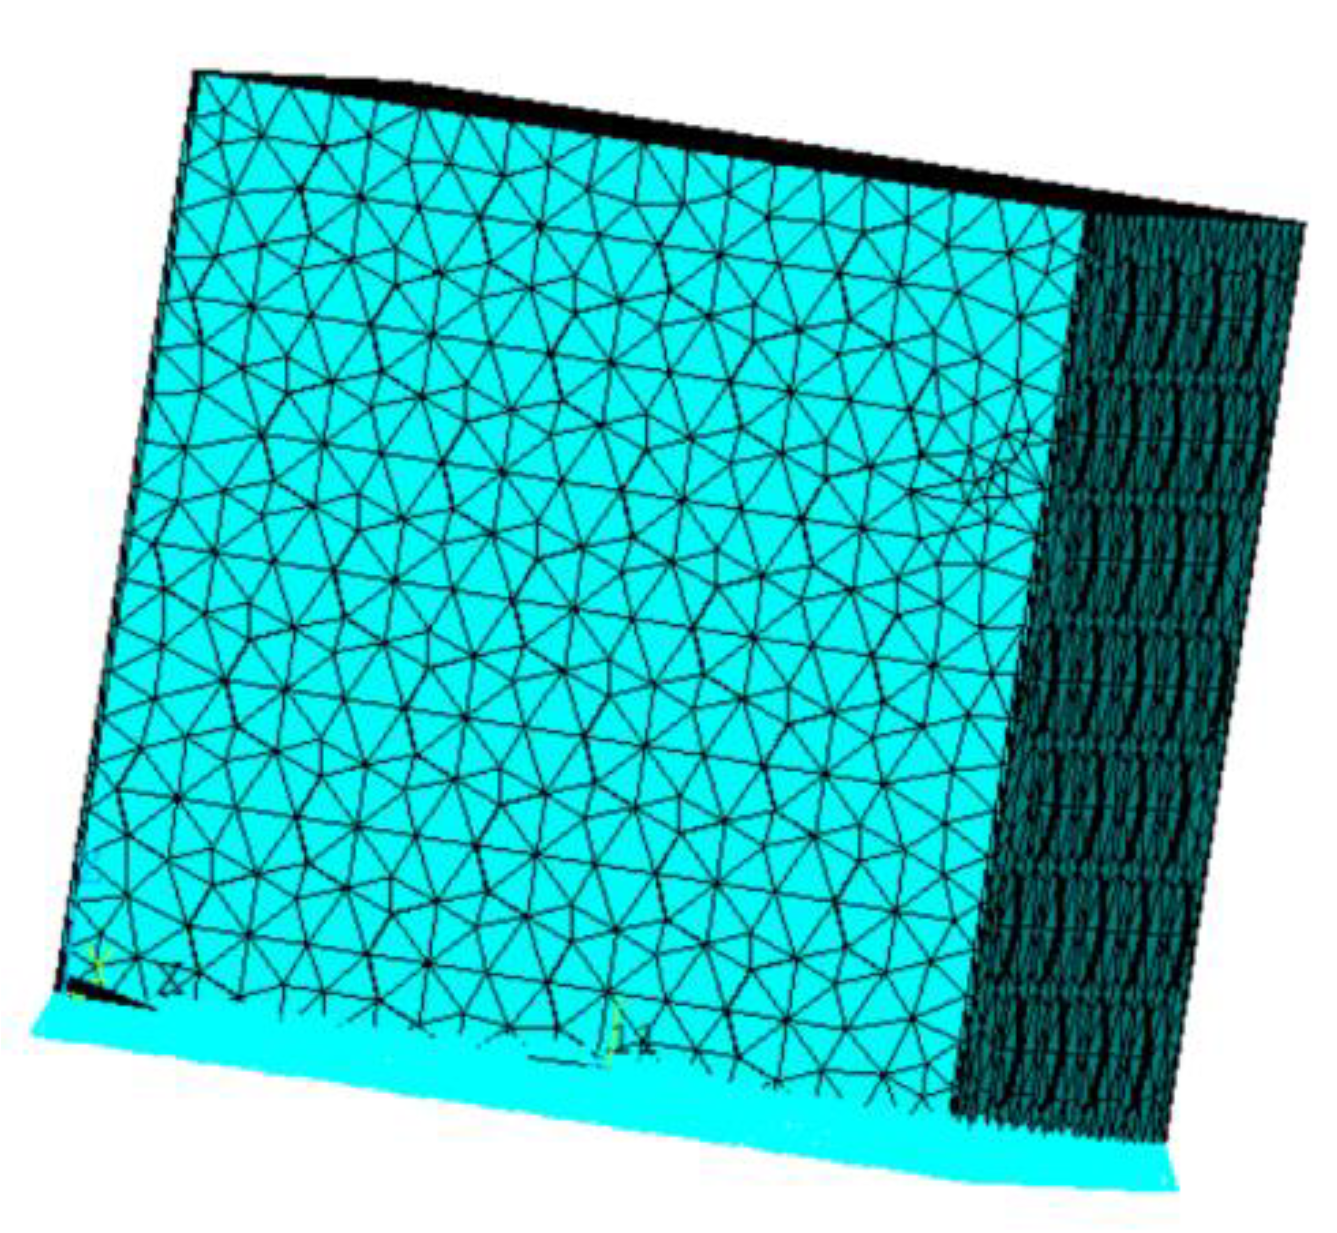
Meshing
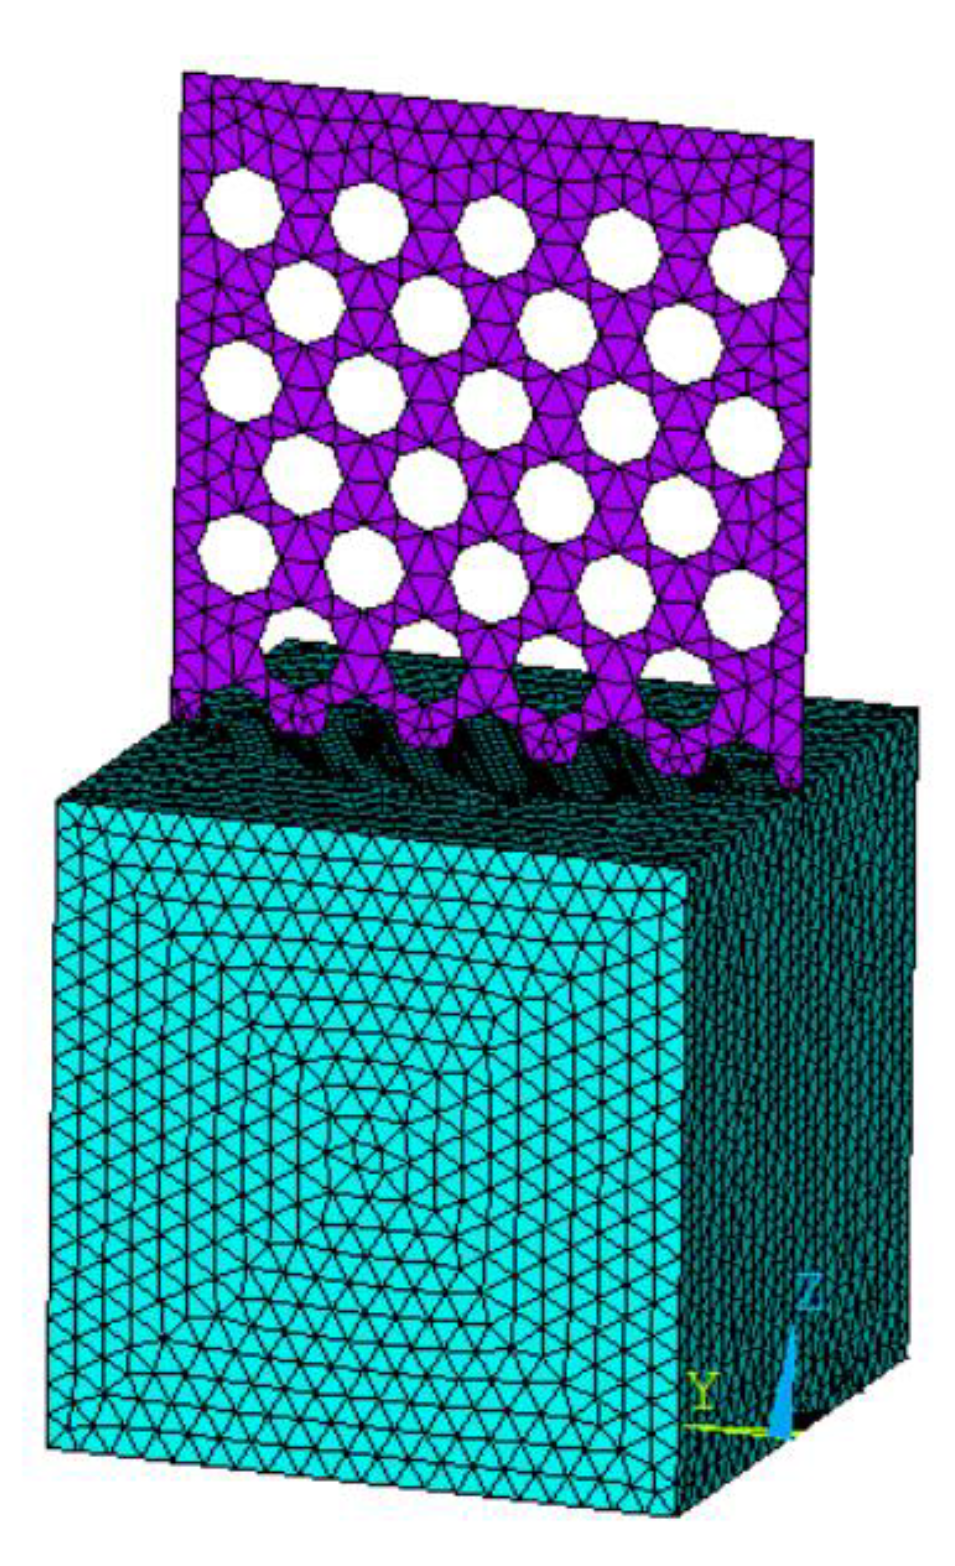
The meshing is shown in
Figure 13. In this way, the accuracy of the calculation results can be ensured, and meanwhile, the run time can be reduced as much as possible.
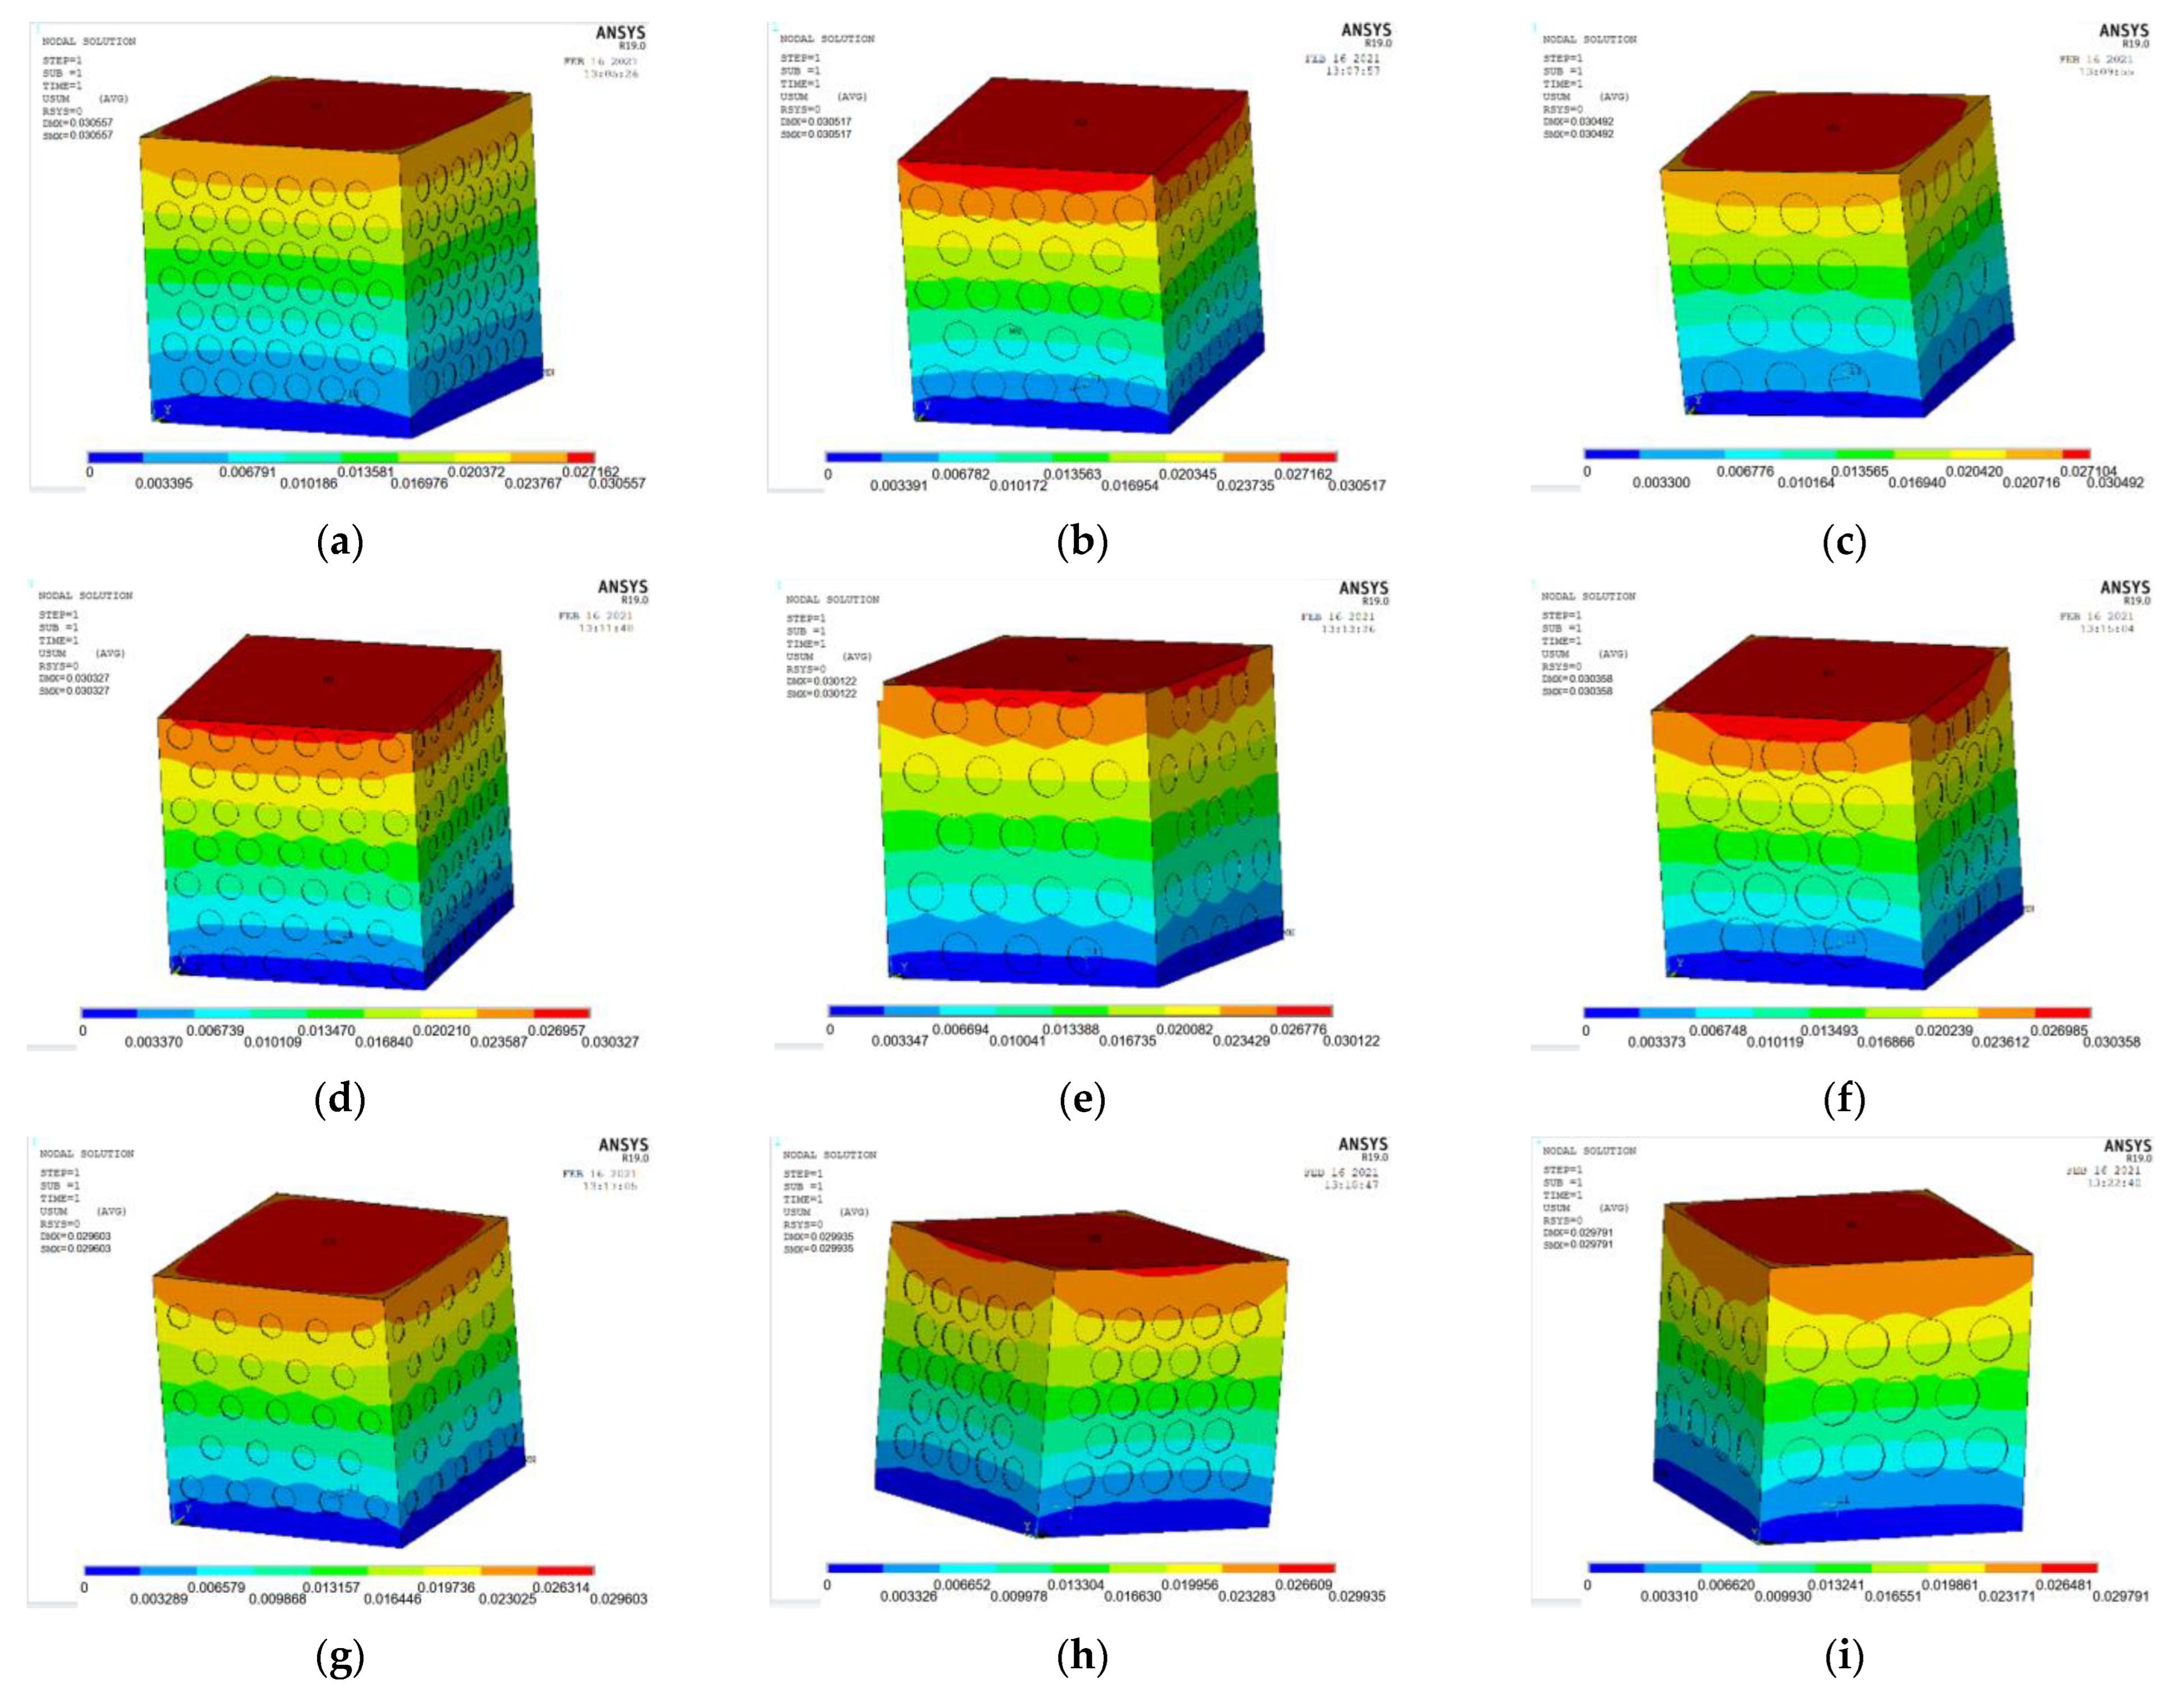
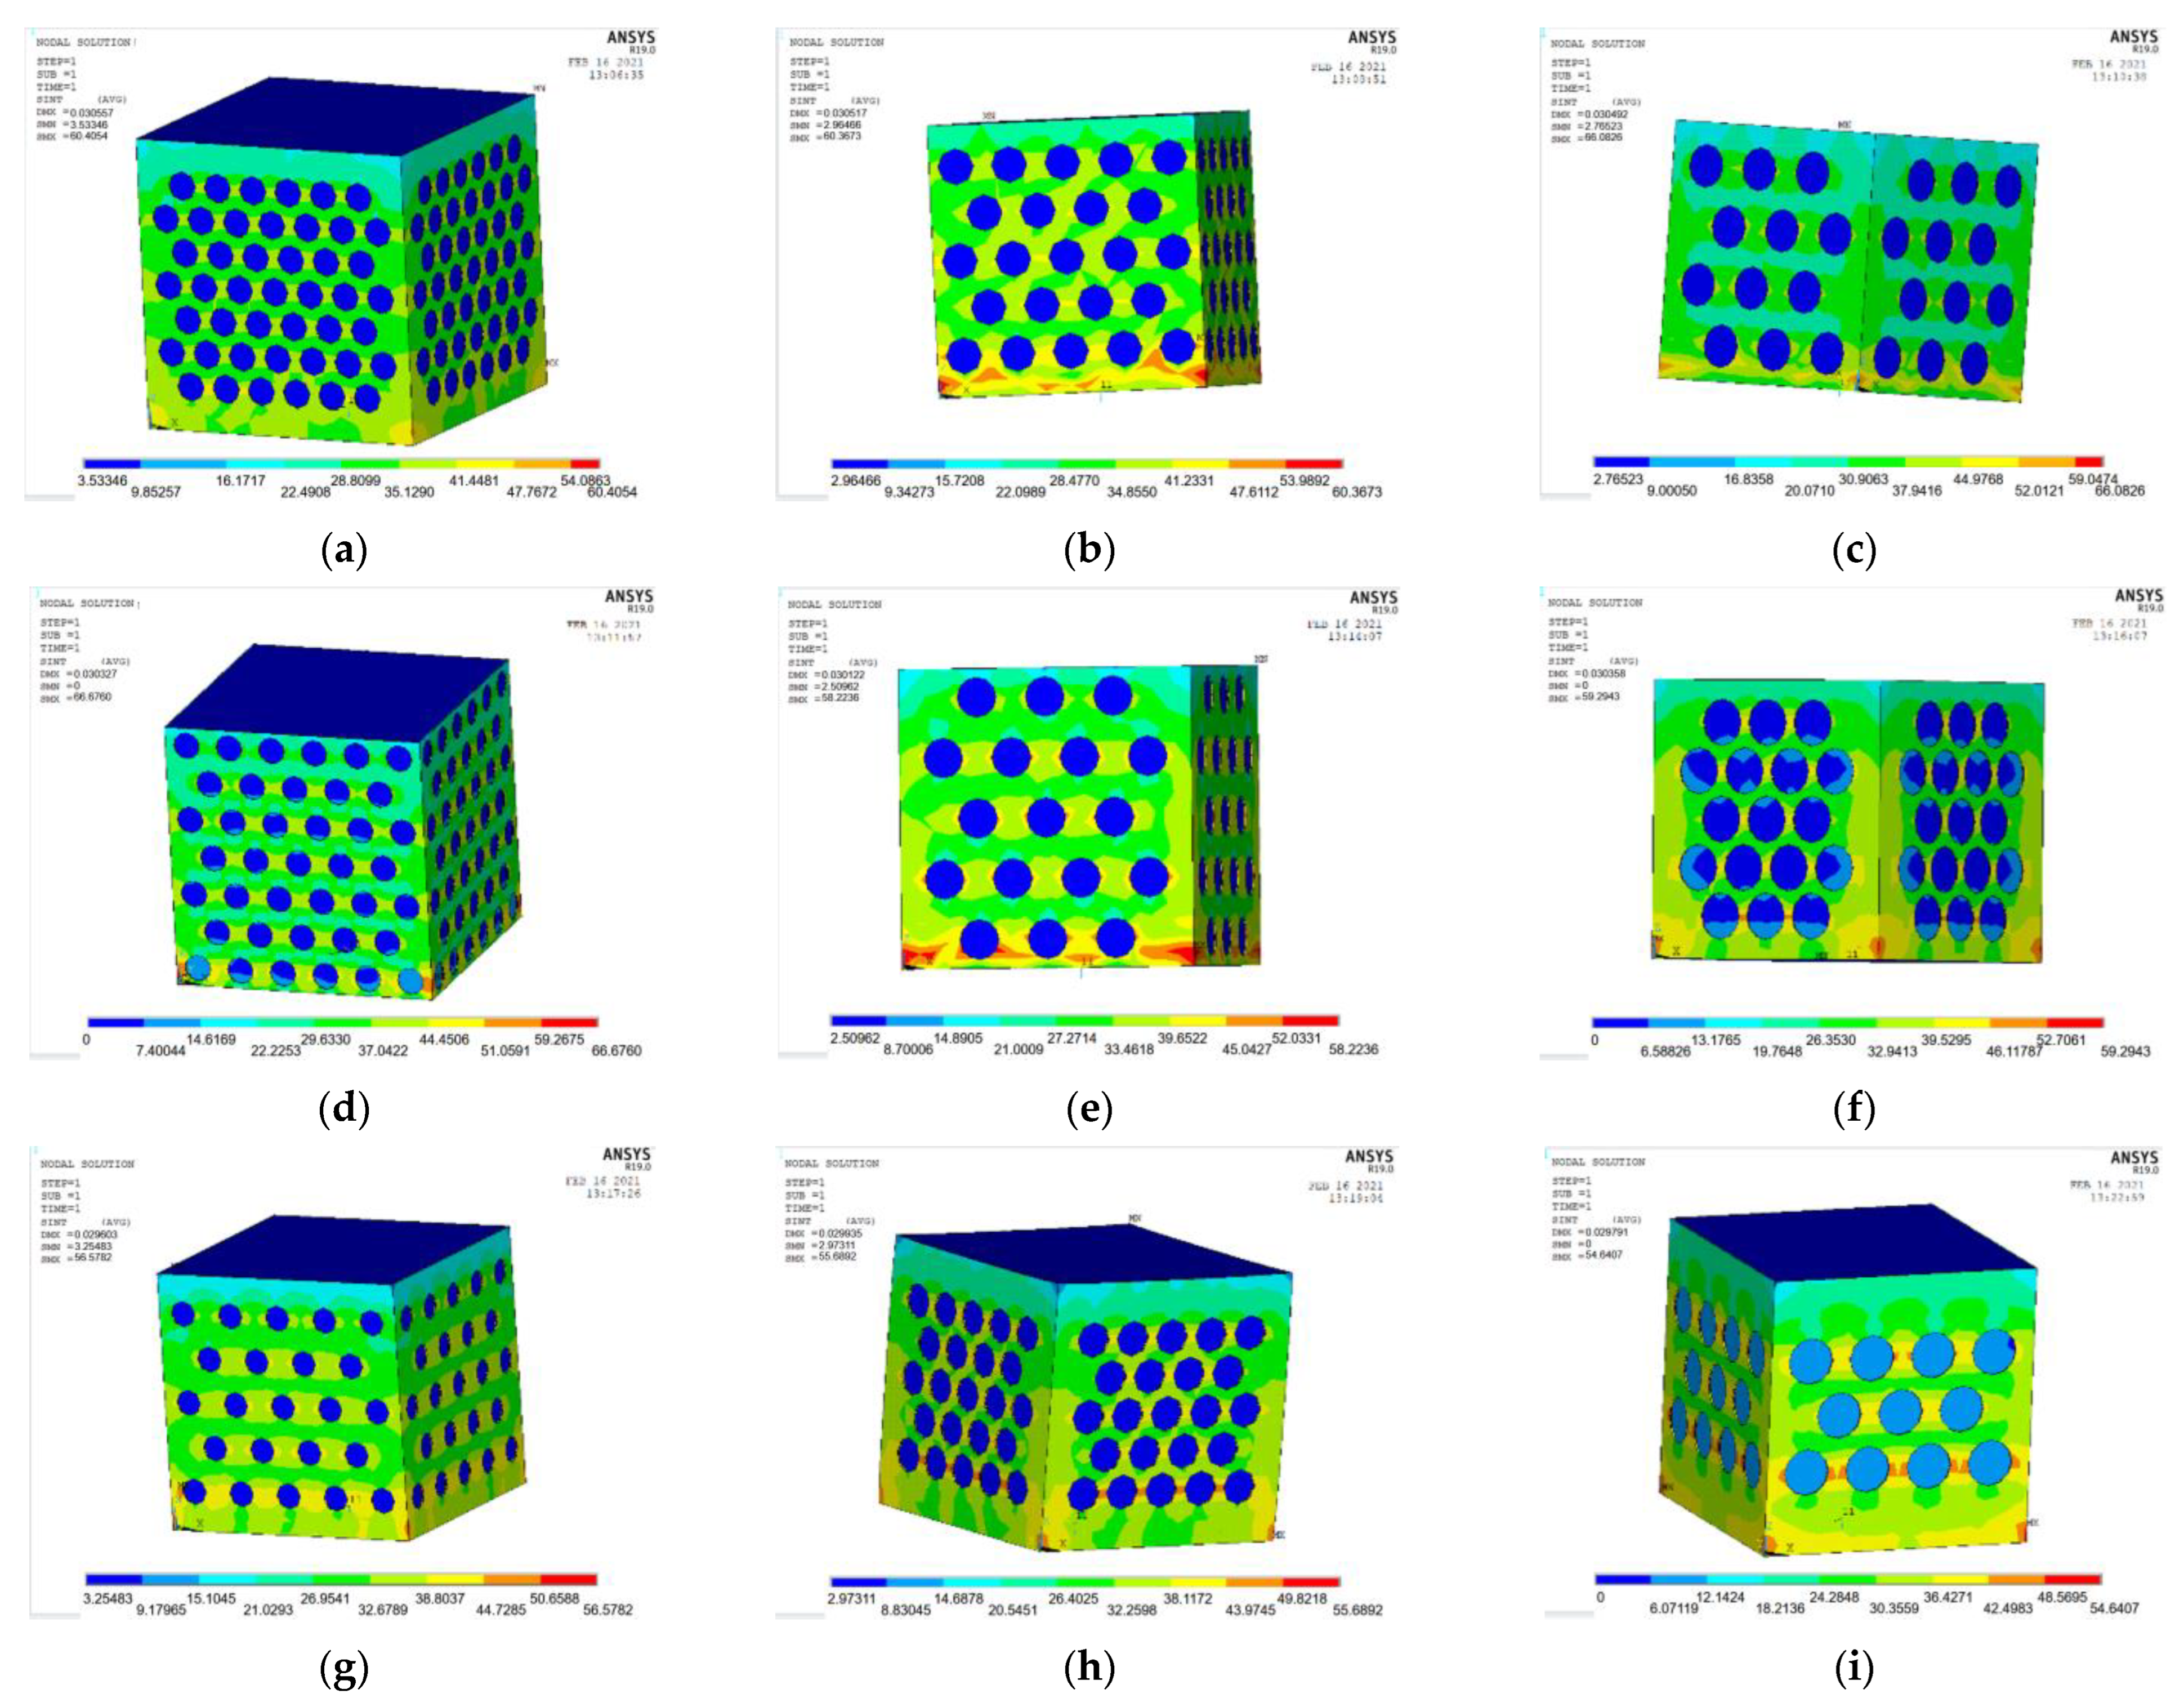
4.2. Simulation of Perforated Steel Plate Reinforced Concrete under Compression Force
The test results are compared with the simulation results of the ANSYS finite element model. The results verify the reliability of the ANSYS finite element model.
- (1)
Numerical fitting of test
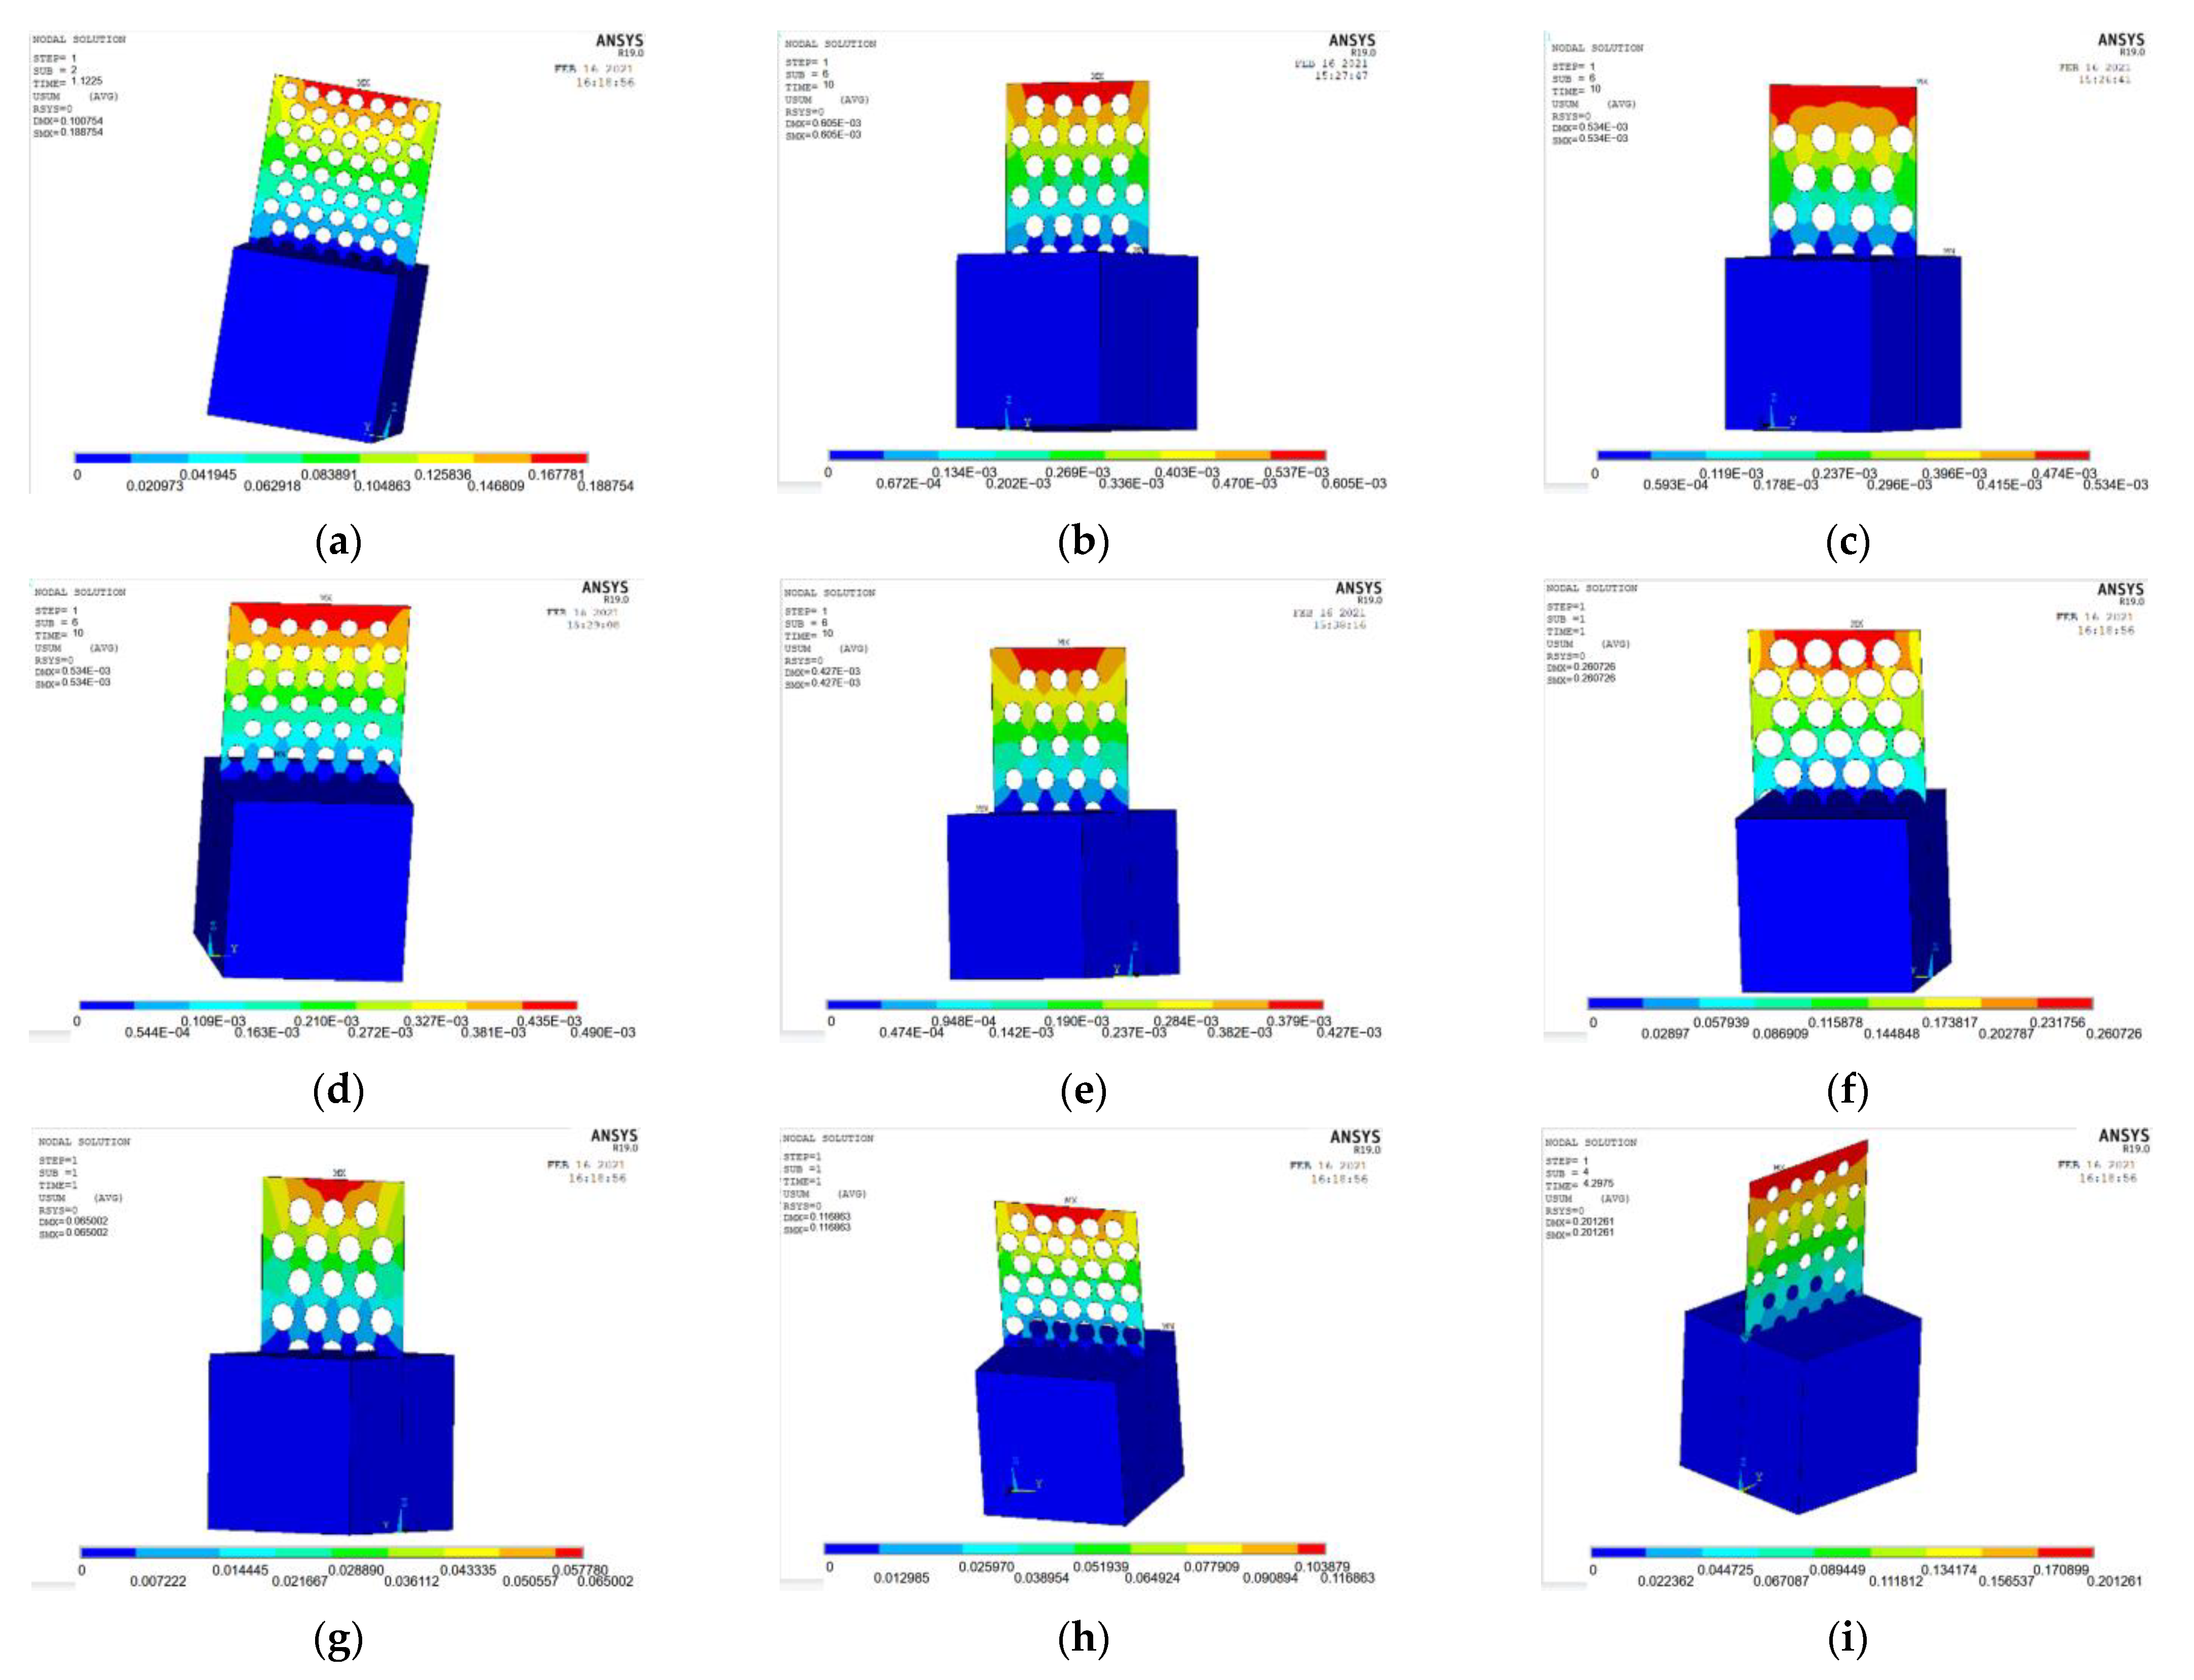
The ANSYS finite element software is used to model and analyze the nine groups of test combinations selected by the orthogonal test method. See
Figure 14 and
Figure 15 for the strain and stress cloud diagram of the perforated steel plate reinforced concrete specimen.
- (2)
Strain analysis of perforated steel plate reinforced concrete specimens
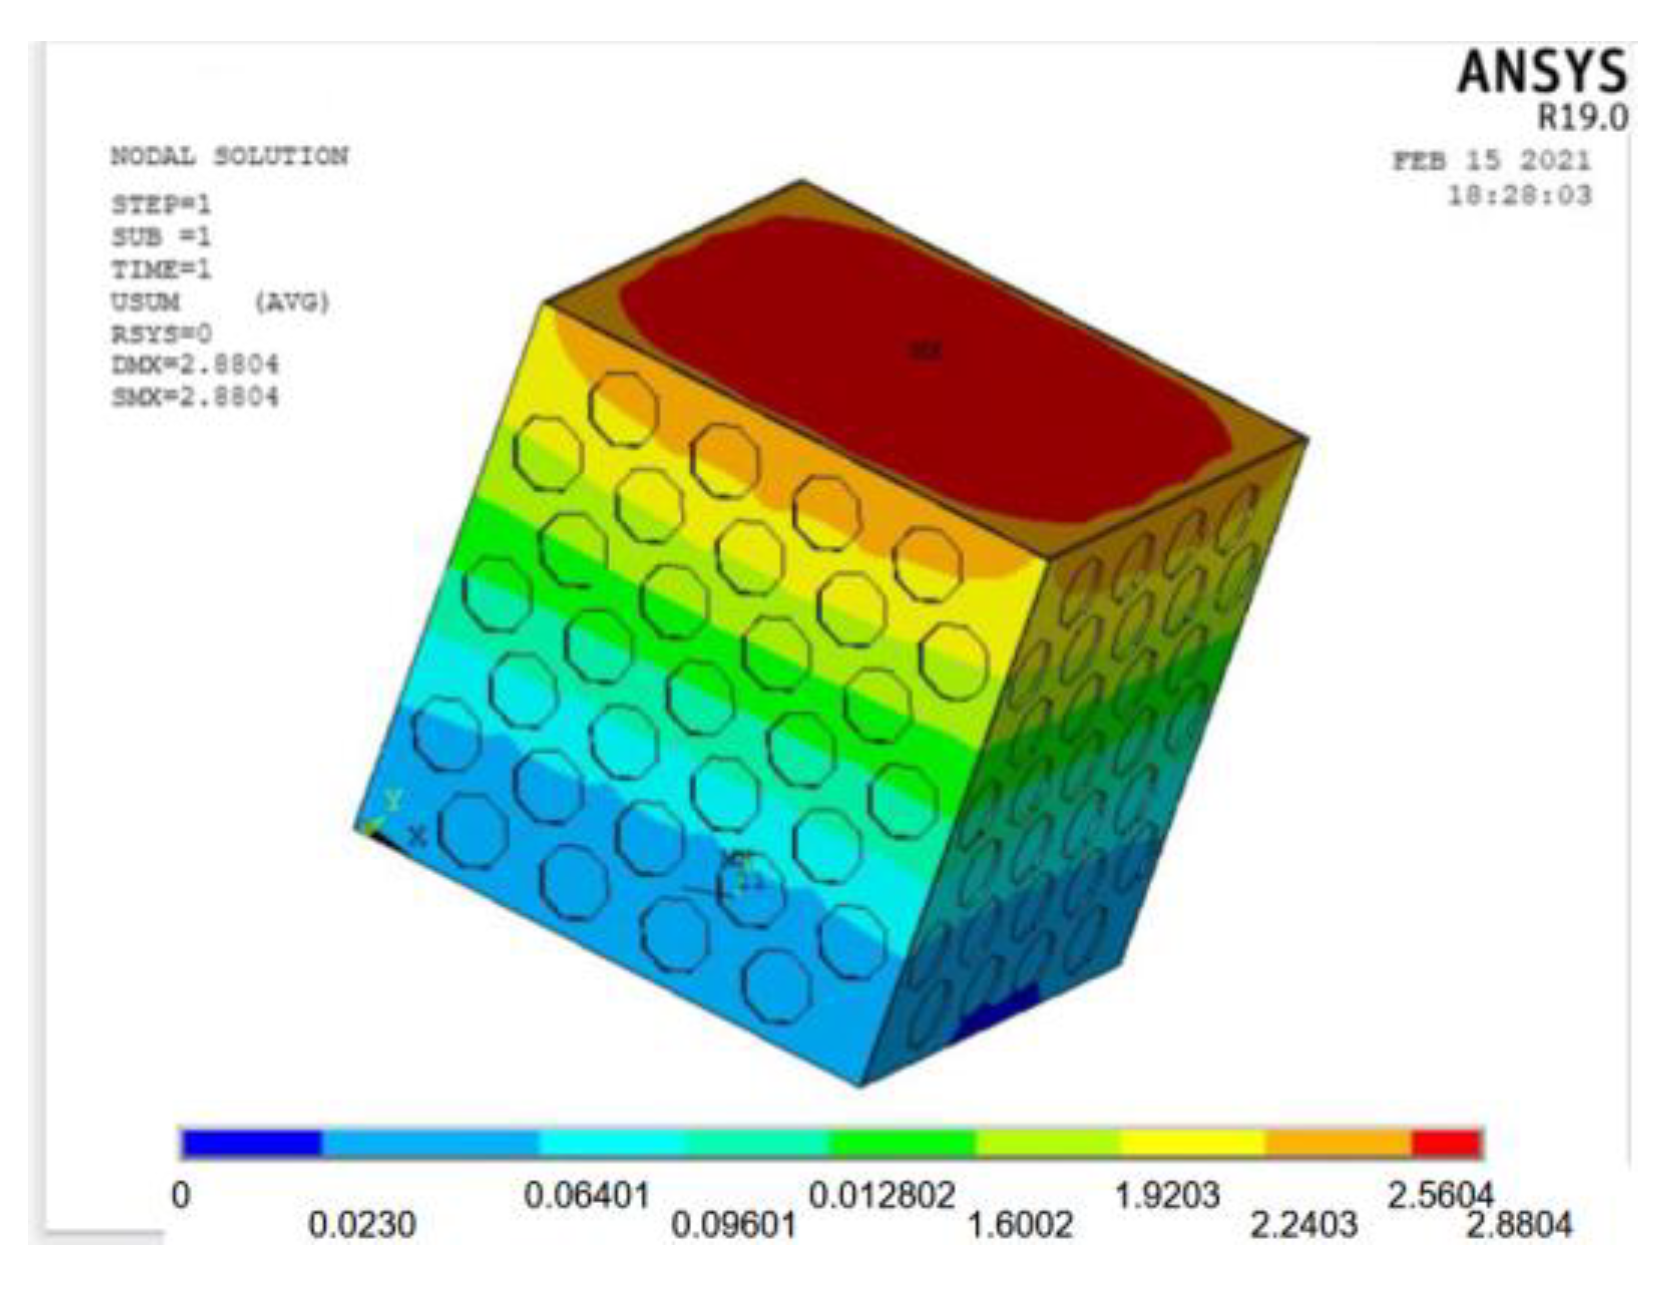
A load value slightly larger than the test result is inputted into the ANSYS finite element model, and the maximum bearable load can be obtained by the recorded data in each load step. The strain cloud diagram of the perforated steel plate reinforced concrete (plate thickness of 1 mm, hole diameter of 20 mm, and hole spacing of 10 mm) is shown in
Figure 16.
From
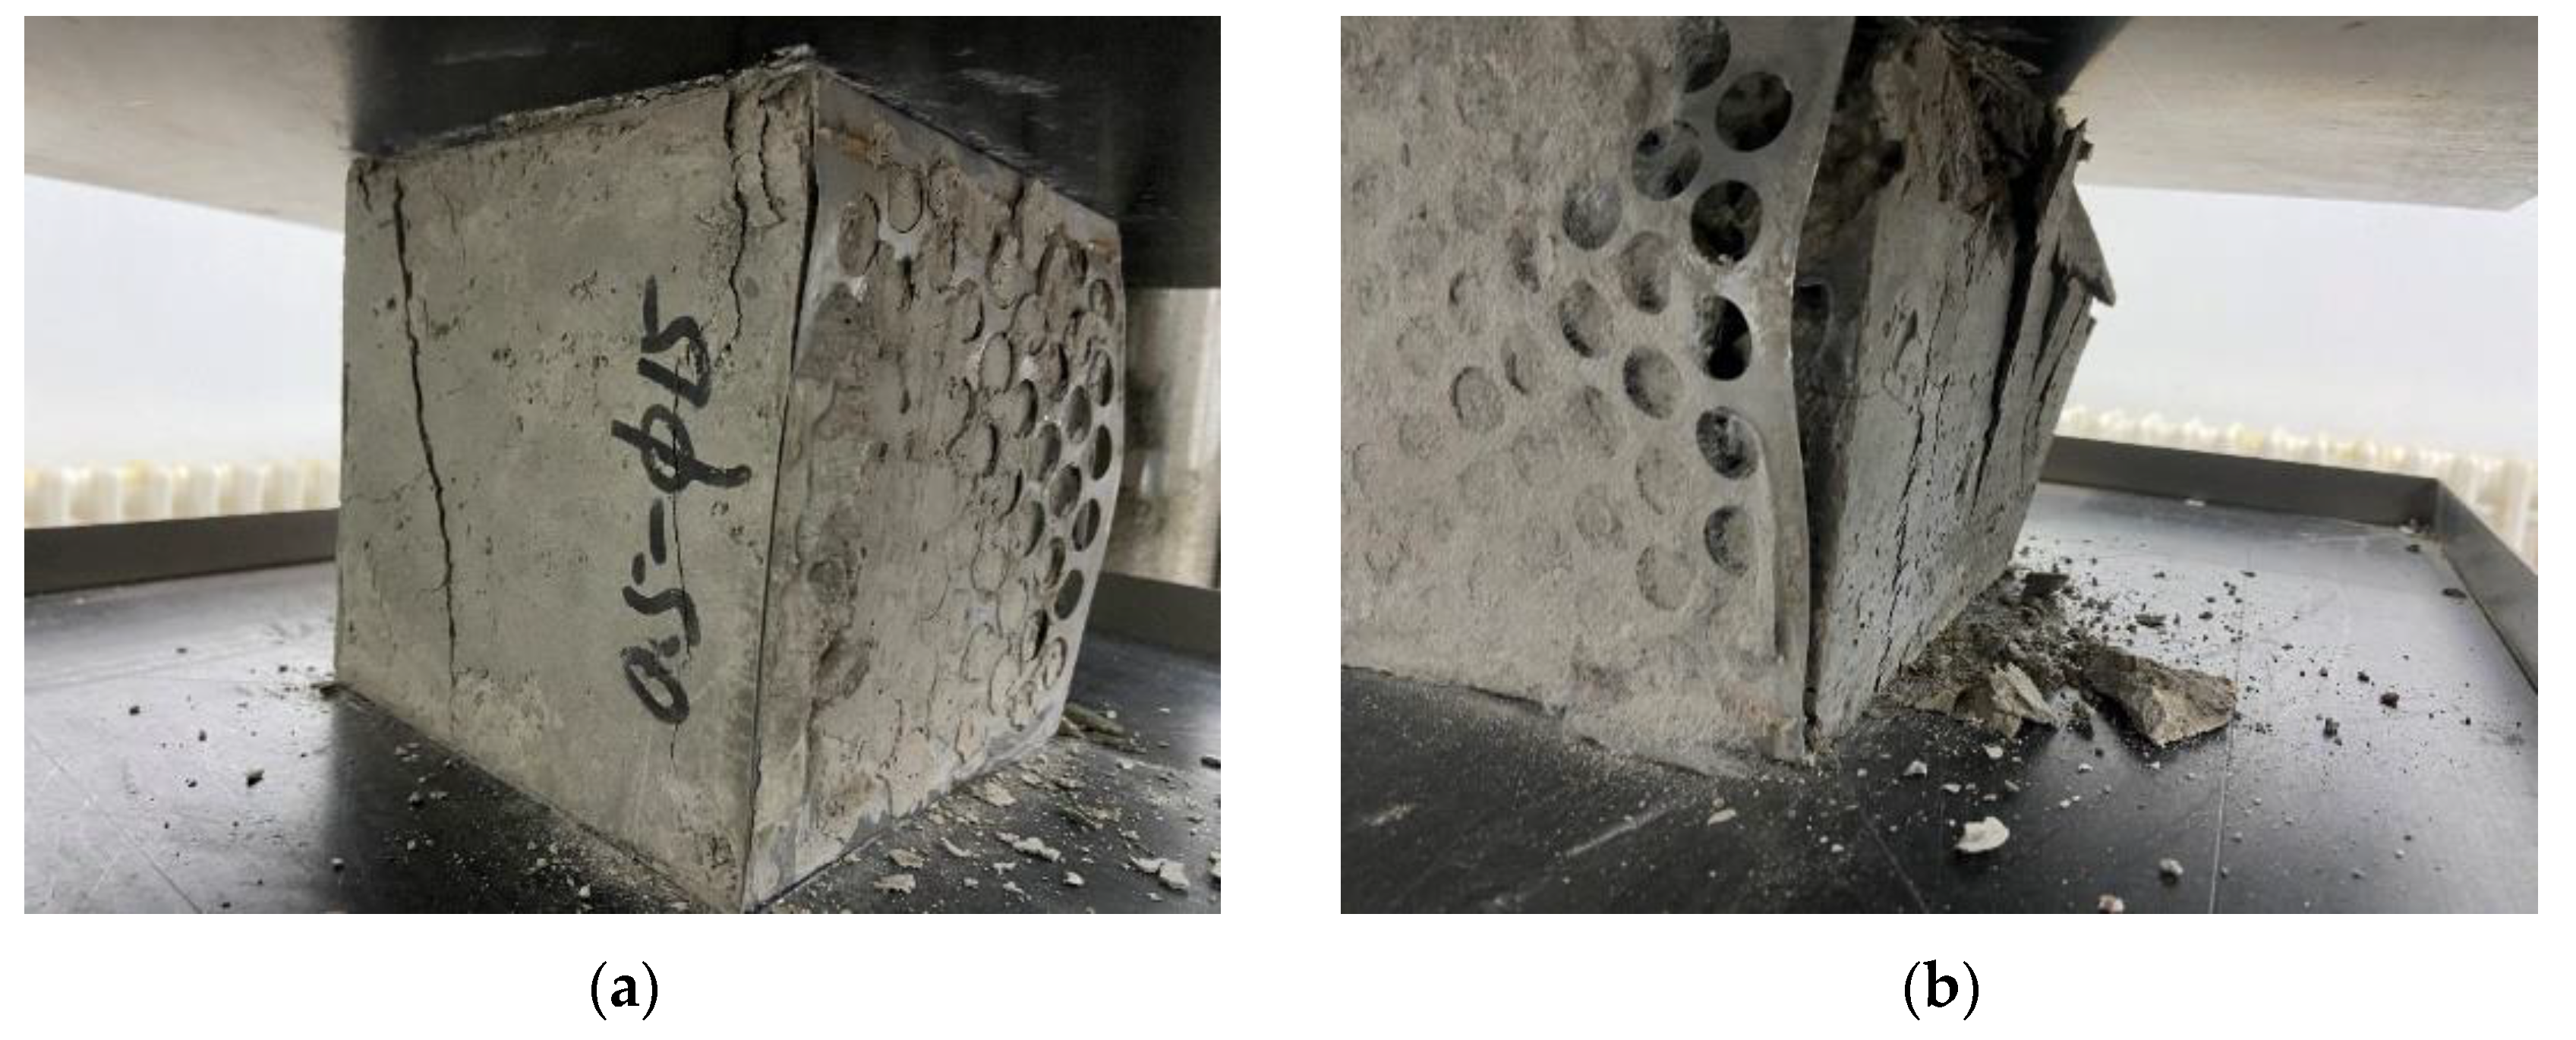
Figure 16, the strain cloud diagram shows that the maximum deformation appears at the top, which is consistent with the phenomenon observed in the test. The maximum deformation of the perforated steel plate reinforced concrete is 2.88 mm in the simulation, but it is 3.26 mm in the test, which indicates some errors in the simulation. This is attributed to the fact that the actual test simulates the maximum deformation that the perforated steel plate reinforced concrete specimen can bear, while the actual stress state of the perforated steel plate reinforced concrete specimen in the composite structure is simulated in the finite element model. The constraint used in the finite element model is an ideal constraint state. By fixing the bottom of the perforated steel plate reinforced concrete specimen and applying the surface load on the top of the specimen, the concrete and the perforated steel plate bear the load together. The actual test is that the perforated steel plate reinforced concrete in the specimens will be separated from each other and deformed under the action of the pressure-testing machine.
- (3)
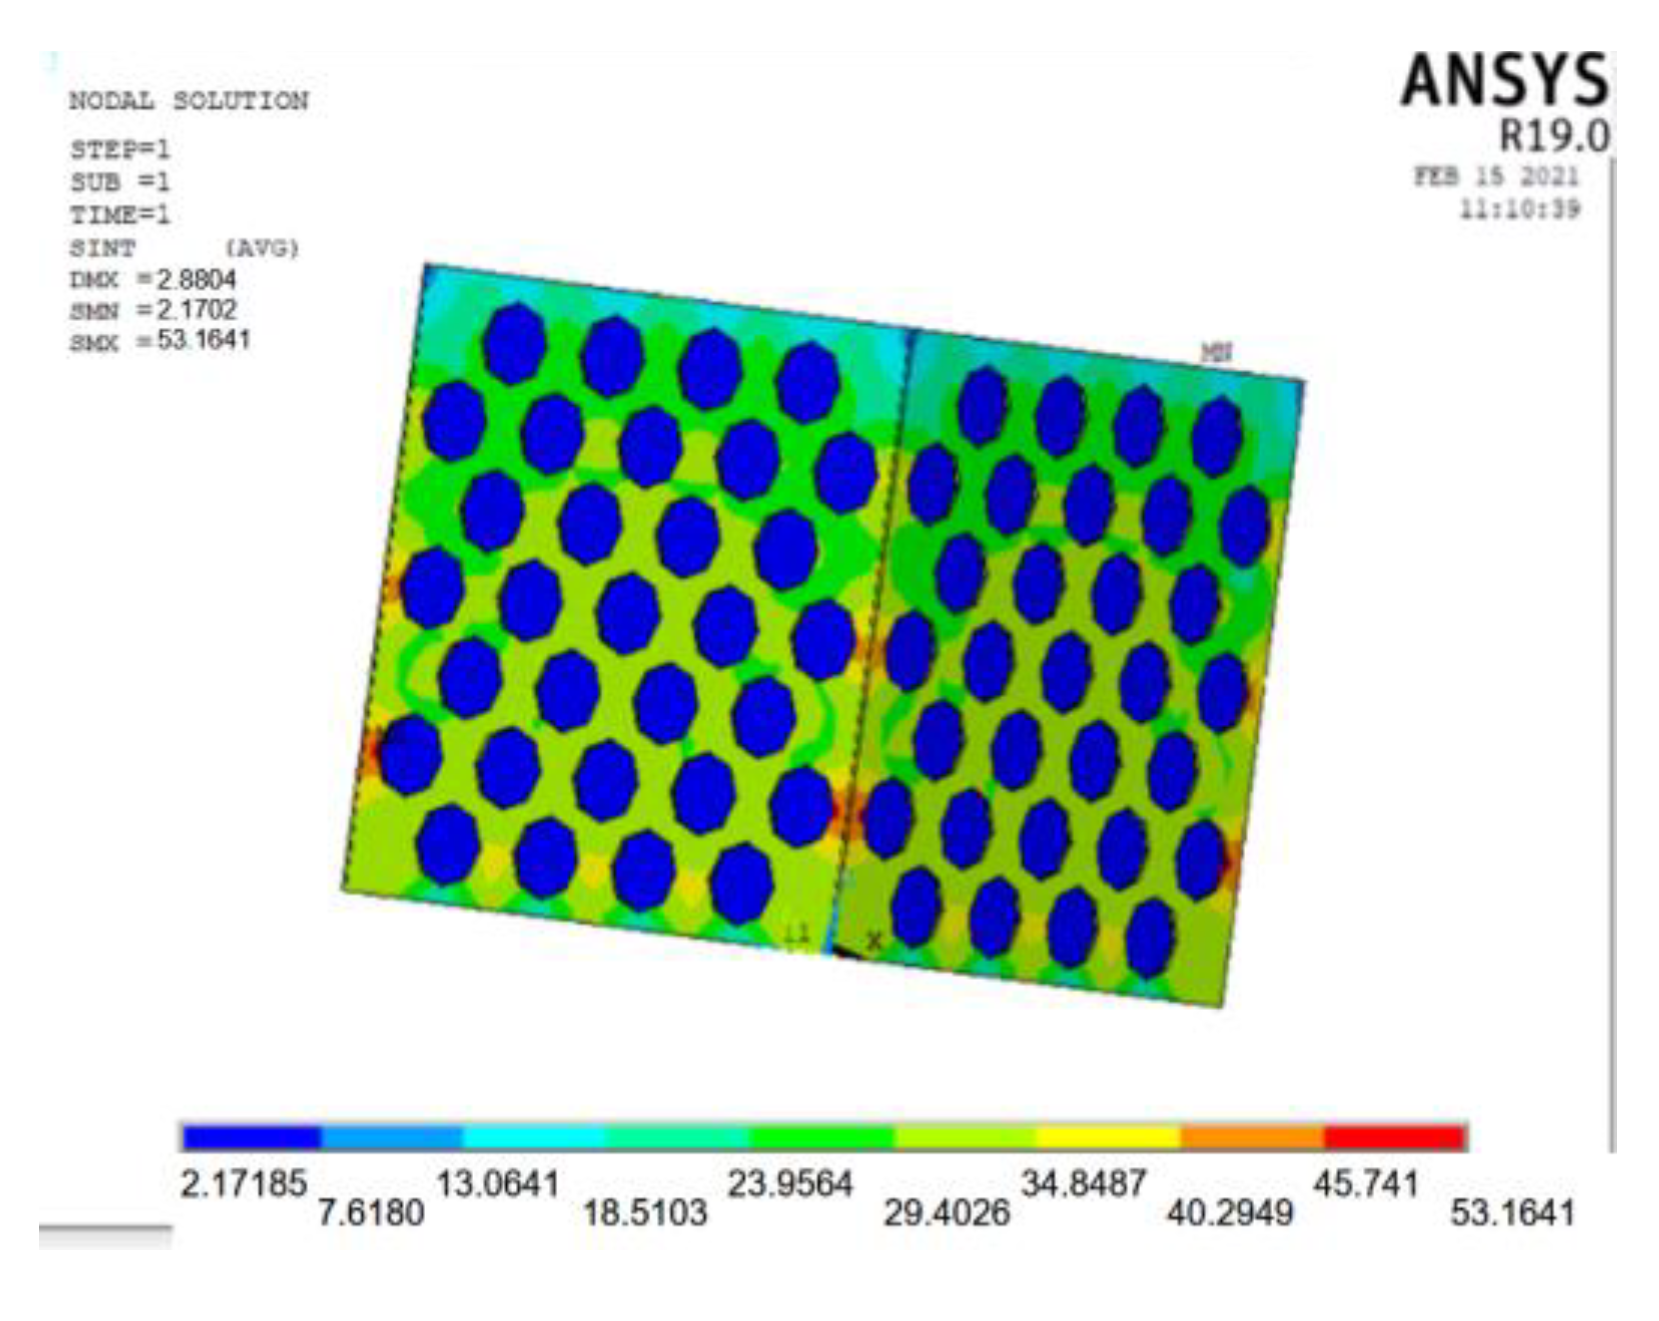
Stress analysis of perforated steel plate reinforced concrete specimens
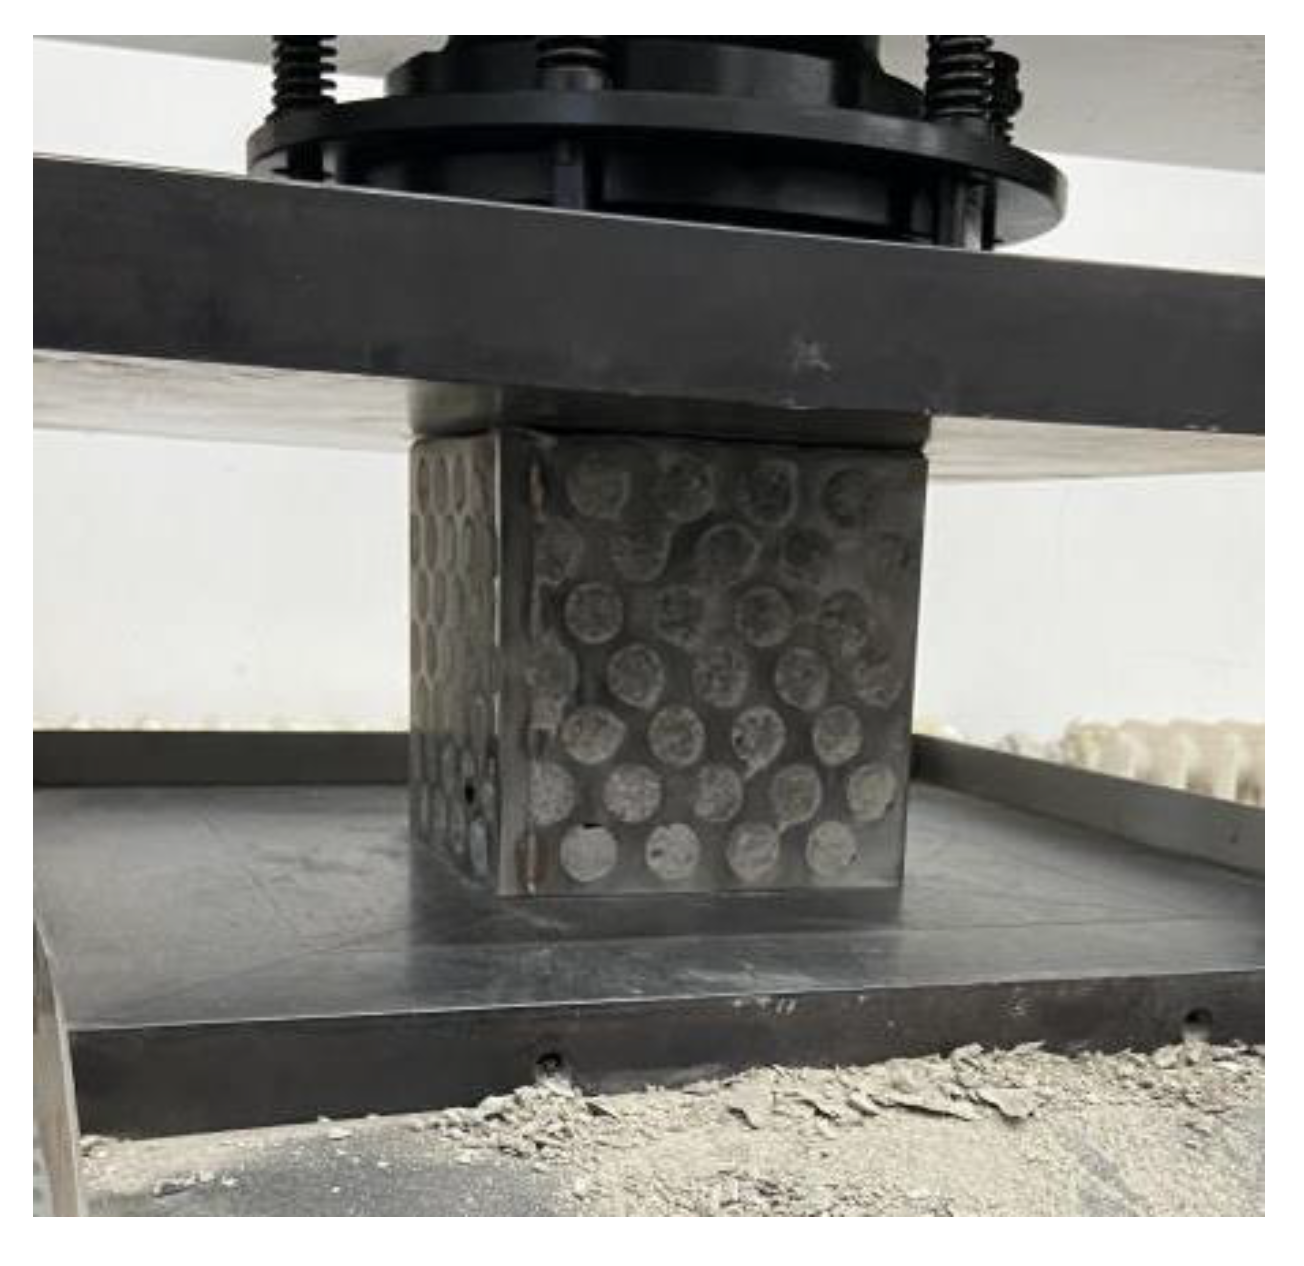
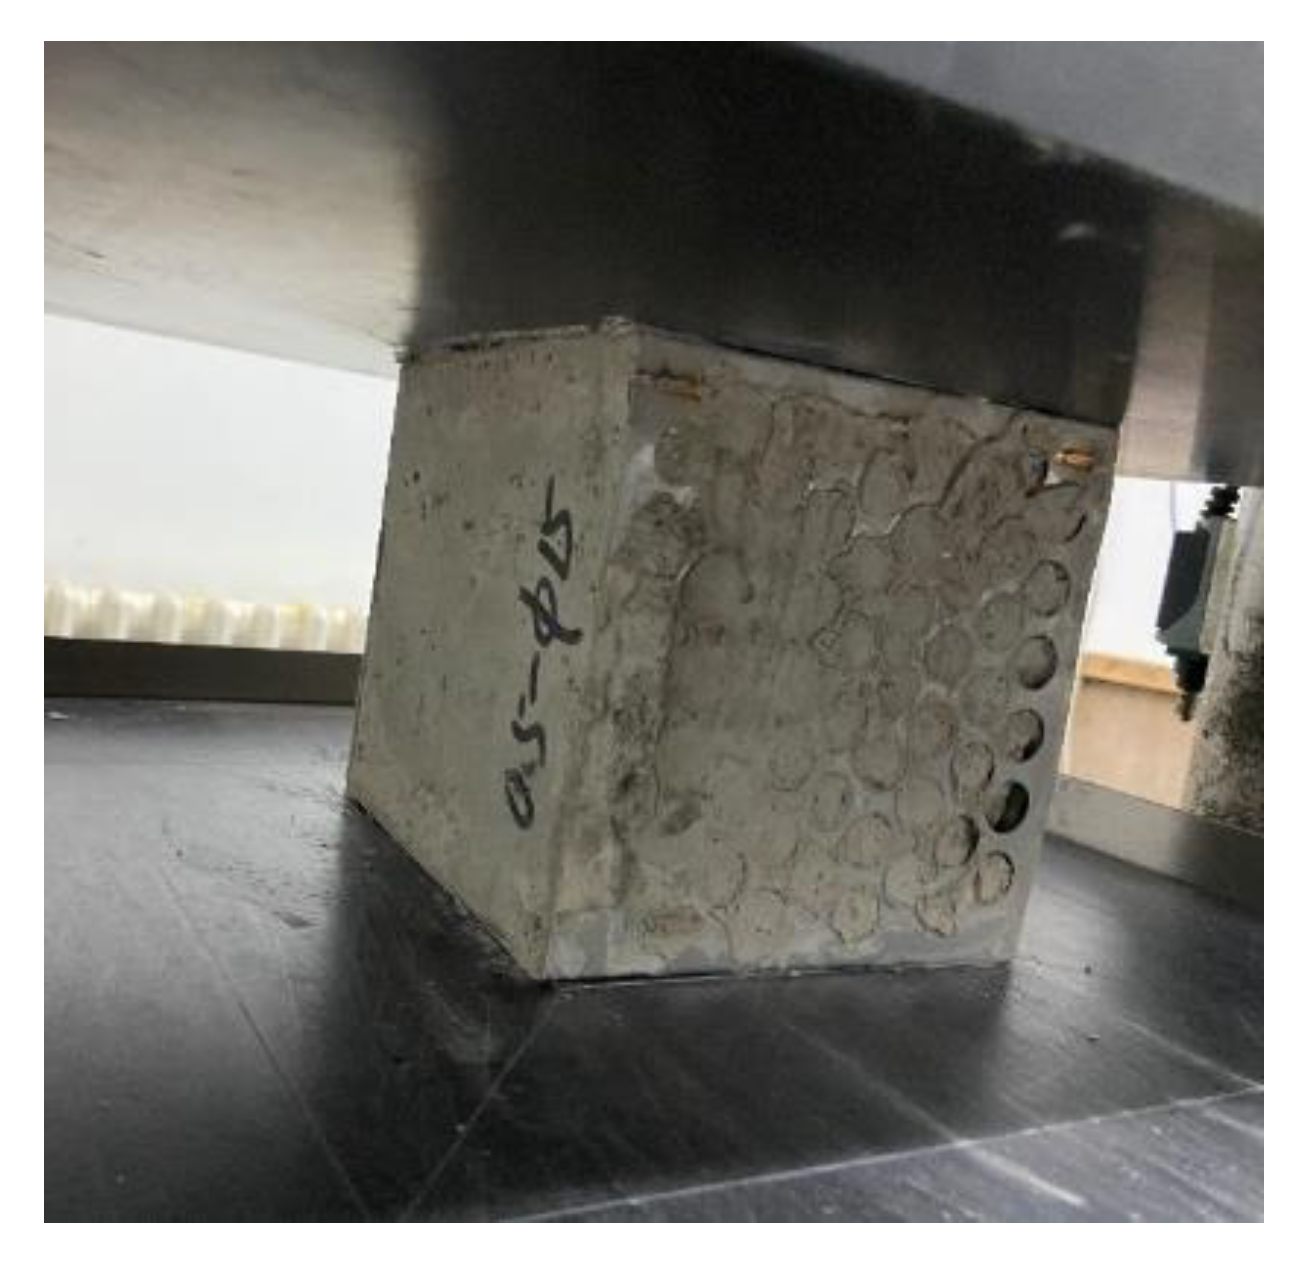
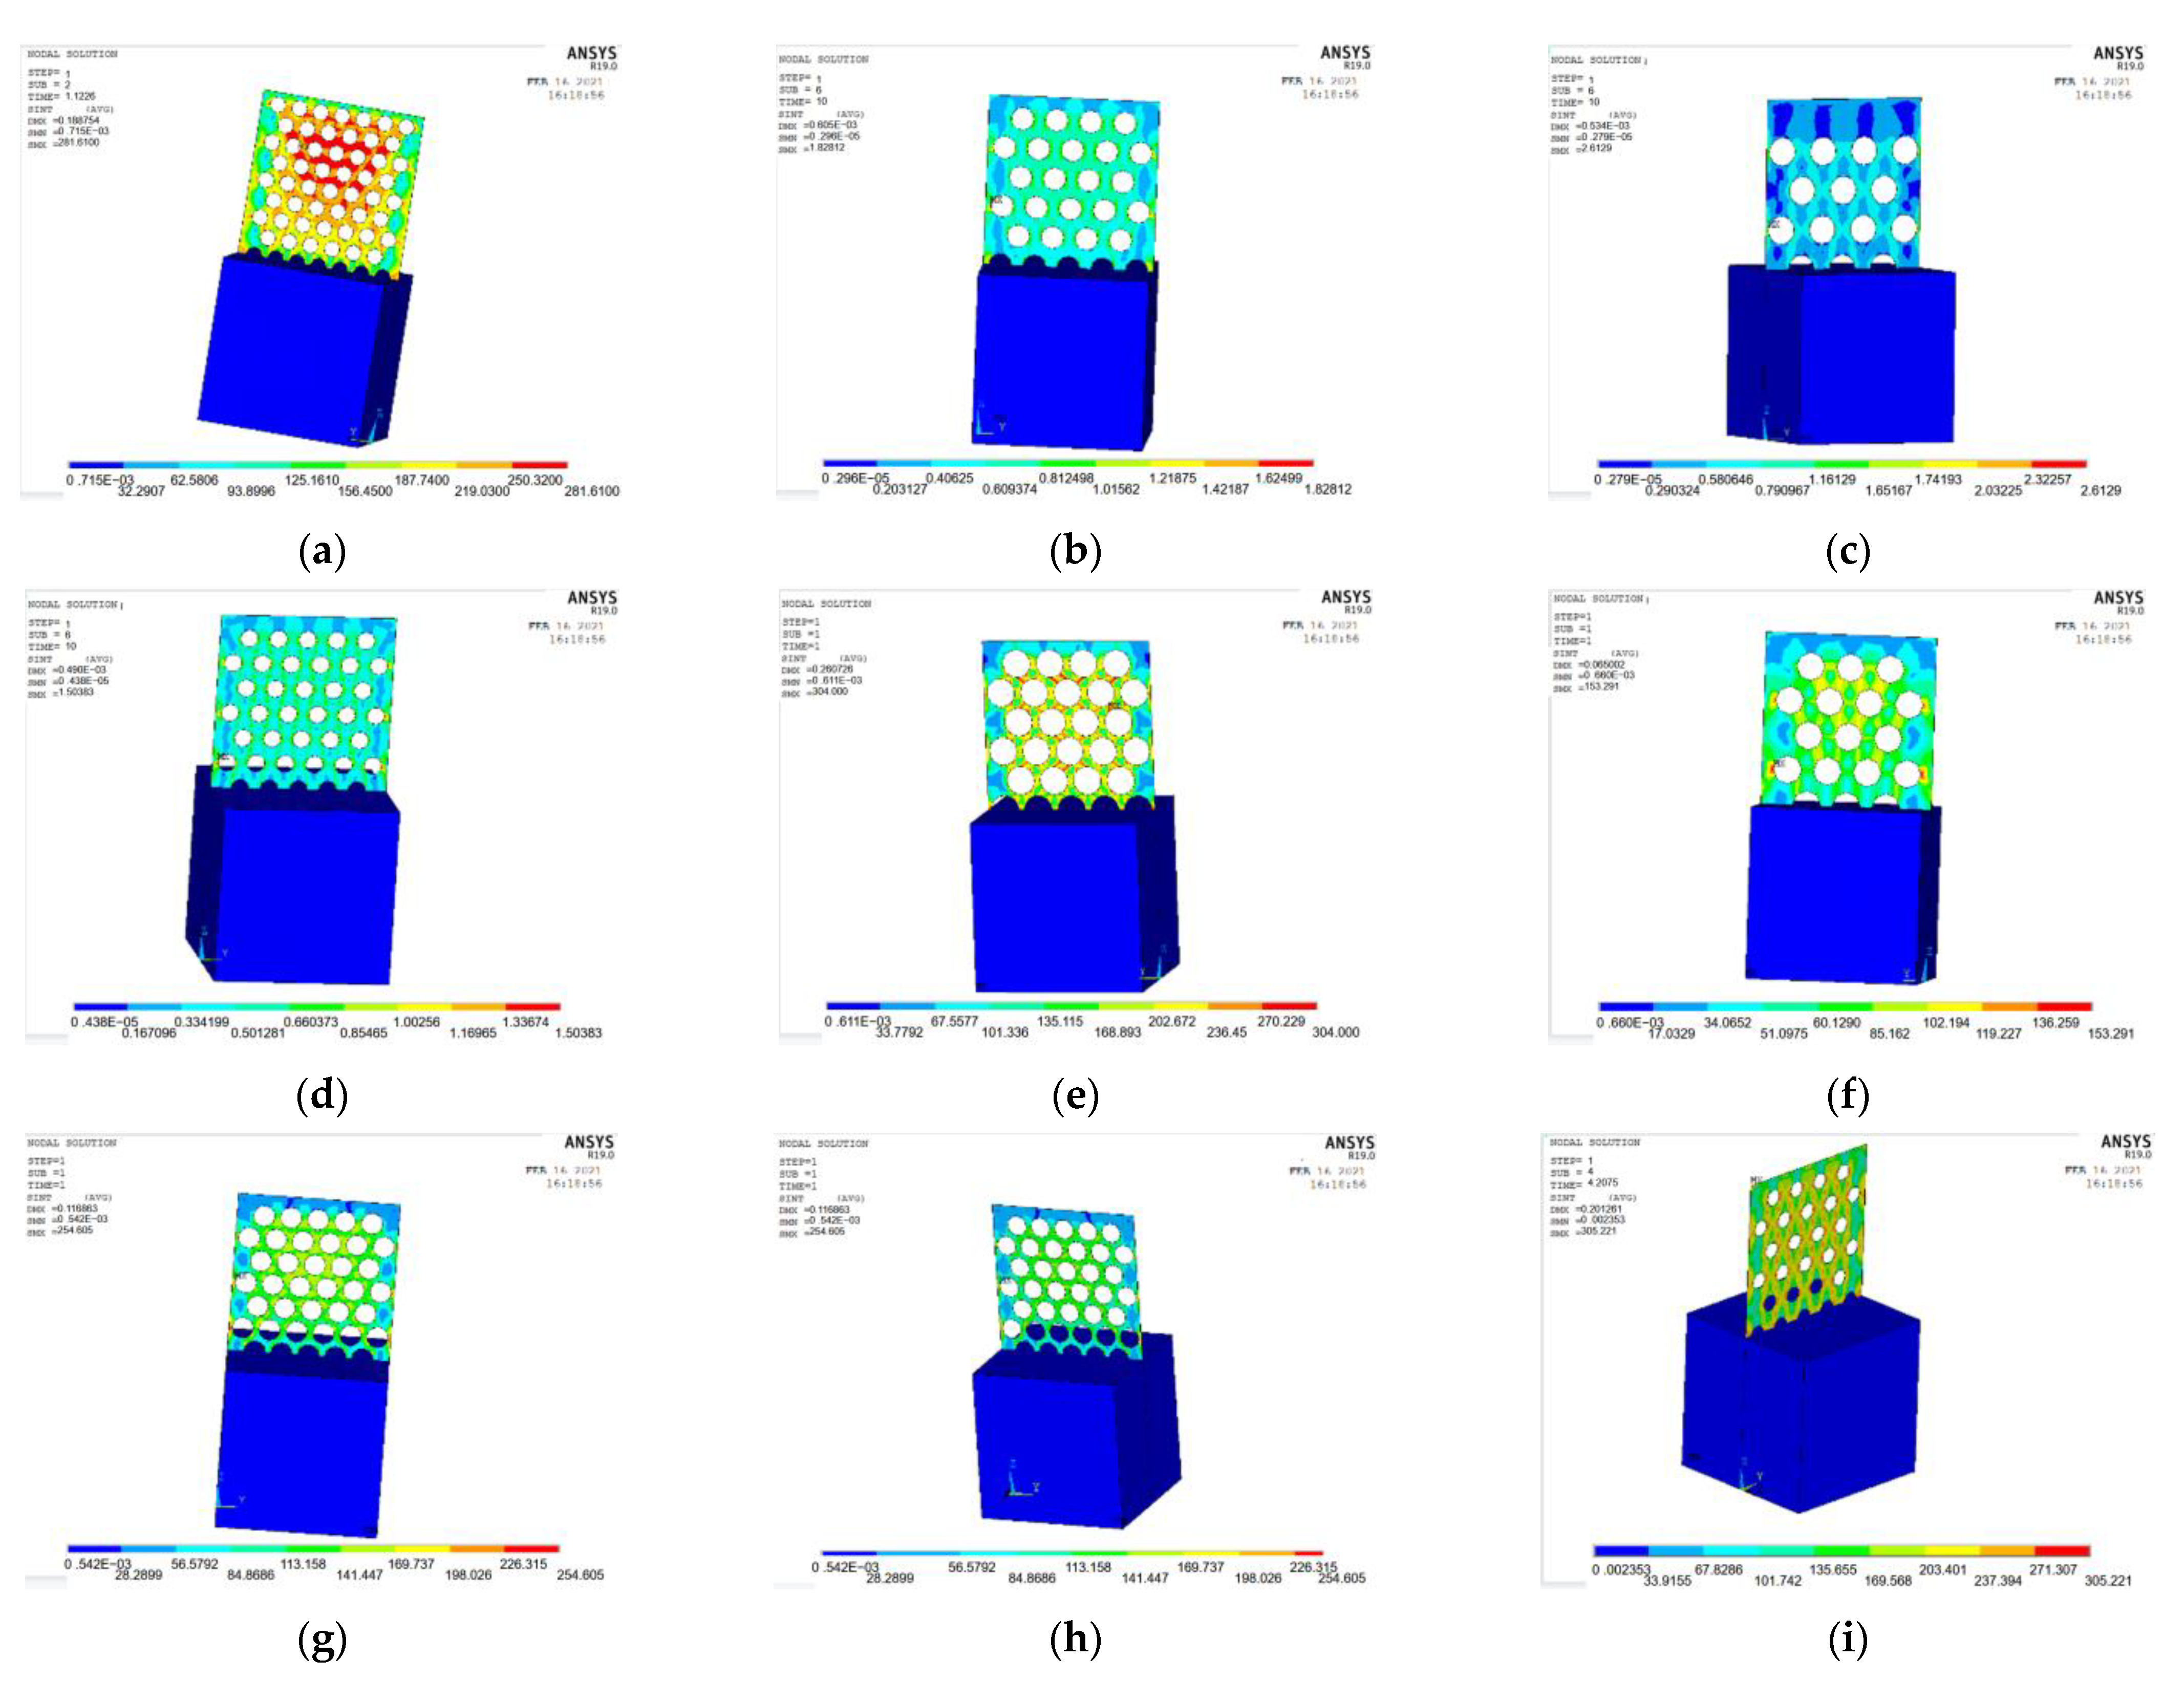
According to the actual data, the perforated steel–concrete (plate thickness of 1 mm, hole diameter of 20 mm, and hole spacing of 10 mm) can withstand the maximum stress of 56.67 MPa. In order to obtain the stress value more accurately, a load value slightly larger than the actual test result is applied to the model, and the simulation results of each load step are recorded and outputted. In order to ensure the accuracy of the data, the appropriate number of iteration steps and the largest possible tolerance value are set. The maximum stress value that the model can bear is 53.16 MPa.
The stress cloud diagram of the perforated steel plate reinforced concrete specimens is shown in
Figure 11. Compared with the actual test result in
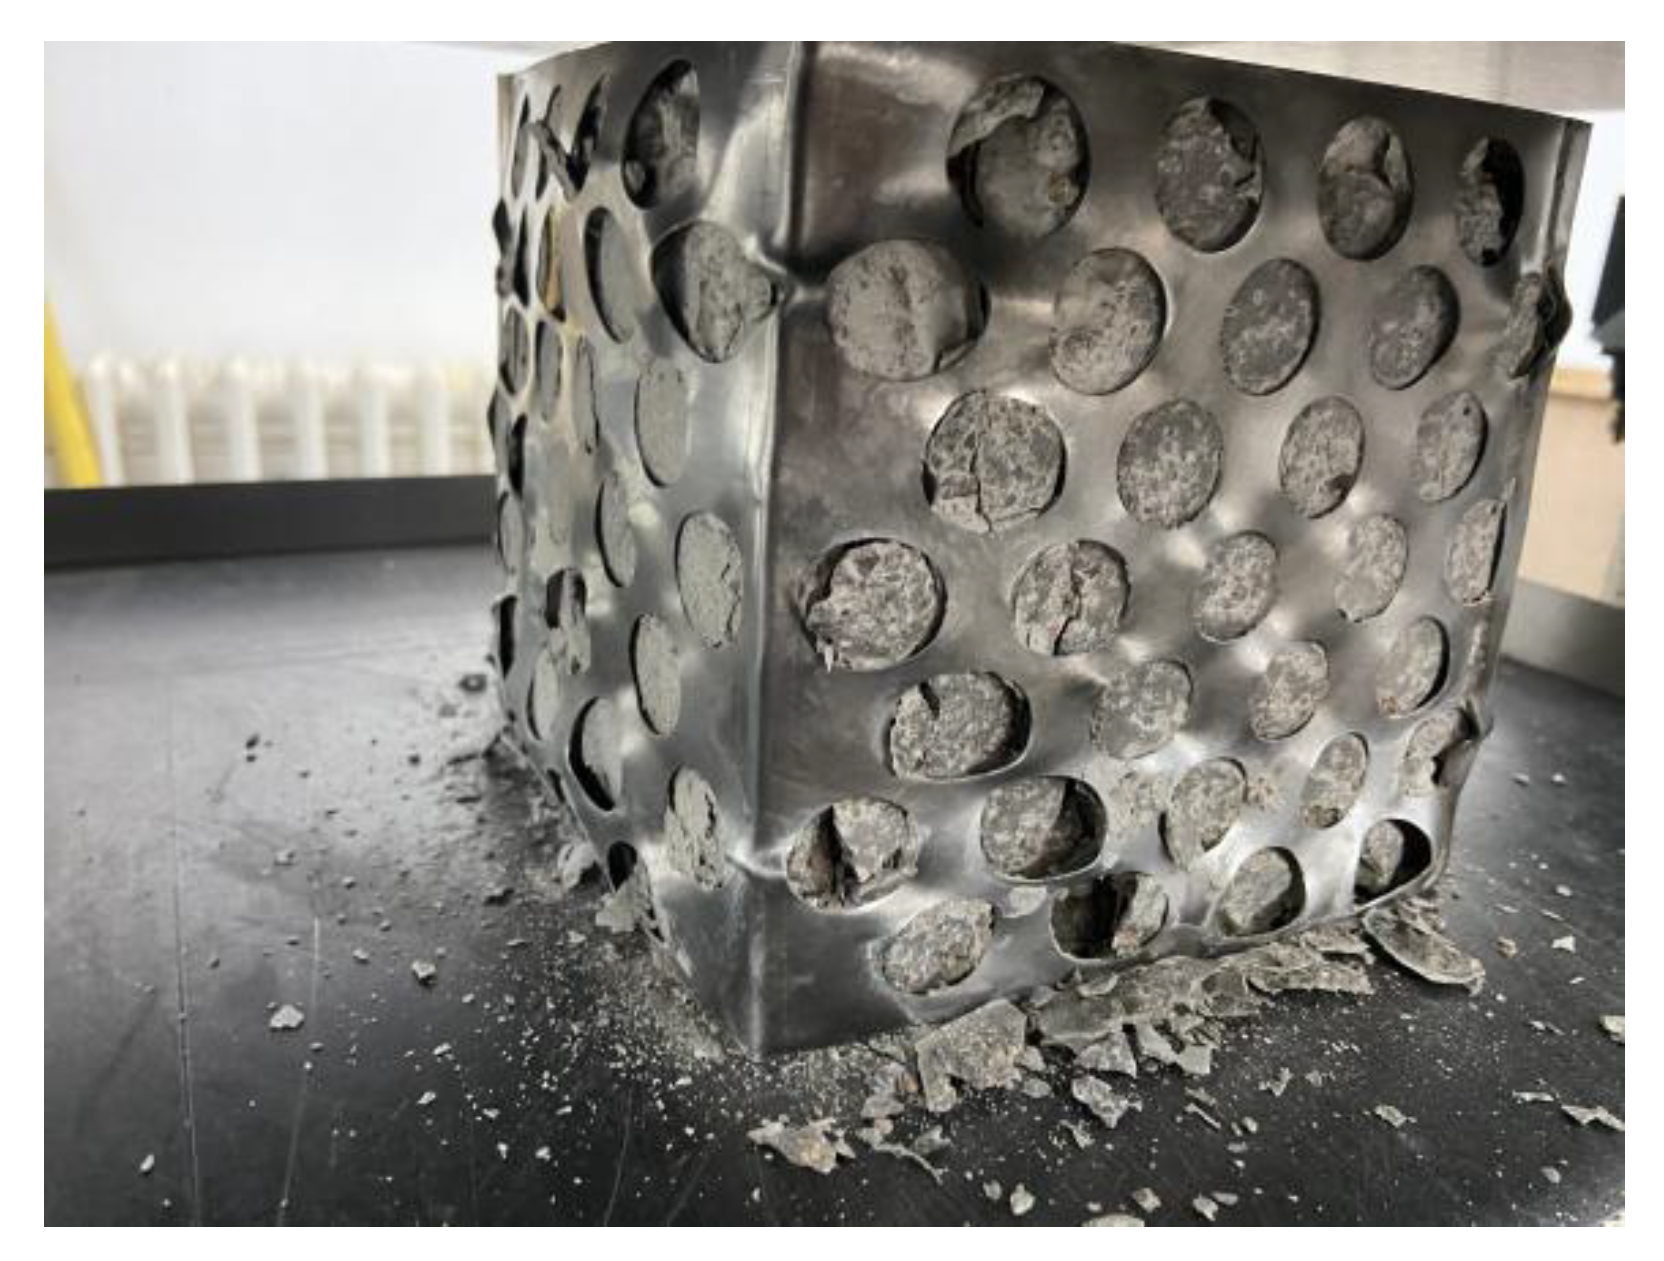
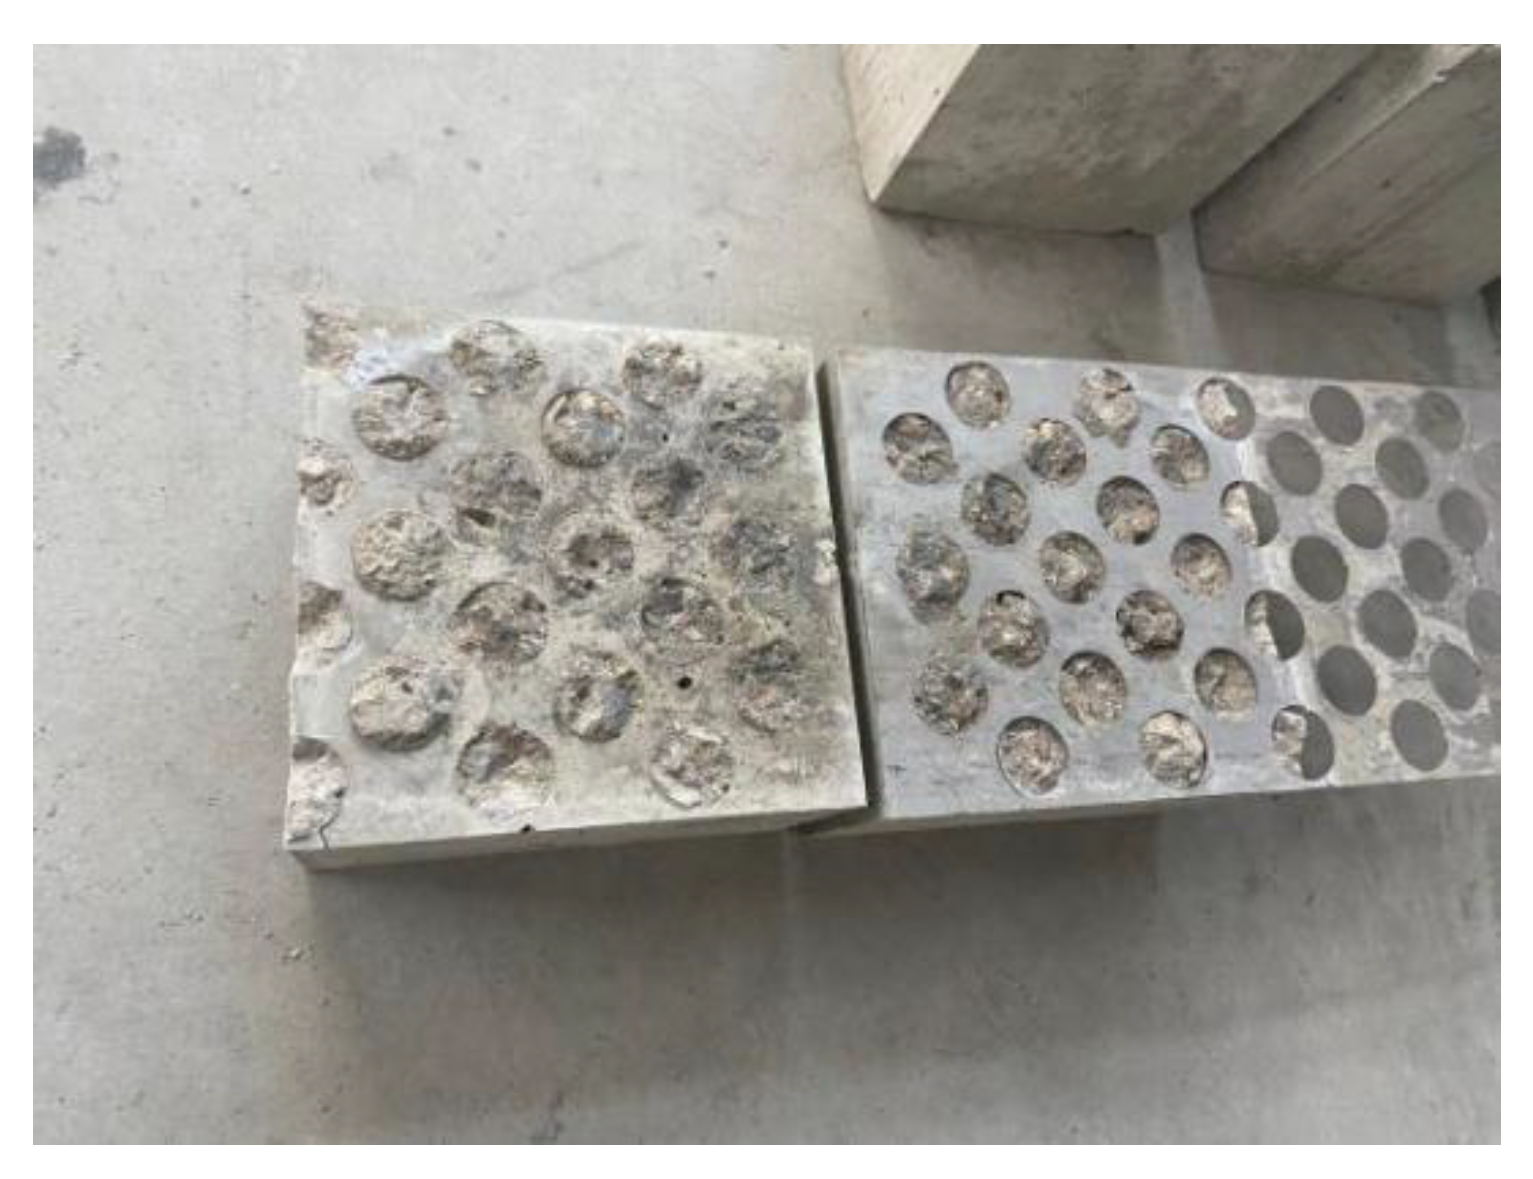
Figure 6, the stress is relatively concentrated at the upper and lower 1/3 of the outer edges of the perforated steel plate, which is the location where wrinkle failure occurs. It is consistent with the overall stress distribution of the model, indicating that the analysis result of the model is reliable.
- (4)
Error analysis
It can be seen from the above in
Figure 17 that the deviation between the load on the model and the actual test results is no more than 10%. The main reason is that the ANSYS analysis cannot accurately simulate the concrete failure process during the actual test.
- (5)
Range analysis of influencing factors
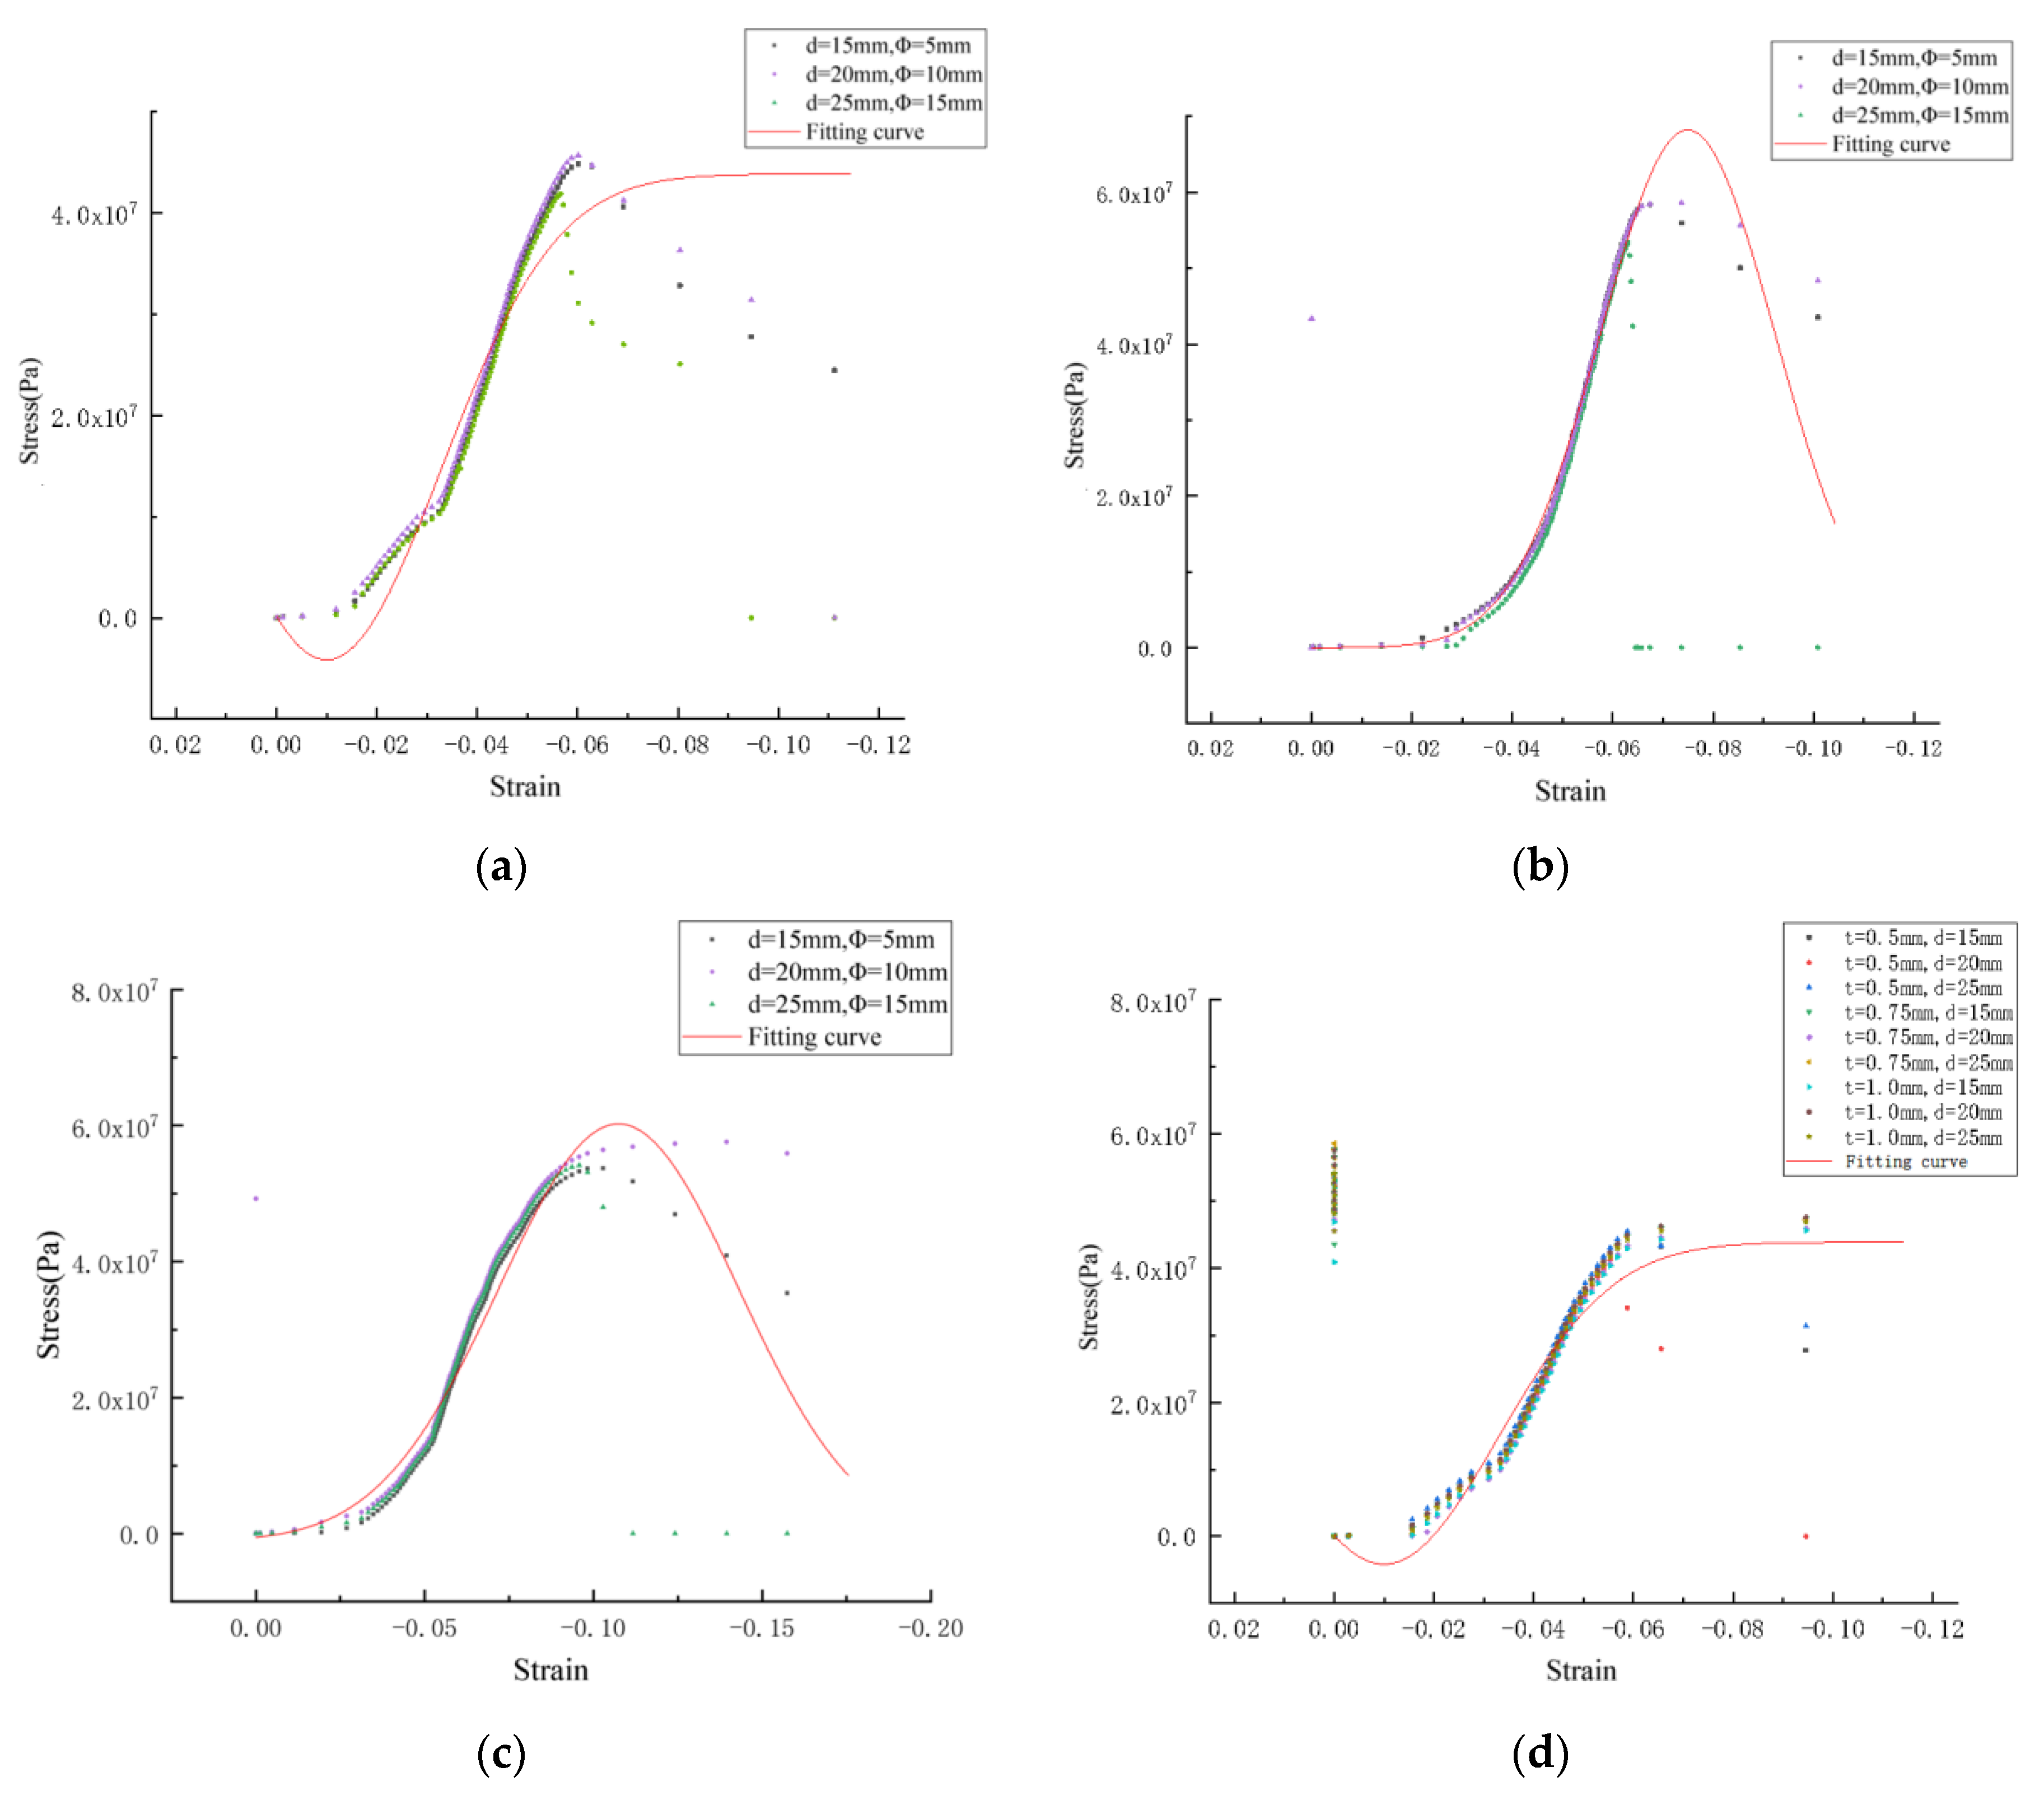
The analysis steps are as follows: (i) Calculate Ki (i is the level number, taking 1, 2, 3). Ki is the sum of the different levels of test indicators corresponding to each factor. (ii) Sum up the 3 Ki corresponding to each factor to verify the accuracy of the calculation results. (iii) Calculate the average value of the ki corresponding to the Ki in each factor. (iv) Find the range value corresponding to the ki in each factor. (v) Determine the primary and secondary order of the factors according to the range value of each factor. (vi) Determine the optimal level of the factor according to the ki corresponding to each factor. (vii) Combine the optimal level of each factor and finally form the optimal test combination [
39].
The range analysis of the compressive strength of the perforated steel plate reinforced concrete is shown in
Table 8 (A (thickness of perforated steel plate); B (hole diameter of perforated steel plate); and C (hole spacing of perforated steel plate)). By comparing the range values corresponding to ki in the table, it can be obtained that in the compression test, the order of the three factors on the perforated steel plate reinforced concrete is A > B > C; that is, the factors having an impact on the compressive strength in an increasing order are hole spacing, the hole diameter, and the thickness of the steel plate. The range of the thickness of the perforated steel plate is 5.79, which is significantly larger than the range of the other factors. Therefore, the thickness has a significant influence on the compressive strength of the perforated steel plate reinforced concrete. By comparing the ki corresponding to each factor, it can be concluded that the optimal levels of each factor are A2, B1, and C1; that is, the optimal level is A2B1C1. The compressive strength of the perforated steel plate reinforced concrete reaches the maximum 56.8 MPa when the thickness of the perforated steel plate is 0.75 mm, the hole diameter of the perforated steel plate is 15 mm, and the hole spacing is 5 mm.
4.3. Establishment of Pull-Out Model
- (1)
Choose the appropriate unit type
The Solid185 element is selected in the model, and the Mises yield criterion is adopted as the failure criterion of the perforated steel plate [
37]. The concrete element of the perforated steel plate reinforced concrete is Solid65, and the concrete follows the William–Warnke five-parameter failure criterion [
38].
- (2)
Select material parameters
C30 concrete and Q235 steel are selected in the perforated steel plate reinforced concrete mode.
- (3)
Set constraints
Apply X-direction, Y-direction, and Z-direction displacement constraints to the model; this ensures that the displacement of the model in all directions is zero.
- (4)
Apply pull-out load
In the model, consider the actual stress condition of the perforated steel plate reinforced concrete specimens; the nodal load is applied to the perforated steel plate.
- (5)
Model of perforated steel plate reinforced concrete
The pull-out model includes two parts, i.e., the concrete model and the perforated steel plate model. The pull-out model of the perforated steel plate reinforced concrete is shown in
Figure 18.
4.4. Simulation of Perforated Steel Plate Reinforced Concrete under Pull-Out Force
- (1)
Numerical fitting of test
ANSYS finite element software is used to model and analyze the nine groups of test combinations selected by the orthogonal test method. See
Figure 19 and
Figure 20 for the strain and stress cloud diagram of the perforated steel plate reinforced concrete specimen.
- (2)
Results analysis of pull-out model of perforated steel plate reinforced concrete specimens
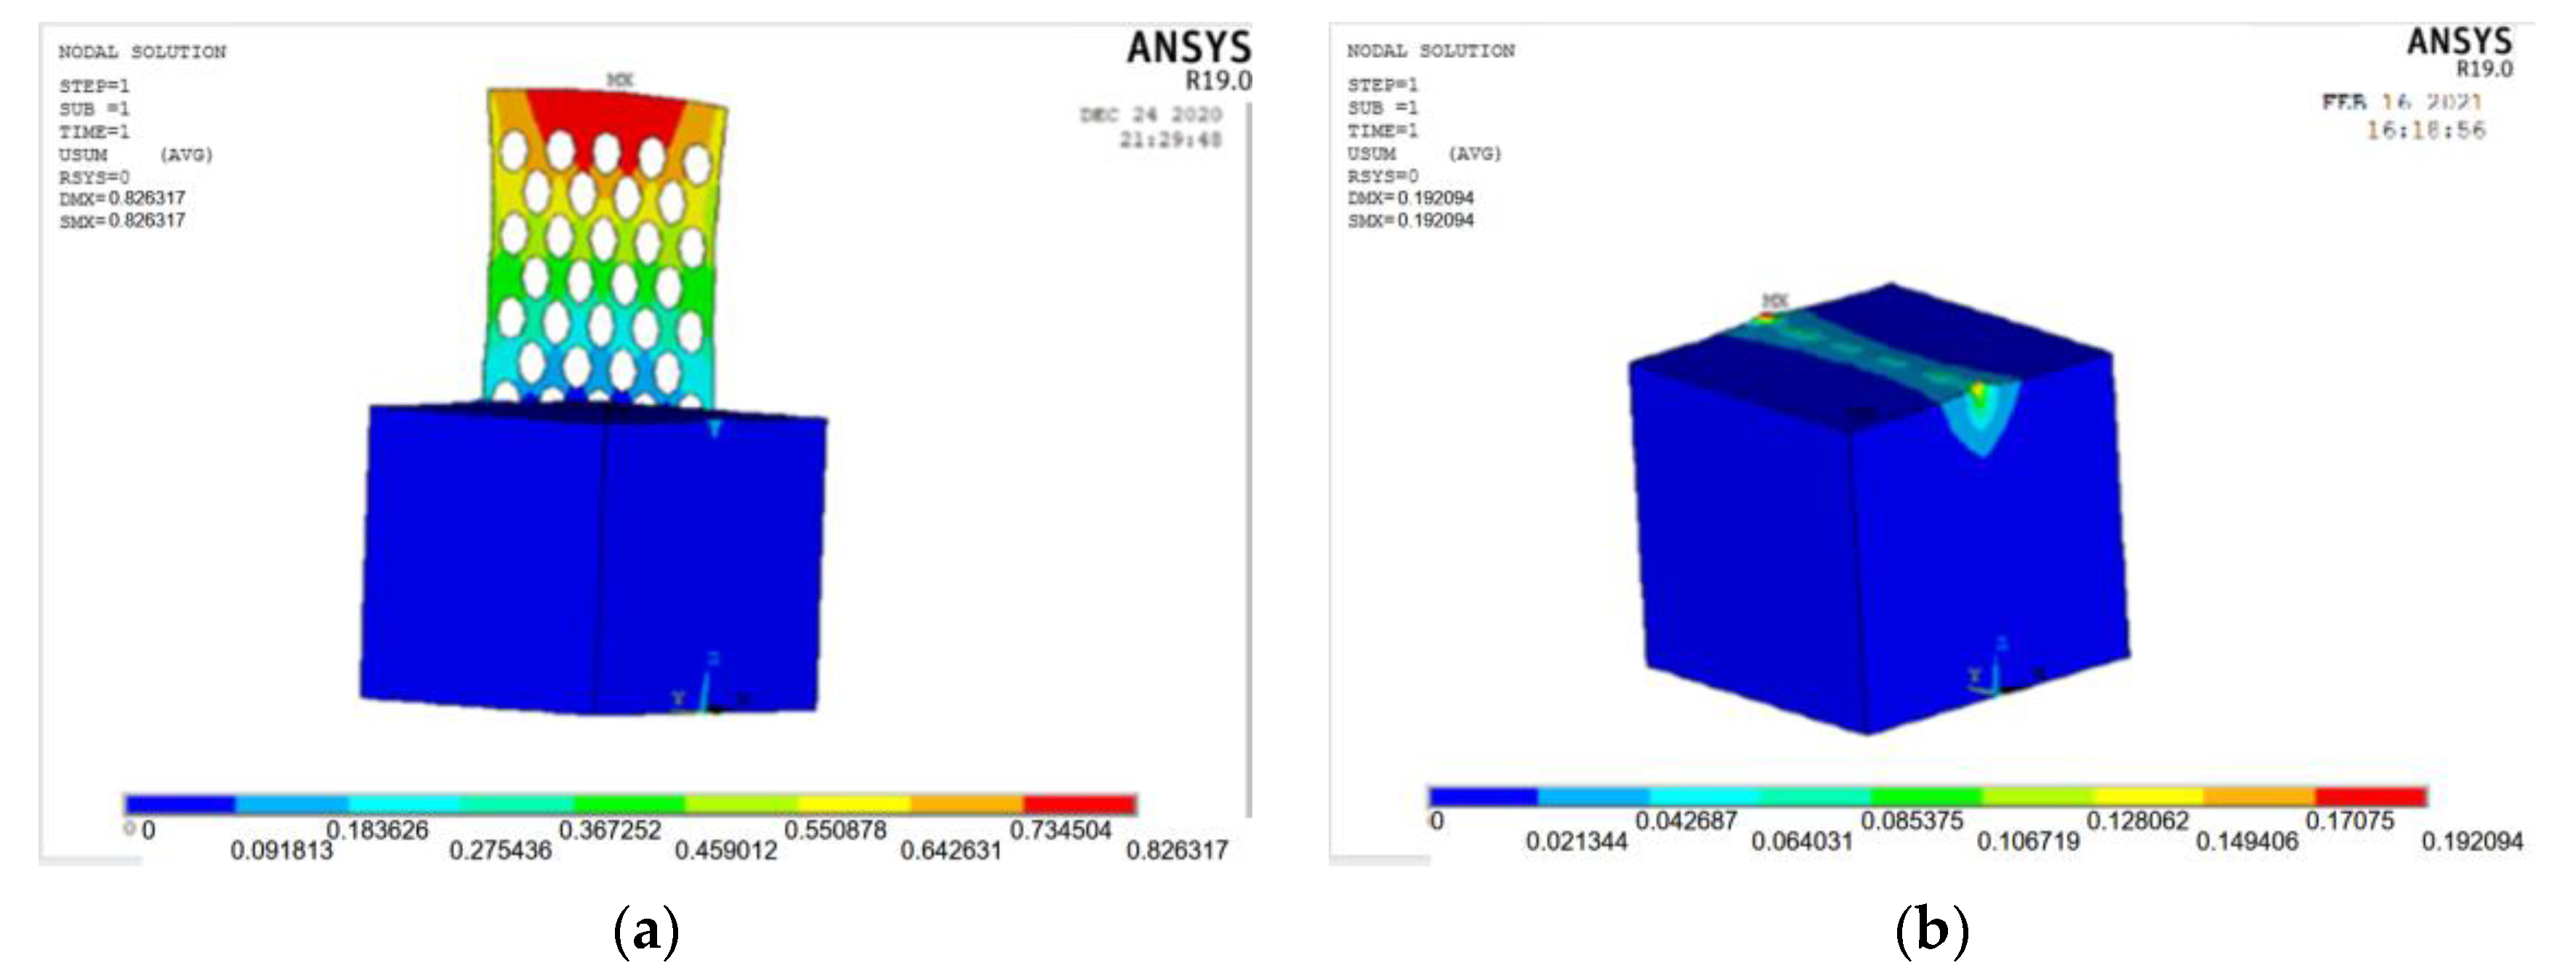
In order to make the pull-out model more authentic, a pull-out load of 20 KN is applied, the appropriate load steps are set, and the calculation results of each load step are recorded. The ultimate pull-out capacity that the model can bear is 15.82 KN. The overall strain cloud diagram of the perforated steel plate reinforced concrete specimens and the strain cloud diagram of the concrete are shown in
Figure 21a,b.
It can be seen from
Figure 21a,b that the perforated steel plate produces vertical deformation on its contact surface under the action of the pull-out load. The deformation of the perforated steel plate on both sides is greater than that in the middle. The concrete at the junction of the perforated steel plate is partially swelled due to the pull-out effect and the bonding effect of the perforated steel plate. In the pull test, the deformation of the perforated steel plate on both sides is slightly larger than that in the middle. Under the action of tensile stress, the concrete will break and produce small deformation, while the other parts of the concrete will not deform and will remain intact, which is consistent with the deformation in the model.
- (3)
Range analysis of influencing factors
The range analysis of the ultimate tensile bearing capacity of the perforated steel plate reinforced concrete is shown in
Table 9 [
40,
41,
42]. By comparing the range values corresponding to ki in the table, it can be obtained that in the perforated steel plate reinforced concrete pull-out test, the order of the influence of each factor is A > B > C, which means the impact factors from small to large are the spacing between the holes of the perforated steel plate, the hole diameter of the perforated steel plate, and the thickness. Because the range value between factors A and B is quite different from that of factor C, the hole spacing has a less significant influence on the ultimate bearing capacity of the perforated steel plate reinforced concrete. By comparing the ki corresponding to each factor, it can be concluded that the optimal levels of each factor are A3, B1, and C3; that is, the optimal combination is A3B1C3, indicating that the ultimate pull-out bearing capacity of the perforated steel plate reinforced concrete reaches the maximum value of 15.82 KN when the thickness of the perforated steel plate is 1.0 mm, the hole diameter is 15 mm, and the hole spacing is 15 mm.

 ,
, 


